Research Project Title Principle...
26
Research Project Title Field Performance of Sealers for Portland Cement Concrete Pavements (PCCP) Principle Investigators Wally Heyen NDOR-PCC Engineer Lieska Halsey NDOR-Assistant Concrete Engineer Investigation Collaborators Moe Jamshidi Former NDOR-Materials & Research Engineer Department of Roads Deputy Director Operations Jasmine Dondlinger NDOR-Highway Chemical Tests Manager Bob Seger NDOR Research-Chemist II
Transcript of Research Project Title Principle...

Research
Project Title Field Performance of Sealers for Portland Cement Concrete Pavements (PCCP)
Principle Investigators
Wally Heyen NDOR-PCC Engineer
Lieska Halsey
NDOR-Assistant Concrete Engineer
Investigation Collaborators
Moe Jamshidi Former NDOR-Materials & Research Engineer
Department of Roads Deputy Director Operations
Jasmine Dondlinger NDOR-Highway Chemical Tests Manager
Bob Seger
NDOR Research-Chemist II
2 | P a g e
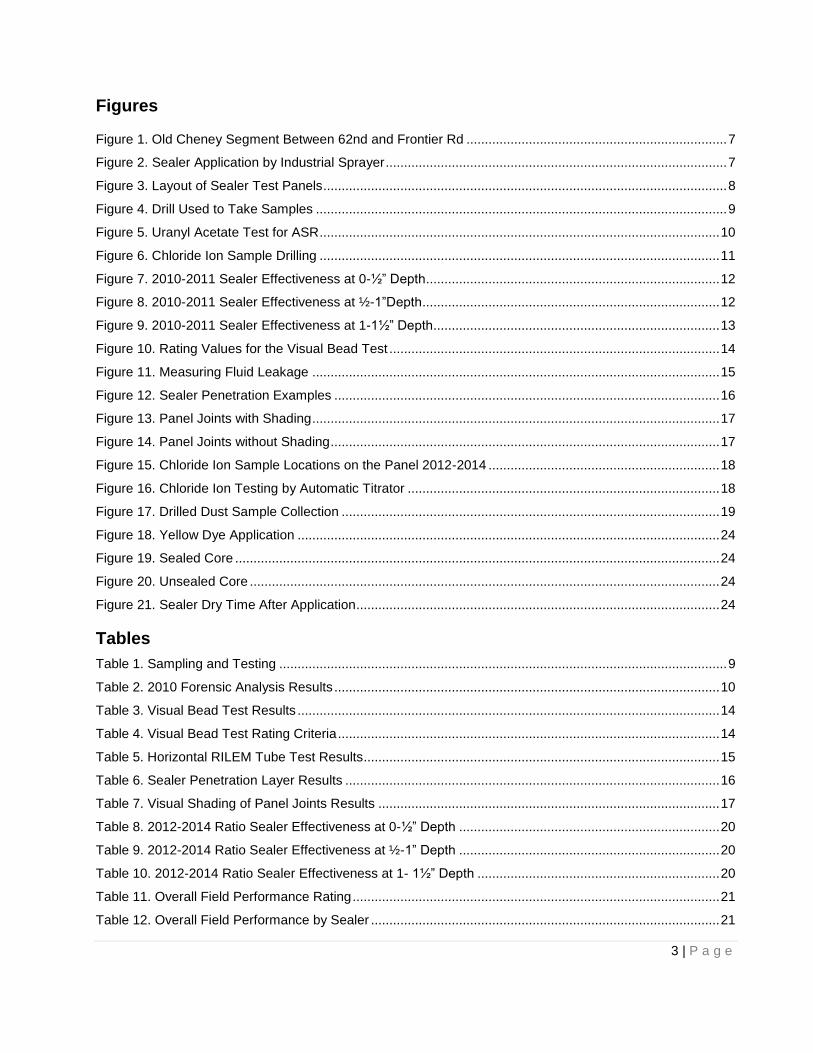
Table of Contents
Figures ............................................................................................................................................................... 3
Tables ................................................................................................................................................................. 3
Acknowledgments .............................................................................................................................................. 4
Abstract .............................................................................................................................................................. 5
Introduction......................................................................................................................................................... 6
Objective ............................................................................................................................................................ 6
Project Scope ..................................................................................................................................................... 6
Evaluation........................................................................................................................................................... 6
Sealers Evaluated .............................................................................................................................................. 6
Evaluation Plan .................................................................................................................................................. 9
Laboratory and Field-Testing ............................................................................................................................. 9
Preliminary Forensic Investigation Analysis ..................................................................................................... 10
Evaluation & Analysis 2010-2011 .................................................................................................................... 11
Chloride Ion ...................................................................................................................................................... 11
2010-2011 Chloride Ion Results............................................................................................................... 12
2010-2011 Data Discussion ..................................................................................................................... 13
Evaluation & Analysis 2012-2014 .................................................................................................................... 13
Visual Bead Test ...................................................................................................................................... 14
Horizontal RILEM Tube Test .................................................................................................................... 15
Sealer Penetration Test ........................................................................................................................... 16
Visual Shading of Panel Joints................................................................................................................. 17
Chloride Ion Penetration 2012-2014 ................................................................................................................ 18
Sample Collection Modification ................................................................................................................ 18
NDR T 260 Modification ........................................................................................................................... 18
Chloride Ion Sample Preparation Modification ......................................................................................... 18
Chloride Ion Data Discussion ........................................................................................................................... 19
Chloride Ion 2012-2014 Analysis ............................................................................................................. 21
Sealer Field Performance Analysis .................................................................................................................. 21
Sealer Field Performance Summary ................................................................................................................ 22
NDOR Applications & Specification ................................................................................................................. 23
Yellow Dye (Sodium Fluorescein) .................................................................................................................... 24
Application Concerns ....................................................................................................................................... 24
References ....................................................................................................................................................... 26
3 | P a g e
Figures
Figure 1. Old Cheney Segment Between 62nd and Frontier Rd ....................................................................... 7
Figure 2. Sealer Application by Industrial Sprayer ............................................................................................. 7
Figure 3. Layout of Sealer Test Panels .............................................................................................................. 8
Figure 4. Drill Used to Take Samples ................................................................................................................ 9
Figure 5. Uranyl Acetate Test for ASR ............................................................................................................. 10
Figure 6. Chloride Ion Sample Drilling ............................................................................................................. 11
Figure 7. 2010-2011 Sealer Effectiveness at 0-½” Depth ................................................................................ 12
Figure 8. 2010-2011 Sealer Effectiveness at ½-1”Depth ................................................................................. 12
Figure 9. 2010-2011 Sealer Effectiveness at 1-1½” Depth .............................................................................. 13
Figure 10. Rating Values for the Visual Bead Test .......................................................................................... 14
Figure 11. Measuring Fluid Leakage ............................................................................................................... 15
Figure 12. Sealer Penetration Examples ......................................................................................................... 16
Figure 13. Panel Joints with Shading ............................................................................................................... 17
Figure 14. Panel Joints without Shading .......................................................................................................... 17
Figure 15. Chloride Ion Sample Locations on the Panel 2012-2014 ............................................................... 18
Figure 16. Chloride Ion Testing by Automatic Titrator ..................................................................................... 18
Figure 17. Drilled Dust Sample Collection ....................................................................................................... 19
Figure 18. Yellow Dye Application ................................................................................................................... 24
Figure 19. Sealed Core .................................................................................................................................... 24
Figure 20. Unsealed Core ................................................................................................................................ 24
Figure 21. Sealer Dry Time After Application ................................................................................................... 24
Tables
Table 1. Sampling and Testing .......................................................................................................................... 9
Table 2. 2010 Forensic Analysis Results ......................................................................................................... 10
Table 3. Visual Bead Test Results ................................................................................................................... 14
Table 4. Visual Bead Test Rating Criteria ........................................................................................................ 14
Table 5. Horizontal RILEM Tube Test Results ................................................................................................. 15
Table 6. Sealer Penetration Layer Results ...................................................................................................... 16
Table 7. Visual Shading of Panel Joints Results ............................................................................................. 17
Table 8. 2012-2014 Ratio Sealer Effectiveness at 0-½” Depth ....................................................................... 20
Table 9. 2012-2014 Ratio Sealer Effectiveness at ½-1” Depth ....................................................................... 20
Table 10. 2012-2014 Ratio Sealer Effectiveness at 1- 1½” Depth .................................................................. 20
Table 11. Overall Field Performance Rating .................................................................................................... 21
Table 12. Overall Field Performance by Sealer ............................................................................................... 21
4 | P a g e
Acknowledgments
The research team would like to give special thanks to the investigation’s collaborators for their support during this project. Special thanks to Moe Jamshidi of NDOR and Kelly Sieckmeyer of Traffic Operations of the City of Lincoln. In addition, distinct thanks to Tim Kason, Jared Rockemann, Tom Gernert, Bryce Helms, Mike Ondrak, Deb Swanson, Kim Jirkovsky, Scott Waddle and the rest of the NDOR coring crew. Thanks given to Jeremy Weigel and Josh Kalin, for their diligence in working through severe coring for the last five years to provide over a thousand pavement drill cores for this project. Without their help, this research project would not have been possible.
Furthermore, the research team would also like to acknowledge, with much appreciation, the crucial role of Jasmine Dondlinger, who invested so much time training her staff to test with proficiency using the required equipment and materials to complete over four thousand chloride ion analyses. Special thanks go to Maria Olomi, Zoya Wehland, Autum Longo, Starr Evans, and Bob Seger, who performed all the tedious chloride ion testing. In addition, many thanks go to the head of the project, Wally Heyen, who invested his full effort in guiding the team in achieving its goals.
The research team would like to extend their appreciation to all suppliers participating in this research investigation and for their contributions with materials to be use in this investigation.
5 | P a g e
Abstract
Alkali-Silica Reaction (ASR) is a common cause for early deterioration of concrete pavements. The reaction produces a gel that will absorb water and expand, which can cause cracks in concrete pavements. The reaction is usually mitigated with supplemental cementitious materials (SCMs). In 2010, the Nebraska Department of Roads (NDOR), in cooperation with the City of Lincoln, launched this investigation in order to prevent deterioration to those pavements that did not contain SCMs to mitigate ASR. NDOR occasionally uses concrete sealers in bridge deck applications to prevent moisture penetration, but not previously for concrete pavements.
The objective of this investigation was to evaluate the ability of sealers to prevent moisture penetration into concrete pavements as a preventative maintenance tool to mitigate concrete expansion due to ASR.
The evaluation was completed using multiple methods; measurement of chloride ion content in the concrete, water resistance of concrete surfaces and cores, and visual inspection of treated and untreated pavement surfaces.
Seven sealers were initially evaluated using sealer performance methods to review and rank sealers in terms of their expected performance. The main characteristics of the sealers evaluated in the lab and field were recorded and divided into a variety of categories. These include the Visual Bead Test, Horizontal RILEM Tube Test, the Sealer Penetration Test, and Visual Shading of Panel Joints. The sealers were assigned a rating between 0.0 and 2.0 in each category; these ratings were based on the established criteria with a value of 0.0 indicating a low performance, a value of 1.0 indicating medium performance, and a value of 2.0 indicating high performance.
When comparing the laboratory and field tests performed in this study, the following were concluded;
100% and 40% Silane Solvent-based exhibited consistently high performance throughout all the tests and offered the best protection against chloride ion intrusion.
40% Water-Based Silane and Blend of Lithium and Silane/Siloxane exhibited medium performance.
Waterborne Silane-Siloxane Based and the Acrylic Based Polymer exhibited lowest performance.
The major finding during this study was the depth of penetration by coring which resulted in a very effective tool for screening the sealers depth of penetration. Chloride ion content measurements proved inconclusive and a poor indicator of sealer performance. Water resistance observations were found to be consistent and indicative of sealer performance.
6 | P a g e
Introduction
In 2010, the Nebraska Department of Roads (NDOR) began to explore various sealer applications for pavements that did not mitigate Alkali-Silica Reaction (ASR). NDOR, in cooperation with the City of Lincoln, launched this investigation in order to prevent deterioration to those pavements that did not contain supplemental cementitious materials (SCMs) to mitigate ASR. NDOR occasionally uses concrete sealers in bridge deck applications; however, not for concrete pavements. This investigation evaluated if concrete sealers may be used in the future as a preventative maintenance tool in delaying deterioration of pavements exposed to ASR. The most common concrete sealers are film formers, such as acrylics and thermoplastics; and penetrating sealers, including silicones, siloxanes, silanes, silicates. This investigation included all of these common concrete sealer types.
Objective
The objective of this investigation was to evaluate the performance of sealers in preventing moisture penetration into concrete pavements as a preventative maintenance tool to mitigate concrete expansion due to ASR.
Project Scope
Evaluate and test seven concrete sealers in a PCC pavement application.
Determine the effect of sealers in delaying ASR deteriorations.
Determine how long the sealer could provide protection in a heavy traffic surface, such as concrete pavement
Evaluation
This evaluation was based on a road segment of Old Cheney between 62nd
St. and Frontier Rd., in Lincoln, Nebraska. It was built in 2002 and was eight years old at the time of the sealer application. Since this section was built without SCMs to mitigate ASR, this segment was a good candidate for the four-year evaluation. The evaluation consisted of sections of untreated control panels adjacent to sections of sealer treated panels. All sealers were applied per the manufacturer recommendations.
Sealers Evaluated
In order to assess the performance and effectiveness of sealers for delaying ASR, NDOR analyzed seven different concrete sealers. The following are the sealers used in this study:
100% acrylic polymer
100% waterborne Silane/siloxane with high solids
100% waterborne Silane/siloxane
40% Silane solvent/based
40% Silane water/based
100% Silane solvent-based
Lithium & Silane/Siloxane blend
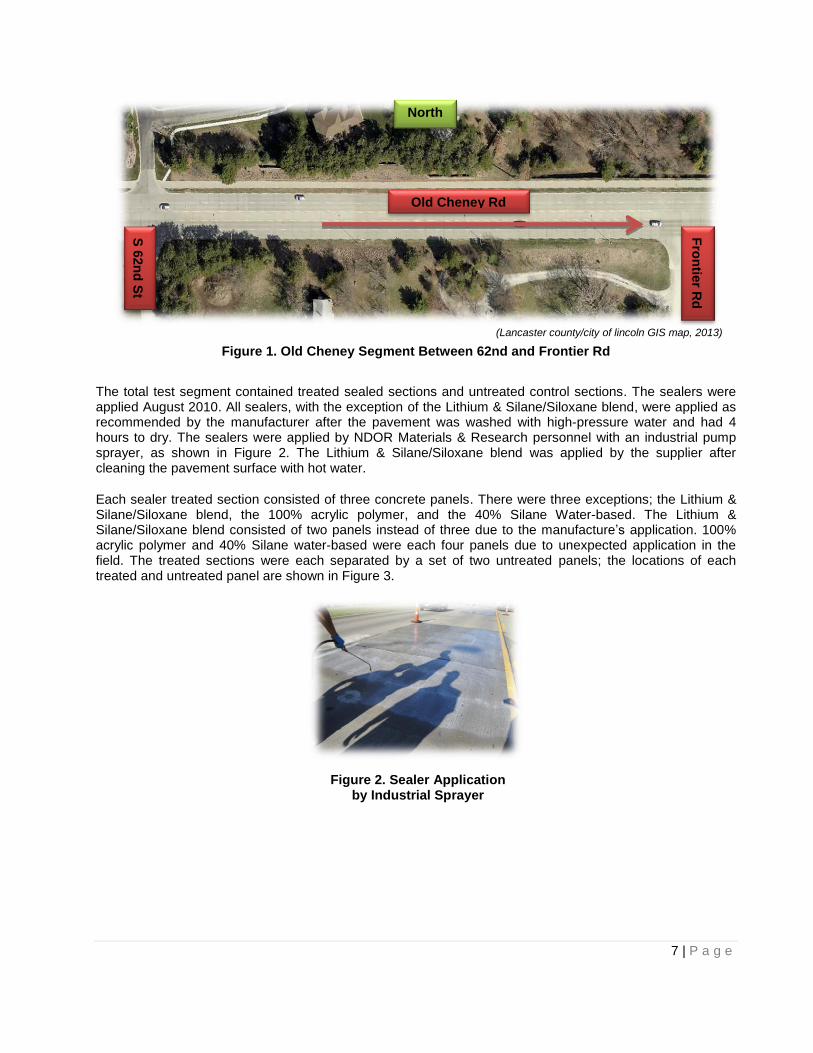
Figure 1 shows the Segment of Old Cheney Rd. between 62nd
St. and Frontier Rd containing the test segment of sealer treatments.
7 | P a g e
The total test segment contained treated sealed sections and untreated control sections. The sealers were applied August 2010. All sealers, with the exception of the Lithium & Silane/Siloxane blend, were applied as recommended by the manufacturer after the pavement was washed with high-pressure water and had 4 hours to dry. The sealers were applied by NDOR Materials & Research personnel with an industrial pump sprayer, as shown in Figure 2. The Lithium & Silane/Siloxane blend was applied by the supplier after cleaning the pavement surface with hot water.
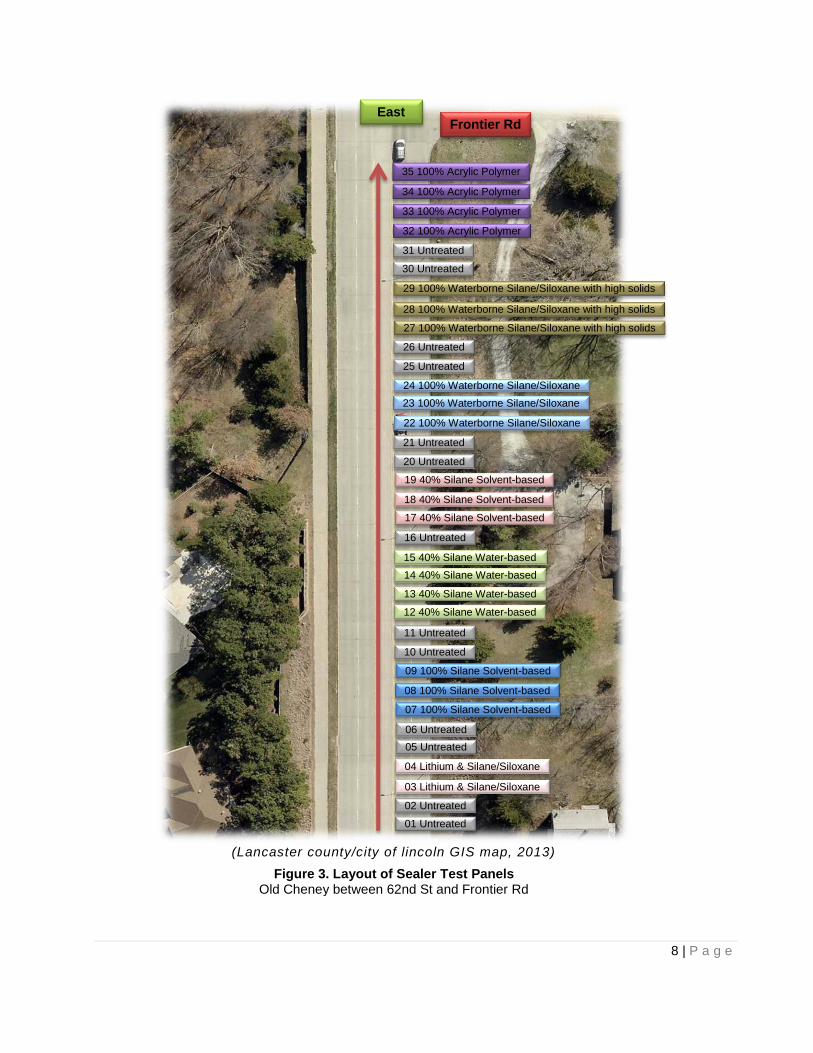
Each sealer treated section consisted of three concrete panels. There were three exceptions; the Lithium & Silane/Siloxane blend, the 100% acrylic polymer, and the 40% Silane Water-based. The Lithium & Silane/Siloxane blend consisted of two panels instead of three due to the manufacture’s application. 100% acrylic polymer and 40% Silane water-based were each four panels due to unexpected application in the field. The treated sections were each separated by a set of two untreated panels; the locations of each treated and untreated panel are shown in Figure 3.
Figure 1. Old Cheney Segment Between 62nd and Frontier Rd
Old Cheney Rd
Fro
ntie
r Rd
S 6
2n
d S
t
North
(Lancaster county/city of lincoln GIS map, 2013)
Figure 2. Sealer Application by Industrial Sprayer
8 | P a g e
Figure 3. Layout of Sealer Test Panels Old Cheney between 62nd St and Frontier Rd
08 100% Silane Solvent-based
17 40% Silane Solvent-based
11 Untreated
34 100% Acrylic Polymer
33 100% Acrylic Polymer
32 100% Acrylic Polymer
31 Untreated
30 Untreated
29 100% Waterborne Silane/Siloxane with high solids
28 100% Waterborne Silane/Siloxane with high solids
27 100% Waterborne Silane/Siloxane with high solids
26 Untreated
25 Untreated
24 100% Waterborne Silane/Siloxane
23 100% Waterborne Silane/Siloxane
22 100% Waterborne Silane/Siloxane
21 Untreated
19 40% Silane Solvent-based
18 40% Silane Solvent-based
16 Untreated
20 Untreated
15 40% Silane Water-based
14 40% Silane Water-based
13 40% Silane Water-based
12 40% Silane Water-based
10 Untreated
09 100% Silane Solvent-based
07 100% Silane Solvent-based
06 Untreated
05 Untreated
04 Lithium & Silane/Siloxane
03 Lithium & Silane/Siloxane
02 Untreated
01 Untreated
East
35 100% Acrylic Polymer
Frontier Rd
(Lancaster county/city of lincoln GIS map, 2013)
9 | P a g e
Evaluation Plan
Laboratory and Field-Testing The laboratory tests were based on the following test methods for preliminary analysis of the concrete pavement.
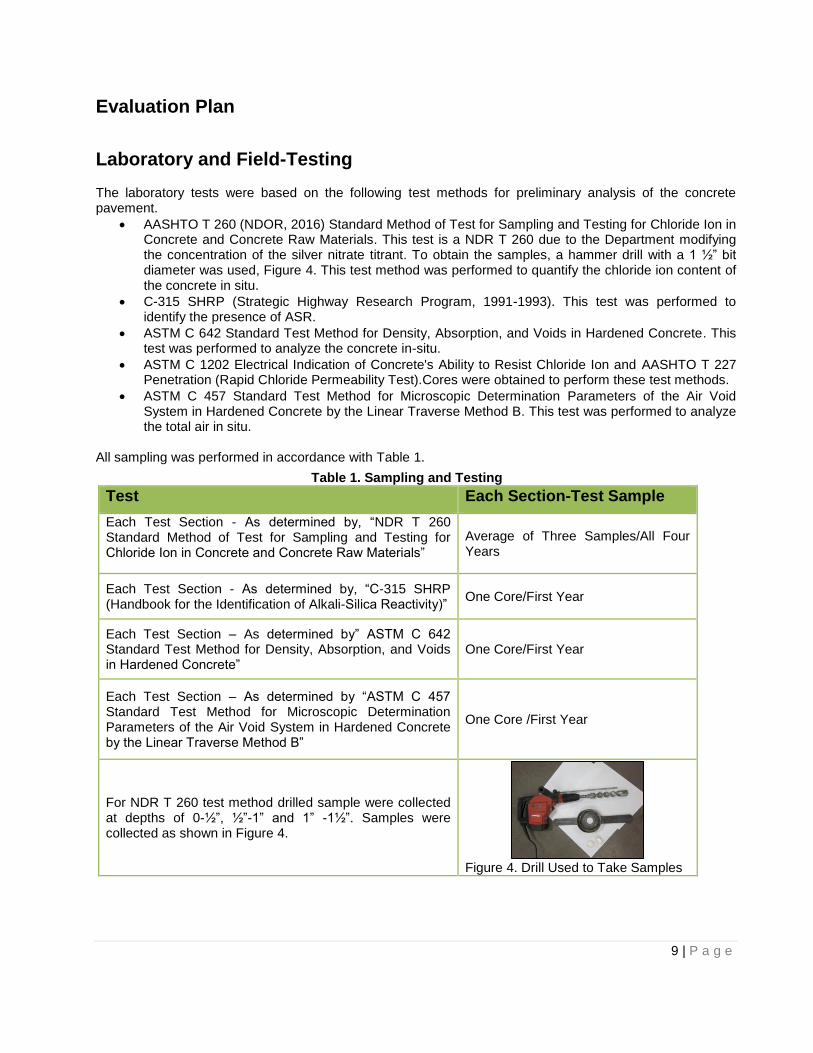
AASHTO T 260 (NDOR, 2016) Standard Method of Test for Sampling and Testing for Chloride Ion in Concrete and Concrete Raw Materials. This test is a NDR T 260 due to the Department modifying the concentration of the silver nitrate titrant. To obtain the samples, a hammer drill with a 1 ½” bit diameter was used, Figure 4. This test method was performed to quantify the chloride ion content of the concrete in situ.
C-315 SHRP (Strategic Highway Research Program, 1991-1993). This test was performed to identify the presence of ASR.
ASTM C 642 Standard Test Method for Density, Absorption, and Voids in Hardened Concrete. This test was performed to analyze the concrete in-situ.
ASTM C 1202 Electrical Indication of Concrete's Ability to Resist Chloride Ion and AASHTO T 227 Penetration (Rapid Chloride Permeability Test).Cores were obtained to perform these test methods.
ASTM C 457 Standard Test Method for Microscopic Determination Parameters of the Air Void System in Hardened Concrete by the Linear Traverse Method B. This test was performed to analyze the total air in situ.
All sampling was performed in accordance with Table 1.
Table 1. Sampling and Testing
Test Each Section-Test Sample
Each Test Section - As determined by, “NDR T 260 Standard Method of Test for Sampling and Testing for Chloride Ion in Concrete and Concrete Raw Materials”
Average of Three Samples/All Four Years
Each Test Section - As determined by, “C-315 SHRP (Handbook for the Identification of Alkali-Silica Reactivity)”
One Core/First Year
Each Test Section – As determined by” ASTM C 642 Standard Test Method for Density, Absorption, and Voids in Hardened Concrete”
One Core/First Year
Each Test Section – As determined by “ASTM C 457 Standard Test Method for Microscopic Determination Parameters of the Air Void System in Hardened Concrete by the Linear Traverse Method B”
One Core /First Year
For NDR T 260 test method drilled sample were collected at depths of 0-½”, ½”-1” and 1” -1½”. Samples were collected as shown in Figure 4.
Figure 4. Drill Used to Take Samples
10 | P a g e
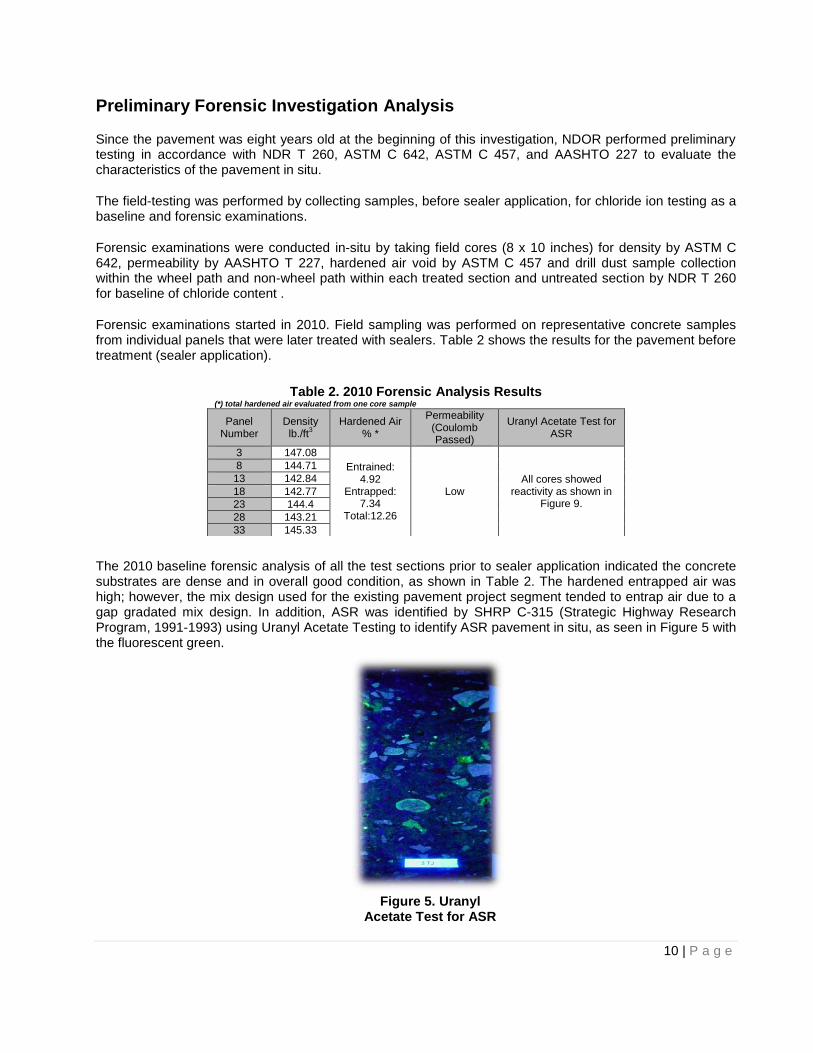
Figure 5. Uranyl Acetate Test for ASR
Preliminary Forensic Investigation Analysis
Since the pavement was eight years old at the beginning of this investigation, NDOR performed preliminary testing in accordance with NDR T 260, ASTM C 642, ASTM C 457, and AASHTO 227 to evaluate the characteristics of the pavement in situ.
The field-testing was performed by collecting samples, before sealer application, for chloride ion testing as a baseline and forensic examinations.
Forensic examinations were conducted in-situ by taking field cores (8 x 10 inches) for density by ASTM C 642, permeability by AASHTO T 227, hardened air void by ASTM C 457 and drill dust sample collection within the wheel path and non-wheel path within each treated section and untreated section by NDR T 260 for baseline of chloride content .
Forensic examinations started in 2010. Field sampling was performed on representative concrete samples from individual panels that were later treated with sealers. Table 2 shows the results for the pavement before treatment (sealer application).
The 2010 baseline forensic analysis of all the test sections prior to sealer application indicated the concrete substrates are dense and in overall good condition, as shown in Table 2. The hardened entrapped air was high; however, the mix design used for the existing pavement project segment tended to entrap air due to a gap gradated mix design. In addition, ASR was identified by SHRP C-315 (Strategic Highway Research Program, 1991-1993) using Uranyl Acetate Testing to identify ASR pavement in situ, as seen in Figure 5 with the fluorescent green.
Table 2. 2010 Forensic Analysis Results (*) total hardened air evaluated from one core sample
Panel Number
Density lb./ft
3
Hardened Air % *
Permeability (Coulomb Passed)
Uranyl Acetate Test for ASR
3 147.08
Entrained: 4.92
Entrapped: 7.34
Total:12.26
Low All cores showed
reactivity as shown in Figure 9.
8 144.71
13 142.84
18 142.77
23 144.4
28 143.21
33 145.33
11 | P a g e
Evaluation & Analysis 2010-2011
Chloride Ion
The samples for chloride ion analysis were collected annually at increments of one-half inch from the joint. All the drilled samples were tested according to NDR T 260. For the purpose of this study, the effectiveness of each sealer was evaluated based on the performance in preventing the penetration of chloride ions contributed by the deicing chemicals used in winter maintenance operations. The effectiveness of the sealers was calculated as shown in Equation 1.
Equation 1. Sealer Effectiveness
Sampling was performed in accordance with Table 1. All samples collected from the segment were labeled as shown in Figure 3.
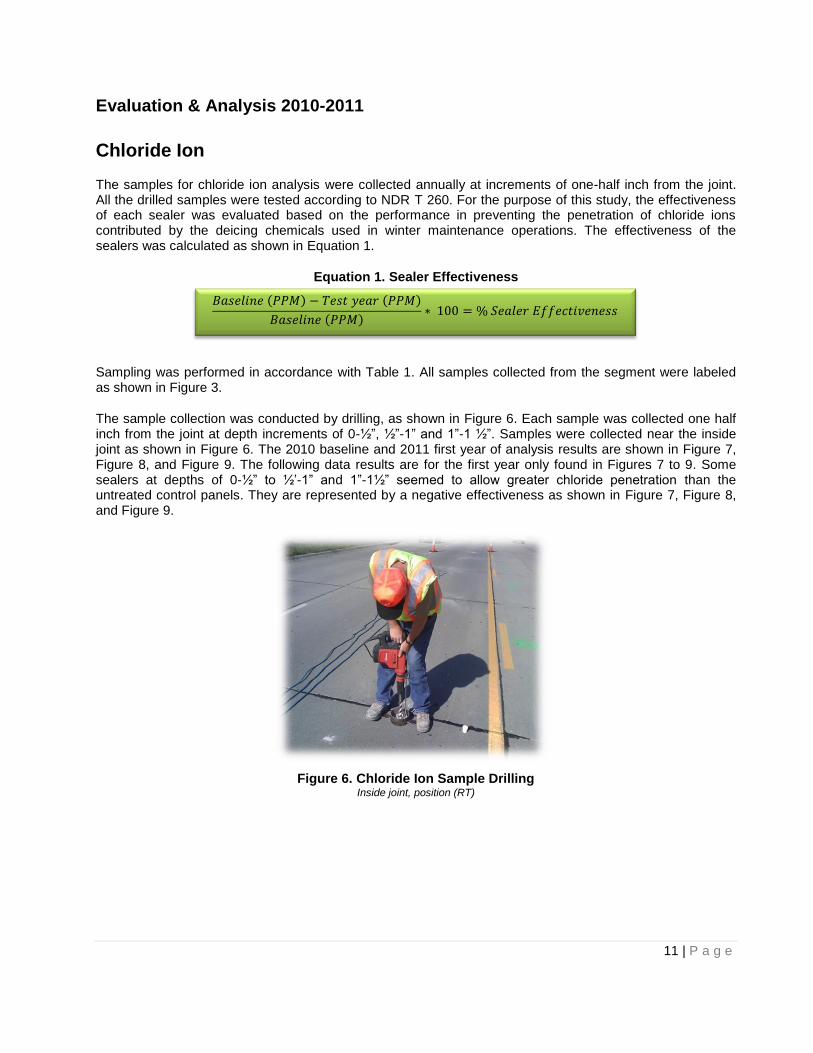
The sample collection was conducted by drilling, as shown in Figure 6. Each sample was collected one half inch from the joint at depth increments of 0-½”, ½”-1” and 1”-1 ½”. Samples were collected near the inside joint as shown in Figure 6. The 2010 baseline and 2011 first year of analysis results are shown in Figure 7, Figure 8, and Figure 9. The following data results are for the first year only found in Figures 7 to 9. Some sealers at depths of 0-½” to ½’-1” and 1”-1½” seemed to allow greater chloride penetration than the untreated control panels. They are represented by a negative effectiveness as shown in Figure 7, Figure 8, and Figure 9.
𝐵𝑎𝑠𝑒𝑙𝑖𝑛𝑒 𝑃𝑃𝑀 − 𝑇𝑒𝑠𝑡 𝑦𝑒𝑎𝑟 𝑃𝑃𝑀
𝐵𝑎𝑠𝑒𝑙𝑖𝑛𝑒 𝑃𝑃𝑀 ∗ 100 = % 𝑆𝑒𝑎𝑙𝑒𝑟 𝐸𝑓𝑓𝑒𝑐𝑡𝑖𝑣𝑒𝑛𝑒𝑠𝑠
Figure 6. Chloride Ion Sample Drilling Inside joint, position (RT)

12 | P a g e
2010-2011 Chloride Ion Results
Figure 7. 2010-2011 Sealer Effectiveness at 0-½” Depth
Figure 8. 2010-2011 Sealer Effectiveness at ½-1”Depth
100% Acrylic Polymer, 12.22
100% Waterborne Silane/Siloxane, 4.22
100% Waterborne Silane/Siloxane, 8.37
40% Silane Solvent-based, 18.3
40% Silane Water-based, 23.84
100% Silane Solvent-based, 8.34
Lithium & Silane/Siloxane, 19.63
0.00 5.00 10.00 15.00 20.00 25.00
Percent effectiveness after one year (0-1/2 inch depth)
Untreated panels average effectiveness 7.59%
100% Acrylic Polymer, -5.5
100% Waterborne Silane/Siloxane, -4.3
100% Waterborne Silane/Siloxane, 10.34
40% Silane Solvent-based, 14.19
40% Silane Water-based, 13.85
100% Silane Solvent-based, 40.65
Lithium & Silane/Siloxane, 27.61
-10.00 0.00 10.00 20.00 30.00 40.00 50.00
Percent effectiveness after one year (1/2-1 inch depth)
Untreated panels average effectiveness 17.59%
Figure 7 shows the effectiveness of the sealers at the 0–½” depth. The red line
shows the untreated effectiveness baseline. With the exception of the 100% waterborne Silane/Siloxane with
high solids, all sealers showed effectiveness
greater than the untreated baseline.
Figure 8 shows the effectiveness of the sealers at the ½-1” depth. The red line
shows the untreated effectiveness baseline.
The 100% Silane Solvent/based and
Lithium & Silane/Siloxane were the only sealers with
effectivenesses greater than the untreated
baseline.
13 | P a g e
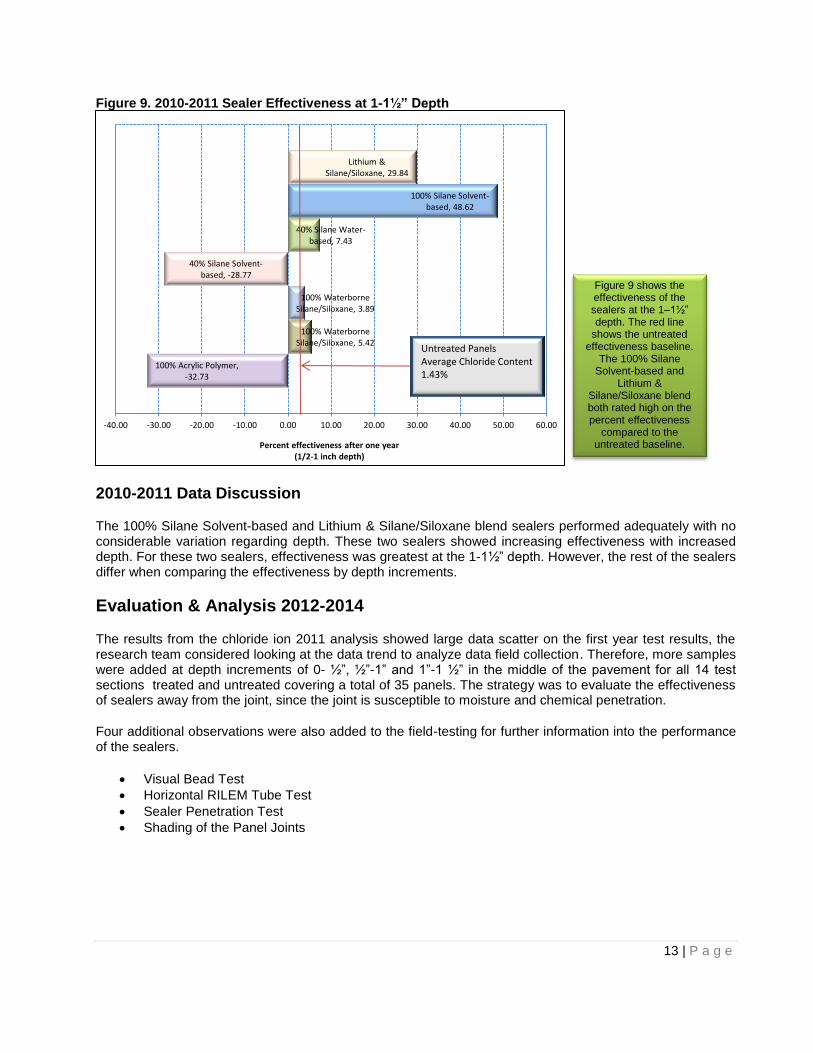
Figure 9. 2010-2011 Sealer Effectiveness at 1-1½” Depth
2010-2011 Data Discussion
The 100% Silane Solvent-based and Lithium & Silane/Siloxane blend sealers performed adequately with no considerable variation regarding depth. These two sealers showed increasing effectiveness with increased depth. For these two sealers, effectiveness was greatest at the 1-1½” depth. However, the rest of the sealers differ when comparing the effectiveness by depth increments.
Evaluation & Analysis 2012-2014
The results from the chloride ion 2011 analysis showed large data scatter on the first year test results, the research team considered looking at the data trend to analyze data field collection. Therefore, more samples were added at depth increments of 0- ½”, ½”-1” and 1”-1 ½” in the middle of the pavement for all 14 test sections treated and untreated covering a total of 35 panels. The strategy was to evaluate the effectiveness of sealers away from the joint, since the joint is susceptible to moisture and chemical penetration.
Four additional observations were also added to the field-testing for further information into the performance of the sealers.
Visual Bead Test
Horizontal RILEM Tube Test
Sealer Penetration Test
Shading of the Panel Joints
100% Acrylic Polymer, -32.73
100% Waterborne Silane/Siloxane, 5.42
100% Waterborne Silane/Siloxane, 3.89
40% Silane Solvent-based, -28.77
40% Silane Water-based, 7.43
100% Silane Solvent-based, 48.62
Lithium & Silane/Siloxane, 29.84
-40.00 -30.00 -20.00 -10.00 0.00 10.00 20.00 30.00 40.00 50.00 60.00
Percent effectiveness after one year (1/2-1 inch depth)
Untreated Panels Average Chloride Content 1.43%
Figure 9 shows the effectiveness of the sealers at the 1–1½” depth. The red line
shows the untreated effectiveness baseline.
The 100% Silane Solvent-based and
Lithium & Silane/Siloxane blend both rated high on the percent effectiveness
compared to the untreated baseline.
14 | P a g e
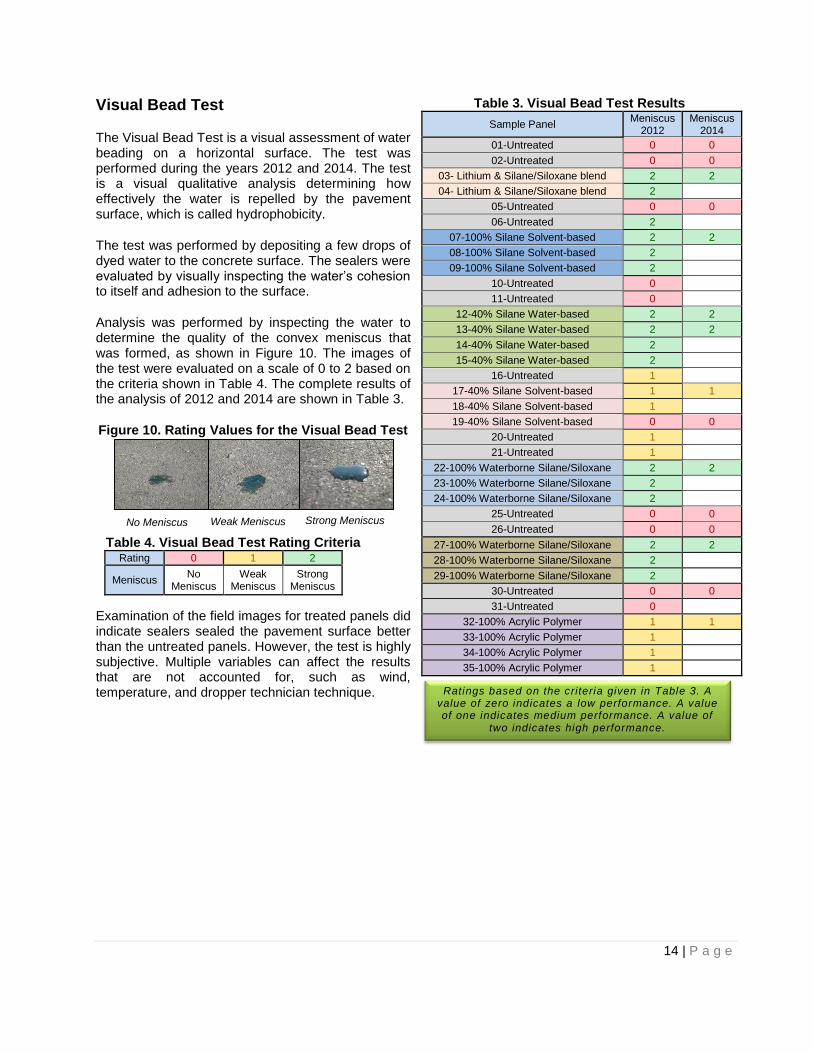
Ratings based on the criteria given in Table 3. A value of zero indicates a low performance. A value of one indicates medium performance. A value of
two indicates high performance.
Visual Bead Test
The Visual Bead Test is a visual assessment of water beading on a horizontal surface. The test was performed during the years 2012 and 2014. The test is a visual qualitative analysis determining how effectively the water is repelled by the pavement surface, which is called hydrophobicity.
The test was performed by depositing a few drops of dyed water to the concrete surface. The sealers were evaluated by visually inspecting the water’s cohesion to itself and adhesion to the surface.
Analysis was performed by inspecting the water to determine the quality of the convex meniscus that was formed, as shown in Figure 10. The images of the test were evaluated on a scale of 0 to 2 based on the criteria shown in Table 4. The complete results of the analysis of 2012 and 2014 are shown in Table 3.
Figure 10. Rating Values for the Visual Bead Test
Examination of the field images for treated panels did indicate sealers sealed the pavement surface better than the untreated panels. However, the test is highly subjective. Multiple variables can affect the results that are not accounted for, such as wind, temperature, and dropper technician technique.
Table 4. Visual Bead Test Rating Criteria Rating 0 1 2
Meniscus No
Meniscus Weak
Meniscus Strong
Meniscus
No Meniscus Weak Meniscus
Strong Meniscus
Table 3. Visual Bead Test Results
Sample Panel Meniscus
2012 Meniscus
2014
01-Untreated 0 0
02-Untreated 0 0
03- Lithium & Silane/Siloxane blend 2 2
04- Lithium & Silane/Siloxane blend 2
05-Untreated 0 0
06-Untreated 2
07-100% Silane Solvent-based 2 2
08-100% Silane Solvent-based 2
09-100% Silane Solvent-based 2
10-Untreated 0
11-Untreated 0
12-40% Silane Water-based 2 2
13-40% Silane Water-based 2 2
14-40% Silane Water-based 2
15-40% Silane Water-based 2
16-Untreated 1
17-40% Silane Solvent-based 1 1
18-40% Silane Solvent-based 1
19-40% Silane Solvent-based 0 0
20-Untreated 1
21-Untreated 1
22-100% Waterborne Silane/Siloxane 2 2
23-100% Waterborne Silane/Siloxane 2
24-100% Waterborne Silane/Siloxane 2
25-Untreated 0 0
26-Untreated 0 0
27-100% Waterborne Silane/Siloxane 2 2
28-100% Waterborne Silane/Siloxane 2
29-100% Waterborne Silane/Siloxane 2
30-Untreated 0 0
31-Untreated 0
32-100% Acrylic Polymer 1 1
33-100% Acrylic Polymer 1
34-100% Acrylic Polymer 1
35-100% Acrylic Polymer 1
15 | P a g e
Horizontal RILEM Tube Test
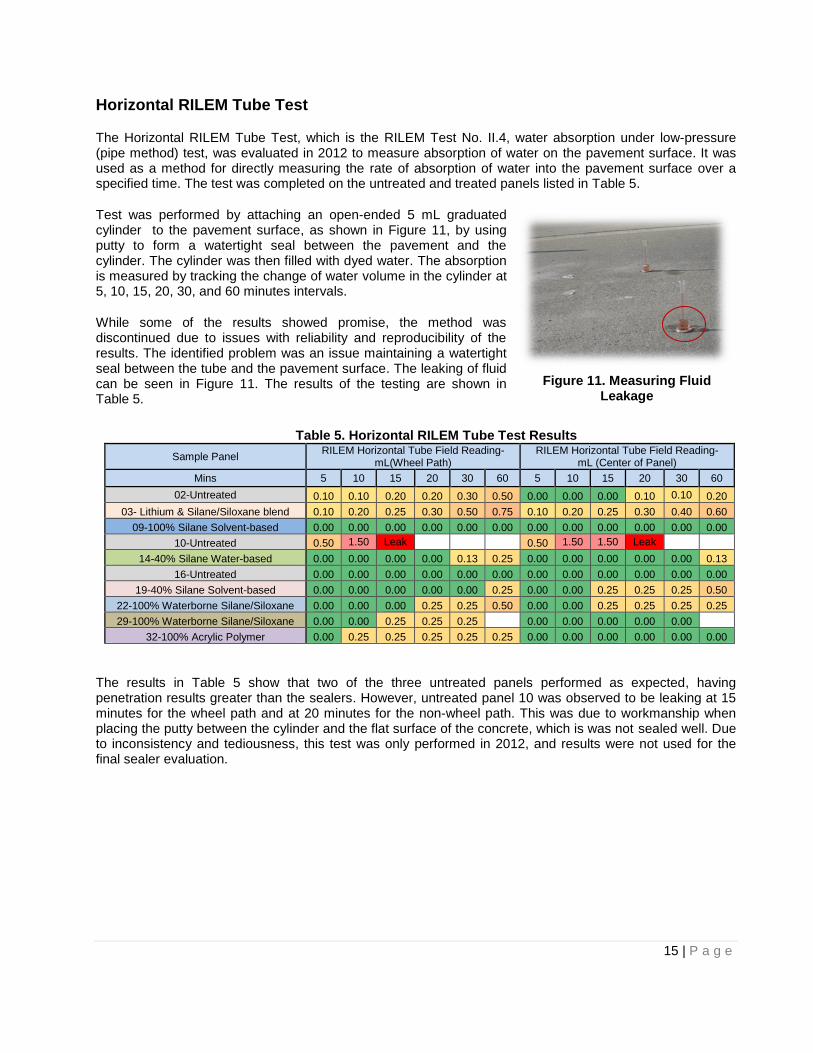
The Horizontal RILEM Tube Test, which is the RILEM Test No. II.4, water absorption under low-pressure (pipe method) test, was evaluated in 2012 to measure absorption of water on the pavement surface. It was used as a method for directly measuring the rate of absorption of water into the pavement surface over a specified time. The test was completed on the untreated and treated panels listed in Table 5.
Test was performed by attaching an open-ended 5 mL graduated cylinder to the pavement surface, as shown in Figure 11, by using putty to form a watertight seal between the pavement and the cylinder. The cylinder was then filled with dyed water. The absorption is measured by tracking the change of water volume in the cylinder at 5, 10, 15, 20, 30, and 60 minutes intervals.
While some of the results showed promise, the method was discontinued due to issues with reliability and reproducibility of the results. The identified problem was an issue maintaining a watertight seal between the tube and the pavement surface. The leaking of fluid can be seen in Figure 11. The results of the testing are shown in Table 5.
The results in Table 5 show that two of the three untreated panels performed as expected, having penetration results greater than the sealers. However, untreated panel 10 was observed to be leaking at 15 minutes for the wheel path and at 20 minutes for the non-wheel path. This was due to workmanship when placing the putty between the cylinder and the flat surface of the concrete, which is was not sealed well. Due to inconsistency and tediousness, this test was only performed in 2012, and results were not used for the final sealer evaluation.
Table 5. Horizontal RILEM Tube Test Results
Sample Panel RILEM Horizontal Tube Field Reading-
mL(Wheel Path) RILEM Horizontal Tube Field Reading-
mL (Center of Panel)
Mins 5 10 15 20 30 60 5 10 15 20 30 60
02-Untreated 0.10 0.10 0.20 0.20 0.30 0.50 0.00 0.00 0.00 0.10 0.10 0.20
03- Lithium & Silane/Siloxane blend 0.10 0.20 0.25 0.30 0.50 0.75 0.10 0.20 0.25 0.30 0.40 0.60
09-100% Silane Solvent-based 0.00 0.00 0.00 0.00 0.00 0.00 0.00 0.00 0.00 0.00 0.00 0.00
10-Untreated 0.50 1.50 Leak 0.50 1.50 1.50 Leak
14-40% Silane Water-based 0.00 0.00 0.00 0.00 0.13 0.25 0.00 0.00 0.00 0.00 0.00 0.13
16-Untreated 0.00 0.00 0.00 0.00 0.00 0.00 0.00 0.00 0.00 0.00 0.00 0.00
19-40% Silane Solvent-based 0.00 0.00 0.00 0.00 0.00 0.25 0.00 0.00 0.25 0.25 0.25 0.50
22-100% Waterborne Silane/Siloxane 0.00 0.00 0.00 0.25 0.25 0.50 0.00 0.00 0.25 0.25 0.25 0.25
29-100% Waterborne Silane/Siloxane 0.00 0.00 0.25 0.25 0.25 0.00 0.00 0.00 0.00 0.00
32-100% Acrylic Polymer 0.00 0.25 0.25 0.25 0.25 0.25 0.00 0.00 0.00 0.00 0.00 0.00
Figure 11. Measuring Fluid Leakage

16 | P a g e
Sealer Penetration Test
The Sealer Penetration test was used for years 2012, 2013, and 2014. One core was taken from each treated section for each year. Samples of 2 x 2 inches were cored, split lengthwise, and then the inner top surface was saturated with distilled water. The sealer penetration was evaluated by visually inspecting the core sample for a water-repelling layer near the surface, indicating how deep the sealer penetrated. This was indicated by a light colored dry area, as shown in Figure 12.
The analysis of the years 2012, 2013, and 2014 found that the 100% Silane Solvent-based and 40% Silane Solvent-based were the only sealers to have a water-repelling layer for all three years. 40% Silane Water-based did show a water-repelling layer in year 2012, but not in the following years, as shown in Table 6.
Sealer Penetration Not Visible
Sealer Penetration Visible
Figure 12. Sealer Penetration Examples
Table 6. Sealer Penetration Layer Results
Sample Panel Year 2012
Year 2013
Year 2014
01-Untreated
02-Untreated
03- Lithium & Silane/Siloxane blend No No
04- Lithium & Silane/Siloxane blend No
05-Untreated
06-Untreated
07-100% Silane Solvent-based
08-100% Silane Solvent-based Yes Yes
09-100% Silane Solvent-based Yes
10-Untreated
11-Untreated
12-40% Silane Water-based
13-40% Silane Water-based No
14-40% Silane Water-based Yes
15-40% Silane Water-based No
16-Untreated
17-40% Silane Solvent-based
18-40% Silane Solvent-based Yes
19-40% Silane Solvent-based Yes Yes
20-Untreated
21-Untreated
22-100% Waterborne Silane/Siloxane No No
23-100% Waterborne Silane/Siloxane
24-100% Waterborne Silane/Siloxane No
25-Untreated
26-Untreated
27-100% Waterborne Silane/Siloxane No
28-100% Waterborne Silane/Siloxane No
29-100% Waterborne Silane/Siloxane No
30-Untreated
31-Untreated
32-100% Acrylic Polymer No
33-100% Acrylic Polymer No
34-100% Acrylic Polymer No
35-100% Acrylic Polymer
Core samples with a “No” value did not have a hydrophobic layer. Core samples with a “Yes” value
did have a hydrophobic layer.
17 | P a g e
Table 7. Visual Shading of Panel Joints Results
Sample Panel Year 2012
Year 2013
Year 2014
01-Untreated No No
02-Untreated
03- Lithium & Silane/Siloxane blend No No
04- Lithium & Silane/Siloxane blend
05-Untreated No
06-Untreated No No
07-100% Silane Solvent-based No
08-100% Silane Solvent-based No No
09-100% Silane Solvent-based No
10-Untreated Yes
11-Untreated Yes Yes
12-40% Silane Water-based No
13-40% Silane Water-based No
14-40% Silane Water-based No
15-40% Silane Water-based No No
16-Untreated Yes Yes
17-40% Silane Solvent-based No No
18-40% Silane Solvent-based No No
19-40% Silane Solvent-based No
20-Untreated Yes Yes
21-Untreated Yes
22-100% Waterborne Silane/Siloxane Yes Yes
23-100% Waterborne Silane/Siloxane Yes Yes Yes
24-100% Waterborne Silane/Siloxane Yes Yes Yes
25-Untreated Yes Yes Yes
26-Untreated Yes Yes Yes
27-100% Waterborne Silane/Siloxane Yes
28-100% Waterborne Silane/Siloxane Yes Yes
29-100% Waterborne Silane/Siloxane Yes Yes
30-Untreated No
31-Untreated No
32-100% Acrylic Polymer
33-100% Acrylic Polymer No Yes Yes
34-100% Acrylic Polymer
35-100% Acrylic Polymer
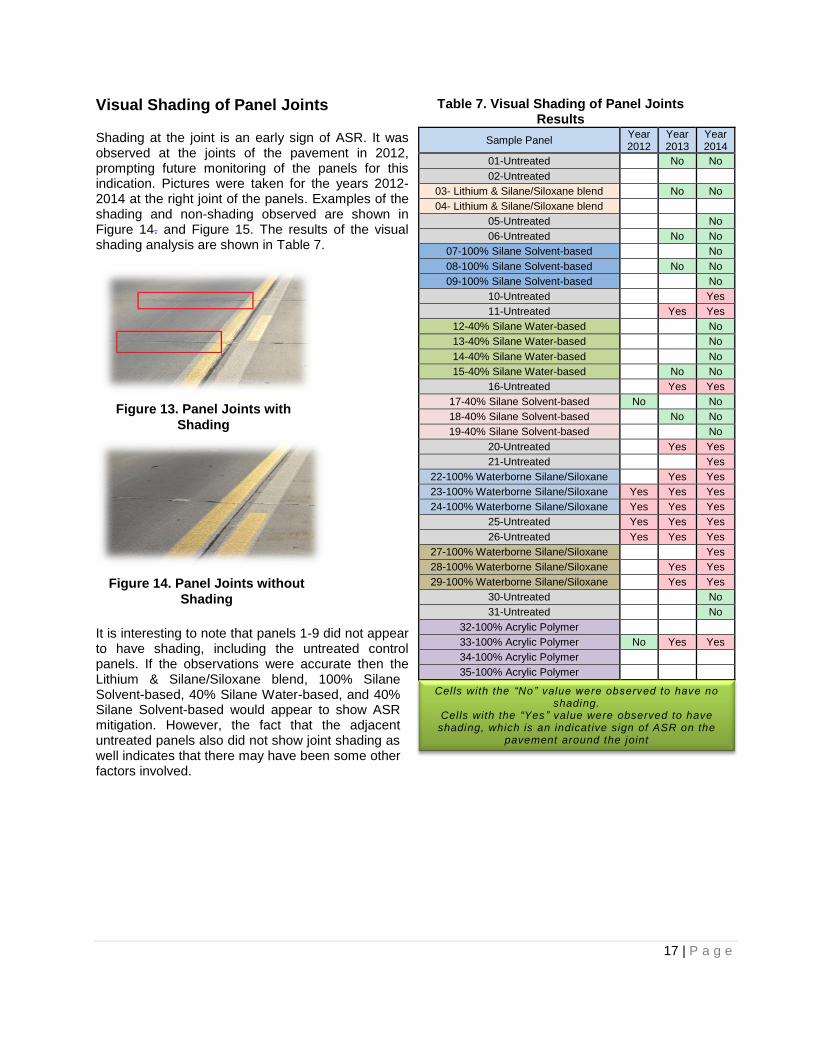
Visual Shading of Panel Joints
Shading at the joint is an early sign of ASR. It was observed at the joints of the pavement in 2012, prompting future monitoring of the panels for this indication. Pictures were taken for the years 2012-2014 at the right joint of the panels. Examples of the shading and non-shading observed are shown in Figure 14. and Figure 15. The results of the visual shading analysis are shown in Table 7.
It is interesting to note that panels 1-9 did not appear to have shading, including the untreated control panels. If the observations were accurate then the Lithium & Silane/Siloxane blend, 100% Silane Solvent-based, 40% Silane Water-based, and 40% Silane Solvent-based would appear to show ASR mitigation. However, the fact that the adjacent untreated panels also did not show joint shading as well indicates that there may have been some other factors involved.
Figure 13. Panel Joints with
Shading
Figure 14. Panel Joints without
Shading
Cells with the “No” value were observed to have no shading.
Cells with the “Yes” value were observed to have shading, which is an indicat ive sign of ASR on the
pavement around the joint

18 | P a g e
Figure 15. Chloride Ion Sample
Locations on the Panel 2012-2014
Chloride Ion Penetration 2012-2014
Sample Collection Modification
Based on the 2011 test results, the research team decided to increase the number of locations on each panel to improve confidence in the NDR T 260 (NDOR, 2016) chloride ion analysis. The locations added were the left joint (LT), middle left (ML), and middle right (MR) on the panel. Depth increments remained the same at 0-½”, ½”-1” and 1”-1 ½”. The middle left and middle right were added to provide consistent results that are mainly effected by the penetration of the chloride ions through the surface sealer and not from the joint where there is a greater penetration of moisture and chemicals. Figure 15 shows the locations of sample collection for 2012-2014.
NDR T 260 Modification
The AASHTO T 260 has three methods for the determination of chloride ion content of concrete cores that can be used when testing by potentiometric titration. Investigations into Methods of AASTHO T 260 (Heyen, Dondlinger, & Halsey, 2012) was completed to determine which of the three methods included in AASHTO T 260 would be appropriate for the chloride ion testing. Prior to this investigation, the initial silver nitrate concentration was modified from 0.01 N to 0.03 N, requiring AASTHO T 260 to be adapted to NDR T 260 to address this change.
It was concluded from the research that changes could be made to improve accuracy and precision, and reduce operational costs. These procedure changes were adapted at the end of 2012 and were used on the chloride ion content testing by an automatic titrator for years 2012 thru 2014 as shown in Figure 16. The modifications were as follows:
Samples are to be prepared at a final volume of 100 mL.
Samples are to be tested in triplicate with results differing not to differ by more than 68 ppm.
Samples are recommended to be tested by use of an automatic titrator.
Due to the modification to the NDR T 260 test method III, the research team evaluated the 2010-2011 chloride ion results separately from the 2012-2014 results, because the 2010-2011 results were completed following the NDR T 260 test procedure. The 2012-2014 data analysis followed the modified NDR T 260 procedure.
Chloride Ion Sample Preparation Modification
In 2013, an additional step in sample preparation was added to the modified NDR T 260 procedure. The additional step was to pulverize all chloride ion samples using an automated mixer mill prior to testing. The intent of the additional step was to improve result precision and accuracy by increasing the sample surface area and further homogenizing the powdered samples. The mixer mill was used on the samples from 2013 and 2014.
Figure 16. Chloride Ion Testing by
Automatic Titrator
19 | P a g e
Chloride Ion Data Discussion
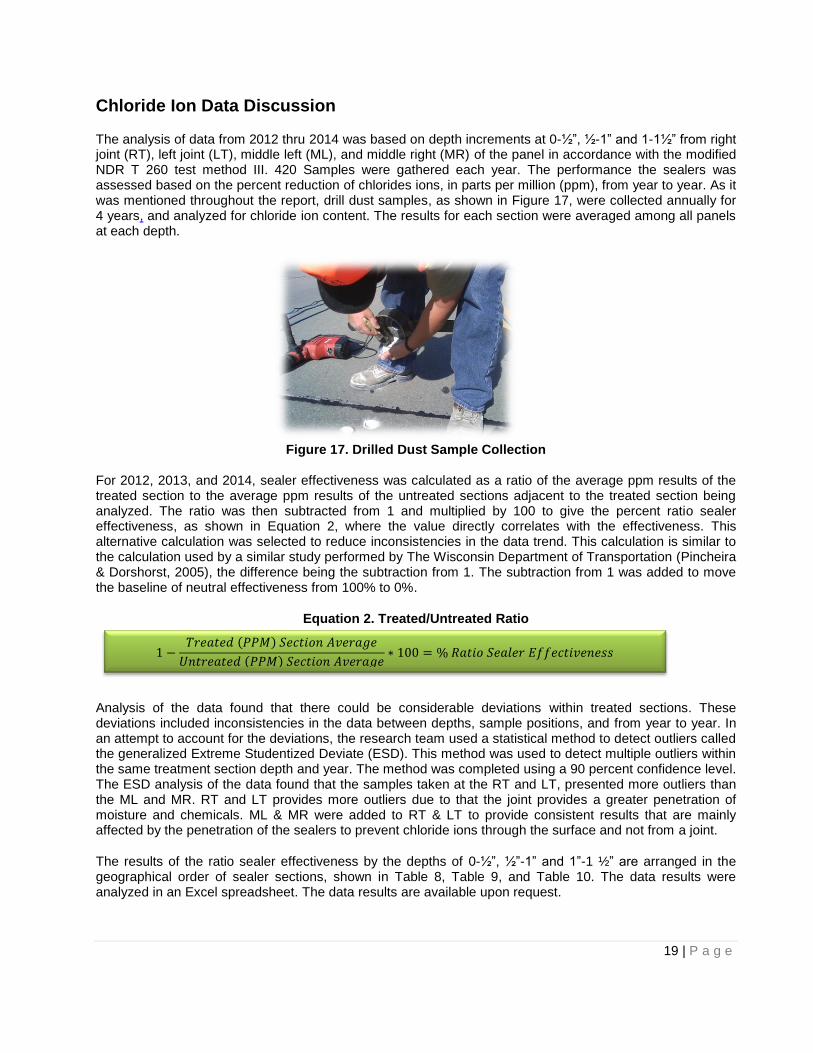
The analysis of data from 2012 thru 2014 was based on depth increments at 0-½”, ½-1” and 1-1½” from right joint (RT), left joint (LT), middle left (ML), and middle right (MR) of the panel in accordance with the modified NDR T 260 test method III. 420 Samples were gathered each year. The performance the sealers was assessed based on the percent reduction of chlorides ions, in parts per million (ppm), from year to year. As it was mentioned throughout the report, drill dust samples, as shown in Figure 17, were collected annually for 4 years, and analyzed for chloride ion content. The results for each section were averaged among all panels at each depth.
Figure 17. Drilled Dust Sample Collection
For 2012, 2013, and 2014, sealer effectiveness was calculated as a ratio of the average ppm results of the treated section to the average ppm results of the untreated sections adjacent to the treated section being analyzed. The ratio was then subtracted from 1 and multiplied by 100 to give the percent ratio sealer effectiveness, as shown in Equation 2, where the value directly correlates with the effectiveness. This alternative calculation was selected to reduce inconsistencies in the data trend. This calculation is similar to the calculation used by a similar study performed by The Wisconsin Department of Transportation (Pincheira & Dorshorst, 2005), the difference being the subtraction from 1. The subtraction from 1 was added to move the baseline of neutral effectiveness from 100% to 0%.
Equation 2. Treated/Untreated Ratio
Analysis of the data found that there could be considerable deviations within treated sections. These deviations included inconsistencies in the data between depths, sample positions, and from year to year. In an attempt to account for the deviations, the research team used a statistical method to detect outliers called the generalized Extreme Studentized Deviate (ESD). This method was used to detect multiple outliers within the same treatment section depth and year. The method was completed using a 90 percent confidence level. The ESD analysis of the data found that the samples taken at the RT and LT, presented more outliers than the ML and MR. RT and LT provides more outliers due to that the joint provides a greater penetration of moisture and chemicals. ML & MR were added to RT & LT to provide consistent results that are mainly affected by the penetration of the sealers to prevent chloride ions through the surface and not from a joint.
The results of the ratio sealer effectiveness by the depths of 0-½”, ½”-1” and 1”-1 ½” are arranged in the geographical order of sealer sections, shown in Table 8, Table 9, and Table 10. The data results were analyzed in an Excel spreadsheet. The data results are available upon request.
1 −𝑇𝑟𝑒𝑎𝑡𝑒𝑑 𝑃𝑃𝑀 𝑆𝑒𝑐𝑡𝑖𝑜𝑛 𝐴𝑣𝑒𝑟𝑎𝑔𝑒
𝑈𝑛𝑡𝑟𝑒𝑎𝑡𝑒𝑑 𝑃𝑃𝑀 𝑆𝑒𝑐𝑡𝑖𝑜𝑛 𝐴𝑣𝑒𝑟𝑎𝑔𝑒∗ 100 = % 𝑅𝑎𝑡𝑖𝑜 𝑆𝑒𝑎𝑙𝑒𝑟 𝐸𝑓𝑓𝑒𝑐𝑡𝑖𝑣𝑒𝑛𝑒𝑠𝑠
20 | P a g e
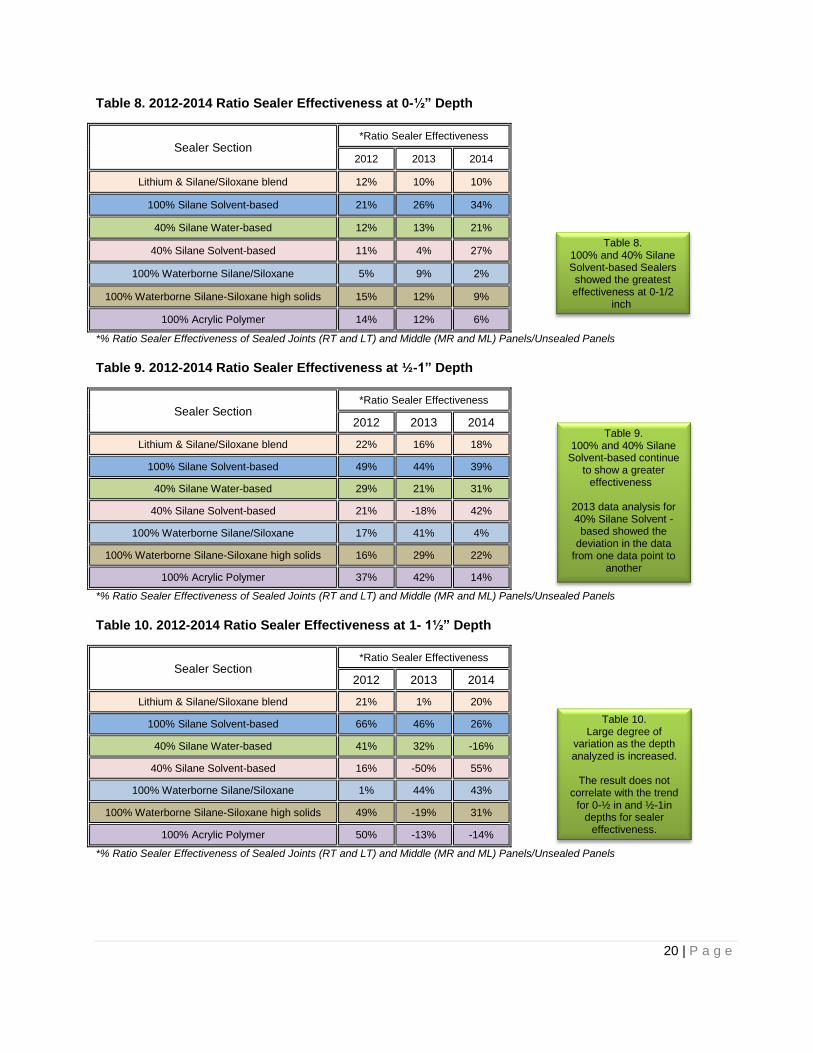
Table 8. 2012-2014 Ratio Sealer Effectiveness at 0-½” Depth
Sealer Section *Ratio Sealer Effectiveness
2012 2013 2014
Lithium & Silane/Siloxane blend 12% 10% 10%
100% Silane Solvent-based 21% 26% 34%
40% Silane Water-based 12% 13% 21%
40% Silane Solvent-based 11% 4% 27%
100% Waterborne Silane/Siloxane 5% 9% 2%
100% Waterborne Silane-Siloxane high solids 15% 12% 9%
100% Acrylic Polymer 14% 12% 6%
*% Ratio Sealer Effectiveness of Sealed Joints (RT and LT) and Middle (MR and ML) Panels/Unsealed Panels
Table 9. 2012-2014 Ratio Sealer Effectiveness at ½-1” Depth
Sealer Section *Ratio Sealer Effectiveness
2012 2013 2014
Lithium & Silane/Siloxane blend 22% 16% 18%
100% Silane Solvent-based 49% 44% 39%
40% Silane Water-based 29% 21% 31%
40% Silane Solvent-based 21% -18% 42%
100% Waterborne Silane/Siloxane 17% 41% 4%
100% Waterborne Silane-Siloxane high solids 16% 29% 22%
100% Acrylic Polymer 37% 42% 14%
*% Ratio Sealer Effectiveness of Sealed Joints (RT and LT) and Middle (MR and ML) Panels/Unsealed Panels
Table 10. 2012-2014 Ratio Sealer Effectiveness at 1- 1½” Depth
Sealer Section *Ratio Sealer Effectiveness
2012 2013 2014
Lithium & Silane/Siloxane blend 21% 1% 20%
100% Silane Solvent-based 66% 46% 26%
40% Silane Water-based 41% 32% -16%
40% Silane Solvent-based 16% -50% 55%
100% Waterborne Silane/Siloxane 1% 44% 43%
100% Waterborne Silane-Siloxane high solids 49% -19% 31%
100% Acrylic Polymer 50% -13% -14%
*% Ratio Sealer Effectiveness of Sealed Joints (RT and LT) and Middle (MR and ML) Panels/Unsealed Panels
Table 8. 100% and 40% Silane Solvent-based Sealers showed the greatest effectiveness at 0-1/2
inch
Table 9. 100% and 40% Silane
Solvent-based continue to show a greater
effectiveness 2013 data analysis for 40% Silane Solvent -
based showed the deviation in the data
from one data point to another
Table 10. Large degree of
variation as the depth analyzed is increased.
The result does not
correlate with the trend for 0-½ in and ½-1in
depths for sealer effectiveness.
21 | P a g e
Chloride Ion 2012-2014 Analysis
This investigation has shown the inconsistency of data even with the addition of samples.
This investigation used the Extreme Studentized Deviate (ESD) test to remove errors from the data. However, variations for the measured depths of penetration were still observed.
This evaluation proves the sensitive nature of the AASHTO T 260 chloride ion content in concrete.
Sealer Field Performance Analysis
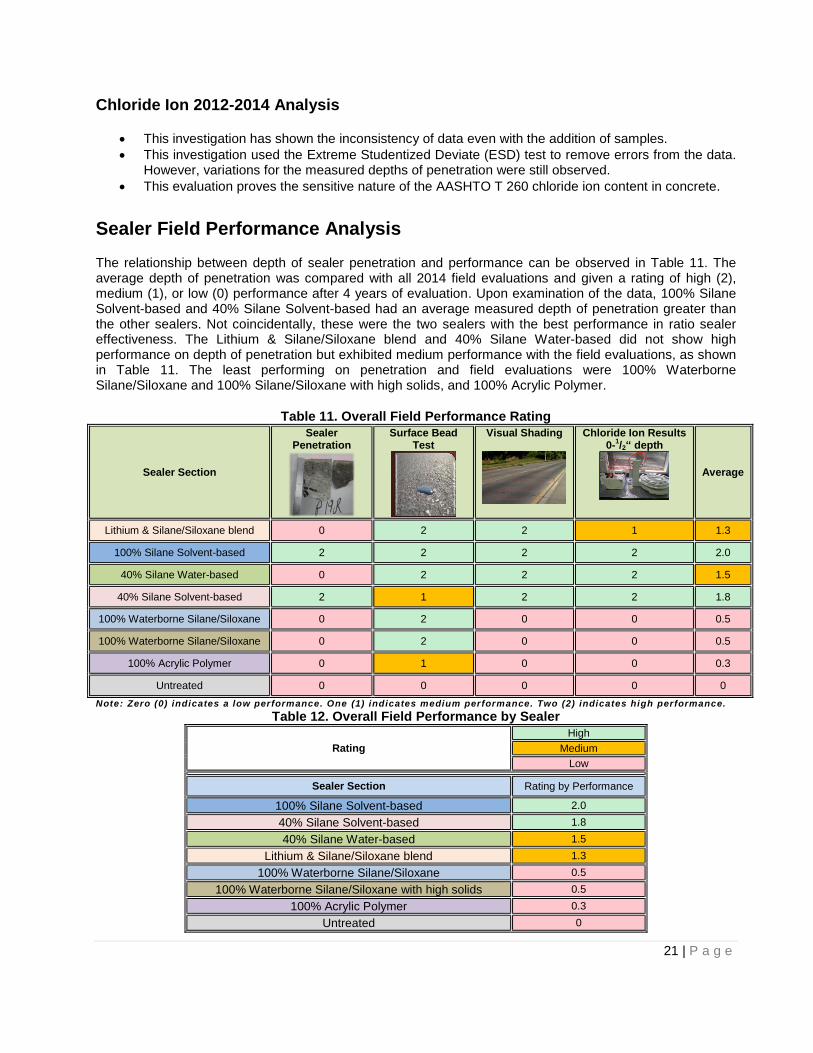
The relationship between depth of sealer penetration and performance can be observed in Table 11. The average depth of penetration was compared with all 2014 field evaluations and given a rating of high (2), medium (1), or low (0) performance after 4 years of evaluation. Upon examination of the data, 100% Silane Solvent-based and 40% Silane Solvent-based had an average measured depth of penetration greater than the other sealers. Not coincidentally, these were the two sealers with the best performance in ratio sealer effectiveness. The Lithium & Silane/Siloxane blend and 40% Silane Water-based did not show high performance on depth of penetration but exhibited medium performance with the field evaluations, as shown in Table 11. The least performing on penetration and field evaluations were 100% Waterborne Silane/Siloxane and 100% Silane/Siloxane with high solids, and 100% Acrylic Polymer.
Table 11. Overall Field Performance Rating
Sealer Section
Sealer Penetration
Surface Bead Test
Visual Shading
Chloride Ion Results 0-
1/2“ depth
Average
Lithium & Silane/Siloxane blend 0 2 2 1 1.3
100% Silane Solvent-based 2 2 2 2 2.0
40% Silane Water-based 0 2 2 2 1.5
40% Silane Solvent-based 2 1 2 2 1.8
100% Waterborne Silane/Siloxane 0 2 0 0 0.5
100% Waterborne Silane/Siloxane 0 2 0 0 0.5
100% Acrylic Polymer 0 1 0 0 0.3
Untreated 0 0 0 0 0
Note: Zero (0) indicates a low performance. One (1) indicates medium performance. Two (2) indicates high performance.
Table 12. Overall Field Performance by Sealer
Rating High
Medium
Low
Sealer Section Rating by Performance
100% Silane Solvent-based 2.0
40% Silane Solvent-based 1.8
40% Silane Water-based 1.5
Lithium & Silane/Siloxane blend 1.3
100% Waterborne Silane/Siloxane 0.5
100% Waterborne Silane/Siloxane with high solids 0.5
100% Acrylic Polymer 0.3
Untreated 0
22 | P a g e
Sealer Field Performance Summary
The Nebraska Department of Roads occasionally uses concrete sealers to prevent deterioration due to ASR when the pavement does not have the proper mitigation to prevent ASR. The application of sealers may become more common in the future as a preventive maintenance tool for bridge decks. The laboratory and field-testing conducted has identified the best performing sealers, both penetrating and surface film forming, that have shown promise at reducing moisture and chloride ion penetration. The preliminary purpose of this research was to evaluate the performance of sealers to prevent moisture penetration into concrete pavements over four years. The main tool used during this research was the evaluation of chloride ion penetration by the modified NDR T 260 method III. The sealers were reviewed and ranked in terms of their performance, which was described in the Sealer Field Performance Analysis section. The main characteristics of the sealers on performance were evaluated in the lab and field were recorded and divided into a variety of categories; these included the Visual Bead Test, the Sealer Penetration Test, Visual Shading of the Panel Joints and the Chloride Ion Penetration Test. The sealers were assigned a score of 0 to 2 in each category, as shown in Table 11, representing ratings based on criteria. A rating of 0 indicated a low performance, a rating of 1 indicated medium performance, and a rating of 2 indicated high performance.
It is important to note that the solvent-based sealers were found to have greater visible/measured depths of penetration than water-based, siloxane, or lithium-based. The depth of penetration of the solvent-based was found to be 1/8 inches to ¼ inches in comparison to water-based, siloxane, lithium-based and acrylic sealers, which had exhibited no penetration depth.
When evaluating the laboratory and field-testing performed in this study, the research team found the following;
100% and 40% silane solvent-based exhibited consistently high performance throughout all the tests and offered the best protection against chloride ion intrusion.
40% Water-Based Silane and Lithium & Silane/Siloxane blend exhibited medium performance.
Both Waterborne Silane-Siloxanes and the Acrylic Based Polymer exhibited the lowest performance.
A very effective tool for the performance of the sealers was found to be the Sealer Penetration Test. The test was found to be rapid and effective, as opposed to the time-consuming chloride ion test by the modified NDR T 260 test method III.
The results from the chloride ion analysis showed large data scatter, which made it difficult to evaluate the performance from year to year. This research agreed with the findings by the Wisconsin Department of Transportation study (Pincheira & Dorshorst, 2005) that concluded future chloride ion testing should be considered; however, more sampling and testing at more locations may not help reduce the data scatter/inconsistency. The Department’s study quadrupled the testing, increasing the time/cost and did not substantially reduce the inconsistency of the data.
Chloride ion content measurements proved inconclusive and a poor indicator of sealer performance. Water resistance in core observations was found to be consistent and indicative of sealer performance.
23 | P a g e
NDOR Applications & Specification
In the summer of 2012, selected barriers through the entire I-80 Interstate corridor, covering District 1 (Lincoln, NE) and District 2 (Omaha, NE), were treated with 100% silane solution. As part of the maintenance contract, these treatments were applied to the barriers that were deteriorating due to Alkali Silica Reaction (ASR). The Nebraska Department of Roads (NDOR) added an Approved Product List for 40% and 100% solvent-based sealers. These sealers showed deep visual penetration, no change in surface appearance, and high resistance to alkali attack by minimizing water infiltration.
The National Research by the FHWA’s ASR Development and Deployment Program (Federal Highway Administration, 2008) included field trials of real cases of ASR for prevention and mitigation. As part of the mitigation, field trial barriers were treated with sealers. The best performing sealers of the research were found for barrier applications with 40% and 100% silane solutions. The “FHWA Technical Update Report” (Federal Highway Administration, 2011) described the field trials in the state of Massachusetts and Maine as using 40% silane solution, 100% silane solution, and elastomeric paint. The Department’s sealer field performance evaluation correlated with the same sealers that the FHWA found to be best performing in the field. Therefore, the APL was created for 40% and 100% silane solvent-based sealers.
The two contracted maintenance projects for concrete median barriers were West Limits-N.27TH
St in Lincoln and I-80/480/680 in Omaha, Douglas and Sarpy counties. The specification was as follows:
Material Requirements
The sealer shall meet the requirements of Bridge Penetrating Concrete Sealers on the Nebraska’s Approved Product List (APL). Prior to applications:
● The sealer shall be placed on concrete that has cured for a minimum of 28 days. ● All surfaces shall be cleaned by a pressure washer capable of delivering water at not
less than 2,000 psi. ● Surfaces shall be allowed to air dry for a minimum of 48 hours.
Applications ● Horizontal Application: The concrete sealer shall be applied with a low-pressure sprayer
(10-25 psi) or roller to saturate the concrete surface. ● Vertical Application: Apply from bottom up with a low-pressure sprayer (10-25 psi) or
roller to thoroughly saturate the concrete surface and create a uniform wet appearance. ● Application Rates: The concrete sealer shall be applied according to the manufacturer’s
recommended rate.
This investigation found that the penetration of solvent-based sealers could be visually evaluated by applying water to the surface of split cores. Some of the solvent-based sealer penetrations are not easily observed using this method. Therefore, the Department was prompted to investigate additional methods to observe sealer penetration in order to follow up with the Sealer Penetration Test that is performed on sealers for approval and inclusion on the Department’s APL. The investigation, Additional Methods for Sealer Penetration Observation Evaluation (Halsey & Seger, 2015), found that the research by City University in London, A Procedure for Verifying Pavix CCC100 Concrete Impregnation by Core Examination (Chamberlain, 2004)(Yellow Dye), was the most effective at visualizing the depth of penetration.
24 | P a g e
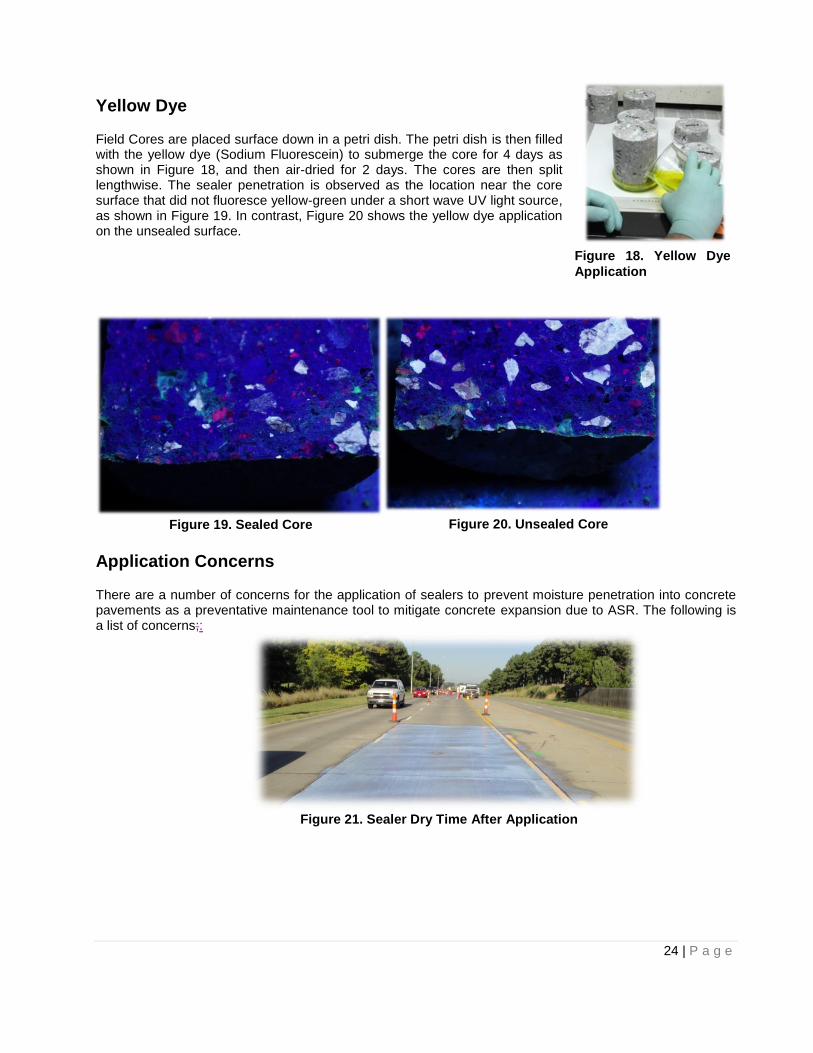
Yellow Dye
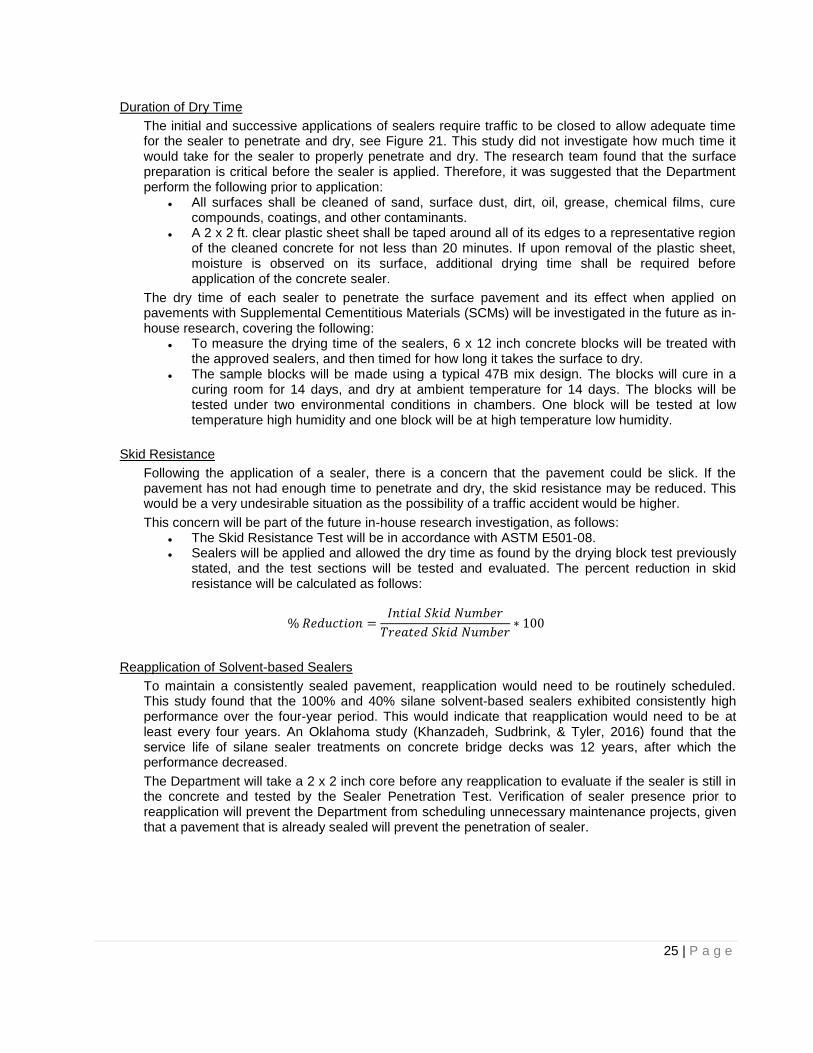
Field Cores are placed surface down in a petri dish. The petri dish is then filled with the yellow dye (Sodium Fluorescein) to submerge the core for 4 days as shown in Figure 18, and then air-dried for 2 days. The cores are then split lengthwise. The sealer penetration is observed as the location near the core surface that did not fluoresce yellow-green under a short wave UV light source, as shown in Figure 19. In contrast, Figure 20 shows the yellow dye application on the unsealed surface.
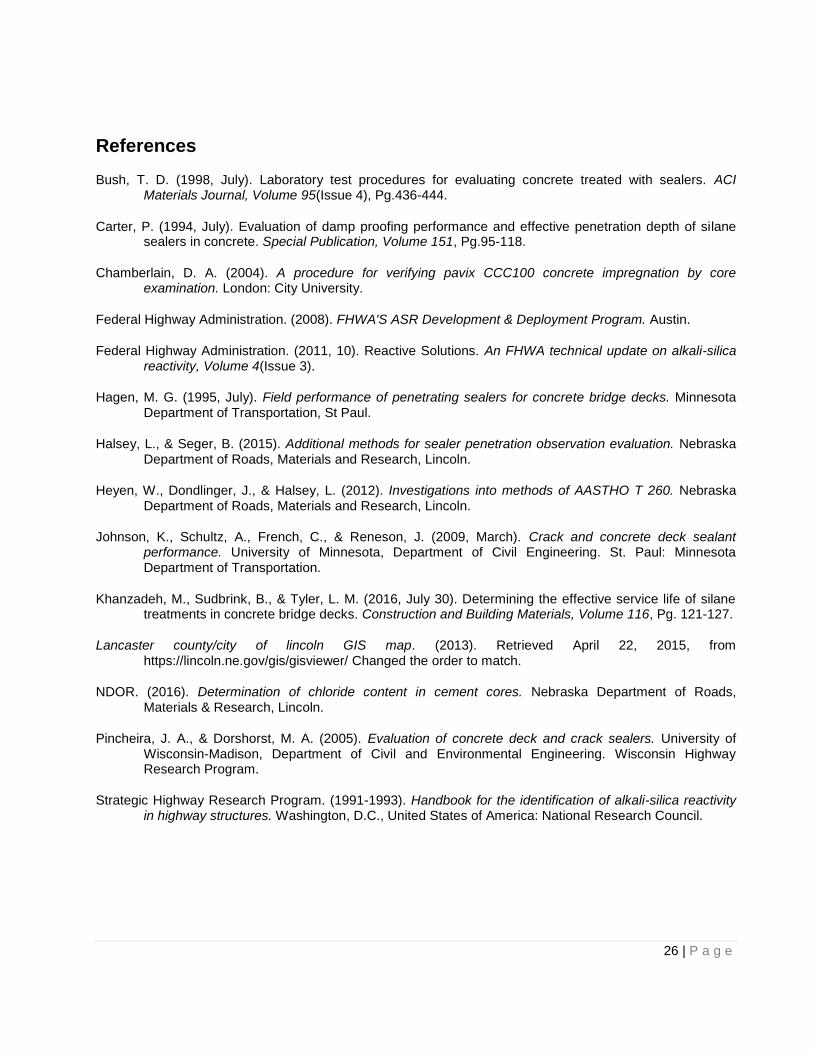
Application Concerns
There are a number of concerns for the application of sealers to prevent moisture penetration into concrete pavements as a preventative maintenance tool to mitigate concrete expansion due to ASR. The following is a list of concerns;:
Figure 19. Sealed Core
Figure 20. Unsealed Core
Figure 18. Yellow Dye
Application
Figure 21. Sealer Dry Time After Application
25 | P a g e
Duration of Dry Time
The initial and successive applications of sealers require traffic to be closed to allow adequate time for the sealer to penetrate and dry, see Figure 21. This study did not investigate how much time it would take for the sealer to properly penetrate and dry. The research team found that the surface preparation is critical before the sealer is applied. Therefore, it was suggested that the Department perform the following prior to application:
● All surfaces shall be cleaned of sand, surface dust, dirt, oil, grease, chemical films, cure compounds, coatings, and other contaminants.
● A 2 x 2 ft. clear plastic sheet shall be taped around all of its edges to a representative region of the cleaned concrete for not less than 20 minutes. If upon removal of the plastic sheet, moisture is observed on its surface, additional drying time shall be required before application of the concrete sealer.
The dry time of each sealer to penetrate the surface pavement and its effect when applied on pavements with Supplemental Cementitious Materials (SCMs) will be investigated in the future as in-house research, covering the following:
● To measure the drying time of the sealers, 6 x 12 inch concrete blocks will be treated with the approved sealers, and then timed for how long it takes the surface to dry.
● The sample blocks will be made using a typical 47B mix design. The blocks will cure in a curing room for 14 days, and dry at ambient temperature for 14 days. The blocks will be tested under two environmental conditions in chambers. One block will be tested at low temperature high humidity and one block will be at high temperature low humidity.
Skid Resistance
Following the application of a sealer, there is a concern that the pavement could be slick. If the pavement has not had enough time to penetrate and dry, the skid resistance may be reduced. This would be a very undesirable situation as the possibility of a traffic accident would be higher.
This concern will be part of the future in-house research investigation, as follows: ● The Skid Resistance Test will be in accordance with ASTM E501-08. ● Sealers will be applied and allowed the dry time as found by the drying block test previously
stated, and the test sections will be tested and evaluated. The percent reduction in skid resistance will be calculated as follows:
% 𝑅𝑒𝑑𝑢𝑐𝑡𝑖𝑜𝑛 =𝐼𝑛𝑡𝑖𝑎𝑙 𝑆𝑘𝑖𝑑 𝑁𝑢𝑚𝑏𝑒𝑟
𝑇𝑟𝑒𝑎𝑡𝑒𝑑 𝑆𝑘𝑖𝑑 𝑁𝑢𝑚𝑏𝑒𝑟∗ 100
Reapplication of Solvent-based Sealers
To maintain a consistently sealed pavement, reapplication would need to be routinely scheduled. This study found that the 100% and 40% silane solvent-based sealers exhibited consistently high performance over the four-year period. This would indicate that reapplication would need to be at least every four years. An Oklahoma study (Khanzadeh, Sudbrink, & Tyler, 2016) found that the service life of silane sealer treatments on concrete bridge decks was 12 years, after which the performance decreased.
The Department will take a 2 x 2 inch core before any reapplication to evaluate if the sealer is still in the concrete and tested by the Sealer Penetration Test. Verification of sealer presence prior to reapplication will prevent the Department from scheduling unnecessary maintenance projects, given that a pavement that is already sealed will prevent the penetration of sealer.
26 | P a g e
References
Bush, T. D. (1998, July). Laboratory test procedures for evaluating concrete treated with sealers. ACI Materials Journal, Volume 95(Issue 4), Pg.436-444.
Carter, P. (1994, July). Evaluation of damp proofing performance and effective penetration depth of silane sealers in concrete. Special Publication, Volume 151, Pg.95-118.
Chamberlain, D. A. (2004). A procedure for verifying pavix CCC100 concrete impregnation by core examination. London: City University.
Federal Highway Administration. (2008). FHWA'S ASR Development & Deployment Program. Austin.
Federal Highway Administration. (2011, 10). Reactive Solutions. An FHWA technical update on alkali-silica reactivity, Volume 4(Issue 3).
Hagen, M. G. (1995, July). Field performance of penetrating sealers for concrete bridge decks. Minnesota Department of Transportation, St Paul.
Halsey, L., & Seger, B. (2015). Additional methods for sealer penetration observation evaluation. Nebraska Department of Roads, Materials and Research, Lincoln.
Heyen, W., Dondlinger, J., & Halsey, L. (2012). Investigations into methods of AASTHO T 260. Nebraska Department of Roads, Materials and Research, Lincoln.
Johnson, K., Schultz, A., French, C., & Reneson, J. (2009, March). Crack and concrete deck sealant performance. University of Minnesota, Department of Civil Engineering. St. Paul: Minnesota Department of Transportation.
Khanzadeh, M., Sudbrink, B., & Tyler, L. M. (2016, July 30). Determining the effective service life of silane treatments in concrete bridge decks. Construction and Building Materials, Volume 116, Pg. 121-127.
Lancaster county/city of lincoln GIS map. (2013). Retrieved April 22, 2015, from https://lincoln.ne.gov/gis/gisviewer/ Changed the order to match.
NDOR. (2016). Determination of chloride content in cement cores. Nebraska Department of Roads, Materials & Research, Lincoln.
Pincheira, J. A., & Dorshorst, M. A. (2005). Evaluation of concrete deck and crack sealers. University of Wisconsin-Madison, Department of Civil and Environmental Engineering. Wisconsin Highway Research Program.
Strategic Highway Research Program. (1991-1993). Handbook for the identification of alkali-silica reactivity in highway structures. Washington, D.C., United States of America: National Research Council.