Research: Potential State Revenue from Indonesia’s Fishery … · Potential State Revenues from...
49
Potential State Revenues from the Natural Resources Sector and its Problems: Fishery Sector Tubagus Insan
-
Upload
phungnguyet -
Category
Documents
-
view
213 -
download
0
Transcript of Research: Potential State Revenue from Indonesia’s Fishery … · Potential State Revenues from...

Potential State Revenues from the Natural Resources Sector and its Problems: Fishery Sector
Tubagus Insan

1
Book 5 of 5
Potential State Revenues from the Natural Resources Sector and its Problems
Book 5. Fishery Sector
Author:
Pius Widiyatmoko
Editor:
Publisher:
Perkumpulan Inisiatif and the National Secretariat of FITRA
Supported by:
International Budget Partnership (IBP) and
The Ford Foundation
2017

2
Book 5 of 5
Potential State Revenues from the Natural Resources Sector
and its Problems
Book 5. Fishery Sector
Instruments written in this book are part of the PROMOTING EQUITY ON THE REVENUE
MOBILIZATION OF NATURAL RESOURCES IN FORESTRY, AGRICULTURE, PLANTATION, MARINE
AND FISHERIES IN INDONESIA program.
(Initial Action)
ISBN:......
Katalog Dalam Terbitan.....
Published by:
Perkumpulan Inisiatif and the National Secretariat of FITRA
Supported by:
International Budget Partnership (IBP) and The Ford Foundation
2017
Statement
Findings and instruments written in this book are private in nature, and may only be used for internal
consumption, and not for the consumption of the public. This book cannot be reproduced without
the consent of the publisher and/or author.

3

4
Foreword
Economic development requires a substantial tax base. Until now, the exploitation of natural
resources, specifically revenue from nonrenewable sources such as mining, oil, and gas, serves as a
major source of state revenue. At the same time, state revenues from the exploitation of relatively
renewable natural sources including agriculture, plantations, forestry, and fisheries have received
less attention and their revenue potential has not been maximized.
This book is one of the reports documenting the efforts made by civil society groups to (1) estimate
the revenue generating potential of natural resources; (2) describe the governance in the sectors
studied; and (3) identify the reasons for low revenue collections in the agriculture, plantation,
forestry, and fishery and marine sectors. The report is designed to increase understanding of the
sectors’ potential, governance, and revenue issues so that in the future civil society can help
contribute to increasing revenue collections from these four sectors.
This book is the fifth of five books, and is divided into two parts. First, an introduction, and second,
the findings of the study.

5
Table of Contents
Foreword...................................................................................................................................................... 4
Table of Contents ......................................................................................................................................... 5
Introduction ................................................................................................................................................. 7
Background .............................................................................................................................................. 7
Objective ................................................................................................................................................ 15
Scope ...................................................................................................................................................... 16
Methodology .......................................................................................................................................... 17
Lampung Province and Bandar Lampung City ....................................................................................... 19
Description of Marine Fishery State Revenue Governance ................................................................ 19
Potential Revenues and Losses, Modes, and Actors Involved ............................................................ 21
Central Java Province and Kendal Regency ............................................................................................. 24
Description of Marine Fishery State Revenue Governance ................................................................ 24
Potential Revenues and Losses, Modes and Actors Involved ............................................................ 26
Problems in Marine Capture Fishery ................................................................................................... 30
Findings .................................................................................................................................................. 31
East Java Province and Tuban Regency ................................................................................................... 32
Description of Marine Fishery State Revenue Governance ................................................................ 32
Findings .................................................................................................................................................. 33
East Kalimantan Province and Samarinda City ....................................................................................... 34
Description of Marine Fishery State Revenue Governance ................................................................ 34
Potential Revenue Losses, Modes and Actors Involved ..................................................................... 35
Findings .................................................................................................................................................. 36
Central Sulawesi Province and Donggala Regency ................................................................................. 37
Description of Marine Fishery State Revenue Governance ................................................................ 37
South Sulawesi Province and Bulukamba Regency ................................................................................ 40
Description of Marine Fishery State Revenue Governance ................................................................ 40
West Nusa Tenggara Province and East Lombok Regency .................................................................... 43

6
Description of Marine Fishery State Revenue Governance ................................................................ 43
Problems of Marine Capture Fishery ................................................................................................... 45
Findings .................................................................................................................................................. 45
Maluku Province and Ambon City ............................................................................................................ 47
Description of Marine Fishery State Revenue Governance ................................................................ 47
Potential Revenues and Losses, Modes and Actors Involved ............................................................ 48

7
Introduction
Background Indonesia is an archipelagic country with ocean amounting to two-thirds of its total area. The waters
connecting the islands of Indonesia contain many natural resources. One of these natural resources
is fish. For the purpose of this report, fish include any kind of organism that spends all or part of its
life cycle is in an aquatic environment.1
In the management of fish resources, the Indonesian government divides the country’s territorial
waters into 11 Fishery Management Areas (WPP), as shown in the following image:
Fishery Management Areas of the Republic of Indonesia
Source: Government Regulation KP No.PER.1/MEN/20092
Of the 11 designated WPPs, 4 areas are completely located in the waters of Indonesia, namely WPP
712, 713, 714, and 715. The seven other WPPs were adjacent to neighboring countries, namely WPP
571, 572, 573, 718, 717, 716, and 711.
WPP 571 covers the waters of the Malaccan Strait. WPP 572 and WPP 573 meanwhile are located in
the Indian Ocean, with the Sunda Strait as a border. The waters between the islands of Riau and West
Kalimantan to the Natuna Sea are a part of WPP 711. The Sulawesi Sea, waters connecting Indonesia
and the Philippines, is WPP 716. In the north of Papua, which is directly connected to the Pacific
1 Understanding of fish according to Law No.45 of 2009 on the Amendment of Law No.31 of 2004 on Fisheries. 2 Government Regulation KP No.PER.1/MEN/2009 on Fishery Management Areas of the Republic of Indonesia

8
Ocean, is WPP 717. Lastly, WPP 718 covers the Arafuru Sea and the Timor Strait, which borders East
Timor and Australia.
The Java Sea represents WPP 712. The northern part of Bali-West Nusa Tenggara until the Makkasar
Strait is in WPP 713. The Banda Sea connecting Maluku, East Nusa Tenggara and Southeast Sulawesi
is WPP 714. Meanwhile the Seram Sea and Tomini Bay connecting the bird head shaped part of
Papua, North Maluku, and Central Sulawesi is WPP 715.
In order to control the exploitation of fish resources, the government examined the potential
production of every WPP. As of August 2011, the estimated fish resources of all of Indonesia came to
6,520,00 tons. In August of 2016, the potential of fish resources was explicitly determined to have
increased to 9,932,922 tons. In 2016, a regulation was set to limit the amount of fish exploitation
allowed (JTB) to 7,945,541 tons.
Details are provided in the following graph:
Source: Processed from Government Regulation KP No.45/20113 and Government Regulation KP No.47/20164
3 Marine and Fisheries Ministry Regulation No.45/2011 on the Estimation of Potential of Fish Resources in Fishery Management Area of the Republic of Indonesia. Rokhmin Dahuri, former minister of marine and fishery even mentioned the potential of 65 million tons without specifying the potential of marine fisherieshttp://www.republika.co.id/berita/ekonomi/bisnis/12/12/05/mejnwp-potensi-perikanan-indonesia-baru-tergarap-20-persen 4 Marine and Fisheries Ministry Regulation No.47/2016 on potential Estimation, total od exploited Capture, and Level of Utilization of Fish Resources in Fishery Management Areas of the Republic of Indonesia.
2011 2016 2011 2016 2011 2016 2011 2016 2011 2016 2011 2016 2011 2016 2011 2016 2011 2016 2011 2016 2011 2016
571 571 572 572 573 573 711 711 712 712 713 713 714 714 715 715 716 716 717 717 718 718
Potensi Sisa (ton) - 96, - 245 - 185 - 228 - 196 - 205 - 86, - 126 - 95, - 120 - 398
JTB (ton) 276 387 565 982 491 743 1,0 914 836 785 929 821 278 344 595 505 333 383 299 482 855 1,5
-
500,000
1,000,000
1,500,000
2,000,000
2,500,000
Developement of the Estimation of Fish Resources in Every WPP

9
In the above graphic, total estimated potential of all WPP increased in 2016. The largest increase was
seen in the Timor Arufuru Strait (WPP 718), amounting to 1,043,000 tons and the West Sumatra
Coast (WPP 572) totaling 662,000 tons.
In comparison with the fish exploitation allowed (JTB) between 2011 and 2016, there was a decrease
of potential in 4 WPPs, the Natuna Sea- Kalimantan Straight (WPP 711), Java Sea (WPP 712), Flores
Sea – Makassar Straight (WPP 713) and the Seram Sea – Timini Bay (WPP 715), with a potential catch
of 86,000 ton, 51,000 tons, 108,000 tons, and 80,000 tons, respectively.
From the years 2011 through 2015, exploitation of fish continued to increase, reaching 6,204,688
tons by 2015. This number is still below the estimated potential of 2011. Exploitation numbers
which are still below potential numbers, suggest that there is potential for businesses and fisherman
to increase their catch. The magnitude of this potential is illustrated in the graph below:
Source: Processed from data of Fishery Catch Production 2000-2015, Strategic Plan of the Marine and
Fisheries Ministry 2015-2019
In the Marine and Fisheries Ministry’s Strategic Plan for 2010 through 2014, the target production
for marine fishery was exceeded in the last three years of the plan. This indicates that control of
production is a concern, even though production is below estimated levels.
Revenue increases are not, however, proportional to increased production and data shows a decline
in fishery employment. Thus, is the tendency with motor boats that are capable of sailing to the
Exclusive Economic Zone (ZEE). Only the outboard motor fleet is showing an increase.
2011 2012 2013 2014 2015 2016 2017 2018 2019
Produksi Tangkap Laut 5,345,7 5,435,6 5,707,0 6,037,6 6,204,6
Estimasi Potensi 2011 6,520,0 6,520,0 6,520,0 6,520,0 6,520,0
JBT 2016 7,945,5 7,945,5 7,945,5 7,945,5
Estimasi Potensi 2016 9,931,9 9,931,9 9,931,9 9,931,9
Renstra KKP 5,409,1 5,436,2 5,467,1 5,500,0 6,299,2 6,451,3 6,634,2 6,808,3 6,982,5
4,000,000
5,000,000
6,000,000
7,000,000
8,000,000
9,000,000
10,000,000
Production vs Potential and JTB (ton) vs Strategic Plan of the Marine and Fisheries MInistry

10
Source: Central Bureau of Statistics, Data on Fishery Household/Companies and Data of
Boats/Motorized Vehicles of Marine Fishery 2000- 2015
The contribution of the fishery sector, not only from capture fishery, towards state tax and non-tax
revenue is still below 1% of total state revenues.
Source: Presentation by Directorate General of Tax at the 115 Task Force even - 2 July 2017
The total amount of taxes paid by the fishery sector experienced an upward trend until 2015 where
it approached 1 trillion rupiah (941.8 billion rupiah) but in the following year decreased to 829.5
billion rupiah. Taxes obtained from the processing and trade sector were consistently the largest
2011 2012 2013 2014 2015
RT Perikanan 595,201 627,416 671,625 643,105 564,008
Kapal Motor 185,121 198,538 226,573 222,557 178,312
Perahu Motor Tempel 225,786 245,819 237,625 238,010 246,882
Perahu Tanpa Motor 170,938 172,333 175,510 165,066 143,135
- 100,000 200,000 300,000 400,000 500,000 600,000 700,000 800,000
Developement of Fishery Companies/Households and Fleets

11
contributors to the sector. Taxes from the capture fishery experienced its peak growth in 2014 but
declined in the following years.
Source: Presentation by Directorate General of Tax at the 115 Task Force event - 2 July 2017
The contribution of fishery taxes as shown in the graph above does not mirror the potential still
available. Based on the Directorate General of Taxes, there were 99,815 tax obligated actors,
consisting of 97,965 in the fishery business field classification (KLU)5 (Catch, cultivation, processing,
and trade) and 1,850 in the non-fishery business field classification. 6
From this data, the number of taxpayers who reported annual notices (SPT) has never exceeded 20%
from 2012 to 2016. In order, the percentage of taxpayers who reported annual notices were, 13.53%,
14.02%, 16.13%, 19.48%, and 18.81%.
When the non-fishery and fishery business field classifications are combined, with the assumption
that the characteristics of the taxpayers are similar, the estimate of potential fishery taxes is as shown
in the table below:
Simulation of Potential Fishery Tax Calculation
5 Business Field Classification 6 Directorate General of Tax, tax obliged (WP) fishery business field classification and WP non-fishery business field classification in every area, in Sumatera (27,312 WP – 472 WP), Jakarta (3,780 WP – 581 WP), Jawa Non-Jakarta (40,799 WP – 438 WP), Bali dan Nusa Tenggara (3,755 WP – 97 WP), Kalimantan (7,975 WP – 48 WP), Sulawesi (12,870 WP – 151 WP), Papua and Maluku (1,474 WP – 63 WP).
2011 2012 2013 2014 2015 2016
Perikanan Lainnya 238,600, 289,900, 391,200, 567,700, 780,500, 713,700,
Perikanan Budidaya 28,500,0 51,600,0 42,600,0 71,500,0 86,200,0 76,800,0
Perikanan Tangkap 18,900,0 44,600,0 69,300,0 90,900,0 75,100,0 49,000,0
-
100,000,000,000
200,000,000,000
300,000,000,000
400,000,000,000
500,000,000,000
600,000,000,000
700,000,000,000
800,000,000,000
900,000,000,000
1,000,000,000,000
Taxes from the Fishery Sector

12
Year
Taxpayers who did not report SPT
(1)
Taxpayer who
Reported SPT7 (2)
Total Taxpayers
Realization of Fishery Taxes
(3)
Potential Tax (1*3)/(2)
2012 86,310 13,505 99,815 386,100,000,000 2,467,552,091,817.85
2013 85,823 13,992 99,815 502,500,000,000
3,082,193,932,247.00
2014 83,710 16,105
99,815 730,100,000,000
3,794,887,985,097.80
2015 80,367 19,448
99,815 941,800,000,000
3,891,898,426,573.43
2016 81,035 18,780
99,815 839,500,000,000
3,622,411,208,732.69 Source: Processed from data of Directorate General of Tax at the 115 Task Force event - 2 July 2017
The potential tax numbers calculated in every year of the strategic plan exceeded 2 trillion rupiah.
When compared to its realization, then its percentage is 639%, 613%, 520%, 413%, and 431% of the
realization of taxes from the years assessed.
Evaluation of non-tax state revenues show that actual collections exceeded targeted amounts in 2011
and 2012. Afterwards, targets have failed to be reached. Realization of non-tax revenues from 2011
to 2017 in order is as follows, 123%, 144%, 92%, 87%, 14%, 52% and 18% in the first semester of
2017.
However, in 2016, there was a rise in fishery sector revenue collections to IDR 362,117,397, 236, an
increase of 457% from collections in 2015.
7Including the annual notices that were zero. Which were 40% of the annual notices received.

13
Source: LKPP (government procurement policy institute) (audited) 2011-2016, Realization report Semester I
2017
When the margin is calculated between targets and realization of non-tax state revenues, then in 6.5
years as much as 1,559,421,237,019 rupiah has been lost. Without accounting for the first semester
of 2017, the total loss amount to 785,121,237,019 rupiah.
Potential Losses of Non-tax State Revenues in the Fishery Sector (First Semester)
Year Target State Budget Realization Potential Losses
2011 150,000,012,000 183,802,161,080 (33,802,149,080)
2012 150,000,100,000 215,766,602,000 (65,766,502,000)
2013 250,000,094,000 229,350,562,720 20,649,531,280
2014 250,000,001,000 216,367,232,525 33,632,768,475
2015 578,796,000,000 79,271,014,420 499,524,985,580
2016 693,000,000,000 362,117,397,236 330,882,602,764
2017 950,000,000,0008 175,700,000,000 774,300,000,000 Total 3,021,796,207,000
1,462,374,969,981 1,559,421,237,019
Source: LKPP (government procurement policy institute) (audited) 2011-2016, appendix (2)
Presidential Regulation No.97/20169, Realization report Semester I 2017
8Specifically for 2017, State budgets were referred. For other years previous, Fishery state budgets were referred. 9 Presidential Regulation No. 97 of 2016 on the Details of the State Budget of the Fiscal Year 2017
APBN-P
Realisasi
APBN-P
Realisasi
APBN-P
Realisasi
APBN-P
Realisasi
APBN-P
Realisasi
APBN
APBN-P
Realisasi
APBN
Realisasi
2011 2011 2012 2012 2013 2013 2014 2014 2015 2015 2016 2016 2016 2017 2017
Pendapatan Perikanan 150,0 183,8 150,0 215,7 250,0 229,3 250,0 216,3 578,7 79,27 693,0 693,0 362,1 950,0 175,7
-
100,000,000,000
200,000,000,000
300,000,000,000
400,000,000,000
500,000,000,000
600,000,000,000
700,000,000,000
800,000,000,000
900,000,000,000
1,000,000,000,000
Comparisons in Non-Tax State Revenues form the Fishery Sector: Targets and Realization

14
The condition showed above illustrates state revenues from the fishery sector assessed nationally.
How about revenues in local regions? Specifically, at the provincial, regency/city level? Since the
introduction of the autonomy policy, the division of intergovernmental authorities in various fields
have been underlined, including in the field of marine fisheries. In this field, there are different
authorities granting permission that are controlled by the Regulation of Minister of Marine Affairs
Number 30 Year 2012 concerning Capture Fishery Business in Fishery Management Area of Republic
of Indonesia, lastly amended by Regulation of Minister of Marine Affairs of Fishery Number 54 Year
2014 regarding second amendment with Law Number 23 Year 2014 on Regional Government, as
shown below:
Division of Intergovernmental Authority in Marine Fishery
Division of Authority Base Regulation National Provincial Regency/Cities
Granting of Business
License, Fishing Permit,
Fishing Shipment
Permit
UU no.23/2014 Above 30 Gross
Tonnage (GT);
Under 30 GT,
using foreign
capital or
laborers.
5 – 30 GT
Regulation of the
Marine and Fishery
Ministry no. 30/2012,
amended by
Regulation of the
Marine and Fishery
Ministry 54/2014
Above 30 GT;
Under 30 GT,
using foreign
capital or
laborers.
10 – 30 GT < 10 GT
Management of Fishing
Areas
UU no.23/2014 Above 12 million
rupiah
0 - 12 million
rupiah
Regulation of the
Marine and Fishery
Ministry no 26/2014
Path III: above 12
mil
Path II : 4-12
million rupiah
Path I: <4 million
rupiah
Registration of Fishing
Vessels
UU no.23/2014 Above 30 GT 5 – 30 GT
Regulation of the
Marine and Fishery
Ministry no 23/2013
Above 30 GT;
Indonesian
vessels operating
in WWP NRI and
high seas
10 – 30 GT;
Indonesian
vessels operating
in WWP NRI
Domiciled in
provinces;
Operate in
provincial
< 10 GT;
Indonesian vessels
operating in WWP
NRI
Domiciled in
regency/city;

15
Division of Authority Base Regulation National Provincial Regency/Cities
management
areas
Operate in
regency/city
operation areas
Fish Auctions UU no.23/2014 - - Management and
Implementation
Source: UU No.23/201410, PermenKP 30/201211, Permen KP 23/201312, Permen KP 26/201413,Permen KP
57/201414
Based on these two tables, local governments will receive plenty of revenue from the marine capture
fishery sector from business service levies, especially from auction houses and certain licensing fees,
and from fishery business permits.
From the division of authority there are differences between provincial and district / city authorities.
Law Number 23 Year 2014 on Regional Government places the district / municipal governments only
authorized in relation to Fish Auction Sites (TPI) only. This resulted in the licensing authority moving
to the province.
In the division of authority, there are differences between provincial and district / city authorities.
Law Number 23 Year 2014 on Regional Government, district / municipal governments’ authorization
was only in Fish Auction Sites (TPI). This resulted in the authority of licensing being moved to the
provincial government.
However, the Ministry of Marine Fisheries still provides regencies/city governments with the
authority to regulate vessels less than 10 GT in size and with operations of zero to four miles from
the coastline. Therefore, it is necessary to conduct an exploratory assessment to see if appropriate
amounts of revenue are collected and to identify issues affecting revenue collections in local regions.
Objective This assessment study aims to:
1. Obtain a picture of governance of state revenue in local regions 2. Disclose potential state revenues and possible losses, modes and actors involved, especially
in the provincial and district / city governments.
10 Law No.23 of 2014 on Regional Government 11 Regulation of the Minister of Marine Affairs and Fisheries No.30 of 2012 on Capture Fishing Enterprises in Fishery Management Areas of the Republic of Indonesia 12 Regulation of the Minister of Marine Affairs and Fisheries No.23 of 2013 on Registration and Marking of Fishery Vessels 13 Regulation of the Minister of Marine Affairs and Fisheries No.26 of 2014 on FADs 14 Regulation of the Minister of Marine Affairs and Fisheries No.54 of 2014 on the Second Amendment of Ministry of Marine and Fishery Regulation No.30 of 2012.

16
3. Reveal the problems of marine capture fisheries, among others the practice of illegal levies
experienced by fishery / fishery business actors.
Scope Fishery represents all activities related to the management and utilization of fish resources and its
environment ranging from preproduction, production, processing to marketing implemented in a
fishery business system. The fishery sector and its production are generally known to be divided
into two sections, catch and aquaculture.
Capture fishery is the process of obtaining fish in waters that are not cultivated by any means. This activity includes the use of ships to load, transport, store, cool, handle, process, and / or preserve production. On the other hand, aquaculture of aquafarming is an activity to nurture, raise, and / or breed fish and harvest the results in a controlled environment, including activities that use ships to load, transport, store, cool, handle, process, and / or preserve the product. Capture fishery is further classified into sea capture and capture in rivers, lakes, or other bodies of water. The latter is known as catch in public waters/land. The scope of fisheries assessed in this study is as illustrated below.
The eight regencies/cities chosen as case studies is as follows:
1. Lampung Province and Bandar Lampung City. 2. Central Java Province and Kendal Regency. 3. East Java Province and Tuban Regency. 4. East Kalimantan Province and Samarinda City. 5. Central Sulawesi Province and Donggala Regency.
Marine & Fishery
Fishery Production
CaptureFishery
Marine Capture Fishery

17
6. South Sulawesi Province and Bulukamba Regency. 7. West Nusa Tenggara Province and East Lombok Regency. 8. Maluku Province and Ambon City.
Methodology In general, the chain of extraction of marine fish resources in the assessment has the following path:
The flow of revenue for marine fishery capture is as illustrated bellow:
Each revenue is assessed with the following framework to identify potential losses of revenue:
Taxpayer Businesses/Individuals
Income TaxState Budget
Tax
Taxpayer Businesses/Individuals
Property TxState Budget
Tax
Individuals/Businesses with vessles exceeding 30 GT
Fishery Business Levies (SIUP, SIKPI, SIPR)
Non-tax State Revenue
Individuals/Businesses with vessles exceeding 30 GT
Fishery Product LeviesNon-tax State
Revenue
Mandatory Levies, Business with vessels 10-30 GT
Retribution of Fishery Business License (SIUP, SIPI, SIKPI)
Local Revenues-Regency Budget
Mandatory Levies, Business with vessels< 10 GT
Retribution of Fishery Business License (SIUP, SIPI, SIKPI)
Local Revenues-Regency Budget
Mandatory Levy for Fish Sellers/Fisherman
Fish Auction RetributionLocal Revenues-Regency Budget
Mandatory Retribution for Fish Purchasers
Fish Auction RetributionLocal Revenues-Regency Budget
Start of Business
(Permissions)
Capture and Transportation of Marine Fish
Landing of Marine Fish

18
Methods used in this study are as follows:
1. Desk study 2. Interviews with Relevant Apparatus 3. Interview with Fishery Business Actors
Potential Revenue
Target Revenue
Realization of Revenue

19
Lampung Province and Bandar Lampung City
Description of Marine Fishery State Revenue Governance Waters in the Lampung province are located in WPP 572 and WPP 712. In 2015, the total size of
capture fishery production came to 157,969.02 tons from 9 of 14 regencies/cities. The largest
producers are located in East Lampung and South Lampung Regency whose waters are within WPP
712. Third largest producer is Bandar Lampung whose waters are in WPP 572. The full portrait can
be seen in the picture below.
Source: Lampung in Numbers 2016
Regulation of fishery revenue policy in the region is based on Provincial Regulation of Lampung No.
32 of 2014 on the Amendment to Local Regulation No. 3 of 2011 on Local Retribution and Local
Regulation of Bandar Lampung Number 7 Year 2011 on Specific Licensing Levies.15
Based on Lampung Decree No.32 / 2014, fishery business licensing tariffs are:
Fishery Business License Payments for Lampung Province
No. Permit Unit Tariff Validity Period
1 SIUP As long as the business operates
15 This study does not review government regulations of Bandar Lampung city, because the regulations specifying the tariffs was not obtained. This regulation was annulled by the Ministry of Home Affairs in 2016. However, a 2017 Constitutional Court verdict annulled the authority of the Ministry of Interior to cancel the district / city regulation,
15,557.89
38,465.44
40,951.30
2,416.19
12,406.35
8,095.14
801.40
12,005.77
27,269.54
Marine Fishery Production (ton) in Lampung 2015
Tanggamus Lampung Selatan Lampung Timur
Lampung Tengah Tulang Bawang Pesawaran
Mesuji Pesisir Barat Bandar Lampung

20
No. Permit Unit Tariff Validity Period
10-20 GT Per Vessel GT 10,000, -
20-30 GT Per Vessel GT 15,000, -
2 SIPI One year
10-20 GT Per Vessel GT 5,000, -
20-30 GT Per Vessel GT 10,000, -
30-60 GT Per Vessel GT 30,000, -
3 SIKPI One year
10-20 GT Per Vessel GT 5,000, -
20-30 GT Per Vessel GT 10,000, -
30-60 GT Per Vessel GT 30,000, -
Source: Provincial Law of Lampung No. 32 of 2014 on Amendment to Local Regulation No. 3 of 2011 on Local
Retribution
Although in this regulation the Lampung Provincial Government has the authority over fishery
business permits for vessels sized 30-60 GT, the Governor Regulation No. 41 of 2015 on the
Delegation of Authority in the Field of Licensing and Non-Licensing to the Regional Investment Board
and Integrated Licensing Service of Lampung Province has authority is over ship sizes 5-30 GT. The
authority over this range of ship sizes aligns the governor's regulation with Law No.23 of 2014 on
Regional Government.
Unlike Government Regulation No.75 of 2015 on Types and Tariffs of Non-Tax State Revenues
Applicable to the Ministry of Fisheries and Marine Affairs, the imposition of tariffs on fishery licensing
does not concern the type of fishing gear used.
The Provincial Government of Lampung also receives revenue from the Fish Auction (TPI) Levy at
Fishery Seaports (PPP) which are under its authority. There are 4 PPPs in the Lampung Province,
namely Kota Agung, Lempasing, Maringgai and Teladas. Of the four PPPs, only PPP Teladas does not
have a fish auction. Based on Bylaw No. 3 of 2011, the amount of payment due is 5% of the value of
fish auction established at that time.16
The object of levies are fish auction services and the utilization of fish auction places at seaports
managed by the provincial government. Other objects of subject to retribution as intended in
paragraph (1) include places contracted by Provincial Government from other parties to serve as an
16 See Article 62 of the Provincial Regulation No. 3 of 2011 on Regional Retribution. This Article has not been amended by Provincial Regulation No. 32 of 2014 on Amendment to Local Regulation No. 3 of 2011.

21
auction place. Exempted from the levies referred to in paragraph (1) are, auction places provided,
owned, and/or managed by the state-owned enterprises, enterprises, and private parties.
All production from capture fishery has to be marketed as auctions in TPIs (Auction Houses) in
Coastal Fishery Seaports or other fish auctions that have been assigned with the exception of:17
1. Production of marine fishery capture amounting to less than 10 kg or for individual use. 2. Fish capture for research or sport purposes. 3. Products of garden fishermen using cantrang.
Potential Revenues and Losses, Modes, and Actors Involved The field research conducted for this study had difficulty finding profiles of taxpayers. Vertical
organization of the Directorate General of Taxation in Lampung is the Regional Office of Bengkulu
and Lampung which is located in Bandar Lampung City. Interviews conducted with fishery business
actors did not provide a complete picture of the businesses (income and production costs per year),
making it impossible to estimate the amount of revenue that would be owed.
Estimating the amount of business license revenue owed had another set of challenges due to
incomplete data and the absence of details on ship size.
Number of Permits Issued by the Provincial Government of Lampung
No. Permit 2013 2014
1 SIUP 29 39
2 SIPI 166 162
3 SIKPI 22 26
Source: Governor of Lampung Monitoring and Evaluation National Movement for the Rescue of Natural
Resources in the Marine sector, 20-21 April 2015
Data on auction house (TPI) payments were only obtained from TPI Lempasing. Detailed data from
TPI Kota Agung and TPI Maringgai were not obtained. Potential auction house payments, based on
estimated based on data from TPI Lempasing and an assumption that the production value is equal
to the auction price, are illustrated in the table below:
Production of Lempasing Fishery Port of and Simulation of TPI Levy 2016
Month Volume (kg) Production Value (IDR)
5% * Auction Value
January 35,770 444,639,174 22,231,958.70
February 26,303 353,950,345 17,697,517.25
March 35,848 463,981,496 23,199,074.80
April 55,514 775,217,480 38,760,874.00
17 See article 60, idem

22
Month Volume (kg) Production Value (IDR)
5% * Auction Value
May 47,152 645,694,300 32,284,715.00
June 54,320 605,205,600 30,260,280.00
July 23,415 302,252,600 15,112,630.00
August 15,231 198,324,250 9,916,212.50
September 21,108 231,900,810 11,595,040.50
October 27,169 302,000,150 15,100,007.50
November 32,522 425,968,450 21,298,422.50
December 23,571 284,627,275 14,231,363.75
Total 397,923 5,033,761,930 251,688,096.50
Source: Data of Lempasing Fishery Port Production
In 2015, the production of Lampung’s capture fishery was 157,969.02 tons. If the total amount
produced in 2016 is equal to 2015, its production value is equal to Leasing’s auction house in 2016,
and all production is assumed to go through the auction house, the revenue potential in 2016 equals
(157,969,02 / 397,923) * 251,688,096.5 = IDR 99,916,119.324.016.
The production calculated above is 177 times larger than the realization of revenues in 2015 as seen
in the following diagram:
Source: Assessment Report of LKPD Lampung Province 2015, 201618
The amount of revenue from TPI levies can still be doubled, this is because fishery product landing
points in the Lampung province is not only at Coastal Fishery Seaports. There are at least 28 large
points with many ships gathered and dozens of other small points along the coast of Lampung. In
As previously mentioned, without the details of ship size in GT, it is difficult to understand the
potential for increasing revenue collections from fishery business license payments. The above
18 This document was obtained by issuing an application of KIP (Kartu Indonesia Pintar) to BPK-RI.
2015 realisasi 2016 2016 realisasi
Series1 565,054,890 798,482,000 369,610,400
Series2 45,225,000 84,500,000 23,190,000
Retribution of TPI and FIshery Permits in the Lampung Province

23
diagram can only illustrate the low realization of revenues in 2016, which was only 27.4% of the
target and that was lower than the amount collected in 2015.
In addition, thousands of FADs (fish aggregating device) installed along the coast of Lampung and the
head supervisor was certain that they were installed without a permit. Several of these FADS were
installed approximately 30 km offshore by foreign companies dealing in yellow fin tuna. These
vessels originate from Thailand and go back to Thailand without reporting to local Indonesian
government. These FADs costs anywhere between 150 and 300 million, are invisible from the
surface and are placed for one year before being brought back up.

24
Central Java Province and Kendal Regency
Description of Marine Fishery State Revenue Governance Waters to the north of the Central Java Province are part of WPP 712, meanwhile waters to the south
of the province are part of WPP 573. In 2015, marine capture fishery produced 325,840.8 ton.
Production was largest in the waters of WPP 712, which include Tegal, Rembang, Pati, and Batang.
In that year the Kendal Regency only produced 1,456.8 tons. The production of marine fishery in
Central Java came from 17 out of 35 regencies/cities. Details are provided below:
Source: Central Java in Numbers 2016
Production records from the Central Bureau of Statistics (BPS) Kendal showed production numbers
that were higher than those shown in BPS Central Java (1,858.9 tons) originating from five TPIs. The
margin between these two sources was 401.1 tons.
Source: Kendal in Numbers 2016
14,404.80 3,532.80 186.00
77.10
66,743.80
52,804.60
9,295.20
15,035.90 1,456.80 28,046.90
2,929.10 27,507.60 1,258.40
8,768.30 513.70
17,335.20
75,944.60
Production of Marine Fishery in Central Java (tons)
Cilacap Kebumen Purworejo Wonogiri Rembang Pati
Jepara Demak Kendal Batang Pekalongan Pemalang
Tegal Brebes Semarang Pekalongan Tegal
201.93
96.37
64.36
545.82 950.43
Marine Fishery Production in Kendal Regency (2016)
TPI Karang Sari TPI Tanggul Malang TPI Bandengan
TPI Tawang TPI Sendang Sikucing

25
State revenues data for the Central Java Province and Kendal Regency reflect individual and business
taxpayers that were classified as capture fisheries. Taxes paid include income and property taxes.
Businesses and individuals with vessels exceeding 30 GT paid non-tax revenue fees such as Fishery
Business Fees (PPP) from SIUP (business license), SIKPI (Fishing Vessel Permit), and/or SIPR
(Advertising License Permit) and Fishery Product fees (PHP) from SIPI (Fishing Permit).
Businesses and individuals with vessels in the range of 10-30 GT and engines of 30-90 horse power
are regulated by Regional Regulation of Central Java Number 1 Year 2011 on Regional Retribution
and Regulation of Central Java Governor Number 24 Year 2014 on the Changes of Levy Rates. 19 These
actors pay for Capture Fishery Business Licenses under the Specific Licensing Levies and under
conditions detailed in the table below:
Payments for Capture Fishing Permits in Central Java Province
No. Type of Permit Unit Tariff Duration of Validity:
1 SIUP 10-30 GT with
engines of 30-90 HP
(Horse Power)
Per Vessel GT 10,000, - A long as business operates, (no
changes made in scale of business)
2 SIPI 10-30 GT with
engines of 30-90 HP
Valid for three years, annual payment
Purse Seine Per Vessel GT 10,000, -
Gill Net Per Vessel GT 8,000, -
Cantrang Per Vessel GT 20,000, -
Long Line Per Vessel GT 15,000, -
Bottom Long Line Per Vessel GT 15,000, -
Lift Net Per Vessel GT 15,000, -
Bubu (Rajungan net) Per Vessel GT 5,000, -
Bagan Per Vessel GT 5,000, -
Squid Nets Per Vessel GT 20,000, -
Other gear Per Vessel GT 10,000, -
3 SIKPI 10-30 GT with
engines of 30-90 HP
Per Vessel GT 10,000, -
Source: Regional Regulation Central Java No.1/2011, Governor Regulation Central Java No.24/2014
19 This regulation is amended by Regional Regulation Number 10 Year 2014, but in relation to fishery business no matters were changed. Perda Jateng No.1 / 2011 includes a regional regulation of 3,143 provincial / regency / municipal regulations that was canceled by the Ministry of Home Affairs on June 21, 2016. However, the Constitutional Court through Decision Number 137 / PUU-XIII / 2015, dated April 5, 2017, annulled the unconstitutional district / city regulation and through Decision No. 56 / PUU-XVI / 2016, dated June 14, 2017, and declared the authority of the government to cancel provincial regulations against the 1945 Constitution. See http://nasional.kompas.com/read/2017/06/14/22392261/ putusan.mk.cabut.kewenangan.mendagri.batal- kan. perda. Thus, the researchers drew the conclusion that Perda Jateng No.1 / 2011 is still valid.

26
Not all revenues from the payment of fishery business permits go into regional income and
expenditure budgets (APBN) of Central Java; 25% are distributed to regencies/cities and the
province receives 75% of the revenue.
There are certain licensing levies that apply in the Kendal Regency, such as the Fishery Business
License for businesses with vessel sized > = 5 - 10 GT and the fish auction levy (TPI). Both types of
levies go to revenue stations in the Kendal Regency budget.
Payments of Capture Fishery Business Permits in Kendal Regency
No, Permit Type Unit Tariff Duration of
Validity
1 IUP with vessels >=5 – 10 GT Per Vessel 40,000, - As long as
business
operates
2 SIPI with vessels >=5 – 10 GT
Rawe, Cantrang, Gill Net Per Vessel 30,000, - 1 year
Mini Purse Seine, Ampera Per Vessel 35,000, - 1 year
Other capture gear Per Vessel 25,000, - 1 year
3 SIKPI >=5 – 10 GT Per Vessel 25,000, - 1 year
Source: Government Regulation of Kendal Regency No.9/2011 on Certain Permit Retributions20
All products of marine fishery capture in local regions must be auctioned in auction houses (TPI),
except for amounts used by the fisherman and his or her family.21 Based on Regional Regulation of
Kendal Regency No.10/ 2010 on Management and Retribution of Fish Auction Houses in Kendal
District, TPI levy is set at 1% of the sale and purchase transaction value of the auctioned fish. A total
of 0.4% comes from fish / fish sellers and 0.6% of fish buyers .22
Potential Revenues and Losses, Modes and Actors Involved The field research conducted for this study had difficulties in finding profiles of taxpayers. Vertical
organization of the Directorate General of Taxation in Lampung is the Regional Office of Bengkulu
and Lampung which is located in Bandar Lampung City. Interviews with fishery businesses did not
provide a complete picture of their business, such as income and production costs per year, making
it impossible to estimate that the amount of revenue that would be produced.
The revenue from fishery business license levies in the Central Java province did not provide a
complete profile of fishery businesses.
20 http://pdrd.kendalkab.go.id/index.php/retribusi/13-retribusi-perijinan-tertentu/44-retribusi-izin-usaha-perikanan 21 Paragraph 5, Regional Regulation of Kendal Regency No.10/2010 on Management and Retribution of Fish Auction Place in Kendal Regency 22 Paragraph 19 Regional Regulation of Kendal Regency No.10/2010 on Management and Retribution of Fish Auction Place in Kendal Regency

27
Number of Vessels Based on Size and Fishing Gear of Ships sized 10-30 GT in Central Java
2014
No. Size (GT) Number of Ships Capture Equipment Amount
1 < 5 16.823 N/A N/A
2 5 – 10 4.696 N/A N/A
3 10 – 30 2.595 Vessel 82
Bagan 12
Bottom Long Line 114
Cantrang 1213
Dogol 1
Gill Net 187
Squid Net 65
Long Line 186
Mini Purse Seine 651
Purse Seine 83
Trammel Net 1
4 >30 840 N/A N/A
Total 24.954
Source: Governor of Lampung Monitoring and Evaluation National Movement for the Rescue of Natural
Resources in the Marine sector, 19 May 2015
The difficulty of calculating the fishing permit levy that should be paid by vessels sized 10-30 GT is
due to by the absence of details on the size of the GT for each vessel. Details are needed because the
Central Java Provincial Government uses units per GT to perform calculations. SIUP also cannot be
calculated for the data above because it is not known how many of the 2,595 ships in 2014 are
new/changed SIUP.
Crude calculation can still be conducted for SIPI and SIKPI. Assuming the GT size of each vessel is 20
GT (the mid-point of the 10-30 GT classification), then the payment due for these two permits would
be follows:
Simulation of Potential Payments from Fishery Business Permits for Vessels Sized 10—30 GT
in Central Java 2014
Fishing Equipment Number of Ships Size in GT Tariff Potential Payments
Vessel 82 20 10,000 16,400,000
Bagan 12 20 5,000 1,200,000
Bottom Long Line 114 20 15,000 34,200,000
Cantrang 1,213 20 20,000 485,200,000
Dogol 1 20 10,000 200,000
Gill Net 187 20 8,000 29,920,000
Squid Net 65 20 20,000 26,000,000
Long Line 186 20 15,000 55,800,000

28
Fishing Equipment Number of Ships Size in GT Tariff Potential Payments
Mini Purse Seine 651 20 10,000 130,200,000
Purse Seine 83 20 10,000 16,600,000
Tramel Net 1 20 10,000 200,000
Total 795,920,000
Source: Hasil Olahan, 2017
From the above simulation, the potential revenue from these two permits in 2014 is IDR 795,920,000.
By law, 75% of the revenue goes to Central Java’s regional income and expenditure budget, equal to
IDR 596,940,000 and the rest would be distributed to various regencies/cities in Central Java.
Based on the assessment report on LKPD of Central Java in 2015 and 201, there was potential
revenue in the form of levies from auction houses of 4,185,248,718 rupiah. This levy is due because
of the province’s authority over auction houses until 31 December 2009. At the start of 2010, that
authority was passed down to the regency/city level.
In was difficult to calculate payments due from fishery business permits in the authority of Kendal
regency, which include businesses with vessels sized 5-10 GT due to incomplete data. The only data
collected was:
Number on Fishing Vessels in Kendal Regency (2015)
No. TPI Motor Ships Tempel Vessels Amount
1 Tawang 31 706 737
2 Sendang Sikucing - 95 95
3 Tanggul Malang - 162 162
4 Bandengan - 459 459
5 Karangsari - 116 116
Source: Department of Marine and Fishery of Kendal Regency
From the 31 motor ships accounted for, none had detailed data on their size, therefore making it
difficult to determine amount that was owed.
At this moment, a new regulation gave the authority over vessels sized 2-7 GT to the regency of
Kendal. This authority only applies to the registration vessels and not for the issuing of permits.
Meanwhile fishing vessels exceeding seven GT are within the authority of the province.23 This
development most like results in a decrease in the amount that is paid to the Regency of Kendal.
23 Interview with Jasmani, Fisherman Development Division Section Department of Fisheries and Marine Kendal, 26 Mei 2017.

29
From the various data acquired, it is still not possible to calculate the amount owed from auction
houses. With the assumption that the production value of capture fishery in auction houses are equal
to the auctioned value, potential revenue collections are as follows:
Target, Realization, and Simulation of Potential Auction House Payments in Kendal
Year Target Realization Production Value in Auction House (TPI)
Potential Payment (1%*production
value)
2014 N/A N/A 16,977,765,000 169,777,650
2015 110,250,000 139,649,540 14,075,201,000 140,752,010
2016 110,750,000 215,763,160 N/A N/A
2017 125,000,000 80,901,980 11,750,925,000 117,509,250
Source: Production Value of marine fishery sold in TPI from 2014 to 2015, Report on TPI production in Kendal
April 2017, Document of Target and Realization 2015-2017
In 2015 and 2016, the collection targets for TPI were both achieved. But compared to potential
collections - 1,102,570 rupiah in 2015 - there is still a large disparity.
In 2017, even though the potential payments owed were lower than the target, this is because data
is only available through the month of April. Therefore, there is a large possibility that the potential
payments will increase in the remaining 8 months of 2017 production.
Potential losses from auction house payments occur because of the absence of department officials
to supervise auctions and agreed upon auction prices. Changes in auction prices surely affect the
amount of retribution collected for the regional income and expenditure budget of Kendal Regency.
Department officials rely on the reports of the Village Unit Cooperative (KUD) Mina Jaya Kendal as
the management authority of the auction house to calculate retribution.24 Houses conduct auctions
three times a day, at 09.00, 13.00, and at night.25
In addition, tradesmen or sellers often delay payments and owe these fees after purchasing fish.
There are even tradesmen who end up not paying the fee.26 The department of marine and fishery
has no power to overcome this issue. This issue surely decreases the amount of payments collected.
Some of the lost Auction House payments are due to fishermen who don’t land their products at the
auction house. This is most likely caused by the debts they have to tradesmen and therefore handover
their products straight to the tradesmen. This causes the production of the auction house to decrease.
24 Interview of assessor with Hudi Sambodo, Head Fishery Division, Department of Marine and Fishery Kendal Regency, May 24 2017 25 Interview of assessor with Sugeng, Head of Mina Agung Sejahtera Group, May 22 2017 26 Interview of assessor with Joko Suharno, TPI Division Department of Marine and Fishery Kendal, 26 Mei 2017
30
Other potential sources of revenue are from Fish Aggregating Devices (FADs). FADs are typically
used by non-local people that have more assets than traditional fishermen. Unfortunately, FADs are
not regulated by regional authorities.
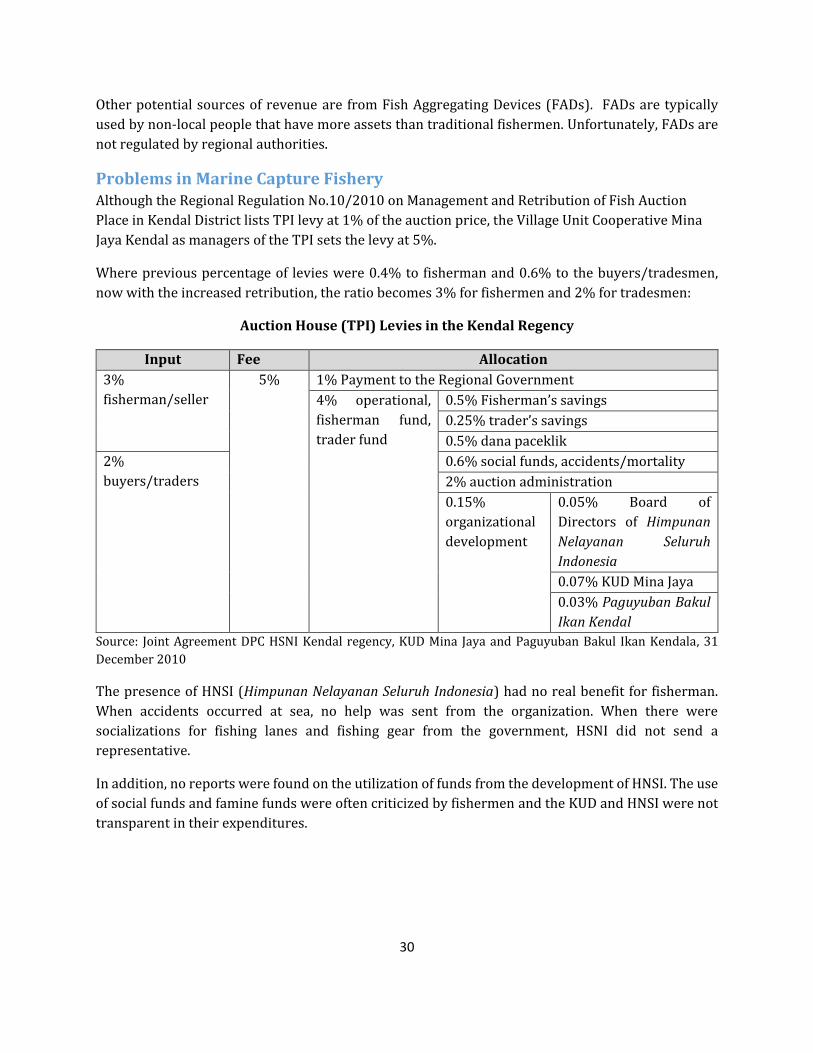
Problems in Marine Capture Fishery Although the Regional Regulation No.10/2010 on Management and Retribution of Fish Auction
Place in Kendal District lists TPI levy at 1% of the auction price, the Village Unit Cooperative Mina
Jaya Kendal as managers of the TPI sets the levy at 5%.
Where previous percentage of levies were 0.4% to fisherman and 0.6% to the buyers/tradesmen,
now with the increased retribution, the ratio becomes 3% for fishermen and 2% for tradesmen:
Auction House (TPI) Levies in the Kendal Regency
Input Fee Allocation
3%
fisherman/seller
5% 1% Payment to the Regional Government
4% operational,
fisherman fund,
trader fund
0.5% Fisherman’s savings
0.25% trader’s savings
0.5% dana paceklik
2%
buyers/traders
0.6% social funds, accidents/mortality
2% auction administration
0.15%
organizational
development
0.05% Board of
Directors of Himpunan
Nelayanan Seluruh
Indonesia
0.07% KUD Mina Jaya
0.03% Paguyuban Bakul
Ikan Kendal
Source: Joint Agreement DPC HSNI Kendal regency, KUD Mina Jaya and Paguyuban Bakul Ikan Kendala, 31
December 2010
The presence of HNSI (Himpunan Nelayanan Seluruh Indonesia) had no real benefit for fisherman.
When accidents occurred at sea, no help was sent from the organization. When there were
socializations for fishing lanes and fishing gear from the government, HSNI did not send a
representative.
In addition, no reports were found on the utilization of funds from the development of HNSI. The use
of social funds and famine funds were often criticized by fishermen and the KUD and HNSI were not
transparent in their expenditures.

31
When fishermen had no knowledge of the process for obtaining a permit from the government, HSNI
member (Secretary of KUD Mina Jaya) took the opportunity to become the middle man in the process
and asked for a fee ranging from IDR 1 – 2.5 million.27
Traditional fishermen often compete with large businesses with large vessels. The division of
exploitation areas and paths are not regulated strictly and therefore are often not followed.
Fishermen also feel that they have no bargaining power at the time of auction. When the supply of
fish is abundant, prices will fall. There is hope however, as the government provides cold storage to
accommodate the catch when price falls. Currently, the cooling machines are owned by fish traders.
Obtaining a stock of ice for fishermen to maintain the freshness of fish is still a challenge. The need
for ice blocks, usually around 20 tons per day, is still supplied by other regions. The same can be said
for fuel for the fisherman’s vessels.28
When exposed to operations by officials at sea, the fishermen have to spend IDR 2 -3 million to avoid
being cited. That number becomes tens of millions, if the fisherman is subject to a joint operation
involving several law enforcement officers. Usually the fishermen are affected because of the illegal
use of bolga, which is forbidden because of tight mesh captures small fish. 29 In addition, the use of
light to help catch fish is also exposes fishermen to officials’ operations, as they are easily identified.
Even though fisherman with vessels under 5 GT are not obliged to make payments of retribution,
they are often subject to fees imposed by government officials. There is not much they can do as they
do not have a complete knowledge of the regulations in place.
Findings From the above study, several findings can be concluded:
1. The regulation of authority of Central Java Province and Kendal Regency in the permitting of fishing vessel has not followed Law No.23 / 2014 on Regional Government.
2. The retribution fishery business licenses in Central Java Province uses the unit per GT of the ship while in Kendal regency uses number of ships as a unit. However, both consider types of fishing gear utilized as a major determinant of retribution.
3. Calculated from the available data, the potential of SIPI and SIKPI levies of Central Java Province in 2014 is IDR 795,920,000.
4. Calculated from the available data, the potential retribution of TPI Kendal regency in 2015 was IDR 1,102,470.
5. Fisherman in the Kendal regency have low bargaining powers.
27 Interview of assessor with Sugeng, Head of Mina Agung Sejahtera group, 22 Mei 2017 28 Idem 29 Description of Bolga, https://visitmodem.wordpress.com/tag/alat-tangkap/

32
East Java Province and Tuban Regency
Description of Marine Fishery State Revenue Governance The territorial waters of Central Java are governed in WPP 712 (Java Sea), stretching along the north
coast and Madura, and WPP 573 (Indian Ocean) in the southern coast from Pacitan to Banyuwangi.
Eastern regions of Banyuwangi also enter in WPP 713 (Sulawesi Straight). The waters of Tuban enter
WPP 712.
In 2015, the production of marine capture fisheries in East Java reached 395,930 tons. From the 38
regencies/cities in East Java, only 21 contributed to the production of marine capture fishery. Jember
Regency and Lamongan Regency had the highest contributions and are located in WPP 573 and WPP
712 respectively.
Source: East Java in Numbers (2016)
The Tuban Regency ranks fourth in marine fishery production behind the Banyuwangi Regency with
31,419.6 tons. Similar to East Java, not all districts in Tuban produces marine fishery. In the 20
districts located in Tuban regency, only 5 are engaged in marine fishery production. The largest is in
the district of Palang, followed by Bancar district.
When observed further, there are striking differences between production numbers recorded by
provincial and regency Central Bureau of Statistics (BPSs). The BPS of Tuban recorded 2015 marine
6,529.50
12,144.40
1,020.10
1,943.10
9,209.10
3,032.20 92,231.60
37,175.80
7,104.00
17,678.70 8,405.40 14,410.20
31,419.60
80,360.70
11,066.40
22,915.70
7,268.40
4,503.40 8,503.10 15,165.70
3,842.90
Marine Fishery Production in East Java (2016)
Pacitan Trenggalek Tulungagung Blitar
Malang Lumajang Jember Banyuwangi
Situbondo Probolinggo Pasuruan Sidoarjo
Tuban Lamongan Gresik Bangkalan
Sampang Pamekasan Sumenep Kota Probolinggo
Kota Pasuruan

33
capture fishery production of 10,010.07, reflecting a disparity of 21,409.53 between provincial and
regency data.
Source: Tuban regency in Numbers 2016
Findings Based on the above study, several findings can be made:
1. Capture fishery retribution in East Java Province is only related to the installation of FADs. While SIUP, SIPI and SIKPI are not charged.
2. The division of authority of East Java Province and Tuban Regency related to the size of fishing vessel handled, is in accordance with Law No.23 of 2014 on Regional Government.
3. In TPI Palan, the fish auction process is conducted privately, making it susceptible to manipulation of the numbers of auctioned fish and auction value.
4. In TPI Bulu, fish sellers (skipper) and buyers (middleman) do not want conduct in auctions
and do not pay TPI levies. Debts in 2017 have amounted to IDR 400,000,000.
5,142.09
238.89 263.78
1,096.71
3,268.60
Produksi Perikanan Laut (ton) Tuban 2015
Palang Tuban Jenu Tambakboyo Bancar

34
East Kalimantan Province and Samarinda City
Description of Marine Fishery State Revenue Governance The territorial waters of East Kalimantan province are located in WPP 713 (Makassar Straight). In
2015, the BPS recorded production of marine capture fisheries in East Kalimantan amounted to 9,940
tons. Samarinda city contributed to 9,679.8 which originated from 5 out of the 10 districts.
Source: Samarinda in Numbers (2015)
Payments by Capture Fisheries in East Kalimantan
No. Permit Type Unit Tariff Duration of Validity
1 SIUP – Individual Per business 150,000, - As long as business is in operation
2 SIUP - Company Per business 200,000, - As long as business is in operation
3 SIPI >10 – 30 GT
(Regulation of
the Governor)
Per GT 10,000, - 1 year
4 SIKPI >10-30 GT
(Regulation of
the Governor)
Per GT 10,000, - 1 year
Source: East Kalimantan Regional Regulation No.3 / 2012 on Specific Licensing Levy, Regulation of the
Governor No.15 / 2012 on the Change of Route License Rate and Tariff of Fishery Business License
2,865.20
948.60
3,145.90
513.20
2,206.90
Marine Fishery Production in Samarinda (2015)
Palaran Samarinda Ilir Samarinda Seberang Loa Janan Ilir Sambutan

35
Payments by Capture Fisheries in Samarinda City
No. Permit Type Unit Tariff Duration of
Validity
1 SIUP
- 5 to 7 GT Per business 1,000,000, - 20 years
- 8 to10 GT Per business 2,000,000, - 20 years
2 SIPI 5 to 10 GT Per business 500,000, - 2 years
3 SIKPI 5 to 10 GT Per business 500,000, - 2 years
Source: Regional Regulation of Samarinda City No.15/2011 on specific licensing payments
Fish sale payments were 2% of product sales revenue.30 Every vessel and vehicle that brought
products to be marketed in Samarinda were mandated to land in the Selili fish landing base (PPI). All
sales and purchases had to be made in Selili, except for products of fishery capture that were made
for the purpose of sport or research.31 Payments exclude auction places provided, owned, and/or
managed by Regional Owned Enterprises (BUMD) and private parties.32
Potential Revenue Losses, Modes and Actors Involved Marking down the size of fishery vessels often occurred and is known as GT stealing. Vessels with a
size of 50 GT would frequently report at 30 GT.33 Unfortunately, it cannot be estimated how large this
mode is prevalent among license holders. However, this mode of manipulation surely decreases local
revenues.
Licensing data obtained were incomplete and did not contain the details of the size of each vessel,
which is a key variable in calculating payments owed. To simulate its potential, it was assumed that
the size of ships was 20 GT as the midpoint between the 10-30 GT classification which was under the
authorization of East Kalimantan Regency.
Data of Permit Owners in East Kalimantan and Simulation of Potential Payments (2016)
No. Permit Type Amount Size in GT Tariff Potential
Payments
Target Local
Expenditure
Budget
1 SIUP – Individuals 93 - 150,000 13,950,000
30 Paragraph 8, Regional Regulation Samarinda City No.6/2010 on Retribution of Fishery Auction 31 Paragraph16, idem 32 Paragraph 3 article 3, idem 33 Wawancara of assessor with Andar Jongvessel skipper and fisherman in TPI Selili, 26 May 2017.

36
2 SIUP - Perusahaan 0
3 SIPI >10 – 30 GT 87 20 10,000 17,400,000
4 SIKPI >10-30 GT 92 20 10,000 18,400,000
Total 34,090,000 24,500,000
Source: List of East Kalimantan Permit Owners January to December 2016, APBD 2016
From the above calculations, potential payments amounted to IDR 34,090,000. Meanwhile, Levy of
Private Fishery Business License in the Regional Budget of East Kalimantan 2016 was 24,500,000.
This means that the target set in 2016 is IDR 9,590,000, lower than the existing potential.
Findings Based on the study above, it can be concluded that:
1. The division of authority in the Province of East Kalimantan and the City of Samarinda is based on the size of fishery vessels does not yet follow Law No.23 of 2014 on Regional Government.
2. The unit for calculations of fishery permit retribution in East Kalimantan is based on ship size in GT while the City of Samarinda uses number of ships as its unit.
3. Based on the simulation of potential retribution, East Kalimantan is likely to increase the potential revenues by IDR 9,590,000 in 2016.

37
Central Sulawesi Province and Donggala Regency
Description of Marine Fishery State Revenue Governance The territorial waters of Central Sulawesi are located divided in WPP 713 (Sulawesi Straight), WPP
715 (Tomini Bay), and WPP 716 (Sulawesi Sea). Production of marine capture fisheries in 2015
reached 174,794.2 tons. In that year, all regencies/cities contributed to the production of marine
capture fishery except for the Sigi regency. Production exceeding 20,000 tons was achieved in the
regencies of Banggai Islands (WPP 715), Tolotoli (WP 716), Parigi Moutong (WP 715), and Poso (WP
715). The regency of Donggala, with territorial water in WPP 713, was ranked fifth with production
of marine capture fishery reaching 17,996.8 tons.
Source: Central Sulawesi in Numbers (2015)
With similar numbers as those recorded by BPS of Central Sulawesi, BPS of Donggala recorded
production of Marine Capture Fishery of 17,995 which originated from 14 districts. Only two districts
in Donggala did not contribute to marine fishery production, the districts of Rion Pakava and
Pinembani.
32,917.80 6,708.20
11,597.40
23,494.20
17,996.80
25,830.80
13,241.50
24,602.60
9,900.50 2,691.60 3,000.90
2,811.90
Marine Fishery Production (tons) in Central Sulawesi (2015)
Banggai Kepulauan
Banggai
Morowali
Poso
Donggala
ToliToli
Buol
Parigi Moutong
Tojo Una-Una
Banggai Laut

38
Source: Donggala Regency in Numbers (2015)
Payment of Fishery Business Permits in Central Sulawesi
No. Permit Type Unit Tariff Duration of Validity
1 SIUP Per Business 500,000 As long as business operates
2 SIPI
Capture fishery vessel with
purse seine fishing gear, 10 GT
Per vessel 450,000 1 year
15 GT Per vessel 675,000 1 year
20 GT Per vessel 900,000 1 year
25 GT Per vessel 1,125,000 1 year
30 GT Per vessel 1,350,000 1 year
Pole and Line Vessel 10 GT Per vessel 1,320,000 1 year
15 GT Per vessel 1,500,000 1 year
20 GT Per vessel 2,000,000 1 year
25 GT Per vessel 2,500,000 1 year
30 GT Per vessel 3,000,000 1 year
Capture Fishery Vessel with
other fishing gears, 10 GT
Per vessel 300,000 1 year
15 GT Per vessel 450,000 1 year
20 GT Per vessel 600,000 1 year
25 GT Per vessel 750,000 1 year
30 GT Per vessel 900,000 1 year
3 SIKPI Per vessel 500,000 1 year
Source: Regional Regulation Central Sulawesi No.1/2012 on Payment of Certain Licenses34
34http://www.jdih.sultengprov.go.id/peraturan/(%20NOMOR%2001%20TAHUN%202012%20)%20RETRIBUSI%20PERIZINAN%20TERTENTU.pdf
3,150.00
1,220.00
1,033.00
162.00
589.00
182.00
1,014.00
1,263.00
2,151.00
2,127.00
2,024.00
884.00
846.00
1,350.00
Marine Fishery Production in Donggala Regency (2015)
Banawa
Banawa Selatan
Banawa Tengah
Labuan
Tanantovea
Sindue
Sindue Tombusabora
Sindue Tobata
Sirenja
Balaesang
39
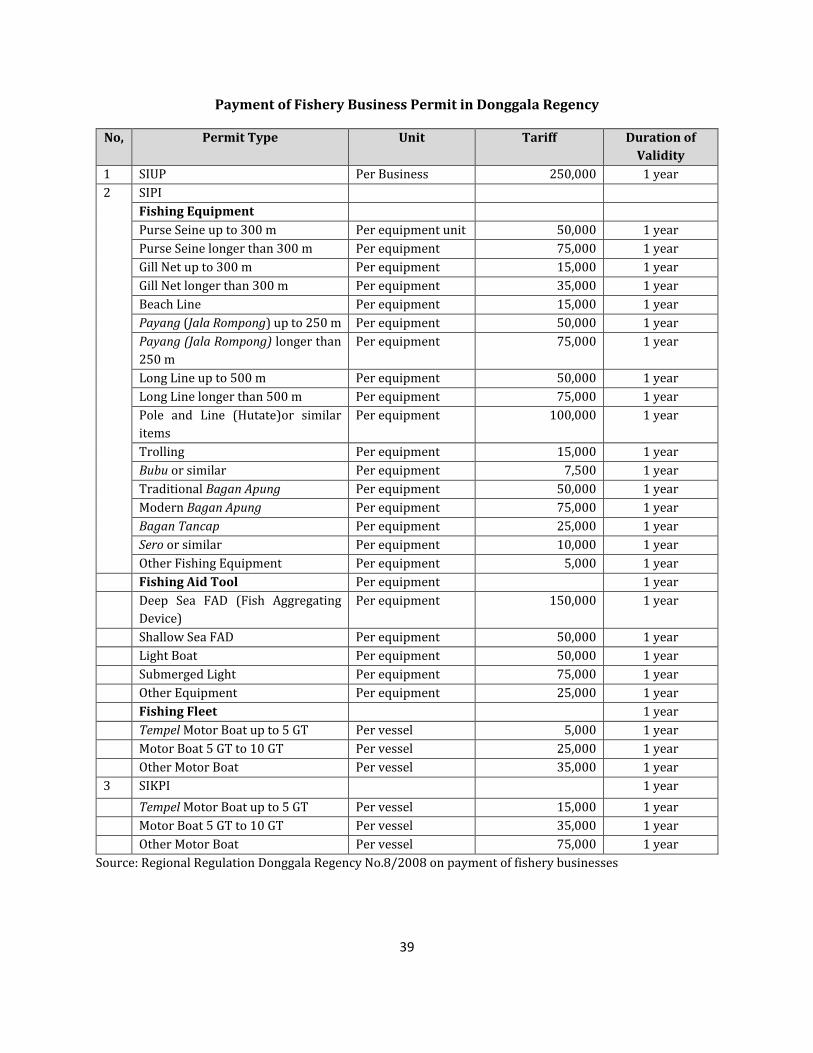
Payment of Fishery Business Permit in Donggala Regency
No, Permit Type Unit Tariff Duration of
Validity
1 SIUP Per Business 250,000 1 year
2 SIPI
Fishing Equipment
Purse Seine up to 300 m Per equipment unit 50,000 1 year
Purse Seine longer than 300 m Per equipment 75,000 1 year
Gill Net up to 300 m Per equipment 15,000 1 year
Gill Net longer than 300 m Per equipment 35,000 1 year
Beach Line Per equipment 15,000 1 year
Payang (Jala Rompong) up to 250 m Per equipment 50,000 1 year
Payang (Jala Rompong) longer than
250 m
Per equipment 75,000 1 year
Long Line up to 500 m Per equipment 50,000 1 year
Long Line longer than 500 m Per equipment 75,000 1 year
Pole and Line (Hutate)or similar
items
Per equipment 100,000 1 year
Trolling Per equipment 15,000 1 year
Bubu or similar Per equipment 7,500 1 year
Traditional Bagan Apung Per equipment 50,000 1 year
Modern Bagan Apung Per equipment 75,000 1 year
Bagan Tancap Per equipment 25,000 1 year
Sero or similar Per equipment 10,000 1 year
Other Fishing Equipment Per equipment 5,000 1 year
Fishing Aid Tool Per equipment 1 year
Deep Sea FAD (Fish Aggregating
Device)
Per equipment 150,000 1 year
Shallow Sea FAD Per equipment 50,000 1 year
Light Boat Per equipment 50,000 1 year
Submerged Light Per equipment 75,000 1 year
Other Equipment Per equipment 25,000 1 year
Fishing Fleet 1 year
Tempel Motor Boat up to 5 GT Per vessel 5,000 1 year
Motor Boat 5 GT to 10 GT Per vessel 25,000 1 year
Other Motor Boat Per vessel 35,000 1 year
3 SIKPI 1 year
Tempel Motor Boat up to 5 GT Per vessel 15,000 1 year
Motor Boat 5 GT to 10 GT Per vessel 35,000 1 year
Other Motor Boat Per vessel 75,000 1 year
Source: Regional Regulation Donggala Regency No.8/2008 on payment of fishery businesses

40
South Sulawesi Province and Bulukamba Regency
Description of Marine Fishery State Revenue Governance The territorial waters of South Sulawesi and Balukumba Regency are located in WWP 713 (Flores
Sea and Makassar Strait). Balukumba regency contributes the largest amount of marine capture
fishery production with 52,888.4 tons in 2015. Of the 24 regencies/cities located in South Sulawesi,
only six contributed to marine fishery production, the regencies of Gowa, Soppeng, Sidrap, Enrekang,
Tana Toraja, and Toraja Utara.
Source: South Sulawesi in Numbers 2015
According to the BPS of Bulukumba, capture fishery production in the regency amounted to 52,870
tons. From the 7 districts that contributed to the production of capture fishery, five had production
exceeding 8,000 tons in 2015.
24,155.80
52,888.40
5,186.60
16,459.00
11,444.20
39,972.10
14,788.60 7,733.80
18,244.80
34,710.50 4,255.10
12,943.90 12,486.20
1,570.90
8,659.90
12,740.80 4,313.00
12,685.60
Marine Fishery Production (ton) in South Sulawesi (2015)
Kepulauan Selayar Bulukumba Bantaeng
Jeneponto Takalar Sinjai
Maros Pangkep Barru
Bone Wajo Pinrang
Luwu Luwu Utara Luwu Timur
Makassar Pare Pare Palopo

41
Source: Bulukumba in Numbers 2015
Payment of Fishery Business Permits in South Sulawesi
No. Permit Type Unit Tariff Duration of
Validity
1 SIUP
Vessels sized 10-20 GT
- 1-50 ships Per permit 500,000 5 years
- More than 51 ships Per permit 1,000,000 5 years
Vessels sized 21-30 GT
- 1-50ships Per permit 1,500,000 5 years
- More than 51 ships Per permit 2,000,000 5 years
2 SIPI
Ships sized 10-<30 GT Per GT 15,000 1 year
Ships sized 30-60 GT Per GT 40,000 2 years
8,559.00
10,896.00
1,315.00 8,653.00
4,161.00
8,845.00
10,441.00
Marine Fishery Production (ton) inBulukumba (2015)
Gantarang
Ujung Bulu
Ujung Loe
Bonto Bahari
Bontotiro
Herlang
Kajang
42
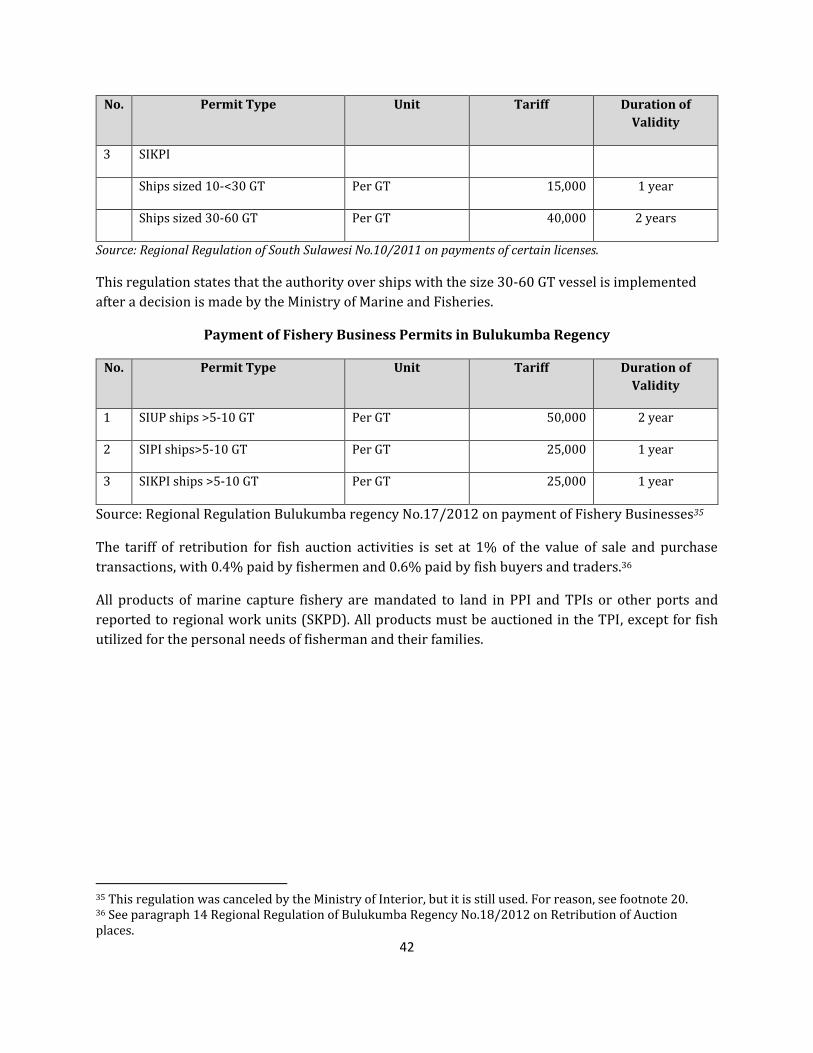
No. Permit Type Unit Tariff Duration of
Validity
3 SIKPI
Ships sized 10-<30 GT Per GT 15,000 1 year
Ships sized 30-60 GT Per GT 40,000 2 years
Source: Regional Regulation of South Sulawesi No.10/2011 on payments of certain licenses.
This regulation states that the authority over ships with the size 30-60 GT vessel is implemented
after a decision is made by the Ministry of Marine and Fisheries.
Payment of Fishery Business Permits in Bulukumba Regency
No. Permit Type Unit Tariff Duration of
Validity
1 SIUP ships >5-10 GT Per GT 50,000 2 year
2 SIPI ships>5-10 GT Per GT 25,000 1 year
3 SIKPI ships >5-10 GT Per GT 25,000 1 year
Source: Regional Regulation Bulukumba regency No.17/2012 on payment of Fishery Businesses35
The tariff of retribution for fish auction activities is set at 1% of the value of sale and purchase
transactions, with 0.4% paid by fishermen and 0.6% paid by fish buyers and traders.36
All products of marine capture fishery are mandated to land in PPI and TPIs or other ports and
reported to regional work units (SKPD). All products must be auctioned in the TPI, except for fish
utilized for the personal needs of fisherman and their families.
35 This regulation was canceled by the Ministry of Interior, but it is still used. For reason, see footnote 20. 36 See paragraph 14 Regional Regulation of Bulukumba Regency No.18/2012 on Retribution of Auction places.

43
West Nusa Tenggara Province and East Lombok Regency
Description of Marine Fishery State Revenue Governance The territorial waters of West Nusa Tenggara (NTB) are located in WPP 713 (Makassar Strait and
Flores Sea) and WPP 573 (Indian Ocean). In 2015, BPS recorded marine fishery production of the
province at 208,555.9 tons.
Source: NTB in Numbers 2016
The largest contributors of production originated from the regencies of Sumbawa, Dompu, and Bima.
The regency of East Lombok and West Lombok ranked behind them, while five other regencies/cities
had contributions that were less than 10,000 tons.
Source: East Lombok in Numbers 2016
10,734.50 1,476.10
14,326.00
50,064.00
67,640.60
50,179.90
3,561.60 7,154.10
1,706.50 1,712.60
Marine Capture Fishery Production in NTB (2015)
Lombok Barat Lombok Tengah Lombok Timur Sumbawa
Dompu Bima Sumbawa Barat Lombok Utara
Kota Mataram Kota Bima
6,011.46
1,536.87 188.38 618.06
4,487.79
1,419.94
Marine Capture Fishery Production (ton) in East Lombok (2015)
Keruak Jerowaru Sakra Timur Labuhan Haji Priggabaya Sambelia

44
Of the 20 districts located in East Lombok, only 6 contributed to marine fishery production, amassing
14,262.6 tons, with contributions dominated by the Keruak and Pringgabaya districts. When studied,
there is a disparity of 63.5 tons between the production data recorded between the province and that
of the regency.
Marine capture fishery production can be conducted by either businesses or by individuals. These
actors must apply for permits that are issued by the local government.
East Lombok Regency
According to Muhammad Tsywirruddin, Head of the Department of Marine and Fishery, there are 5
Fish Auction Places (TPI) in East Lombok: TPI Tanjung Luar, TPI Labuhan Lombok, TPI Batu Nampar
Selatan, TPI Seriwe, and TPI Sambelie. Of the five TPIs, only the first two were a source of local
revenue. The other three TPIs were widely used by small fisherman, and in accordance with the
appeal from the Ministry of Marine and Fisheries, these small TPI’s were not required to pay any fees.
Of the two TPIs that were d sources of revenue, neither have performed well, with both TPIs failing
to reach 50 % of targeted revenues.
Target and Realization of Auction House (TPI) Payments in East Lombok 2016
No. Post Target Realization Realization
(%) Potential Loss
1 TPI Labuhan Lombok 175,000,000, - 53,792,000, - 30,74% 121,208,000, -
2 TPI Tanjung Luar 147,653,000, - 16,681,000, - 11,30% 130,972,000, -
Total 322,653,000, - 70,473,000, - 21,84% 252,180,000, -
Source: Report on the Realization of Local Revenues, Department of Marine and Fishery of East Lombok,
December 2016
According to Muhammad Tahir, the Tanjung Luar TPI auctioneer, the payment of TPI retribution is
not immediately paid in cash after auction, but is indebted. When these payments are eventually paid,
they are often not in accordance to the regulations in place. Payments for sales at auction of
20,000,000 rupiah are only 100,000 rupiah, for example.37
Based on the provisions of Regency Regulation No.15/2014, the total retribution owed to the
Government of East Lombok regency is 5% of the value at auction. For the situation described above,
one million rupiah would be owed on a IDR 20-million value at auction, this corresponds to a loss of
90% of the revenue.
37 Interview by assessor Ramli, 21 May 2017

45
Problems of Marine Capture Fishery According to Captain Burhanudin of Port Sape, Bima, NTB, he was charged 200,000 rupiah for the
handling of SLO (operation permits), SPB (registration of goods document), and health permits. No
other ports collected such fees and after hard negotiations he managed to lower the cost to 50,000
rupiah.
If these documents are not complete, such as the ownership of SPB, the vessel can be quarantined,
and the fisherman brought into court for trial. To avoid being put in court, one must pay a fee of
10,000,000 rupiah.
Sea police often conduct raids in the middle of the sea to inspect the completeness of a fisherman’s
documents and permits. Despite the completeness of documents possessed, the commander and
members of the police demand payments on the grounds of gasoline money. Each officer is usually
given 100,000 rupiah with the commander receiving 200,000 rupiah.
In relation to the police’s blocking of the entranceway to the port, fishermen were asked to handover
fish to the officers. Usually three Cakalang fish are requested (total weight about 4 kg, with price of
IDR 12,000 per kg). But often a tuna is requested for the commander.
In the beginning of 2017, a group of fishermen from the Tanjung Luar, East Lombok reported the
illegal conduct of police officers to the Komisi III of the local parliament. Haji Abdul Karim, a fisherman
of Tanjung Luar, admitted to having been forced to hand over documents to two officers of the naval
police in the Bay of Saleh Sumbawa. The naval police took all official documents such as SIPI, SLO,
sailing permits in Syah Bandar and other documents. The perpetrators claimed that the fishermen
entered unpermitted waters. However, according to Haji Abdul Karim, the boundaries of permitted
waters are the Indian Ocean to the waters of NTT. The perpetrator then requested a ransom of IDR
35 million for the documents. After bargaining, it was agreed that a sum of IDR 3.5 million rupiah
would be paid. The same thing happened to Musyairi in Nare Bay. This group of fishermen was
accompanied by the Chairman Serikat Pekerja Nasional (SPN) NTB, Sarwin.38
Findings Thousands of unpermitted FADs were found in the Indian Ocean. Meanwhile, according to the head
of the Capture Fishery Division in NTB, hundreds of these illegal FADs can be found 12 or more miles
from the shores of NTB.39 This means that the issuing of permits for these FADs are under the
authority of the Ministry of Marine and Fishery. For every 100 illegal FADs, the state revenue loss can
be as much as IDR 200,000,000 per year.40
38 Radar Lombok, Pungli Marak di Tengah Laut; Nelayan Ngaku sering Dipalak Oknum Polair, 6 February 2017, https://www.radarlombok.co.id/nelayan-ngaku-sering-dipalak-oknum-polair.html. 39 http://bali.bisnis.com/read/20160504/10/59257/rumpon-ilegal-di-ntb-segera-ditertibkan 40 Non-tax revenue from the procurement or renewal of License Installation of new FADs is IDR 2,000,000, - / unit / year. See Government Regulation No.75 / 2015 on Non-Tax State Revenue from the Ministry of Marine Affairs and Fisheries.

46
There are around 300 ships originating from Sulawesi that moor in the Port of Lombok. These ships
are only supplied with "small fitting" from the harbormaster.
The average size of ships originating from Sinjai exceeds 20, 21, and 28 GT. However, when arriving
in Lombok, original documents are put away and not used. These ships then use documents that state
that the sizes of the ships are only 6 to 8 GT. The use of false documents is within the knowledge of
the harbormaster.
East Lombok Regency
Potential losses of state revenue also originate from companies trading in frozen cakalang fish in the
Lombok port in the form of false reports of production numbers.

47
Maluku Province and Ambon City
Description of Marine Fishery State Revenue Governance The territorial waters of Maluku province are divided into three areas of fishery management: WPP
714 (Banda Sea), WPP 715 (Tomini Bay-Seram Sea), and WPP 718 (Arafuru Sea – Timor Sea).
This province produced 488,926.7 tons of marine fish in 2015. The regency of Central Maluku and
East Seram had the largest contributions to production with 100,000 tons of fish. During that year,
the city of Ambon ranked fifth out of 10 regencies/cities with a production of 35,084.5 tons.
Source: Maluku in Numbers 2016
A different number is recorded by the BPS of Ambon City, where in 2015 the production of marine
fishery was recorded at 43,219.4 tons, a disparity of 8,134.9 margins as compared to records held by
the provincial government.
9,655.80
92,897.20
131,753.80
6,008.60
57,545.00
24,925.50
103,000.50
35,084.50 19,127.00
8,928.80
Marine Fishery Production in Maluku (2015)
Maluku Tenggara Barat
Maluku Tenggara
Maluku Tengah
Buru
Kepulauan Aru
Seram Bagian Barat
Seram Bagian Timur
Ambon
Maluku Barat Daya
Buru Selatan

48
Source: Ambon city in Numbers 2016
Potential Revenues and Losses, Modes and Actors Involved Fishery business permit collections in 2015 amounted to IDR 10,600,000. Whiles payments of SIU of
IDR 10,600,000.00 were not presented in the Balance Sheet as of December 31, 2015, as they are no
longer collectible, but its decision to remove this debt was still not determined by the Mayor. On
March 30, 2016, the Head of the Department of Marine and Fisheries submitted a request for the
abolition of the compulsory levy for 2009 - 2013 amounting to IDR 10,600,000 to the Head of BP2T
through letter No. 523/340 / DKP on the grounds that the levy has closed the business and moved
the operation out of the City Ambon hereby making its collection not possible.41
41 Assessment Report on LKPD in Ambon city 2015
8,660.26
2,014.47
8,176.52
10,357.87
14,010.28
Marine Fishery Production in Ambon City (2015)
Leitimur Selatan T.A. Baguala Teluk Ambon Sirimau Nusaniwe