Sub-seasonal to Seasonal Prediction (1-90 days) - A Seamless Approach

Journal of Science and Technology © KNUST April 2015
SEASONAL PREDICTION OF PRECIPITATION OVER
NIGERIA
M.O. Adeniyi1 and K. A. Dilau 2 1, 2Department of Physics, University of Ibadan, Ibadan, Nigeria
ABSTRACT
The availability of quantitative means of probing anticipated rainfall is essential for the purpose
of planning and policy formulation everywhere in the world. However reliable prediction of
rainfall remains a challenge over West Africa and Nigeria in particular. This paper predicts sea-
sonal rainfall in Nigeria with the hope of increasing the reliability of predicted seasonal rainfall.
Seasonal rainfall data (June-September) from 21 Nigerian stations and monthly Extended Re-
constructed Sea Surface Temperature (ERSST) of the tropical Oceans spanning 1960-2012 con-
stituted the input data for the formulation of prediction equations using regression analysis.
Cross-validation was applied with training period of 1960-1985, verification period of 1986-2012
and vice versa. The correlations between the predicted and the observed seasonal rainfall of the
training and verification periods of 1960-1985 were all significant at 5 % level except for one
station. While for the training and verification periods of 1986-2012, correlations are not gener-
ally significant although some were found to be above the significant level of 5%. For the recon-
structed seasonal precipitation, correlations of ten stations were found to be significant at 5 %,
but at 10 % level, their number increased to 13. The t-test analysis revealed that there is no sig-
nificant difference between the means of predicted and observed seasonal rainfall amount for all
stations except for only three stations (Osogbo, Calabar and Enugu). This suggests some degree
of skill which is also an indication that Sea Surface Temperature (SST) is a good predictor of
June, July, August and September (JJAS) seasonal rainfall in Nigeria.
INTRODUCTION
Rainfall has a profound impact on agriculture,
air and road transport, hydroelectric power gen-
eration, construction, water resources, among
others. Normal rainfall is beneficial for agricul-
ture and other economic activities. However,
when it is excessive, it may result in flooding
and the associated negative impacts. Also the
effects of below normal amount of rainfall are
also not desirable. The past droughts over West
Africa affected the economy, agriculture, live
stock and human population (Shanahan et al.,
2009; Batterbury, 2001). The timely informa-
tion in seasonal rainfall prediction is therefore
© 2015 Kwame Nkrumah University of Science and Technology (KNUST)
Journal of Science and Technology, Vol. 35, No. 1 (2015), pp102-113 102
RESEARCH PAPER
Keywords: Rainfall, Prediction, Tropical Ocean, Cross-validation, Sea Surface Temperature
http://dx.doi.org/10.4314/just.v35i1.9

Journal of Science and Technology © KNUST April 2015
vital for planning and decision making in these
key sectors of the economy. Apart from its relevance to life, tropical rainfall
is also important for global climate and
weather. Over two thirds of global precipitation
falls in the tropics (Simpson et al., 1988). A
notable feature of tropical rainfall is its inter-
annual variability, which on occasions can lead
to prolonged dry (drought) and wet (flood) pe-
riods. Many studies have established a correlation
between SST and rainfall in Africa (e.g. Fol-
land et al., 1991; Berte and Ward, 1998; Col-
man et al., 2000). Over Nigeria in particular,
correlation between the global SST and rainfall
has been established e.g. Adedoyin (1989) and
Omogbai (2010). Omogbai (2010) did not only
correlate SST with rainfall over Nigeria but
also predicted rainfall with SST. Thus, SST is a
good predictor of rainfall in Nigeria. Various research works on rainfall climatology
in Nigeria focused attention on rainfall trends,
variability, periodicities, onset and retreat e.g.
Odekunle et al. (2005), Walter (1967), Olaniran
(1983) and Adejuwon et al. (1990). Adedoyin
(1989) established a correlation between the
global SST anomalies and rainfall of northern
Nigeria but did not make any rainfall predic-
tion. Prediction of rainfall in Nigeria with SST
has been embarked upon by Omogbai (2010)
using Principal Component Analysis (PCA).
The PCA according to Maraun et al. (2010),
does not account for any information about the
predictand, and the predictor/predictand corre-
lation might thus not be optimal. According to
Omogbai (2010) and Agboola et al. (2013)
little attention has been paid to prediction of
rainfall in Nigeria, hence the importance of the
current study. Study Area
Nigeria is located within Latitudes 4 –14 ̊ N
and Longitude 3 –15 ̊ E and it covers a total
area of 923,768 km². It shares border with Re-
public of Niger, Cameroon, Republic of Benin
and the Gulf of Guinea in the north, east, west
and south respectively. Due to its location just north of the equator,
Nigeria enjoys a tropical climate characterized
by the hot and wet conditions associated with
the movement of the Inter-Tropical Conver-
gence Zone (ITCZ) north and south of the
equator. The climate of Nigeria is dominated
by the influence of two major wind currents,
namely: the southwesterly maritime tropical
(mT) air mass which is prevalent during the
wet season because it is moisture laden as a
result of its traverse through the Atlantic
ocean where it acquires moisture and the north
easterly continental tropical (cT) air mass that
prevails during the dry season because of its
dryness since there is no ocean along its conti-
nental path (Adeniyi, 2014; Odekunle, 2004).
Two main seasons; that is wet (April-October)
and dry (November- March) result from the
two major wind currents. Rainfall in Nigeria falls within a distinct pe-
riod (Adeniyi et al., 2009). These periods vary
from the northern part to the southern part of
the country because of their relative distance
from the Atlantic Ocean. Rainfall starts earlier
and ceases late in the southern parts while it
starts late and ceases earlier in the north. The
onset month in the south varies between
March and April while the cessation month is
October. In the North, however, rainfall starts
in May and ends in September (Adeniyi,
2014). There is rainfall occurrence all over the
country during June to September. However,
in August, there is a period of little dry season
in the southern part of the country (Adejuwon
and Odekunle, 2006). Overall two rainfall
peaks occur in the south whereas only one
rainfall peak occurs in the north. This makes
the climate to be humid in the south with an-
nual rainfall over 2000 mm and semi arid in
the north with annual rainfall less than 600
mm (Ojo, 1977). MATERIALS AND METHODS
The observed rainfall data, reanalysis SST
data, regression models and their validation
used in this study are described in this section.
Adeniyi and Dilau 103
Journal of Science and Technology © KNUST April 2015
Seasonal prediction of precipitation over Nigeria... 104
Fig. 1: Synoptic rainfall stations in Nigeria
Data The monthly rainfall database consisting of 21
stations in Nigeria with 53 years of monthly
rainfall records, covering the period of 1960 to
2012, were obtained from the archives of the
Nigeria Meteorological Agency (NIMET),
Oshodi Lagos, Nigeria. These stations were
selected from various parts of the country cov-
ering its six geopolitical zones. These stations
are indicated in the map of Nigeria as shown in
Fig.1.
The monthly SST of the tropical Ocean for a
period of 53years (1960 to 2012) were ex-
tracted from the “National Oceanic and Atmos-
pheric Administration (NOAA) National Cli-
matic Data Centre (NCDC) Extended Recon-
structed SST version 3b” which is available at:
ftp://ftp.ncdc.noaa.gov/pub/data/cmb/ersst/erss/
v3b/netcdf .
Methods
Predictor Selection
The predictors were selected based on the grids
of SST that had the highest correlation coeffi-
cients (r ≥ 0.3) with the observed seasonal pre-
cipitation in a particular station. Table 1 shows
the ocean and the months selected as predictors
for seasonal precipitation in the different sta-
tions. Medium to high correlations were found
to exist between tropical SST and the averaged
JJAS Seasonal rainfall in Nigeria which led to
the choice of the predictors in the different
oceans (Table 1). This is in agreement with various research works e.g. Adedoyin (1989)
and Omogbai (2010). The Indian Ocean has
more impact on the Sahel while the Atlantic
Ocean has more influence on the Guinea coast
and Savanna regions of Nigeria than the other
regions. However the effect of the tropical Pa-
cific is felt all over the country.

Journal of Science and Technology © KNUST April 2015
Station Ocean (Month)
Sokoto Indian (Feb)
Zaria Indian (March) Pacific (Feb)
Kano Pacific (Jan) and Atlantic (Feb)
Kaduna Pacific (April)
Makurdi Atlantic (January)
Jos Atlantic (March) and Indian (Jan)
Bida Atlantic (May) and Pacific (March)
Nguru Atlantic (Jan) and Pacific (Feb)
Potiskum Indian (Feb) and Pacific (March and Feb)
Maiduguri Pacific (February)
Minna Pacific (March and April)
Lokoja Atlantic (May)
Enugu Atlantic (March) and Pacific (May)
Ikeja Atlantic (Feb) and Pacific (Jan)
Ibadan Atlantic (May)
Osogbo Atlantic (May) and Pacific (Feb)
Ondo Atlantic (April)
Benin Atlantic (May) and Pacific (Jan)
Warri Atlantic (Feb and May) and Indian (April)
Port-hacourt Atlantic (Jan) and Pacific (Jan)
Calabar Indian (March and May)
Table 1: Stations and their corresponding oceans combined in formulating each model
The selection of suitable predictors is crucial
when developing a statistical model. The most
basic requirement for a predictor is that it
should be informative; that is, it should have a
high predictive power. Informative predictors
can be identified by statistical analyses, typi-
cally by correlating possible predictors with the
predictands (Maraun et al., 2010).
Regression
One of the most widely used methods for statis-
tical analysis of precipitation is linear regres-
sion (Maraun et al., 2010). The averaged JJAS
seasonal rainfall and SST data were subjected
to regression analysis based on a linear relation
of the form:
Where R represents the predictand (averaged
JJAS rainfall of the station), Xi is the predictor
(SST) which is a function of month (M) of the
appropriate Ocean, while βi is a constant repre-
senting the strength of the influence of Xi as
explained by Maraun et al. (2010).
Some stations took the simple form of the
model (i.e. only X1 is involved) while others
were in multiple forms (i.e. i = 1, 2, 3….). The
tropical ocean was partitioned into Atlantic,
Pacific and Indian oceans where SST was
treated separately. Thus, a separate SST do-
main is determined for each predictor–
predictand combination. In these models, data
dimensionality was restricted to a region
within the ocean where the magnitude of corre-
lation patterns of SST (January to May) with
seasonal rainfall is greatest within the tropics.
(1)
Adeniyi and Dilau 105

Journal of Science and Technology © KNUST April 2015
Validation The available data were divided into training
and verification periods of 1960-1985 and 1986
-2012 respectively and vice versa, after which
cross-validation was applied for the whole
length of the two verification periods (1960-
2012). The predicted seasonal precipitations for
the two periods were concatenated to recon-
struct the seasonal precipitation. The recon-
structed data were then compared with the ob-
served data in order to test for significant dis-
crepancies between the predicted and the ob-
served values.
Let x and y represent the reconstructed and the
observed seasonal rainfall respectively and let n
be the number of years (53).
The ratio of the standard deviation of the ob-
served to the reconstructed seasonal rainfall is
given by Standard Deviation Ratio,
(2)
where σy and σx are standard deviation of the
observed and reconstructed seasonal rainfall
respectively.
The Root Mean Square Error,
(3)
(4)
(5)
The observed and reconstructed seasonal pre-
cipitation are mostly normally distributed
(range of skewness is from 0.22 to 0.83) except
in a few stations. The reconstructed data set is
negatively skewed (skewness = -1.782) while
the observed dataset is positively skewed
(skewness = 1.714) at Ikeja. At Osogbo and
Bida the reconstructed seasonal rainfall are
positively and negatively skewed respectively
(1.09,-2.078) while the observed are normally
distributed. At Markurdi the observed data is
positively skewed (skewness = 1.35). The sig-
nificance of the difference between the recon-
structed and observed precipitations was tested
using the parametric Student t-test and its non
parametric counterpart Wilcoxon Signed Ranks
Test (WSRT) because of the few data sets that
are not normally distributed.
Student’s t test
This takes the actual difference between the
arithmetic means of the two samples and di-
vides it by the standard error of the difference
(SED).
(6)
SED, (7)
The degrees of freedom = 2n-2
For this test, the null hypothesis is: there is no
difference between the means of the predicted
and the observed while the alternative hypothe-
sis is: there is a difference between the means
of the predicted and the observed seasonal rain-
fall.
This was done at 95% confidence level.
Seasonal prediction of precipitation over Nigeria... 106

Journal of Science and Technology © KNUST April 2015
107
Wilcoxon Signed Ranks Test
Null hypothesis set for this test is: there is no
difference between the medians of the recon-
structed and the observed seasonal precipita-
tion.
The differences in medians are ranked regard-
less of the sign of the difference. All zero
differences are ignored and the original signs
are affixed to the rank numbers. All pairs with
equal absolute differences are given the same
rank but finally ranked with the mean of the
rank numbers that would have been assigned if
they would have been different.
Ranks with the same signs are summed (W+;
W-) and the total number of pairs (N) is finally
determined.
The level of significance is calculated by divid-
ing the number of all distributions of signs over
the ranks that have a SUM <= W+ (if W+ < W-
) by 2N.
Alternatively, if N > 15, then
were found to be above significant level of 5%.
These ranged from 0.12 to 0.55 (Table 2). This
is an indication that the period of 1960-1985
performed better than the period of 1986-2012
and this is probably showing climate change
effects. The correlations between the reconstructed and
the observed seasonal rainfall of ten stations were found to be significant at 5%, but at 10%
level, their number increases to thirteen (table
2). This suggests some degree of skill which is
also an indication that SST is a good predictor
of JJAS seasonal rainfall in Nigeria. Test of Fit
The t-test and Wilcoxon Signed Ranks Test
analyses yielded the same result (table 3), no
significant difference was found between the
reconstructed and the observed seasonal rain-
fall in almost all stations except for Calabar,
Enugu and Osogbo. The stations are in the
south. This is another indication of good pre-
diction over the entire northern Nigeria but
difficulty in reliable prediction over the south,
especially at the coast. As the RMSE values on test data of almost all
the stations considered in Nigeria are relatively
low and there is a little deviation of the pre-
dicted rainfall value from the actual as indi-
cated by the SDR values obtained, majority of
prediction models obtained are reliable in line
with Gholam et al. (2009). The accuracies of
majority are also above average as obtained by
Agboola et al. (2013) in their own prediction.
The percentage deviation of the predicted from
the observed 2012 seasonal rainfall amount
found by NIMET shows normal (-10% to 10%)
seasonal precipitation in only 3 stations while
the rest 19 were above normal (>10%) (NIMET
-SRP, 2013). In comparison, the percentage
deviations obtained in this study are all less
than 10% (table 3) over the 53 years consid-
ered. This reveals better reliable seasonal pre-
diction from this study than that of NIMET
(2013).
(7)
where W is the larger of W+ and W-. Z has a distribution that can be approximated
by the standard normal distribution so the cal-
culated Z is compared with the standard normal
distribution and if calculated Z is less than the
tabulated Z, the null hypothesis cannot be re-
jected.
RESULTS AND DISCUSSION
Cross-validation and Reconstruction
The correlations between the predicted and the
observed seasonal rainfall of the training and
verification periods of 1960-1985 were all sig-
nificant at 5% level for all stations. This ranged
from 0.34 to 0.75. In the case of training and
verification periods of 1986-2012, correlations
are not generally significant although some
Adeniyi and Dilau

Journal of Science and Technology © KNUST April 2015
108
Table 2 : Correlation of predicted with the observed seasonal rainfall
Station Training period
Verification
period
Training
period
Verification
period Reconstruction
(1960-1985) (1986-2012) (1986-2012) (1960-1985)
Sokoto 0.55 0.38 0.38 0.55 0.39
Zaria 0.62 0.31 0.35 0.52 0.21 Kano 0.56 0.53 0.32 0.56 -0.23
Kaduna 0.41 0.16 0.16 0.41 0.32
Makurdi 0.40 0.23 0.23 0.40 0.22 Jos 0.54 0.22 0.30 0.34 0.37
Bida 0.53 0.12 0.12 0.53 0.18 Nguru 0.72 0.36 0.38 0.70 0.33
Potiskum 0.58 0.26 0.29 0.49 0.28
Maiduguri 0.39 0.27 0.27 0.39 0.05
Minna 0.45 0.19 0.19 0.45 0.16
Lokoja 0.51 0.39 0.39 0.51 0.46
Enugu 0.61 0.23 0.25 0.57 0.28
Ikeja 0.69 0.22 0.25 0.62 0.23
Ibadan 0.54 0.49 0.49 0.54 0.50
Osogbo 0.75 0.21 0.22 0.73 0.25
Ondo 0.42 0.38 0.38 0.42 0.39
Benin 0.63 0.36 0.37 0.62 0.36
Warri 0.60 0.31 0.39 0.37 0.29
Port Harcourt 0.70 0.12 0.13 0.70 0.25
Calabar 0.60 0.15 0.22 0.49 0.26
Table 3: Tests of fitness between the predicted and the observed of the cross-validated sea-
sonal rainfall
Station RMSE (mm) SDR Bias % WSRT (t-test) p-value p-value
Sokoto 32.45 1.49 2.24 0.40 0.48 Zaria 40.73 1.99 4.24 0.22 0.15 Kano 100.00 0.51 2.80 0.87 0.76 Kaduna 30.28 3.80 -1.19 0.25 0.50 Makurdi 44.03 2.30 -0.71 0.45 0.81 Jos 33.47 2.39 -1.20 0.47 0.54 Bida 34.46 2.44 -2.39 0.31 0.30 Nguru 27.78 1.61 1.65 0.62 0.66 Potiskum 37.66 1.95 3.31 0.47 0.34 Maiduguri 46.32 1.88 -1.80 0.85 0.70 Minna 36.01 0.54 1.88 0.52 0.49 Lokoja 35.80 2.28 0.15 0.84 0.95 Enugu 49.59 1.35 6.66 0.01 0.01 Ikeja 80.98 1.54 -8.81 0.23 0.11 Ibadan 48.68 1.80 2.55 0.15 0.51 Osogbo 50.66 1.34 9.39 0.02 0.02 Ondo 51.34 2.17 2.75 0.10 0.38 Benin 60.71 1.97 0.48 0.71 0.86 Warri 77.11 0.66 0.26 0.73 0.69 Port Harcourt 49.67 2.78 0.65 0.71 0.75 Calabar 77.24 2.06 6.45 0.01 0.01
Seasonal prediction of precipitation over Nigeria...

Journal of Science and Technology © KNUST April 2015
109
Fig. 2: Observed and reconstructed seasonal (JJAS) precipitation for some selected Nigerian
stations
Fig 3: Observed and reconstructed seasonal (JJAS) precipitation for some selected Nigerian
Adeniyi and Dilau

Journal of Science and Technology © KNUST April 2015
Seasonal prediction of precipitation over Nigeria... 110
Fig. 4 : Observed and reconstructed seasonal (JJAS) precipitation for some selected Nigerian stations
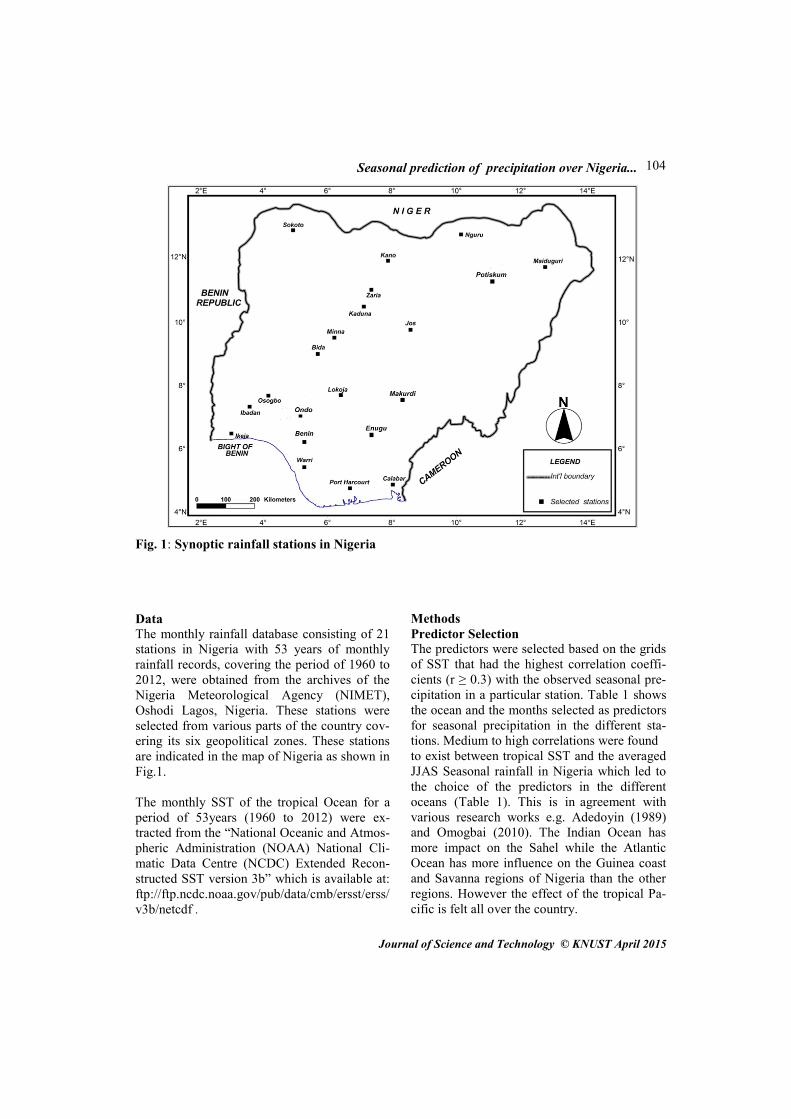
Figs. 2, 3 and 4 show the trend of observed and
reconstructed seasonal (JJAS) precipitation
while fig. 5 shows the bias percentage between
observed and reconstructed JJAS precipitation
of all selected stations in Nigeria.
CONCLUSIONS
In this paper, seasonal rainfall data from twenty
-one Nigerian stations and monthly Sea Surface
Temperature of the tropical Oceans constituted
the input data for the formulation of prediction
equations using regression analysis. The rain-
fall data and SST indices are for the period of
53 years ranging from 1960-2012. Models that
can predict seasonal rainfall in Nigeria have
been generated. Cross-validation was also ap-
plied with training period ranging from 1960-
1985 while its verification period is from 1986
to 2012 and vice versa.
The reconstructed seasonal rainfall for each
station was later correlated with the observed
seasonal rainfall amount. In addition to this, the
reconstructed seasonal rainfall was subjected to
test of fitness to know the level of confidence
in the predictions.
Results from this study reveal that, there are
linear relationships between the Sea Surface
Temperature (SST) of the tropical oceans and
the averaged JJAS seasonal rainfall amount in
Nigeria. This is in agreement with various re-
search works e.g Omogbai (2010) and Ade-
doyin (1989).
The correlations between the predicted and the
observed seasonal rainfall of the training and
verification periods of 1960-1985 were all sig-
nificant at 5% level except for one station,
while in the case of period of 1986-2012, the
Journal of Science and Technology © KNUST April 2015
111
correlations are significantly low although
some were found to be above significant level
(5% ). This indicates that the period of 1960-
1985 performed better than the period of 1986-
2012 probably due to the effect of climate
change on the latter period.
The reconstructed seasonal precipitation, has
significant correlation with the observed in only
ten stations at 5% level, but the number in-
creased to thirteen at 10% level.
Both the t-test and the WSRT analyses show
that there is no significant difference between
the predicted and the observed seasonal rainfall
in almost all the stations except in Calabar,
Enugu and Osogbo. This suggests some degree
of skill which is also an indication that SST is a
good predictor of rainfall in Nigeria in line with
the context of Folland et al. (1991), Ward et al.
(1993) and Omogbai (2010).
The result obtained from the deviation of pre-
dicted from the observed 2012 seasonal rainfall
amount indicates that our prediction model
performed better compared with the 2012 pre-
diction of NIMET (NIMET-SRP, 2013). Also,
we were able to predict for a period of 53 years
unlike one-year prediction of Omogbai (2010).
The results of this study have implications for
more reliable forecast of seasonal rainfall
amount, which is applicable for governmental
planning in agriculture, water resources, cli-
mate adaptation, air and land transportations,
hydroelectric power generation and also in the
prevention of flooding and its associated nega-
tive impacts. Therefore, this work is highly
useful and thereby recommended for the Fed-
eral government of Nigeria.
ACKNOWLEDGEMENTS
The authors acknowledge the kind gesture of
the Nigerian Meteorological Agency (NIMET),
Oshodi Lagos for making the precipitation data
used in this study available. The reanalysis
SST data are also extracted from the National
oceanic and Atmospheric Administration
(NOAA) National Climatic Data Centre
(NCDC) Extended Reconstructed SST version
3b.
REFERENCES
Adedoyin, J. A. (1989). Global-scale sea-
Fig 5 : Bias (%) between the predicted and the observed cross-validated seasonal rainfall
Adeniyi and Dilau

Journal of Science and Technology © KNUST April 2015
surface temperature anomalies and rainfall
characteristics in Northern Nigeria. Interna-
tional Journal of Climatology, 9: 131-144.
Adeniyi, M. O. (2014). Variability of daily pre-
cipitation over Nigeria. Meteorology and
Atmospheric Physics, 126(3-4):161-176.
DOI: 10.1007/s00703-014-0340-6 Adeniyi, M. O., Ogunsola, O. E., Nymphas, E.
F., Oladiran, E. O. (2009). Food security
measures during uncertain climatic condi-
tions in Nigeria. African Journal of Food,
Agriculture, Nutrition and Development
(AJFAND) 9(2):652–677
Adejuwon, J. O, Balogun, E. E, Adejuwon, S.
A (1990). On the annual and seasonal pat-
terns of rainfall fluctuants in Sub-Sahara
West Africa. International Journal of Clima-
tology, 10: 839–949 Adejuwon, J.O. and Odekunle, T. O. (2006).
Variability and severity of the “Little Dry
Season” in southwestern Nigeria. Journal
of Climate, 19:1-8. DOI:10.1175/JCLI3642.1
Agboola, A. H., Gabriel, A. J., Aliyu, E.O., and
Alese, B. K. (2013). Development of a fuzzy
logic based rainfall prediction model. Inter-
national Journal of Engineering and Tech-
nology, 3 (4), 427-435 Batterbury, S. (2001). The Sahel region; as-
sessing progress twenty-five years after the
great drought. Simon Batterbury, republished
paper from 1998 RGS-IBG conference.
Global Environmental Change (2001), 11
(1): 1-95
Berte, Y. and Ward, M. N. (1998). Experimen-
tal forecast of seasonal rainfall and crop in-
dex for July–September 1998 in Côte
D’Ivoire. SODEXAM, Meteorologie Nation-
ale de Côte D’Ivoire, Abidjan CIMMS, pp 59
–62.
Colman, A. W., Davey, M. K., Graham, R. and
Clark, R. (2000). Experimental forecast of
2000 seasonal rainfall in the Sahel and other
regions of tropical North Africa, Using Dy-
namical and Statistical Methods. Experimen-
tal Long-Lead Forecast Bulletin. http://
grads.iges.org/ellfb/Jun001colman. 6.00.htm
Folland, C. K., Owen, J. A., Ward, M. N., and
A. W. Colman, (1991). Prediction of sea-
sonal rainfall in the Sahel region of Africa
using empirical and dynamical methods.
Journal of Forecasting, 10: 2–56.
Gholam, A. F., Mohammad M. and Majid H.
N., (2009). Annual Rainfall Forecasting by
Using Mamdani Fuzzy Inference System.
Research Journal of Environmental Sciences,
3: 400-413.
Maraun, D., Wetterhall, F., Ireson, A. M.,
Chandler, R. E., Kendon, E. J., Widmann,
M., Rust, H. W., Sauter, T., Themeβl, M.,
Venema, V. K. C., Chun, K. P., Goodess, C.
M., Jones, R. G., Onof, C., Vrac, M., and
Thiele-Eich, I. (2010). Precipitation down-
scaling under climate change: recent devel-
opments to bridge the gap between dynami-
cal models and the end user. Reviews of Geo-
physics, 48, RG3003, 34, DOI: 10. 1029
/2009RG000314
NIMET-SRP (2013). 2013 Seasonal Rainfall
Prediction (SRP). Published by the Nigerian
Meteorological Agency
Odekunle, T. O. (2004). Determining rainfall
onset and retreat dates in Nigeria. Journal of
Human Ecology, 16(4):239–247
Odekunle, T. O., Balogun, E. E., Ogunkoya, O.
O. (2005). On the prediction of rainfall onset
and retreat dates in Nigeria. Theoretical and
Applied Climatology, 81, 101–112
Ojo, O. (1977). Climates of West Africa: Heine-
man Publishers, Ibadan
Olaniran, O. J. (1983). The onset of the rains
and the start of the growing season in Nige-
Seasonal prediction of precipitation over Nigeria... 112

Journal of Science and Technology © KNUST April 2015
ria: Nigeria Geographical Journal. 26(1 and
2): 81–88
Omogbai, B. E. (2010). An Empirical Predic-
tion of Seasonal Rainfall in Nigeria. Journal
of Human Ecology. 32(1), 23-27
Shanahan, T., Overpeck, J. T., Anchukaitis, K.
J., Beck, J. W., Cole, J. E., Dettman, D. L.,
Peck, J. A., Scholz, C. A. and King, J. W.
(2009). "Atlantic Forcing of Persistent
Drought in West Africa". Science
324 (5925): 377–380.
Simpson, J., Adler, R. F. and North, G. R.
(1988). A proposed Tropical Rainfall Meas-
uring Mission (TRMM) satellite. Bulletin of
American Meteorological Society. 69, 278–
295.
Walter, M. W. (1967). Length of the rainy sea-
son in Nigeria. Nigerian Journal of Geogra-
phy. 10: 123-8.
Ward, M. N., Folland, C. K., Maskell, K., Col-
man, A. W., Rowell, D. P., and Lane, K. B.
(1993). Experimental seasonal forecasting of
tropical rainfall at the U.K. Meteorological
Office. Prediction of Interannual Climate
Variations, J. Shukla, Ed., Springer–Verlag.
197–216.
Adeniyi and Dilau 113