Research Paper Multiparametric Spectroscopic Photoacoustic ... · Research Paper Multiparametric...
10
Theranostics 2014, Vol. 4, Issue 11 http://www.thno.org 1062 Theranostics 2014; 4(11): 1062-1071. doi: 10.7150/thno.9922 Research Paper Multiparametric Spectroscopic Photoacoustic Imaging of Breast Cancer Development in a Transgenic Mouse Model Katheryne E. Wilson 1 , Sunitha V. Bachawal 1 , Lu Tian 2 , Jürgen K. Willmann 1 1. Department of Radiology, Molecular Imaging Program at Stanford, Stanford University, School of Medicine, Stanford, California, USA; 2. Department of Health Research and Policy, Stanford University, School of Medicine, Stanford, California, USA. Corresponding author: Jürgen K. Willmann, M.D. Department of Radiology and Molecular Imaging Program at Stanford, School of Medicine, Stanford University, 300 Pasteur Drive, Room H1307, Stanford, CA 94305-5621 P: 650-723-5424 Fax: 650-723-1909 Email: will- [email protected]. © Ivyspring International Publisher. This is an open-access article distributed under the terms of the Creative Commons License (http://creativecommons.org/ licenses/by-nc-nd/3.0/). Reproduction is permitted for personal, noncommercial use, provided that the article is in whole, unmodified, and properly cited. Received: 2014.06.16; Accepted: 2014.07.29; Published: 2014.08.15 Abstract Objective: To evaluate the potential of multiparametric spectroscopic photoacoustic imaging using oxygen saturation, total hemoglobin, and lipid content to differentiate among four different breast histologies (normal, hyperplasia, ductal carcinoma in situ (DCIS), and invasive breast car- cinoma) in a transgenic mouse model of breast cancer development. Materials and Methods: Animal studies were approved by the Institutional Administrative Panel on Laboratory Animal Care. Mammary glands (n=251) of a transgenic mouse model of breast cancer development (FVB/N-Tg(MMTV-PyMT)634Mul) were imaged using B-mode ultrasound and spectroscopic photoacoustic imaging, analyzed for oxygen saturation, total hemoglobin, and lipid content, and processed for histological analysis. Statistical analysis was performed using one-way ANOVA, two-sample t-tests, logistic regression, and ROC analysis. Results: Eighty-two normal, 12 hyperplastic, 96 DCIS, and 61 invasive breast carcinoma mammary glands were analyzed. Based on spectroscopic photoacoustic imaging, the oxygen saturation of hyperplasia (50.6%), DCIS (43.0%), and invasive carcinoma (46.2%) significantly increased com- pared to normal glands (35.5%, P <0.0001), while both total hemoglobin (P<0.01), and lipid content (P<0.0008) significantly decreased with advancing histology. In differentiating normal and hyper- plasia from DCIS and invasive breast carcinoma, multiparametric imaging of oxygen saturation, lipid content, and raw photoacoustic signal at 750 nm provided an AUC value of 0.770. Conclusion: Multiparametric spectroscopic photoacoustic imaging is feasible and allows detec- tion of differences in concentration of tissue chromophores among different histologies in a transgenic mouse model of breast cancer development. Key words: Photoacoustic Imaging, Breast Cancer, Molecular Imaging, Spectroscopic. Introduction Breast cancer remains the second deadliest can- cer in women in the USA with an estimated 232,340 new cases diagnosed and 39,620 patients dying from the disease in 2013 (1). If detected early, usually by screening mammography, mortality from breast can- cer can be decreased by approximately one-fifth (2). However, the sensitivity of mammography is often decreased in patients with dense breast tissue (sensi- tivity as low as 30%), resulting in delayed detection and worse prognosis (3–5). Therefore, ultrasound is currently being explored as a second line, comple- mentary screening modality in patients with dense breast tissue diagnosed on mammography (6). While anatomical ultrasound imaging used in combination Ivyspring International Publisher
Transcript of Research Paper Multiparametric Spectroscopic Photoacoustic ... · Research Paper Multiparametric...

Theranostics 2014, Vol. 4, Issue 11
http://www.thno.org
1062
TThheerraannoossttiiccss 2014; 4(11): 1062-1071. doi: 10.7150/thno.9922
Research Paper
Multiparametric Spectroscopic Photoacoustic Imaging of Breast Cancer Development in a Transgenic Mouse Model Katheryne E. Wilson1, Sunitha V. Bachawal1, Lu Tian2, Jürgen K. Willmann1
1. Department of Radiology, Molecular Imaging Program at Stanford, Stanford University, School of Medicine, Stanford, California, USA; 2. Department of Health Research and Policy, Stanford University, School of Medicine, Stanford, California, USA.
Corresponding author: Jürgen K. Willmann, M.D. Department of Radiology and Molecular Imaging Program at Stanford, School of Medicine, Stanford University, 300 Pasteur Drive, Room H1307, Stanford, CA 94305-5621 P: 650-723-5424 Fax: 650-723-1909 Email: [email protected].
© Ivyspring International Publisher. This is an open-access article distributed under the terms of the Creative Commons License (http://creativecommons.org/ licenses/by-nc-nd/3.0/). Reproduction is permitted for personal, noncommercial use, provided that the article is in whole, unmodified, and properly cited.
Received: 2014.06.16; Accepted: 2014.07.29; Published: 2014.08.15
Abstract
Objective: To evaluate the potential of multiparametric spectroscopic photoacoustic imaging using oxygen saturation, total hemoglobin, and lipid content to differentiate among four different breast histologies (normal, hyperplasia, ductal carcinoma in situ (DCIS), and invasive breast car-cinoma) in a transgenic mouse model of breast cancer development. Materials and Methods: Animal studies were approved by the Institutional Administrative Panel on Laboratory Animal Care. Mammary glands (n=251) of a transgenic mouse model of breast cancer development (FVB/N-Tg(MMTV-PyMT)634Mul) were imaged using B-mode ultrasound and spectroscopic photoacoustic imaging, analyzed for oxygen saturation, total hemoglobin, and lipid content, and processed for histological analysis. Statistical analysis was performed using one-way ANOVA, two-sample t-tests, logistic regression, and ROC analysis. Results: Eighty-two normal, 12 hyperplastic, 96 DCIS, and 61 invasive breast carcinoma mammary glands were analyzed. Based on spectroscopic photoacoustic imaging, the oxygen saturation of hyperplasia (50.6%), DCIS (43.0%), and invasive carcinoma (46.2%) significantly increased com-pared to normal glands (35.5%, P <0.0001), while both total hemoglobin (P<0.01), and lipid content (P<0.0008) significantly decreased with advancing histology. In differentiating normal and hyper-plasia from DCIS and invasive breast carcinoma, multiparametric imaging of oxygen saturation, lipid content, and raw photoacoustic signal at 750 nm provided an AUC value of 0.770. Conclusion: Multiparametric spectroscopic photoacoustic imaging is feasible and allows detec-tion of differences in concentration of tissue chromophores among different histologies in a transgenic mouse model of breast cancer development.
Key words: Photoacoustic Imaging, Breast Cancer, Molecular Imaging, Spectroscopic.
Introduction Breast cancer remains the second deadliest can-
cer in women in the USA with an estimated 232,340 new cases diagnosed and 39,620 patients dying from the disease in 2013 (1). If detected early, usually by screening mammography, mortality from breast can-cer can be decreased by approximately one-fifth (2). However, the sensitivity of mammography is often
decreased in patients with dense breast tissue (sensi-tivity as low as 30%), resulting in delayed detection and worse prognosis (3–5). Therefore, ultrasound is currently being explored as a second line, comple-mentary screening modality in patients with dense breast tissue diagnosed on mammography (6). While anatomical ultrasound imaging used in combination
Ivyspring
International Publisher

Theranostics 2014, Vol. 4, Issue 11
http://www.thno.org
1063
with mammography can substantially increase the detection rates for breast cancer in patients with dense breast tissue, its positive predictive value is low (as low as 8.7% in a recent study) (6), resulting in many unnecessary callbacks and biopsies. Thus, improving our ability to non-invasively differentiate benign from malignant diseases on ultrasound imaging is critically needed to decrease the number of false positive find-ings in particular for patients with dense breast tissue.
Photoacoustic imaging is an emerging modality that is complementary to ultrasound imaging due to shared instrumentation and data processing algo-rithms. It provides additional tissue information to ultrasound imaging by adding quantitative data on the molecular composition of the tissue based on op-tical absorption properties (7,8). The photoacoustic effect is the conversion of low fluence, pulsed laser irradiation to broadband acoustic waves through several physical phenomena, including thermoelastic expansion (7,8). In brief, when sufficiently short (<10 ns) pulsed laser irradiation is absorbed by tissue chromophores (the section of a molecule that absorbs light) there is localized heating and expansion of the environment immediately surrounding the absorber. When the heat dissipates, the rapid contraction of the environment to its initial state releases broadband acoustic transients which can be detected and used to form an image, similarly to traditionally used ultra-sound. Since sound waves, instead of optical signals, are released at the site of chromophores, photoacous-tic imaging provides optical contrast at depths far beyond traditional optical modalities (theoretically up to 5 cm instead of a few mm) (9,10).
While several exogenous photoacoustic contrast agents including noble metal, plasmonic nanoparti-cles, iron oxide nanoparticles, carbon nanotubes, and dyes are currently being explored as photoacoustic contrast agents due to their high optical absorption coefficients and thus high imaging signal (8), endog-enous photoabsorbers such as oxygenated and deox-ygenated hemoglobin (11), melanin (12), and lipids (13) can also act as photoacoustic contrast agents. The advantage of leveraging endogenous photoabsorbers for photoacoustic imaging is that there is no need for administering exogenous contrast agents which makes this an immediately clinically translatable mo-lecular imaging approach. As the optical absorption of endogenous photoabsorber substantially changes with the optical wavelength, spectroscopic photoa-coustic imaging can be used to quantify the photoa-coustic signals produced by different chromophores within the tissues in a concentration dependent manner (13–15). Furthermore, the oxygen saturation of tissues can be calculated by determining the ratio of oxygenated hemoglobin to total hemoglobin (16,17).
While spectroscopic photoacoustic imaging appears to be a promising non-invasive molecular imaging modality, no animal or clinical studies have been performed to determine how spectroscopic photoa-coustic imaging could be used to characterize focal diseases such as different breast lesions. Whether dif-ferent breast lesions have reliable changes in endog-enous photoabsorber concentrations, and whether these changes are significant enough to be detected using spectroscopic photoacoustic imaging has yet to be determined.
The purpose of our study was to evaluate the potential of multiparametric spectroscopic photoa-coustic imaging using oxygen saturation, total hemo-globin, and lipid content to differentiate among four different breast histologies (normal, hyperplasia, ductal carcinoma in situ (DCIS), and invasive breast carcinoma) in a transgenic mouse model of breast cancer development.
Materials and Methods Transgenic Animal Model of Breast Cancer Development
All procedures involving the use of laboratory animals for this study were approved by the Institu-tional Administrative Panel on Laboratory Animal Care. A well characterized transgenic mouse model of breast cancer development (FVB/N-Tg(MMTV- PyMT)634Mul) was used for this study (18,19). In this mouse model, breast tissue progresses through four distinct histological stages from normal mammary tissues, through hyperplasia, to DCIS, and finally in-vasive breast carcinoma. Individual mice may have mammary glands at various stages of disease pro-gression. A total of 27 female mice (19 transgene posi-tive, 8 transgene negative, each with 10 mammary glands; total of 270 mammary glands; Figure 1) with various ages (mean age, 7 weeks; range, 4-10 weeks) and hence various stages of disease progression were examined in this study.
Combined Ultrasound and Photoacoustic Imaging of Mammary Glands
During imaging sessions, all animals were kept anesthetized with 2% isoflurane in oxygen at 2 L/min on a heated stage to maintain body temperature at 37 ºC. Pre-warmed, clear, non-colored ultrasound gel was used to couple the ultrasound transducer to the animal. In all mice, transverse two-dimensional B-mode ultrasound and photoacoustic images of all ten mammary glands were collected at the level of the maximal gland diameter using a dedicated small-animal, high-resolution ultrasound imaging system (Vevo2100 / Vevo LAZR, VisualSonics, To-

Theranostics 2014, Vol. 4, Issue 11
http://www.thno.org
1064
ronto, Canada). Co-registered ultrasound and photo-acoustic images were obtained of each mammary gland with a 21 MHz transducer (lateral and axial resolution of 165 and 74 µm, respectively), fixed to a rail system to maintain constant position. Photoa-coustic images were acquired over 17 wavelengths (700-860 nm in 10 nm increments) with an average fluence of 10 mJ/cm2 as measured by a power meter (Ophir Photonics Group, Utah, USA). The surface of the skin was always placed at a distance of 9 mm compared to the surface of the transducer to allow for homogenous light illumination of the mammary gland tissues because in the photoacoustic imaging system used in this study the optical fibers emit light from either side of the transducer and the intersection of the light paths occurs at a depth level of 9 mm.
To determine whether differences in raw photo-acoustic signal can also be used to differentiate be-tween different breast tissue histologies, raw photoa-coustic signal intensities were also obtained in addi-tion to spectroscopically resolved tissue chromo-phores concentrations. The raw photoacoustic signal intensity was measured at three wavelengths: 750 nm (the peak absorption for both deoxygenated hemo-globin and lipid), 800 nm (oxygenated and deoxy-genated hemoglobin have similar absorption proper-ties), and 850 nm (oxygenated hemoglobin dominates absorption) (20,21). To allow for intra-animal and in-ter-animal comparisons, all ultrasound and photoa-coustic imaging settings were kept constant throughout the experiments.
Image Analysis of Photoacoustic Data Sets A MATLAB-based, spectroscopic approach was
used to define the average oxygen saturation and li-pid content of each gland as described in detail else-where (10,22). Briefly, the co-registered transverse B-mode ultrasound images were used to define the region of interest (ROI) containing the entire mam-mary glands in a random order by one researcher experienced with both ultrasound and photoacoustic imaging. The researcher was blinded to the age and histology results of the mammary glands. Using photoacoustic signal from images acquired at 800 nm (the isobestic absorption point of oxygenated and deoxygenated hemoglobin) any pixels within the ROI that had low signal amplitudes indistinguishable from background signals were eliminated from the spectroscopic calculation as previously described (22). Glands in which 50% or more of the pixels had insuf-
ficient signal were eliminated and not included in the study results (n=19/270; 7%).
Assuming the optical absorption in mammary glands is derived primarily from three endogenous photoabsorbers, oxygenated hemoglobin (Hb), deox-ygenated hemoglobin (deHb), and lipids (L), the lo-calized absorption coefficient (µa) can be considered the sum of the three individual absorption coeffi-cients. The absorption coefficient (μa(λ,r)) is defined as the product of the molar extinction (Ɛ) and the con-centration (C) of the photoabsorber as described (10,22), providing the following equation (1).
μa(λ,r)=CHb(r) Ɛ Hb(λ)+CdeHb(r) Ɛ deHb(λ)+CL(r) Ɛ L(λ) …(1)
A linear least squares regression was used to determine the concentration of oxygenated and de-oxygenated hemoglobin, and of lipids in relative but arbitrary units (a.u.) within the ROI based on the as-sumption that the photoacoustic signal (known vari-able as measured in the experiment) is proportional to the molar extinction coefficient (known variable from the literature (20,21)) times the concentration of the individual photoabsorbers (unknown variable). Any pixels that resulted in negative calculated concentra-tions (a known limitation of least squares error re-gression methods (22)) of photoabsorbers were elim-inated from the average. Other parameters, such as fluence and the Grüneisen parameter (7,10), were as-sumed to be constant due to the superficial location of mammary glands at less than 2 mm depth in this mouse model, the constant fluence applied, and the similarity of tissues being imaged. Oxygen saturation was calculated by taking the concentration of the ox-ygenated hemoglobin and dividing it by the sum of the oxygenated and deoxygenated concentrations times 100%. Please note that these oxygen saturation values vary from clinical oxygen saturation meas-urements obtained by a pulse-oximeter which measures an optical absorbance ratio between two wavelengths of light which is then compared to a calibration curve to provide oxygen saturation (23). The measure of oxygen saturation provided by the technique in this study corresponds to the ratio of concentrations of oxyhemoglobin (4/4 oxygens bound to hemoglobin) to deoxyhemoglobin (approximately 0/4 oxygens bound to hemoglobin) determined from the molar absorption coefficients over multiple wavelengths (10, 22, 24). A flow chart illustrating the imaging and image analysis workflow is provided in Figure 1.

Theranostics 2014, Vol. 4, Issue 11
http://www.thno.org
1065
Figure 1. Flow chart summarizes the workflow of spectral photoacoustic imaging data set acquisition and data analysis in transgenic mice. (1) Co-registered transverse ultrasound and photoacoustic images at 17 wavelengths were collected in a single plane at the level of the maximal diameter of the mammary gland (dotted blue line) in each of the ten mammary glands in a transgenic mouse model of breast cancer development. (2) A linear least squares regression was performed using known absorption spectra of tissue chromophores in order to spectroscopically resolve the concentrations of individual photoabsorbers (oxygenated and deoxygenated hemoglobin and lipid). (3) In parallel, (2), regions of interest (ROI) were drawn on the ultrasound images, while the raw photoacoustic signal intensities measurements were analyzed to ensure sufficient signal for quality spectral analysis. (4) The quality-controlled ROI and spectrally processed images were then combined to provide (5) maps of total hemoglobin and lipid content and the oxygen saturation within the glands.
Ex Vivo Analysis of Mammary Glands
After combined ultrasound and photoacoustic imaging, all 251 mammary glands were harvested for ex vivo analysis. Each gland was fixed in 4% para-formaldehyde, embedded in paraffin and cut into 5 μm sections for hematoxylin-eosin (H&E) staining according to standard protocols (19). Histological di-agnoses (normal mammary gland, hyperplasia, DCIS, or invasive breast carcinoma) were determined by the most advanced stage present in the gland in random order rendered by two readers in consensus familiar with this mouse model and blinded to both the age of the animals and imaging results. Normal mammary glands were characterized by high proportion of fat with few, organized ductal epithelium. Mammary hyperplasia was distinguished by an increased vol-ume of ductal epithelium that was still organized in an overall fatty gland. DCIS was defined as an in-crease of acinar cell clusters with completely ex-panded ductal proliferation. Findings were inter-preted as invasive carcinoma on the basis of large solid expansile growth that infiltrates and entraps
adjacent tissue such as fat as described previously in more detail (18,19).
To analyze lipid content in the mammary glands, four glands from each disease state (normal, hyper-plasia, DCIS, invasive carcinoma) were also frozen into optimal cutting temperature compound and sliced into 12 µm sections following standard proto-cols (25). In brief, sections were washed with phos-phate buffered saline, and stained for 6 min with freshly prepared Oil Red O (ORO) stain in 60% iso-propanol which had been filtered through a 0.45 µm syringe filter. Next, the slides were rinsed for 2 min with a 60% isopropanol solution to destain the slides, followed by a 30-second nuclear stain with hematox-ylin. Slides were then rinsed for 30 min under gently running tap water and mounted with an aqueous mounting medium. Slides were digitized using a Nanozoomer (Hamamatsu, Japan) at 40x. For quanti-tative assessment of the % area lipid content, images of five adjacent 20X sections from each gland were captured and, using RGB thresholding, the total area of red staining was measured compared to the total area of tissue.
Theranostics 2014, Vol. 4, Issue 11
http://www.thno.org
1066
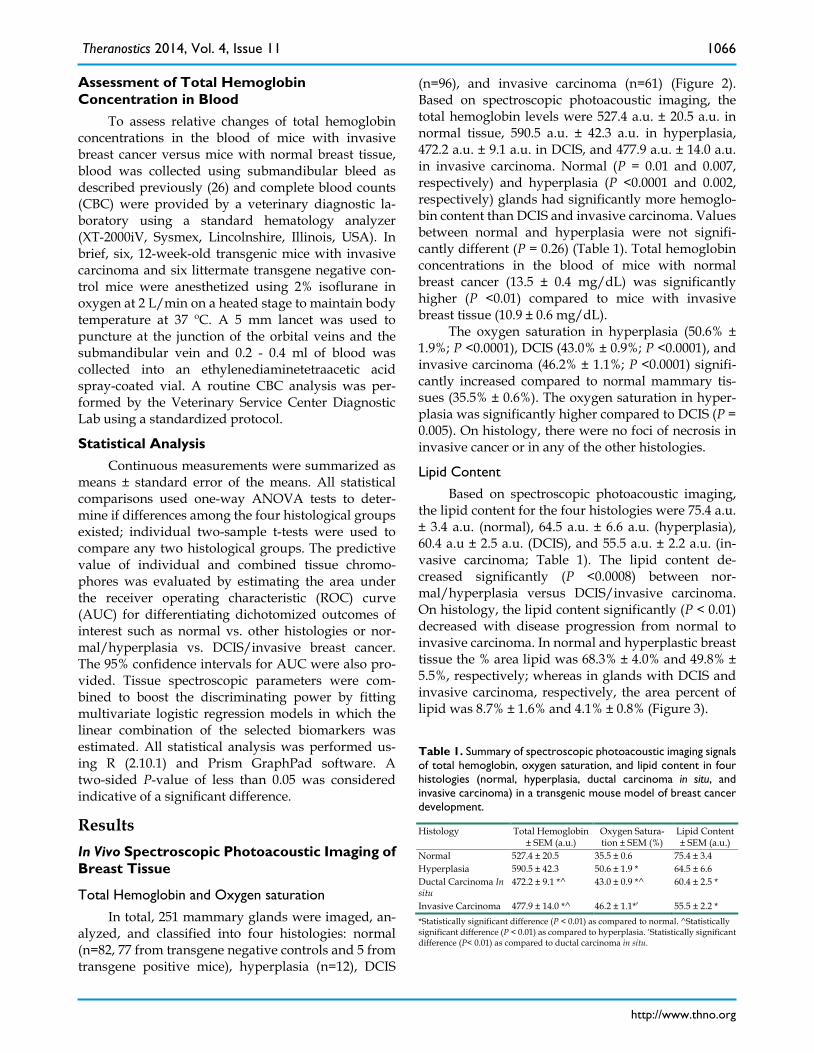
Assessment of Total Hemoglobin Concentration in Blood
To assess relative changes of total hemoglobin concentrations in the blood of mice with invasive breast cancer versus mice with normal breast tissue, blood was collected using submandibular bleed as described previously (26) and complete blood counts (CBC) were provided by a veterinary diagnostic la-boratory using a standard hematology analyzer (XT-2000iV, Sysmex, Lincolnshire, Illinois, USA). In brief, six, 12-week-old transgenic mice with invasive carcinoma and six littermate transgene negative con-trol mice were anesthetized using 2% isoflurane in oxygen at 2 L/min on a heated stage to maintain body temperature at 37 ºC. A 5 mm lancet was used to puncture at the junction of the orbital veins and the submandibular vein and 0.2 - 0.4 ml of blood was collected into an ethylenediaminetetraacetic acid spray-coated vial. A routine CBC analysis was per-formed by the Veterinary Service Center Diagnostic Lab using a standardized protocol.
Statistical Analysis Continuous measurements were summarized as
means ± standard error of the means. All statistical comparisons used one-way ANOVA tests to deter-mine if differences among the four histological groups existed; individual two-sample t-tests were used to compare any two histological groups. The predictive value of individual and combined tissue chromo-phores was evaluated by estimating the area under the receiver operating characteristic (ROC) curve (AUC) for differentiating dichotomized outcomes of interest such as normal vs. other histologies or nor-mal/hyperplasia vs. DCIS/invasive breast cancer. The 95% confidence intervals for AUC were also pro-vided. Tissue spectroscopic parameters were com-bined to boost the discriminating power by fitting multivariate logistic regression models in which the linear combination of the selected biomarkers was estimated. All statistical analysis was performed us-ing R (2.10.1) and Prism GraphPad software. A two-sided P-value of less than 0.05 was considered indicative of a significant difference.
Results In Vivo Spectroscopic Photoacoustic Imaging of Breast Tissue
Total Hemoglobin and Oxygen saturation In total, 251 mammary glands were imaged, an-
alyzed, and classified into four histologies: normal (n=82, 77 from transgene negative controls and 5 from transgene positive mice), hyperplasia (n=12), DCIS
(n=96), and invasive carcinoma (n=61) (Figure 2). Based on spectroscopic photoacoustic imaging, the total hemoglobin levels were 527.4 a.u. ± 20.5 a.u. in normal tissue, 590.5 a.u. ± 42.3 a.u. in hyperplasia, 472.2 a.u. ± 9.1 a.u. in DCIS, and 477.9 a.u. ± 14.0 a.u. in invasive carcinoma. Normal (P = 0.01 and 0.007, respectively) and hyperplasia (P <0.0001 and 0.002, respectively) glands had significantly more hemoglo-bin content than DCIS and invasive carcinoma. Values between normal and hyperplasia were not signifi-cantly different (P = 0.26) (Table 1). Total hemoglobin concentrations in the blood of mice with normal breast cancer (13.5 ± 0.4 mg/dL) was significantly higher (P <0.01) compared to mice with invasive breast tissue (10.9 ± 0.6 mg/dL).
The oxygen saturation in hyperplasia (50.6% ± 1.9%; P <0.0001), DCIS (43.0% ± 0.9%; P <0.0001), and invasive carcinoma (46.2% ± 1.1%; P <0.0001) signifi-cantly increased compared to normal mammary tis-sues (35.5% ± 0.6%). The oxygen saturation in hyper-plasia was significantly higher compared to DCIS (P = 0.005). On histology, there were no foci of necrosis in invasive cancer or in any of the other histologies.
Lipid Content Based on spectroscopic photoacoustic imaging,
the lipid content for the four histologies were 75.4 a.u. ± 3.4 a.u. (normal), 64.5 a.u. ± 6.6 a.u. (hyperplasia), 60.4 a.u ± 2.5 a.u. (DCIS), and 55.5 a.u. ± 2.2 a.u. (in-vasive carcinoma; Table 1). The lipid content de-creased significantly (P <0.0008) between nor-mal/hyperplasia versus DCIS/invasive carcinoma. On histology, the lipid content significantly (P < 0.01) decreased with disease progression from normal to invasive carcinoma. In normal and hyperplastic breast tissue the % area lipid was 68.3% ± 4.0% and 49.8% ± 5.5%, respectively; whereas in glands with DCIS and invasive carcinoma, respectively, the area percent of lipid was 8.7% ± 1.6% and 4.1% ± 0.8% (Figure 3).
Table 1. Summary of spectroscopic photoacoustic imaging signals of total hemoglobin, oxygen saturation, and lipid content in four histologies (normal, hyperplasia, ductal carcinoma in situ, and invasive carcinoma) in a transgenic mouse model of breast cancer development. Histology Total Hemoglobin
± SEM (a.u.) Oxygen Satura-tion ± SEM (%)
Lipid Content ± SEM (a.u.)
Normal 527.4 ± 20.5 35.5 ± 0.6 75.4 ± 3.4 Hyperplasia 590.5 ± 42.3 50.6 ± 1.9 * 64.5 ± 6.6 Ductal Carcinoma In situ
472.2 ± 9.1 *^ 43.0 ± 0.9 *^ 60.4 ± 2.5 *
Invasive Carcinoma 477.9 ± 14.0 *^ 46.2 ± 1.1*’ 55.5 ± 2.2 * *Statistically significant difference (P < 0.01) as compared to normal. ^Statistically significant difference (P < 0.01) as compared to hyperplasia. ‘Statistically significant difference (P< 0.01) as compared to ductal carcinoma in situ.

Theranostics 2014, Vol. 4, Issue 11
http://www.thno.org
1067
Figure 2. Representative transverse B-mode ultrasound images and spectroscopic photoacoustic images (raw photoacoustic signal intensity at 750 nm, oxygen saturation (sO2), total hemoglobin, and lipid content) of four histologies (normal, hyperplasia, DCIS, and invasive carcinoma) from distinct animals of a transgenic mouse model of breast cancer progression. Regions of interest were outlined in red on B-mode images. Scale bar in ultrasound images represents 2 mm. Corresponding hematoxylin and eosin (H&E) stained histology findings of normal, hyperplasia, DCIS, and invasive carcinoma are also shown. Scale bars represent 1 mm in 5X images and 200 µm in magnified (20X) images. Boxes on histology images show area of magnification for 20X images.

Theranostics 2014, Vol. 4, Issue 11
http://www.thno.org
1068
Figure 3. Representative photomicrographs of mouse mammary glands with four different histologies including normal, hyperplasia, ductal carcinoma in situ, and invasive breast cancer stained for lipids using Oil Red O (ORO) (red); the cell nuclei were counterstained with hematoxylin (blue). Note that there was substantial decrease of fat when mammary glands progressed into invasive breast cancer. Scale bars represent 250 µm in 5X images and 50 µm in magnified (20X) images. Boxes on histology images show area of magnification for 20X images. Box plot showing statistically significant (P <0.01) decrease in gland lipid content with disease progression from normal to invasive carcinoma. Note: following Tukey rules, each box edge in the plot represents the 25th and 75th quartiles, the center line represents the median, and the vertical lines outside the box represent the largest data point up to the 75th quartile plus 1.5 times the interquartile range and the smallest value down to the 25th quartile minus 1.5 times the interquartile range respectively. Any data outside these lines represent statistical outliers (triangles).
Raw Photoacoustic Signal Intensity
The average raw photoacoustic signal intensity at 750 nm was measured as follows: normal (364.8 a.u. ± 14.0 a.u.), hyperplasia (333.7 a.u. ± 24.8 a.u.), DCIS (281.8 a.u. ± 5.3 a.u), and invasive carcinoma (280.0 a.u. ± 9.5 a.u.). The raw photoacoustic imaging signal in normal and hyperplasia glands were higher com-pared to DCIS and invasive carcinoma (P <0.001). The raw photoacoustic signal intensity at 800 nm was measured as follows: normal (242.6 a.u. ± 9.4 a.u.), hyperplasia (264.5 a.u. ± 21.4 a.u.), DCIS (223.5 a.u. ± 6.4 a.u.), and invasive carcinoma (231.5 a.u. ± 9.0 a.u). No significant difference (P = 0.16) in raw photoa-coustic signal intensity at 800 nm was found as ex-pected because oxygenated and deoxygenated hemo-globin have similar absorption properties at this wavelength. The raw photoacoustic signal intensity at 850 nm was as follows: normal (248.2 a.u. ± 10.2 a.u.), hyperplasia (297.6 a.u. ± 33.2 a.u.), DCIS (225.3 a.u. ± 5.2 a.u.), and invasive carcinoma (236.1 a.u. ± 7.7 a.u.). The raw photoacoustic imaging signal at 850 nm in hyperplasia was significantly higher compared to those measured in mammary glands with other his-tologies (P = 0.008).
Multiparametric Analysis of Spectral Photoacoustic Images for Histological Classification of Mammary Glands
In order to determine feasibility of using differ-ent spectroscopically resolved tissue chromophores to help distinguish the four different breast histologies, ROC curves for various combinations of the calcu-lated spectroscopic categories were created for two different groupings of disease stage: either normal
glands versus combined hyperplasia/DCIS/invasive carcinoma or normal/hyperplasia versus DCIS/invasive carcinoma (Table 2). The individual parameter with the highest AUC value (0.805 and 0.736 respective of group) was oxygen saturation. The combination of parameters that yielded highest AUC values was oxygen saturation, lipid concentration, and raw PA signal at 750 nm with an AUC of 0.822 and 0.770 respective of grouping.
Table 2. Summary of AUC values (including 95% confidence intervals) for single and combined photoacoustic parameters in differentiating either normal mammary gland histology versus hyperplasia/DCIS/invasive carcinoma or in differentiating nor-mal/hyperplasia versus DCIS/invasive carcinoma.
Parameters Normal vs. Others (95% CI)
Normal/Hyperplasia vs. DCIS/Invasive Car-cinoma (95% CI)
sO2, Lipid, and PA750 0.822 (0.772, 0.873) 0.770 (0.711, 0.829) sO2, Lipid, Hemoglobin 0.822 (0.772, 0.873) 0.765 (0.705, 0.824) sO2, Lipid, PA750, He-moglobin
0.822 (0.771, 0.872) 0.763 (0.704, 0.823)
sO2, PA750 0.820 (0.769, 0.872) 0.763 (0.703, 0.822) sO2, PA750, Hemoglobin 0.819 (0.768, 0.871) 0.763 (0.703, 0.822) sO2, Lipid 0.819 (0.768, 0.870) 0.755 (0.694, 0.815) sO2 0.805 (0.752, 0.859) 0.736 (0.673, 0.789) PA750 0.653 (0.576, 0.729) 0.659 (0.586, 0.732) Lipid 0.640 (0.567, 0.713) 0.624 (0.551, 0.696) PA800 0.527 (0.444, 0.611) 0.561 (0.482, 0.640) Hemoglobin 0.512 (0.428, 0.596) 0.552 (0.473, 0.631) PA850 0.511 (0.427, 0.595) 0.533 (0.453, 0.612) Note.- sO2 – Oxygen saturation, Lipid – lipid content, - Hemoglobin – total hemo-globin, PA750 – raw photoacoustic signal intensity at 750 nm, PA800 – raw photoa-coustic signal intensity at 800 nm, PA850 – raw photoacoustic signal intensity at 850 nm.

Theranostics 2014, Vol. 4, Issue 11
http://www.thno.org
1069
Discussion This study showed the feasibility of using mul-
tiparametric spectroscopic photoacoustic imaging to differentiate among groupings of various breast his-tologies (defined as either clinically actionable or non-actionable) in a transgenic mouse model of breast cancer development. Oxygen saturation as a single parameter as well as a combination of oxygen satura-tion, lipid content, and raw photoacoustic signal at 750 nm performed best for classifying histologies.
Photoacoustic imaging is an emerging imaging approach which is currently being translated from preclinical to clinical applications in breast imaging through the development of new clinical grade pho-toacoustic systems (27–29). Specifically, spectroscopic photoacoustic imaging allows quantification of en-dogenous photoabsorbers such as hemoglobin or lipid that could be leveraged for non-invasive characteri-zation of focal breast lesions (11-13). To validate this technique, spectroscopic photoacoustic imaging has been compared to standard laboratory CO-oximeter measurements as the gold standard in an initial in vitro study. In that study it has been shown that spec-troscopic photoacoustic imaging is accurate to within a few percent in the quantification of oxygen satura-tion of hemoglobin (30). Subsequent in vivo meas-urements in sheep comparing spectroscopic meas-urements versus direct blood sample readings using a CO-oximeter as the gold standard further confirmed ability of the spectroscopic photoacoustics to measure oxygen saturation (31). Additional in vivo studies used spectroscopic photoacoustic imaging to assess total hemoglobin concentration and oxygenation satura-tion versus histological findings in mice including an orthotopic U87 human glioblastoma model (16) as well as in subcutaneous murine (17) and human (22) breast cancer models. Furthermore, it has been demonstrated that spectroscopic photoacoustic im-aging allows visualization of areas of hypoxia in an animal model of pancreatic cancer which correlated well with immunohistochemical hypoxia staining (32). Other tissue chromophores, such as lipids, have also been imaged with spectroscopic photoacoustic imaging and compared to histology both in an ather-osclerosis models in rabbits in vivo (13) and in excised human atherosclerotic aortas in an ex vivo study (33). In our study, we explored the potential of multipar-ametric spectroscopic photoacoustic imaging for characterization of various pathologies in breast can-cer development in a transgenic mouse model which could eventually be helpful to further characterize sonographically detected lesions in patients under-going breast ultrasound.
We found that oxygen saturation as a single pa-rameter performed best to differentiate clinically
non-actionable (normal/hyperplasia) versus clinically actionable (DCIS and invasive breast carcinoma) findings with an AUC value of 0.74. Considering hy-perplasia also an actionable precursor lesion in this transgenic mouse model (because hyperplasia always progresses into DCIS and eventually to invasive car-cinoma in these mice) the AUC value further in-creased to 0.81.
Oxygen saturation was elevated at the hyper-plasia stage compared to normal tissue which may be explained by a metabolic switch to a more anaerobic metabolism (e.g., the Warburg effect) (34,35) already at the hyperplasia stage in this transgenic mouse model, leaving more oxygen bound to hemoglobin in the blood. Oxygen saturation levels were also in-creased in DCIS and further remained elevated in invasive carcinoma compared to normal tissue. In particular, we did not observe hypoxia in the invasive cancer cases in our study and histological analysis did not show areas of necrosis. Hypoxia and or necrosis are typical findings of more advanced cancer cases which we did not include in our study.
Another observation in our study was that spec-troscopic photoacoustic imaging showed decreased levels of total hemoglobin in DCIS and invasive car-cinoma compared to normal tissue and hyperplasia. This was an unexpected finding since vascularity is increased both in DCIS and invasive carcinoma in this mouse model (36) and an increased number of vessels would suggest an increased concentration of hemoglobin in the tissue. However, since total hemo-globin as measured by spectroscopic photoacoustic imaging not only depends on the number of vessels in the imaging plane but also on the hemoglobin con-centration of the blood perfusing those vessels, the observed trend may partially be explained by de-creased blood hemoglobin concentrations in mice with invasive carcinoma as confirmed by CBC meas-urements in our study.
Another parameter examined in our study was the lipid content of each gland, which was the second best individual classifier of disease. Despite the sig-nificantly higher optical absorption coefficients of hemoglobins compared to lipid (fat), lipid maintains a distinctive spectrum in the range of 680-900 nm with two peaks at 762 and 830 nm (37). This spectrum, along with a high proportion of fat (mammary glands can contain up to 87% by mass of lipids (38) and confirmed in this study), allows detection via spec-troscopic analysis. The overall observed decrease in lipid content in breast cancer development in our study was due to the replacement of fat tissue by solid tumor components with the mammary glands pro-gressing towards invasive cancer. This was further confirmed by lipid staining which showed a substan-

Theranostics 2014, Vol. 4, Issue 11
http://www.thno.org
1070
tial decrease in the percent area lipid in the mammary glands at more advanced stages.
There are several recognized limitations of our study. First, while the transgenic model of breast cancer development used in our study recapitulates disease progression in patients with various histolog-ical precursor stages including hyperplasia and DCIS, which is substantially closer to human diseases than other animal models such as subcutaneously or or-thotopically implanted breast cancer, this model still varies in some aspects compared to human disease. For example, the hyperplasia disease state is transi-tional and rapidly progresses to DCIS and invasive cancer, whereas hyperplasia in humans is not always considered precancerous and actually may not always progress to cancer (39,40). Therefore, the noticeable differences in spectroscopically resolved parameters (i.e. oxygen saturation) found in this study may not be detectable in different types of hyperplasia in hu-mans. Another limitation of the animal model is that disease development is often focal within the mam-mary gland with areas of normal gland tissue (or other histologies) interspersed. While focal areas be-come more confluent with disease progression, B-mode ultrasound imaging still does not allow dif-ferentiation between different histological foci based on morphological criteria. Therefore, for quantitative assessment of spectral photoacoustic signatures, we chose to draw ROIs over the entire glands in all ani-mals, which may have resulted in averaging of im-aging signals since some glands may have contained more than one histological entity and calculated val-ues may, therefore, either under- or overestimate values for the four different histologies. Therefore, our findings need to be eventually validated in pa-tients where B-mode ultrasound shows distinct le-sions that can then be further characterized by spec-tral photoacoustic imaging by drawing regions of interest around the focal lesions as outlined by the ultrasound imaging. Another limitation of the mouse model refers to the relatively small number of hyper-plasia cases imaged in our study as hyperplasia only persists for a few days in this model before progress-ing to DCIS. Also, this mouse model does not develop other benign lesions beyond hyperplasia such as for example fibroadenoma.
Second, quantitative spectroscopic photoacoustic imaging has intrinsic limitations due to depth and wavelength dependent light absorption. Commonly used models to address this limitation include fluence correction via Monte Carlo modeling and other methods for depth and wavelength dependent atten-uation of light (10,22) for which this study did not account for since all breast tissues were scanned at a similar depth level of only 2 mm or less.
Third, the images in this study were limited to two-dimensional planes, which may not accurately portray disease status in the entire gland.
In conclusion, the results of our study suggest that multiparametric spectroscopic photoacoustic imaging is feasible and allows differentiating normal and hyperplasia from DCIS and invasive breast car-cinoma in a transgenic mouse model of breast cancer development with reasonable diagnostic accuracy. Future studies in patients using clinical grade photo-acoustic imaging devices currently under develop-ment are needed to assess the clinical value of spec-troscopic photoacoustic imaging to non-invasively characterize sonographically detected focal breast lesions. This complementary technique which could be added to standard ultrasound during the same exam may help further increase diagnostic accuracy of ultrasound in breast cancer imaging.
Abbreviations DCIS: Ductal carcinoma in situ; ROI: region of
interest; ROC: receiver operating characteristic; AUC: area under the curve; H&E: hematoxylin-eosin.
Acknowledgements We would like to thank Dr. Geoffrey Luke for
aid with the spectroscopic photoacoustic reconstruc-tion algorithm, and Dr. Tim Doyle from the Small Animal Imaging Facility at Stanford University. Supported by R01 CA155289-01A1 (JKW) and R25 CA118681 (KEW).
Funding This study was supported by the NIH R01
CA155289-01A1 grant (JKW) and the NIH R25 CA118681 training grant (KEW).
Conflict of Interest The authors report no potential conflicts of in-
terest.
References 1. [Internet] Cancer Facts & Figures 2013. American Cancer Society Web site.
http://www.cancer.org/research/cancerfactsfigures/cancerfactsfigures/cancer-facts-figures-2013. Published 2013. Accessed October 8, 2013.
2. Humphrey LL, Helfand M, Chan BKS, et al. Breast cancer screening: a summary of the evidence for the U.S. preventive services task force. Ann Intern Med. 2002;137(5):347–360.
3. Kolb TM, Lichy J, Newhouse JH. Comparison of the performance of screening mammography, physical examination, and breast US and evaluation of factors that influence them: an analysis of 27,825 patient evaluations. Radiology. 2002;225(1):165–175.
4. Mandelson MT. Breast density as a predictor of mammographic detection: comparison of interval- and screen-detected cancers. J Natl Cancer Inst 2000;92(13):1081–1087.
5. Boyd NF, Guo H, Martin LJ, et al. Mammographic density and the risk and detection of breast cancer. N Engl J Med 2007;356(3):227–236.
6. Berg WA, Blume JD, Cormack JB, et al. Combined screening with ultrasound and mammography vs mammography alone in women at elevated risk of breast cancer. JAMA 2008;299(18):2151–2163.
7. Wang L V., Wu H-I, Masters BR. Biomedical optics, principles and imaging. Hoboken, NJ: Wiley-Interscience, 2008.

Theranostics 2014, Vol. 4, Issue 11
http://www.thno.org
1071
8. Luke GP, Yeager D, Emelianov SY. Biomedical applications of photoacoustic imaging with exogenous contrast agents. Ann Biomed Eng 2012;40(2):422–437.
9. Li C, Wang LH V. Photoacoustic tomography and sensing in biomedicine. Phys Med Biol 2009;54(19):R59.
10. Luke GP, Nam SY, Emelianov SY. Optical wavelength selection for improved spectroscopic photoacoustic imaging. Photoacoustics 2013;1(2):36–42.
11. Hu S, Wang L V. Photoacoustic imaging and characterization of the microvasculature. J Biomed Opt 2010;15(1):11101–11115.
12. Oh J-T, Li M-L, Zhang HF, et al. Three-dimensional imaging of skin melanoma in vivo by dual-wavelength photoacoustic microscopy. J Biomed Opt 2006;11(3):34032.
13. Wang B, Karpiouk A, Yeager D, et al. In vivo Intravascular Ultrasound-guided Photoacoustic Imaging of Lipid in Plaques Using an Animal Model of Atherosclerosis. Ultrasound Med Biol 2012;38(12):2098-2103.
14. Song KH, Kim C, Maslov K, et al.. Noninvasive in vivo spectroscopic nanorod-contrast photoacoustic mapping of sentinel lymph nodes. Eur J Radiol 2009;70(2):227–231.
15. Ntziachristos V, Razansky D. Molecular imaging by means of multispectral optoacoustic tomography (MSOT). Chem Rev 2010;110(5):2783–2794.
16. Li M-L, Oh J-T, Xie X, et al. Simultaneous molecular and hypoxia imaging of brain tumors in vivo using spectroscopic photoacoustic tomography. Proc IEEE 2008;96(3):481–489.
17. Herzog E, Taruttis A, Beziere N, et al.. Optical imaging of cancer heterogeneity with multispectral optoacoustic tomography. Radiology 2012;263(2):461–468.
18. Cardiff RD, Anver MR, Gusterson BA, et al. The mammary pathology of genetically engineered mice: the consensus report and recommendations from the Annapolis meeting. Oncogene 2000;19(8):968–988.
19. Lin EY, Jones JG, Li P, et al. Progression to malignancy in the polyoma middle T oncoprotein mouse breast cancer model provides a reliable model for human diseases. Am J Pathol 2003;163(5):2113–2126.
20. Steinke JM, Shepherd AP. Diffusion model of the optical absorbance of whole blood. J Opt Soc Am 1988;5(6):813.
21. Friebel M, Roggan A, Muller G, et al.. Determination of optical properties of human blood in the spectral range 250 to 1100 nm using Monte Carlo simulations with hematocrit-dependent effective scattering phase functions. J Biomed Opt 2006;11(3):34021.
22. Kim S, Chen Y-S, Luke GP, et al.. In vivo three-dimensional spectroscopic photoacoustic imaging for monitoring nanoparticle delivery. Biomed Opt Express 2011;2(9):2540–2550.
23. Millikan GA. The Oximeter, an Instrument for Measuring Continuously the Oxygen Saturation of Arterial Blood in Man. Rev. Sci. Instrum. AIP Publishing; 1942 Dec 27;13(10):434.
24. Jacques SL. Optical properties of biological tissues: a review. Phys. Med. Biol.; 2013;58(11):R37–61.
25. Mehlem A, Hagberg CE, Muhl L, et al. Imaging of neutral lipids by oil red O for analyzing the metabolic status in health and disease. Nat. Protoc. N; 2013;8(6):1149–54.
26. Golde WT, Gollobin P, Rodriguez LL. A rapid, simple, and humane method for submandibular bleeding of mice using a lancet. Lab Anim. (NY). 2005 Oct;34(9):39–43.
27. Zalev J, Clingman B, Smith RJ, et al. Clinical feasibility study of combined opto-acoustic and ultrasonic imaging modality providing coregistered functional and anatomical maps of breast tumors. Proc SPIE 8223, Photons Plus Ultrasound: Imaging and Sensing 2012;:858103–858109.
28. Ermilov SA, Khamapirad T, Conjusteau A, et al. Laser optoacoustic imaging system for detection of breast cancer. J Biomed Opt 2009;14(2):024007.
29. Heijblom M, Piras D, Xia W, et al. Visualizing breast cancer using the Twente photoacoustic mammoscope: what do we learn from twelve new patient measurements? Opt Express 2012;20(11):11582–11597.
30. Laufer J, Delpy D, Elwell C, et al. Quantitative spatially resolved measurement of tissue chromophore concentrations using photoacoustic spectroscopy: ap-plication to the measurement of blood oxygenation and haemoglobin concen-tration. Phys Med Biol 2007;52(1):141–168.
31. Petrov IY, Petrov Y, Prough DS, et al.. Optoacoustic monitoring of cerebral venous blood oxygenation though intact scalp in large animals. Opt Express 2012;20(4):4159–4167.
32. Gerling M, Zhao Y, Nania S, et al. Real-time assessment of tissue hypoxia in vivo with combined photoacoustics and high-frequency ultrasound. Theranostics. 2014 Jan;4(6):604–13.
33. Allen TJ, Hall A, Dhillon AP, et al. Spectroscopic photoacoustic imaging of lipid-rich plaques in the human aorta in the 740 to 1400 nm wavelength range. J Biomed Opt 2012;17(6):612091–6120910.
34. Kim J, Dang C V. Cancer’s molecular sweet tooth and the Warburg effect. Cancer Res 2006;66(18):8927–8930.
35. Gatenby RA, Gillies RJ. Why do cancers have high aerobic glycolysis? Nat Rev Cancer 2004;4(11):891–899.
36. Bachawal S V, Jensen KC, Lutz AM, et al. Earlier detection of breast cancer with ultrasound molecular imaging in a transgenic mouse model. Cancer Res 2013;73(6):1689–1698.
37. Van Veen RLP, Sterenborg H, Pifferi A, et al. Determination of VIS-NIR absorption coefficients of mammalian fat, with time-and spatially resolved diffuse reflectance and transmission spectroscopy. Biomed. Top. Meet. Optical Society of America; 2004
38. Woodard HQ, White DR. The composition of body tissues. Br J Radiol 1986;59(708):1209–1218.
39. Costa A, Zanini V. Precancerous lesions of the breast. Nat Clin Pract Oncol 2008;5(12):700–704.
40. Jacobs TW, Connolly JL, Schnitt SJ. Nonmalignant lesions in breast core needle biopsies: to excise or not to excise? Am J Surg Pathol 2002;26(9):1095-1110.
41. Sewell CW. Pathology of high-risk breast lesions and ductal carcinoma in situ. Radiol Clin North Am 2004;42(5):821–830.