RESEARCH OpenAccess Systemvalue-basedoptimumspreading ...€¦ · RESEARCH OpenAccess...
19
Gurcan et al. EURASIP Journal on Wireless Communications and Networking 2013, 2013:74 http://jwcn.eurasipjournals.com/content/2013/1/74 RESEARCH Open Access System value-based optimum spreading sequence selection for high-speed downlink packet access (HSDPA) MIMO Mustafa K Gurcan * , Irina Ma, Anusorn Chungtragarn and Hamdi Joudeh Abstract This article proposes the use of system value-based optimization with a symbol-level minimum mean square error equalizer and a successive interference cancellation which achieves a system value upper bound (UB) close to the Gaussian UB for the high-speed downlink packet access system without affecting any significant computational cost. It is shown that by removing multi-code channels with low gains, the available energy is more efficiently used, and a higher system throughput is observed close to the system value UB. The performance of this developed method will be comparable to the orthogonal frequency division multiplexing-based long-term evolution scheme, without the need to build any additional infrastructure. Hence, reduce the cost of the system to both operators and consumers without sacrificing quality. Keywords: HSDPA MIMO, Successive interference cancellation, Minimum mean square error equalization, Resource allocation 1 Introduction Wireless communication systems known as multiple- input multiple-output (MIMO) systems, which have mul- tiple transmit and receive antennas, can be used to exploit the diversity and the multiplexing gains of wireless chan- nels to increase their spectral efficiency. As an extension to Shannon’s capacity [1], the MIMO channel capac- ity bound was obtained by Foschini and Gans [2] and Telatar [3] independently. Assuming that perfect chan- nel state information (CSI) is available at the transmitter, the MIMO system capacity upper bound (UB) can be obtained using the eigen modes of the MIMO channel matrix by performing water-filling (WF) over the spatial sub-channels. An important MIMO system design con- sideration is to operate the system close to its capacity UB. The objective of this article is to show how the high- speed downlink packet access (HSDPA) MIMO system can operate close to its capacity UB. The third generation partnership project (3GPP) has developed the HSDPA system, given in the Release 5 *Correspondence: [email protected] Intelligent Systems and Networks Group, Department of Electrical and Electronic Engineering, Imperial College London, London SW7 2AZ, UK specification [4] of the Universal Mobile Telecommuni- cations System, as a multi-code wide-band code division multiple access (CDMA) system. To further increase the data rate, the HSDPA system introduced new features [5] such as adaptive modulation and coding and fast schedul- ing. The standardization of the Dual Stream Transmit Diversity (D-TxAA) HSDPA MIMO system for a single- user in 3GPP Release 7 [6] further improved the downlink throughput without requiring a new spectrum or any additional bandwidth. In [7], measurements are carried out to evaluate the per- formance of the standardized 3G HSDPA MIMO system with a CDMA transmission. It is shown that the current systems are utilizing only about 40% of the available down- link capacity. The capacity curve is approximately 10 dB away from the capacity UB [8] at high signal to noise ratios. There is an opportunity to improve the HSDPA system capacity, when operating over frequency selective channels, by enhancing the HSDPA MIMO standard of the equal energy allocation scheme as is specified in [6]. The frequency selectivity problem, which causes a large drop in throughput for the HSDPA due the inter-symbol interference (ISI) problem, is not a major problem for © 2013 Gurcan et al.; licensee Springer. This is an Open Access article distributed under the terms of the Creative Commons Attribution License (http://creativecommons.org/licenses/by/2.0), which permits unrestricted use, distribution, and reproduction in any medium, provided the original work is properly cited.
Transcript of RESEARCH OpenAccess Systemvalue-basedoptimumspreading ...€¦ · RESEARCH OpenAccess...
Gurcan et al. EURASIP Journal onWireless Communications andNetworking 2013, 2013:74http://jwcn.eurasipjournals.com/content/2013/1/74
RESEARCH Open Access
System value-based optimum spreadingsequence selection for high-speed downlinkpacket access (HSDPA) MIMOMustafa K Gurcan*, Irina Ma, Anusorn Chungtragarn and Hamdi Joudeh
Abstract
This article proposes the use of system value-based optimization with a symbol-level minimum mean square errorequalizer and a successive interference cancellation which achieves a system value upper bound (UB) close to theGaussian UB for the high-speed downlink packet access system without affecting any significant computational cost.It is shown that by removing multi-code channels with low gains, the available energy is more efficiently used, and ahigher system throughput is observed close to the system value UB. The performance of this developed method willbe comparable to the orthogonal frequency division multiplexing-based long-term evolution scheme, without theneed to build any additional infrastructure. Hence, reduce the cost of the system to both operators and consumerswithout sacrificing quality.
Keywords: HSDPA MIMO, Successive interference cancellation, Minimum mean square error equalization, Resourceallocation
1 IntroductionWireless communication systems known as multiple-input multiple-output (MIMO) systems, which have mul-tiple transmit and receive antennas, can be used to exploitthe diversity and the multiplexing gains of wireless chan-nels to increase their spectral efficiency. As an extensionto Shannon’s capacity [1], the MIMO channel capac-ity bound was obtained by Foschini and Gans [2] andTelatar [3] independently. Assuming that perfect chan-nel state information (CSI) is available at the transmitter,the MIMO system capacity upper bound (UB) can beobtained using the eigen modes of the MIMO channelmatrix by performing water-filling (WF) over the spatialsub-channels. An important MIMO system design con-sideration is to operate the system close to its capacityUB. The objective of this article is to show how the high-speed downlink packet access (HSDPA) MIMO systemcan operate close to its capacity UB.The third generation partnership project (3GPP) has
developed the HSDPA system, given in the Release 5
*Correspondence: [email protected] Systems and Networks Group, Department of Electrical andElectronic Engineering, Imperial College London, London SW7 2AZ, UK
specification [4] of the Universal Mobile Telecommuni-cations System, as a multi-code wide-band code divisionmultiple access (CDMA) system. To further increase thedata rate, the HSDPA system introduced new features [5]such as adaptive modulation and coding and fast schedul-ing. The standardization of the Dual Stream TransmitDiversity (D-TxAA) HSDPA MIMO system for a single-user in 3GPP Release 7 [6] further improved the downlinkthroughput without requiring a new spectrum or anyadditional bandwidth.In [7], measurements are carried out to evaluate the per-
formance of the standardized 3G HSDPA MIMO systemwith a CDMA transmission. It is shown that the currentsystems are utilizing only about 40% of the available down-link capacity. The capacity curve is approximately 10 dBaway from the capacity UB [8] at high signal to noiseratios. There is an opportunity to improve the HSDPAsystem capacity, when operating over frequency selectivechannels, by enhancing the HSDPA MIMO standard ofthe equal energy allocation scheme as is specified in [6].The frequency selectivity problem, which causes a large
drop in throughput for the HSDPA due the inter-symbolinterference (ISI) problem, is not a major problem for
© 2013 Gurcan et al.; licensee Springer. This is an Open Access article distributed under the terms of the Creative CommonsAttribution License (http://creativecommons.org/licenses/by/2.0), which permits unrestricted use, distribution, and reproductionin any medium, provided the original work is properly cited.
Gurcan et al. EURASIP Journal onWireless Communications and Networking 2013, 2013:74 Page 2 of 19http://jwcn.eurasipjournals.com/content/2013/1/74
the orthogonal frequency division multiplexing (OFDM)-based systems [long-term evolution (LTE) advanced andWiMAX] as they use a guard period to deal with theISI problem. If the throughput reduction problem is notsolved in the HSDPA system, the OFDM-based systemswill have the upper hand over the HSDPA system inurban environments. The HSDPA single-input single-output (SISO) system has been themain focus of the studyin [9], which provides tools to combat frequency selec-tivity, when bringing the HSDPA SISO performance closeto the OFDM-based systems. Should the ISI problem besolved for the HSDPAMIMO-based systems, the currentHSDPA MIMO system would achieve throughputs closeto the LTE advanced without the need to change thewholeinfrastructure by using throughput optimizationmethods.This is the focus of the current investigation.
2 Current investigation and related workThe downlink throughput optimization for the HSDPAmulti-code CDMA system [10] considers the signaturesequence and the power allocation for downlink users.3GPP standardized an approach to spread the transmis-sion symbols by using a given fixed set size of orthogonalvariable spreading factor (OVSF) signature sequences.A MIMO system requires a signature sequence set sizehigher than the given single set of OVSF signaturesequences available for a SISO system. 3GPP standardizeda method to increase the OVSF set size by multiply-ing the given set with precoding weights and then con-catenating the weighted sets of the spreading sequences.Each concatenated spreading sequence is used to trans-mit one symbol and is orthogonal to the remaining set ofspreading sequences available at the transmitter for thetransmission of other symbols. However, the spreadingsequences’ orthogonality is lost at the receiving end aftertransmission over frequency selective multipath channels.In [11,12], it is proposed that a linear minimum meansquare error (MMSE) equalizer followed by a de-spreadercould be used to restore partial orthogonality between thereceiver de-spreading and the matched filter sequencesin the detection process after receiving signals trans-mitted over a multipath channel. Recent developmentshave shown that linear MMSE equalizers suffer from aself-interference (SI) problem caused by ISI and multi-ple access interference, when operating over multipathchannels.SI reduces the system throughput performance, but
good receiver design will minimize the degradationcaused by the SI. When encountering SI various ver-sions of interference cancellers could be used in conjunc-tion with non-optimal receivers to improve the systemthroughput for the HSDPA system over frequency selec-tive parallel channels. In [13], it is shown that a successiveinterference cancellation (SIC) scheme performs better
than a parallel interference cancellation scheme, when thesignal-to-noise ratio (SNR) differs over each frequencyselective parallel channel. The works reported in [14-16]focus on the use of linear MMSE equalizers and SIC inreduction of the overall SI.A two-stage SIC detection scheme with transmitter
power optimization is examined in [16,17] to improve thethroughput performance for multi-code downlink trans-mission. In [18], the power at the transmitter and a two-stage SIC receiver are jointly and iteratively optimized fora multi-code MIMO system. However, at each iteration ofthe SIC, the equalizer coefficient and the power allocationcalculations require an inversion of a covariance matrixfor the received signal. The dimension of the covari-ance matrix is usually large and, as such, the iterativepower allocation, the linear MMSE equalizer and the SICimplementations at the receiver become computationallyexpensive.The focus of the article is on an HSDPA MIMO-based
radio downlink system, which has a number of paral-lel SISO or MIMO frequency selective channels overwhich data are transmitted. The data are represented bya number of data symbols, which are spread by a groupof spreading sequences when using the HSDPA systemeither with or without a SIC scheme. A set of signaturesequences generated from the OVSF codes with precod-ing, as specified in the 3GPP Release 7, will be considered.A receiver with a symbol-level linear MMSE equalizer willbe examined to jointly optimize the transmission energyallocation and the receiver for a single user system eitherwith or without a SIC.At the receiver each spreading sequence sk has a sys-
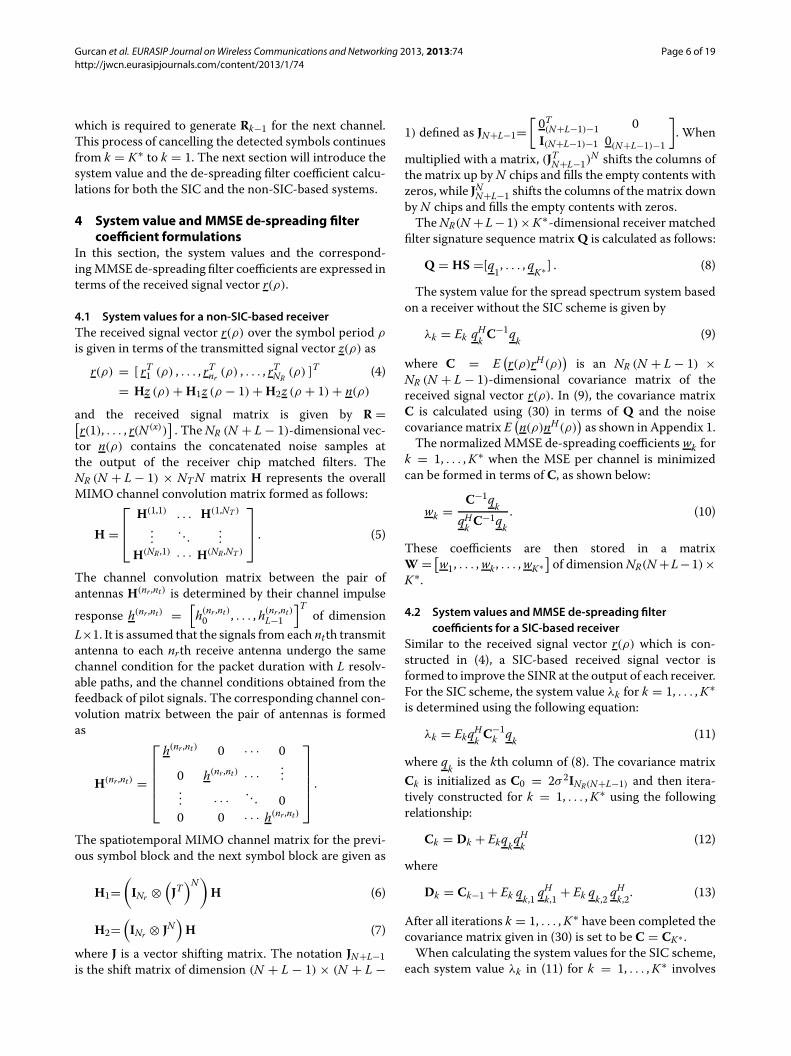
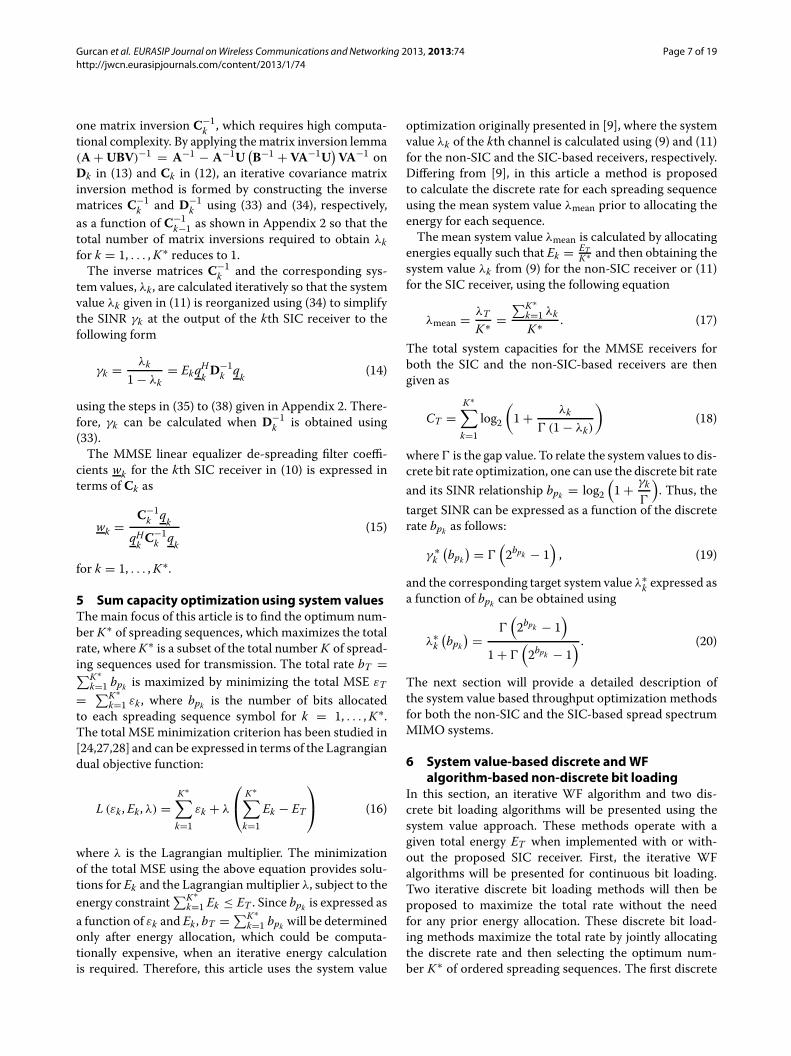
tem value λk , which is associated with the SNR γk at theoutput of each de-spreading unit. The system value λkfor each spreading sequence depends on the transmissionmultipath channel and also on the availability of the SICscheme. The implementation of each HSDPAMIMO sys-tem can be a non-SIC scheme as shown in Figure 1 ora SIC-based receiver scheme as shown in Figure 2. Thenon-SIC and the SIC-based receivers have different waysof determining the system values for a given number ofspreading sequences, a given frequency selective multi-path channel and a total transmission energy. This articlewill outline MIMO transceiver structures for the non-SICand SIC-based receivers to introduce the system valueconcept. The system value UB for the HSDPAMIMO sys-tem will be presented. This system value capacity UB isclose to the capacity of an additive white Gaussian noisechannel. It will also be shown how the system values willbe used to determine the total transmission rates for boththe non-SIC and the SIC-based SISO and MIMO systemsto maximize the total transmission rate.The objective of the total transmission rate maximiza-
tion for a given total number of spreading sequences will

Gurcan et al. EURASIP Journal onWireless Communications andNetworking 2013, 2013:74 Page 3 of 19http://jwcn.eurasipjournals.com/content/2013/1/74
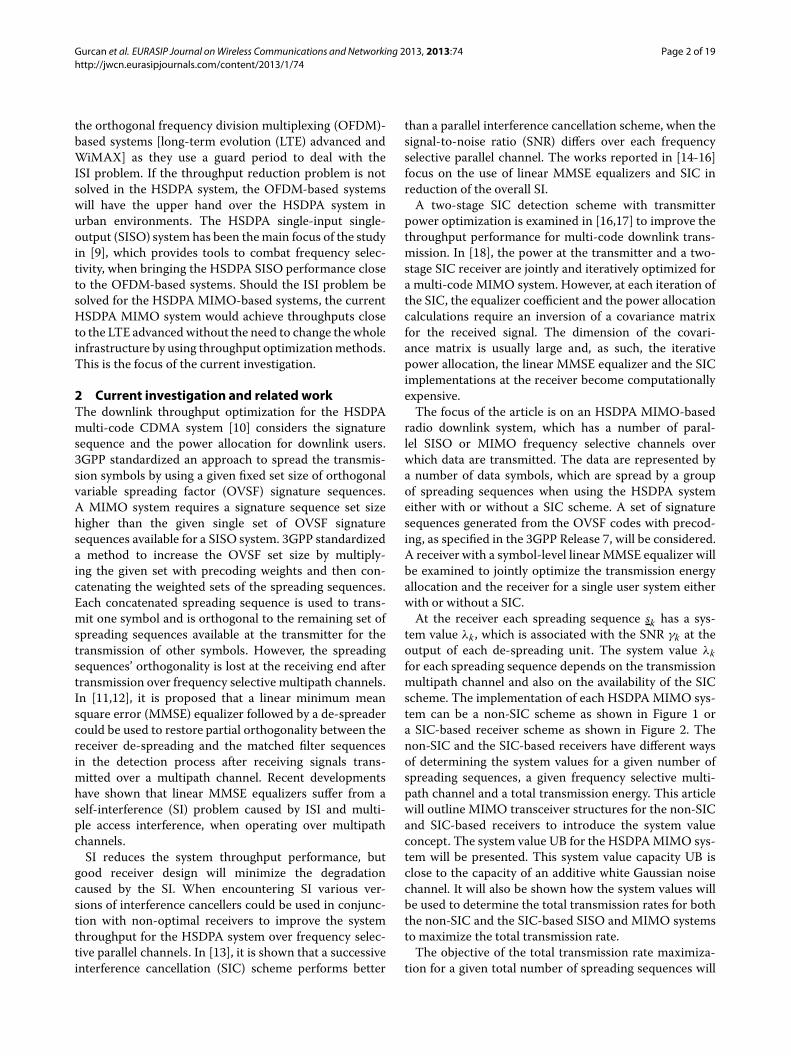
Figure 1 System block diagram for the non-SIC based MIMOHSDPA system.
be to bring the downlink throughput close to the systemvalue UB. This will be achieved by retaining the spread-ing sequences with the highest system values for a giventotal received SNR corresponding to a given total trans-mission energy ET . A given number of sequences willbe ordered so that the corresponding system values areused at the transmitter in ascending order. The optimumnumber K∗ of signature sequences will be determinedto select the first K∗-ordered signature sequences, whichmaximize the transmission throughput. The receivers will
operate in a sequence, where the detection is ordered inthe descending order of the corresponding system valuesfor the SIC-based systems.As shown in [19], the WF optimization is generally
used for parallel channels with different sub-channel gainsto provide optimum sub-channel selection, energy dis-tribution, and also channel ordering. The iterative WFsum-capacity optimization is extensively examined in[20-23] and is proven to converge to the sum capacity UBof the multiple-access channel [20] to provide an UB for
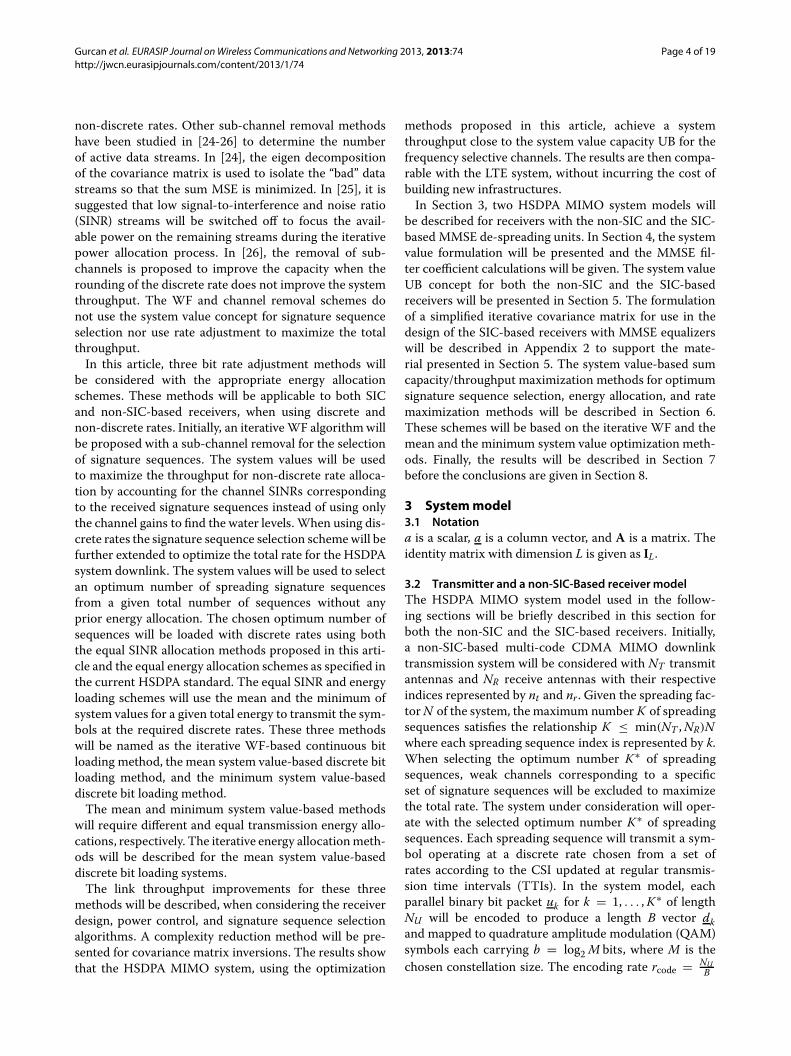
Figure 2 Receiver system block diagram for SIC based detection. The block diagram for the SIC based HSDPA MIMO system is given.
Gurcan et al. EURASIP Journal onWireless Communications and Networking 2013, 2013:74 Page 4 of 19http://jwcn.eurasipjournals.com/content/2013/1/74
non-discrete rates. Other sub-channel removal methodshave been studied in [24-26] to determine the numberof active data streams. In [24], the eigen decompositionof the covariance matrix is used to isolate the “bad” datastreams so that the sum MSE is minimized. In [25], it issuggested that low signal-to-interference and noise ratio(SINR) streams will be switched off to focus the avail-able power on the remaining streams during the iterativepower allocation process. In [26], the removal of sub-channels is proposed to improve the capacity when therounding of the discrete rate does not improve the systemthroughput. The WF and channel removal schemes donot use the system value concept for signature sequenceselection nor use rate adjustment to maximize the totalthroughput.In this article, three bit rate adjustment methods will
be considered with the appropriate energy allocationschemes. These methods will be applicable to both SICand non-SIC-based receivers, when using discrete andnon-discrete rates. Initially, an iterativeWF algorithmwillbe proposed with a sub-channel removal for the selectionof signature sequences. The system values will be usedto maximize the throughput for non-discrete rate alloca-tion by accounting for the channel SINRs correspondingto the received signature sequences instead of using onlythe channel gains to find the water levels. When using dis-crete rates the signature sequence selection schemewill befurther extended to optimize the total rate for the HSDPAsystem downlink. The system values will be used to selectan optimum number of spreading signature sequencesfrom a given total number of sequences without anyprior energy allocation. The chosen optimum number ofsequences will be loaded with discrete rates using boththe equal SINR allocation methods proposed in this arti-cle and the equal energy allocation schemes as specified inthe current HSDPA standard. The equal SINR and energyloading schemes will use the mean and the minimum ofsystem values for a given total energy to transmit the sym-bols at the required discrete rates. These three methodswill be named as the iterative WF-based continuous bitloading method, the mean system value-based discrete bitloading method, and the minimum system value-baseddiscrete bit loading method.The mean and minimum system value-based methods
will require different and equal transmission energy allo-cations, respectively. The iterative energy allocationmeth-ods will be described for the mean system value-baseddiscrete bit loading systems.The link throughput improvements for these three
methods will be described, when considering the receiverdesign, power control, and signature sequence selectionalgorithms. A complexity reduction method will be pre-sented for covariance matrix inversions. The results showthat the HSDPA MIMO system, using the optimization
methods proposed in this article, achieve a systemthroughput close to the system value capacity UB for thefrequency selective channels. The results are then compa-rable with the LTE system, without incurring the cost ofbuilding new infrastructures.In Section 3, two HSDPA MIMO system models will
be described for receivers with the non-SIC and the SIC-based MMSE de-spreading units. In Section 4, the systemvalue formulation will be presented and the MMSE fil-ter coefficient calculations will be given. The system valueUB concept for both the non-SIC and the SIC-basedreceivers will be presented in Section 5. The formulationof a simplified iterative covariance matrix for use in thedesign of the SIC-based receivers with MMSE equalizerswill be described in Appendix 2 to support the mate-rial presented in Section 5. The system value-based sumcapacity/throughput maximization methods for optimumsignature sequence selection, energy allocation, and ratemaximization methods will be described in Section 6.These schemes will be based on the iterative WF and themean and the minimum system value optimization meth-ods. Finally, the results will be described in Section 7before the conclusions are given in Section 8.
3 Systemmodel3.1 Notationa is a scalar, a is a column vector, and A is a matrix. Theidentity matrix with dimension L is given as IL.
3.2 Transmitter and a non-SIC-Based receiver modelThe HSDPA MIMO system model used in the follow-ing sections will be briefly described in this section forboth the non-SIC and the SIC-based receivers. Initially,a non-SIC-based multi-code CDMA MIMO downlinktransmission system will be considered with NT transmitantennas and NR receive antennas with their respectiveindices represented by nt and nr . Given the spreading fac-torN of the system, the maximum number K of spreadingsequences satisfies the relationship K ≤ min(NT ,NR)Nwhere each spreading sequence index is represented by k.When selecting the optimum number K∗ of spreadingsequences, weak channels corresponding to a specificset of signature sequences will be excluded to maximizethe total rate. The system under consideration will oper-ate with the selected optimum number K∗ of spreadingsequences. Each spreading sequence will transmit a sym-bol operating at a discrete rate chosen from a set ofrates according to the CSI updated at regular transmis-sion time intervals (TTIs). In the system model, eachparallel binary bit packet uk for k = 1, . . . ,K∗ of lengthNU will be encoded to produce a length B vector dkand mapped to quadrature amplitude modulation (QAM)symbols each carrying b = log2 M bits, where M is thechosen constellation size. The encoding rate rcode = NU
B
Gurcan et al. EURASIP Journal onWireless Communications andNetworking 2013, 2013:74 Page 5 of 19http://jwcn.eurasipjournals.com/content/2013/1/74
will be used to obtain a realizable discrete rate of bp =rcode × log2 M bits per symbol where p = 1, . . . , P arethe different discrete bit indices available. The bit rate foreach spreading sequence is represented by bpk for k =1, . . . ,K∗.A non-SIC-based system model is shown in Figure 1.
In the CDMA system, the number of symbols transmit-ted per packet is given by N(x) = TTI
NTcwhere Tc is
the chip period and NTc is the symbol period. In eachparallel channel, the mapped packet of symbols corre-sponding to dk over 1 TTI is represented by an N(x)
long vector xk for k = 1, . . . ,K∗, where each symbolin xk carries unity average energy. The symbols over K∗parallel channels are stored in an N(x)× K dimensionalmatrix X =[ x1, . . . , xK ] which is also expressed as X =[y(1), . . . , y(ρ), . . . , y(N(x))]T where the length K∗ vectory(ρ) =[ x1(ρ), . . . , xK∗(ρ)]T contains symbols over thesymbol periods of ρ = 1, . . . ,N(x).Each spreading sequence will have an energy allocated,
where the assigned energies are stored in aK∗×K∗ dimen-sional amplitude matrix A = diag
(√E1,
√E2, . . . ,
√EK∗
).
The energy weighted symbols will then be spread by sig-nature sequences (spreading codes) and are representedby an (NTN) × K∗ signature sequence matrix
S =[ST1 , . . . , STnt , . . . , STNT
]T =[ s1, . . . , sK∗ ] (1)
where |sk |2 = 1 and Snt =[ s1,nt , s2,nt , . . . , sK∗ ,nt ] is aN×K∗spreading sequencematrix of the ntth antenna. The lengthN transmit signal vector at antenna nt is given by znt (ρ) =SntAy (ρ) for the symbol period ρ. The vector znt (ρ) willthen be fed to a pulse shaping filter at integer multiples ofTc before up converting to the desired carrier frequency.The length N ×NT MIMO transmit signal vector is given
by z (ρ) =[zT1 (ρ) , . . . , zTnt (ρ) , . . . , zTNT
(ρ)
]T.
Assuming the clocks at the transmitter and the receiverare fully synchronized, the signals arriving at the receiveantennas will be firstly down converted to the basebandbefore sampling at every Tc at the output of the receiverchip match filter.The receiver matched filtered signal vector r(ρ) for each
symbol period will be represented by an NR (N + L − 1)long vector r(ρ) =[ rT1 (ρ), . . . , rTnr (ρ), . . . , rTNR
(ρ) ]T ,where L is the number of resolvable paths in a mul-tipath wireless channel. The samples at the output ofthe chip match filter of the nrth antenna are repre-sented by an (N + L − 1)-length vector rnr (ρ) =[ rnr,1 (ρ) , . . . , rnr ,(N+L−1)(ρ)]. The NR(N + L − 1) ×N(x)-dimensional matched filter matrix R is formedby taking r(ρ) as its ρth-column such that R =[ r(1), . . . , r(ρ), . . . , r(N(x))]. With r (ρ) and the NR(N +L− 1)×K∗-dimensional MMSE linear de-spreading filter
matrix W = [w1, . . . ,wK∗
]containing de-spreading filter
coefficients wk each of which is calculated using (10) fork = 1, . . . ,K∗. The estimate y(ρ) of the transmittedsymbol y(ρ) can be found as follows:
y(ρ) = [y1(ρ), . . . , yK∗(ρ)
] = [x1(ρ), . . . , xK∗(ρ)
]T=WHr (ρ) .
(2)
The vector y(ρ) is used to form the N(x) ×K-dimensionalde-spread signal matrix X =[ x1, . . . , xK∗] or alternativelyX =[ y(1), . . . , y(ρ), . . . , y(N(x))]T by using xTk = wH
k R tode-spread the received signal vector of the kth channel.The de-spread signals pass through the decision device,where the signals are quantized, de-mapped and decodedto form binary data vectors uk,D for k = 1, . . . ,K .At the output of each receiver, the mean square error
(MSE) between the transmitted symbol yk(ρ) and the esti-mated symbol yk(ρ) is given as εk = E
(∣∣yk(ρ) − yk(ρ)∣∣2).
When theMSE is minimized, it has a relationship with theSINR γk and the system value λk as εk = 1
1+γk= 1 − λk .
Therefore, the system value is given by
λk = 1 − εk = γk1 + γk
. (3)
3.3 The SIC-based receiver modelFigure 2 illustrates the system model for a SIC-basedreceiver, which collects the received signals r1(ρ) torNR(ρ) to formulate the received signal vector r(ρ). Thereceiver processes and cancels the signals channel bychannel to ensure that the SI is minimized. Starting fromchannel K∗ and by setting the received signal matrixRK∗ = R = [
r(1), . . . , r(N(x))], theNR (N + L − 1)×N(x)-
dimensional reduced data matrix Rk−1 will iteratively becalculated using Rk−1 = Rk −√
Ek�k from k = K∗ to k =1 where
√Ek is the allocated energy of the kth channel.
Thematrix�k of dimensionNR (N + L − 1)×N(x) will beconstructed as �k = qkx
Tk,D + qk,1x
Tk,D1 + qk,2x
Tk,D2, where
the length N(x) vectors xk,D, xk,D1 = JN (x) xk,D and xk,D2= JTN (x)xk,D are the detected stream of the current sym-bol period, the detected streams with ISI symbols receivedin the previous and the next symbol periods, respectively.The NR (N + L − 1)-dimensional receiver matched filtersequences qk , qk,1 and qk,2 are given in (8), (31), and (32)for the current, previous, and next symbols, respectively.At each kth channel, the estimated symbol vector xk,D
is generated by using each MMSE de-spreading vector wkfrom (15) to yield a de-spread signal vector of xTk = wH
k Rkand an estimated bit stream uk,D. The decoded bit vec-tor uk,D is re-coded at the receiver and re-modulated toregenerate the transmit symbol vector xk,D at the outputof the decision device. The vector xk,D is used to form �k
Gurcan et al. EURASIP Journal onWireless Communications and Networking 2013, 2013:74 Page 6 of 19http://jwcn.eurasipjournals.com/content/2013/1/74
which is required to generate Rk−1 for the next channel.This process of cancelling the detected symbols continuesfrom k = K∗ to k = 1. The next section will introduce thesystem value and the de-spreading filter coefficient calcu-lations for both the SIC and the non-SIC-based systems.
4 System value and MMSE de-spreading filtercoefficient formulations
In this section, the system values and the correspond-ingMMSE de-spreading filter coefficients are expressed interms of the received signal vector r(ρ).
4.1 System values for a non-SIC-based receiverThe received signal vector r(ρ) over the symbol period ρ
is given in terms of the transmitted signal vector z(ρ) as
r(ρ) = [ rT1 (ρ) , . . . , rTnr (ρ) , . . . , rTNR (ρ) ]T (4)= Hz (ρ) + H1z (ρ − 1) + H2z (ρ + 1) + n(ρ)
and the received signal matrix is given by R =[r(1), . . . , r(N(x))
]. TheNR (N + L − 1)-dimensional vec-
tor n(ρ) contains the concatenated noise samples atthe output of the receiver chip matched filters. TheNR (N + L − 1) × NTN matrix H represents the overallMIMO channel convolution matrix formed as follows:
H =⎡⎢⎣ H(1,1) . . . H(1,NT )
.... . .
...H(NR ,1) · · · H(NR,NT )
⎤⎥⎦ . (5)
The channel convolution matrix between the pair ofantennas H(nr ,nt) is determined by their channel impulse
response h(nr ,nt) =[h(nr ,nt)0 , . . . , h(nr ,nt)
L−1
]Tof dimension
L×1. It is assumed that the signals from each ntth transmitantenna to each nrth receive antenna undergo the samechannel condition for the packet duration with L resolv-able paths, and the channel conditions obtained from thefeedback of pilot signals. The corresponding channel con-volution matrix between the pair of antennas is formedas
H(nr ,nt) =
⎡⎢⎢⎢⎢⎣h(nr ,nt) 0 · · · 0
0 h(nr ,nt) · · · ...... · · · . . . 00 0 · · · h(nr ,nt)
⎤⎥⎥⎥⎥⎦ .
The spatiotemporal MIMO channel matrix for the previ-ous symbol block and the next symbol block are given as
H1=(INr ⊗
(JT)N)
H (6)
H2=(INr ⊗ JN
)H (7)
where J is a vector shifting matrix. The notation JN+L−1is the shift matrix of dimension (N + L − 1) × (N + L −
1) defined as JN+L−1=[0T(N+L−1)−1 0I(N+L−1)−1 0(N+L−1)−1
]. When
multiplied with a matrix, (JTN+L−1)N shifts the columns of
the matrix up byN chips and fills the empty contents withzeros, while JNN+L−1 shifts the columns of the matrix downby N chips and fills the empty contents with zeros.TheNR(N +L− 1)×K∗-dimensional receiver matched
filter signature sequence matrixQ is calculated as follows:
Q = HS =[q1, . . . , qK∗] . (8)
The system value for the spread spectrum system basedon a receiver without the SIC scheme is given by
λk = Ek qHk C−1qk (9)
where C = E(r(ρ)rH(ρ)
)is an NR (N + L − 1) ×
NR (N + L − 1)-dimensional covariance matrix of thereceived signal vector r(ρ). In (9), the covariance matrixC is calculated using (30) in terms of Q and the noisecovariance matrix E
(n(ρ)nH(ρ)
)as shown in Appendix 1.
The normalizedMMSE de-spreading coefficients wk fork = 1, . . . ,K∗ when the MSE per channel is minimizedcan be formed in terms of C, as shown below:
wk = C−1qkqHk C−1qk
. (10)
These coefficients are then stored in a matrixW = [
w1, . . . ,wk , . . . ,wK∗]of dimensionNR(N +L−1)×
K∗.
4.2 System values andMMSE de-spreading filtercoefficients for a SIC-based receiver
Similar to the received signal vector r(ρ) which is con-structed in (4), a SIC-based received signal vector isformed to improve the SINR at the output of each receiver.For the SIC scheme, the system value λk for k = 1, . . . ,K∗is determined using the following equation:
λk = EkqHk C−1k qk (11)
where qk is the kth column of (8). The covariance matrixCk is initialized as C0 = 2σ 2INR(N+L−1) and then itera-tively constructed for k = 1, . . . ,K∗ using the followingrelationship:
Ck = Dk + EkqkqHk (12)
where
Dk = Ck−1 + Ek qk,1 qHk,1 + Ek qk,2 q
Hk,2. (13)
After all iterations k = 1, . . . ,K∗ have been completed thecovariance matrix given in (30) is set to be C = CK∗ .When calculating the system values for the SIC scheme,
each system value λk in (11) for k = 1, . . . ,K∗ involves
Gurcan et al. EURASIP Journal onWireless Communications andNetworking 2013, 2013:74 Page 7 of 19http://jwcn.eurasipjournals.com/content/2013/1/74
one matrix inversion C−1k , which requires high computa-
tional complexity. By applying thematrix inversion lemma(A + UBV)−1 = A−1 − A−1U (B−1 + VA−1U)VA−1 onDk in (13) and Ck in (12), an iterative covariance matrixinversion method is formed by constructing the inversematrices C−1
k and D−1k using (33) and (34), respectively,
as a function of C−1k−1 as shown in Appendix 2 so that the
total number of matrix inversions required to obtain λkfor k = 1, . . . ,K∗ reduces to 1.The inverse matrices C−1
k and the corresponding sys-tem values, λk , are calculated iteratively so that the systemvalue λk given in (11) is reorganized using (34) to simplifythe SINR γk at the output of the kth SIC receiver to thefollowing form
γk = λk1 − λk
= EkqHk D−1k qk (14)
using the steps in (35) to (38) given in Appendix 2. There-fore, γk can be calculated when D−1
k is obtained using(33).The MMSE linear equalizer de-spreading filter coeffi-
cients wk for the kth SIC receiver in (10) is expressed interms of Ck as
wk = C−1k qk
qHk C−1k qk
(15)
for k = 1, . . . ,K∗.
5 Sum capacity optimizationusing system valuesThemain focus of this article is to find the optimum num-ber K∗ of spreading sequences, which maximizes the totalrate, where K∗ is a subset of the total number K of spread-ing sequences used for transmission. The total rate bT =∑K∗
k=1 bpk is maximized by minimizing the total MSE εT
= ∑K∗k=1 εk , where bpk is the number of bits allocated
to each spreading sequence symbol for k = 1, . . . ,K∗.The total MSE minimization criterion has been studied in[24,27,28] and can be expressed in terms of the Lagrangiandual objective function:
L (εk , Ek , λ) =K∗∑k=1
εk + λ
⎛⎝ K∗∑k=1
Ek − ET
⎞⎠ (16)
where λ is the Lagrangian multiplier. The minimizationof the total MSE using the above equation provides solu-tions for Ek and the Lagrangian multiplier λ, subject to theenergy constraint
∑K∗k=1 Ek ≤ ET . Since bpk is expressed as
a function of εk and Ek , bT = ∑K∗k=1 bpk will be determined
only after energy allocation, which could be computa-tionally expensive, when an iterative energy calculationis required. Therefore, this article uses the system value
optimization originally presented in [9], where the systemvalue λk of the kth channel is calculated using (9) and (11)for the non-SIC and the SIC-based receivers, respectively.Differing from [9], in this article a method is proposedto calculate the discrete rate for each spreading sequenceusing the mean system value λmean prior to allocating theenergy for each sequence.The mean system value λmean is calculated by allocating
energies equally such that Ek = ETK∗ and then obtaining the
system value λk from (9) for the non-SIC receiver or (11)for the SIC receiver, using the following equation
λmean = λTK∗ =
∑K∗k=1 λkK∗ . (17)
The total system capacities for the MMSE receivers forboth the SIC and the non-SIC-based receivers are thengiven as
CT =K∗∑k=1
log2
(1 + λk
� (1 − λk)
)(18)
where� is the gap value. To relate the system values to dis-crete bit rate optimization, one can use the discrete bit rateand its SINR relationship bpk = log2
(1 + γk
�
). Thus, the
target SINR can be expressed as a function of the discreterate bpk as follows:
γ ∗k(bpk
) = �(2bpk − 1
), (19)
and the corresponding target system value λ∗k expressed as
a function of bpk can be obtained using
λ∗k(bpk
) =�(2bpk − 1
)1 + �
(2bpk − 1
) . (20)
The next section will provide a detailed description ofthe system value based throughput optimization methodsfor both the non-SIC and the SIC-based spread spectrumMIMO systems.
6 System value-based discrete andWFalgorithm-based non-discrete bit loading
In this section, an iterative WF algorithm and two dis-crete bit loading algorithms will be presented using thesystem value approach. These methods operate with agiven total energy ET when implemented with or with-out the proposed SIC receiver. First, the iterative WFalgorithms will be presented for continuous bit loading.Two iterative discrete bit loading methods will then beproposed to maximize the total rate without the needfor any prior energy allocation. These discrete bit load-ing methods maximize the total rate by jointly allocatingthe discrete rate and then selecting the optimum num-ber K∗ of ordered spreading sequences. The first discrete
Gurcan et al. EURASIP Journal onWireless Communications and Networking 2013, 2013:74 Page 8 of 19http://jwcn.eurasipjournals.com/content/2013/1/74
bit loading algorithm will use the mean system valueλmean to determine the optimum number K∗ of spreadingsequences and to select the sequences prior to allocat-ing the energy for each sequence. The second discrete bitloading method will use the minimum system value λminto select the optimum number of sequences.The system values will be ordered in an ascending order
for all combinations of Kopt = K , . . . , 1 for both dis-crete bit loading methods prior to selecting the optimumnumber of signature sequences. The temporary numberKopt of optimum spreading sequences is used as an ini-tial value for each loop in an iterative sequence numberoptimization process.For the discrete bit loading methods with λmean and
λmin, margin adaptive (MA) loading (equal rate) algo-rithms will be considered initially so that all spreadingsequences have the same rate bp = bpk for k = 1, . . . ,K∗by using the target system values identified in (19) interms of the available discrete rates. The total transmis-sion rate is RT = K∗bp. Then, the two-group (TG) rateadaptive optimization will be described for both cases touse the wasted (residual) energy caused by quantizationloss, by loading a certain number of channels,m, with thenext discrete rate bp+1 to further increase the total rate toRT ,TG = (K∗ − m)bp + mbp+1.
6.1 Iterative WF-based continuous bit loadingThe iterativeWF was originally developed to remove sub-channels, which contain negative energies, and to maxi-mize the total rate. This section describes the iterativeWFoptimization, which finds the optimum sub-channels K∗
WFusing the system values for continuous unequal bit load-ing. This iterativeWF algorithm can also be applied to theHSDPA system with and without SIC by using the systemvalue λk formulation given in (9) and (11), respectively.The algorithm first allocates energies to the channelsbefore the rates and the optimum number of channelsare determined. The iterative WF starts with Kopt = K ,where Kopt is the temporary optimum number of codes.In each Koptth iteration, the WF calculates the channelSINR per energy unit vector [ g]k and assigns energies Ekfor k = 1, . . . ,Kopt. The signature sequences are reorderedstarting with those signature sequences which have thelowest channel SINR. The first sub-channel is removed ifit was assigned with a negative energy. When there arenomore sub-channels with negative energies, energies areallocated iteratively until they converge. This continuesunless a channel with negative energy is detected duringthe process. With the later case, the corresponding sub-channel will be removed and energies are recalculated asbefore. The algorithm will return the optimum number ofcoded channels K∗, their respective allocated energies andsignature sequences, covariance matrix C or Ck and theMMSE receiver coefficient.
The iterative WF algorithm initializes Kopt = K and theprocedure is summarized as follows:
1. Initialize the loop counter as I = 1. The number ofenergies Ek is Kopt and vectors qk , qk,1, qk,2, andkorder are of length Kopt.
2. Perform energy allocation:
(a) Calculate the channel SINR per energy unit
vector[g]k
= λkEk (1 − λk)
by finding λk
from (9) for non-SIC or (11) when using theSIC receiver.
(b) Determine the WF constant
KWF = 1K∗
⎛⎜⎝ET + �∑K∗
k=11[g]k
⎞⎟⎠ and
energy allocations Ek = KWF − �[g]k
for
k = 1, . . . ,Kopt.
3. Perform signature sequence reordering procedure:
(a) Find the term ck , the indices of the k thsmallest element of g. Store it in the vectorkWF.
(b) Reorder vectors [Q]k =[Q]ck ,[Q1]k =[Q1]ck , and [Q2]k =[Q2]ck as wellas energies Ek = Eak for k = 1, . . . ,Kopt.
4. Carry out the channel removal process:If E1 < 0, remove this channel by settingKopt = Kopt − 1. Set Ek = Ek+1, qk = qk+1,qk,1 = q
(k+1),1, qk,2 = q(k+1),2 and
[kWF
]k =[
kWF]k+1 for k = 1, . . . ,K∗. FormQe = [Q,Q1,Q2].
Repeat the process from step 1.Otherwise, K∗ = Kopt, set counter I = I + 1 andrepeat the process from step 2 until I = Imax isreached.
6.2 System value-based signature sequence ordering fordiscrete loading
This section will describe the use of system values forordering the signature sequences to maximize the systemcapacity by determining and selecting the optimum num-ber of signature sequences for receivers with and withoutthe SIC scheme. The signature sequence ordering processstarts with by setting Kopt = K and continues by itera-tively adjusting Kopt = Kopt − 1 until Kopt = 1 is reached.In each iteration, the system values are calculated, thenthe signature sequences (or coded channels) are ordered,and the signature sequence containing the smallest systemvalue is removed. This generates a new set of selected andordered signature sequences for each Koptth iteration.
Gurcan et al. EURASIP Journal onWireless Communications andNetworking 2013, 2013:74 Page 9 of 19http://jwcn.eurasipjournals.com/content/2013/1/74
By allocating energies equally to all selected spreadingsequences k = 1, . . . ,Kopt for that iteration, the systemvalues are obtained from (9) or (11) for the non-SIC andSIC cases, respectively. These system values are stored ina Kopt length vector λ =[ λ1, . . . , λKopt]. The mean sys-tem values λmean and the minimum system value λminfor each Kopt iteration are stored in the K-length vectors[ λmean]Kopt and [ λmin]Kopt respectively where λmean andλmin are initialized as 0K .The system values given in λ are sorted in an ascend-
ing order for the current Kopt iteration and are storedin the Koptth column of the K × K matrix λstore, i.e., in[ λstore]1:Kopt,Kopt . The indices of the ordered system val-ues are stored in a Kopt length vector korder, where indicesrange from 1 to Kopt.The next step is to find the Kopt-length vector kselect =
[ a1, . . . , ak , . . . , aKopt] which contains the indices of theselected subset of the signature sequences used in the cur-rent Kopt iteration. These are also ordered according tothe ascending order of the system values using korder. Nextkselect will be stored in the Koptth column of the K × Kupper triangular matrix Kseq such that [Kseq]1:Kopt,Kopt .The vector kselect is initialized as kselect =[ 1, . . . ,K ] andKseq is initialized as 0K×K .DefiningQorig,Qorig1, andQorig2 as the original unmod-
ified receiver signature sequence matrices of Q,Q1, andQ2 with its order is equivalent to S, reordering proce-dure is carried out by setting [Q]k =[Qorig]ak , [Q1]k =[Qorig1]ak and [Q2]k =[Qorig2]ak . The signature sequenceremoval will be completed by removing the first elementof kselect so that the vector length is reduced to Kopt − 1,and by removing the first columns of Q, Q1, and Q2 sothat the received signature sequence matrix dimensionbecomesNR(N +L−1)× (Kopt −1). This reduced matrixwill be used to calculate the system values, and order andremove the spreading sequences with the smallest systemvalue for the next Kopt iteration by setting Kopt = Kopt − 1and repeating the process until Kopt = 1.The procedure can be summarized as below.
1. Find all system values corresponding to each Koptfrom Kopt = K to Kopt = 1 by using the followingsteps.
(a) Allocate energy equally for each signaturesequence such that Ek = ET
Kopt, for
k = 1, . . . ,Kopt. Form the amplitude matrixA.
(b) Find λk for k = 1, . . . ,Kopt using (9) and Cfrom (30) for non-SIC, or λk from (11) andCk from (12) for SIC.Store λ =[ λ1, . . . , λKopt].
(c) Store the minimum system value[λmin
]Kopt
= min(λ) and
the mean system value[λmean
]Kopt
=∑Kopt
k λkKopt
.
2. Reorder the signature sequences and remove thesignature sequence with the minimum λk for eachKopt iteration:
(a) Find the indices of the k th smallest elementsfor k = 1, . . . ,Kopt of λ, store it in korder.
(b) Store the system values in [λstore]1:Kopt,Kopt inascending order.
(c) Find the vector kselect =[ a1, . . . , ak . . . , aKopt ]which contains the indices of the selectedsubset of the signature sequences and withordering according to korder. Store thereordered sequence index ak in
[Kseq]k,Kopt
.(d) Use ak to reorder [Q]k =[Qorig]ak ,
[Q1]k =[Qorig1]ak , and [Q2]k =[Qorig2]akfor k = 1, . . . ,Kopt.
(e) If Kopt > 1, set Kopt = Kopt − 1. SetEk = Ek+1, qk = qk+1, qk,1 = q
(k+1),1,qk,2 = q
(k+1),2 for k = 1, . . . ,K . FormQe = [Q,Q1,Q2] and repeat steps 1 and 2.Otherwise, the optimum signature sequenceidentification for the discrete loadingschemes will be performed, as described inthe next two sections.
6.3 Mean system value-based discrete bit loadingalgorithm
To achieve the same SINR distribution at the output ofeach de-spreading unit so that a higher bp is selectedfor equal rate loading, transmission energies need to beadjusted to achieve a target (fixed) SINR at each receiver.The discrete transmission rate will be identified using themean of the system value λmean. This method will operatewith an energy constraint
∑K∗k=1 Ek ≤ ET to identify the
optimum number K∗ of signature sequences and selectthe transmission signature sequences to maximize thetotal transmission rate RT ,mean.With the relationship of the target system value λ∗ and
the bit rates bp in (19), a set of target system valuesstored in the P-length vector λ∗ corresponding to all bitrates bp will be generated. In the earlier Section 6.2, theordered signature sequences for different number of sig-nature sequences are given in Kseq for all combinationsof Kopt = K , . . . , 1. For these values the rate to be trans-mitted bpk will be identified by comparing
[λmean
]Kopt
tothe target system values in λ∗for all Kopt combinations.The optimum number of codes, K∗, will be selected fromthe Kopt combination, which gives the highest total rateRT ,mean = K∗bp. This algorithm returns the total rateRT ,mean, optimum number codes K∗ and the selected and
Gurcan et al. EURASIP Journal onWireless Communications and Networking 2013, 2013:74 Page 10 of 19http://jwcn.eurasipjournals.com/content/2013/1/74
ordered signature sequence matrix S(mean). The algorithmis described below:
1. For the set of bit rates {bp}Pp=1, find thecorresponding target system value[ λ∗]p = �(2bp−1)
1−�(2bp−1)for p = 1, . . . , P.
2. Find bp,mean =[ bmean]Kopt that satisfies[ λ∗]p ≤ [
λmean]Kopt
<[ λ∗]p+1.
3. Store the total rate[Rtemp,mean
]Kopt
= Kopt×[ bmean]Kopt for
Kopt = 1, . . . ,K .4. Select the optimum signature sequences satisfying
K∗mean = arg
(max
1≤Kopt<K
[Rtemp,mean
]Kopt
).
The total rate RT ,mean = max(Rtemp,mean).5. Construct the signature sequence matrix
S(mean) =[s(mean)1 , . . . , s(mean)
K∗mean
]by setting
[ S(mean)]k =[ S]ak where ak = [Kseq]k,K∗
meanfor
k = 1, . . . ,K∗mean.
The TG optimization can be used to further maximizethe total rate by loading m channels with bp+1 so that thetotal rate becomes RT ,TGmean = (K∗
mean−mmean)bp,mean+mbp+1,mean. For the mean system value based optimiza-tion method, the number of channels mmean which loadsthe next discrete rate bp+1,mean will be obtained by findingthe maximummmean that satisfies the following inequality(K∗mean−mmean
)λ∗ (bp)+ mmeanλ
∗ (bp+1)
≤ K∗mean
[λmean
]K∗mean
. (21)
6.3.1 Energy allocation for non-SICThis section describes the energy allocation schemes forthe mean system value-based discrete bit loading alloca-tion for both the non-SIC receiver and the SIC receiverwith equal rate or TG allocation. When allocating equalrate, the bit rates of each channel are equal, i.e., bpk = bpfor k = 1, . . . ,K∗; while bit rates are allocated as bpk = bpfor k = 1, . . . , (K∗
mean − mmean) and bpk = bp+1 fork = mmean, . . . ,K∗
mean when using the TG allocation.With K∗, bpk and λ∗(bpk ) obtained in Section 6.3 the
transmission energies for the non-SIC scheme can beiteratively calculated as shown below:
Ek,i = λ∗k
qHk C−1i−1�qk
for k = 1, . . . ,K∗mean (22)
where i is the iteration number. The term C−1i−1 is calcu-
lated by inverting Ci−1 given in (30), which is a function ofEk,(i−1) for k = 1, . . . ,K∗
mean with Ek,0 = ETK∗mean
initializedfor all channels. The iteration continues until the ener-gies converge to fixed values or the maximum number ofiterations, Imax is reached.
6.3.2 Energy allocation for SICAs the iterative calculation of energy Ek,i depends on C−1
i−1which requires energies Ek,(i−1) for k = 1, . . . ,K∗ foreach iteration i, the SIC-based energy allocation methodwas developed to simplify the calculation of energy sothat Ek,i depends only on Ek,(i−1) and the stored covari-ance matrix inverse C−1
k−1 which is a function of Ek−1,Imax .The inverse covariance matrix C−1
k will be calculated onceper spreading sequence after having obtained the energyEk,Imax .The energies for the SIC-based receiver can be itera-
tively calculated from E1 to EK∗mean without any need to
invert a matrix for each energy iteration by rearranging(14) as follows:
Ek,i = γ ∗k
�qHk D−1k,(i−1) �qk
(23)
By using (33), the energy calculation given in (23) can besimplified to
Ek,i = γ ∗k(
ξ − ζ1,(i−1) |ξ3|2
− ζ2,(i−1)
(|ξ4|2 − 2ζ1,(i−1)ξ6 + ζ 2
1,(i−1)|ξ5|2 |ξ3|2))
(24)
where the weighting factors ξ ,ξ1,ξ2,ξ3,ξ4,ξ5, and ξ6 areconstructed fromC−1
k−1, qk , qk,1, and qk,2 using (36) and thecovariance matrix, used for the calculation of E1, by ini-
tializing as C−10 = 1
2σ 2 INR(N+L−1). The terms ζ1,(i−1) andζ2,(i−1) are calculated using (37) as a function of Ek,(i−1);while γ ∗
k is the target SINR calculated as a function ofbpk using (20). The iterations of Ek,i continue until theenergy converges to a fixed value or Imax is reached. Then,C−1k is calculated in terms of Ek,Imax using (34). This pro-
cess is repeated for all selected transmission channels fork = 1, . . . ,K∗
mean. Once the energies are allocated, thetransmitter provides the receiver with the allocated ener-gies. The next section will describe the minimum systemvalue-based discrete bit loading schemes.
6.4 Minimum system value-based discrete bit loadingalgorithm
An equal energy loading method is adopted for thecurrent HSDPA standards to load a discrete rate toeach spreading sequence. Equal energy allocation pro-duces varying SINRs at the receivers, but makes it sim-pler to allocate energies than the equal SINR loadingscheme. As the channel with the minimum SINR is cho-sen as the target SINR to guarantee the quality of theservice, this will also be referred to as the minimumsystem value-based discrete bit loading method. Thissection will describe how to select the optimum num-ber and the corresponding signature sequences to max-imize the total rate for the HSDPA downlink. For the
Gurcan et al. EURASIP Journal onWireless Communications andNetworking 2013, 2013:74 Page 11 of 19http://jwcn.eurasipjournals.com/content/2013/1/74
minimum system value-based discrete bit loading, thetransmission energies are allocated equally Ek = ET
K∗and there is no iterative energy adjustment. Differingfrom the mean system value-based discrete bit loading,the minimum system value λmin will be used to deter-mine the transmission rate for each spreading sequence.With λmin for all Kopt combinations and the orderingof the signature sequences given in Kseq as describedin Section Sec5.2, the bit rate bp will be selected in asimilar way to the mean system value based loading,except λmin is used to compare with the target systemvalue. The algorithm will return the optimum numberof codes K∗
mean, the total rate RT ,mean = ∑K∗k K∗
meanbpand the ordered signature sequence matrix S(min). Theminimum system value-based loading is summarizedbelow:
1. For the set of bit rates {bp}Pp=1, find thecorresponding target system value[ λ∗]p = �(2bp−1)
1−�(2bp−1)for p = 1, . . . , P.
2. Find bp,EE =[ bmin]Kopt that satisfies[ λ∗]p ≤ [
λmin]Kopt
<[ λ∗]p+1 .
3. Store the total rate[Rtemp,min
]Kopt
= Kopt×[ bmin]Kopt
for Kopt = 1, . . . ,K .4. Select the optimum number of signature sequences
by using K∗min = arg
(max
1≤Kopt<K
[Rtemp,min
]Kopt
).
The total rate becomes RT ,EE = max(Rtemp,EE).5. Construct the signature sequence matrix
S(min) =[s(min)1 , . . . , s(min)
K∗mean
]by setting
[ S(min)]k =[ S]ak where ak = [Kseq]k,K∗
minfor
k = 1, . . . ,K∗min.
Again, a TG allocation can be performed to furtherincrease the total rate. For the equal energy allocation, thechannels that have system values λk >[ λ∗]p+1 where pcorresponds to the index of bp,mean will be loaded with thenext discrete rate bp+1,mean. The total rate for the min-imum system value TG allocation will be RT ,TGmin =(K∗
min − mmin)bp,min + mminbp+1,min.The next section will provide the results obtained from
the simulations and the discussions about the perfor-mance of the different loading algorithms.
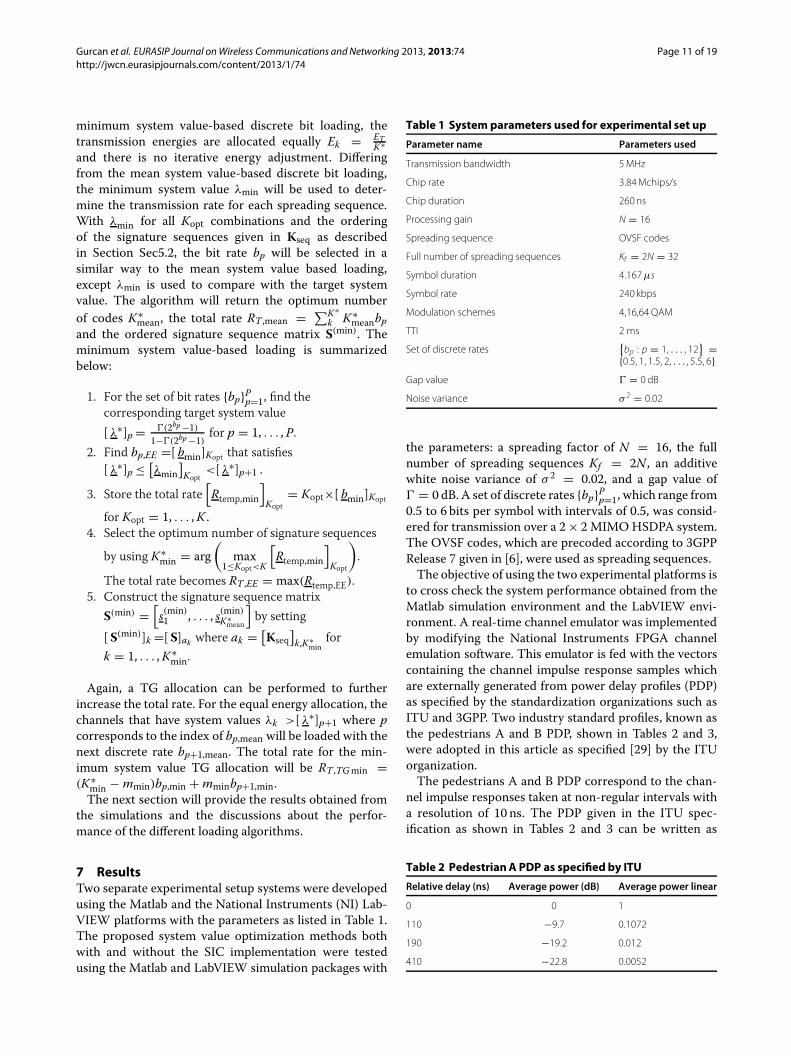
7 ResultsTwo separate experimental setup systems were developedusing the Matlab and the National Instruments (NI) Lab-VIEW platforms with the parameters as listed in Table 1.The proposed system value optimization methods bothwith and without the SIC implementation were testedusing the Matlab and LabVIEW simulation packages with
Table 1 System parameters used for experimental set up
Parameter name Parameters used
Transmission bandwidth 5MHz
Chip rate 3.84Mchips/s
Chip duration 260ns
Processing gain N = 16
Spreading sequence OVSF codes
Full number of spreading sequences Kf = 2N = 32
Symbol duration 4.167μs
Symbol rate 240 kbps
Modulation schemes 4,16,64 QAM
TTI 2 ms
Set of discrete rates{bp : p = 1, . . . , 12
} ={0.5, 1, 1.5, 2, . . . , 5.5, 6}
Gap value � = 0 dB
Noise variance σ 2 = 0.02
the parameters: a spreading factor of N = 16, the fullnumber of spreading sequences Kf = 2N , an additivewhite noise variance of σ 2 = 0.02, and a gap value of� = 0 dB. A set of discrete rates {bp}Pp=1, which range from0.5 to 6 bits per symbol with intervals of 0.5, was consid-ered for transmission over a 2× 2 MIMOHSDPA system.The OVSF codes, which are precoded according to 3GPPRelease 7 given in [6], were used as spreading sequences.The objective of using the two experimental platforms is
to cross check the system performance obtained from theMatlab simulation environment and the LabVIEW envi-ronment. A real-time channel emulator was implementedby modifying the National Instruments FPGA channelemulation software. This emulator is fed with the vectorscontaining the channel impulse response samples whichare externally generated from power delay profiles (PDP)as specified by the standardization organizations such asITU and 3GPP. Two industry standard profiles, known asthe pedestrians A and B PDP, shown in Tables 2 and 3,were adopted in this article as specified [29] by the ITUorganization.The pedestrians A and B PDP correspond to the chan-
nel impulse responses taken at non-regular intervals witha resolution of 10 ns. The PDP given in the ITU spec-ification as shown in Tables 2 and 3 can be written as
Table 2 PedestrianA PDP as specified by ITU
Relative delay (ns) Average power (dB) Average power linear
0 0 1
110 −9.7 0.1072
190 −19.2 0.012
410 −22.8 0.0052
Gurcan et al. EURASIP Journal onWireless Communications and Networking 2013, 2013:74 Page 12 of 19http://jwcn.eurasipjournals.com/content/2013/1/74
Table 3 PedestrianB PDP as specified by ITU
Relative delay (ns) Average power (dB) Average power linear
0 0 1
200 −0.9 0.8128
800 −4.9 0.3236
1200 −8.0 0.1585
2300 −7.8 0.166
3700 −23.9 0.005
P(t) =∑iPiδ (t − τi) (25)
where Pi is the linear power (not the logarithmic scale) atdelay τi. This PDP is sampled with a sampling rate of 1
Tcwhere Tc = 260 ns is the chip period. The new PDP isgiven as
PTc (n) =L−1∑l=0
PTc,l δ (n − l) (26)
where PTc,l is the power component at the lth chip periodand L is the length of the sampled PDP. PTc,l is given as thesum of all power in P (t) in the time interval t = lT − Tc
2and t = lT + Tc
2 such as
PTc,l =∑iPi for
⌊τiTc
+ 0.5⌋
= l. (27)
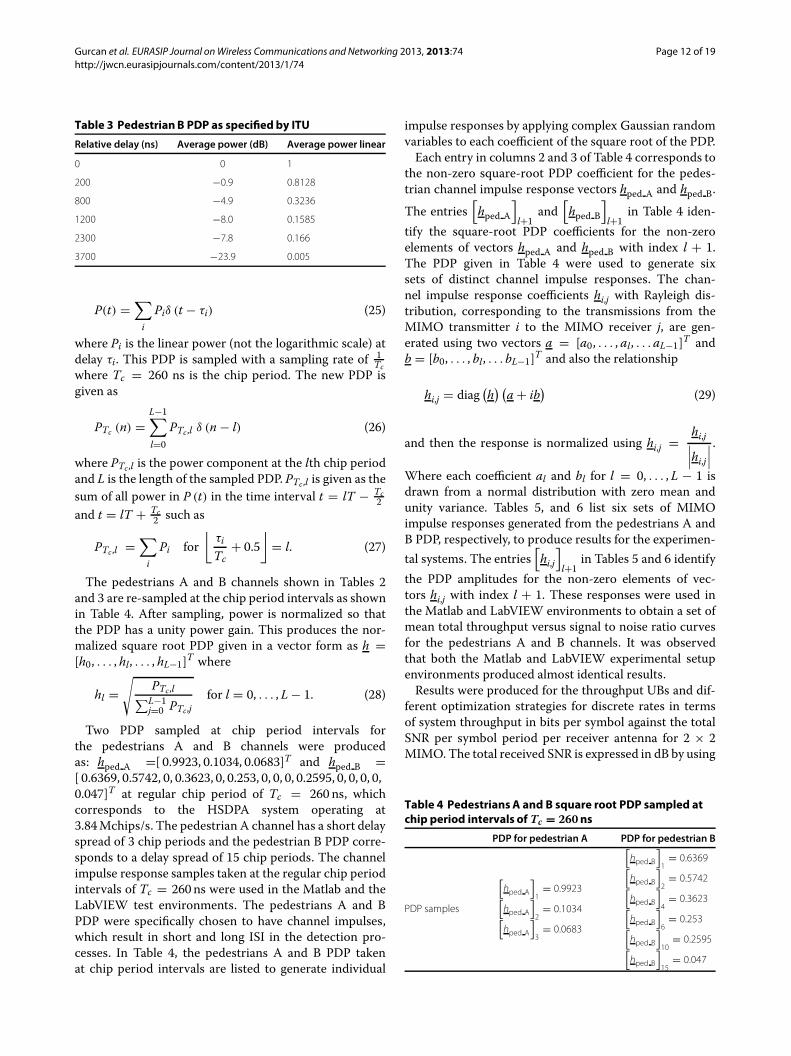
The pedestrians A and B channels shown in Tables 2and 3 are re-sampled at the chip period intervals as shownin Table 4. After sampling, power is normalized so thatthe PDP has a unity power gain. This produces the nor-malized square root PDP given in a vector form as h =[h0, . . . , hl, . . . , hL−1]T where
hl =√
PTc,l∑L−1j=0 PTc,j
for l = 0, . . . , L − 1. (28)
Two PDP sampled at chip period intervals forthe pedestrians A and B channels were producedas: hped A =[ 0.9923, 0.1034, 0.0683]T and hped B =[ 0.6369, 0.5742, 0, 0.3623, 0, 0.253, 0, 0, 0, 0.2595, 0, 0, 0, 0,0.047]T at regular chip period of Tc = 260 ns, whichcorresponds to the HSDPA system operating at3.84Mchips/s. The pedestrian A channel has a short delayspread of 3 chip periods and the pedestrian B PDP corre-sponds to a delay spread of 15 chip periods. The channelimpulse response samples taken at the regular chip periodintervals of Tc = 260 ns were used in the Matlab and theLabVIEW test environments. The pedestrians A and BPDP were specifically chosen to have channel impulses,which result in short and long ISI in the detection pro-cesses. In Table 4, the pedestrians A and B PDP takenat chip period intervals are listed to generate individual
impulse responses by applying complex Gaussian randomvariables to each coefficient of the square root of the PDP.Each entry in columns 2 and 3 of Table 4 corresponds to
the non-zero square-root PDP coefficient for the pedes-trian channel impulse response vectors hped A and hped B.
The entries[hped A
]l+1
and[hped B
]l+1
in Table 4 iden-tify the square-root PDP coefficients for the non-zeroelements of vectors hped A and hped B with index l + 1.The PDP given in Table 4 were used to generate sixsets of distinct channel impulse responses. The chan-nel impulse response coefficients hi,j with Rayleigh dis-tribution, corresponding to the transmissions from theMIMO transmitter i to the MIMO receiver j, are gen-erated using two vectors a = [a0, . . . , al, . . .aL−1]T andb = [b0, . . . , bl, . . . bL−1]T and also the relationship
hi,j = diag(h) (a + ib
)(29)
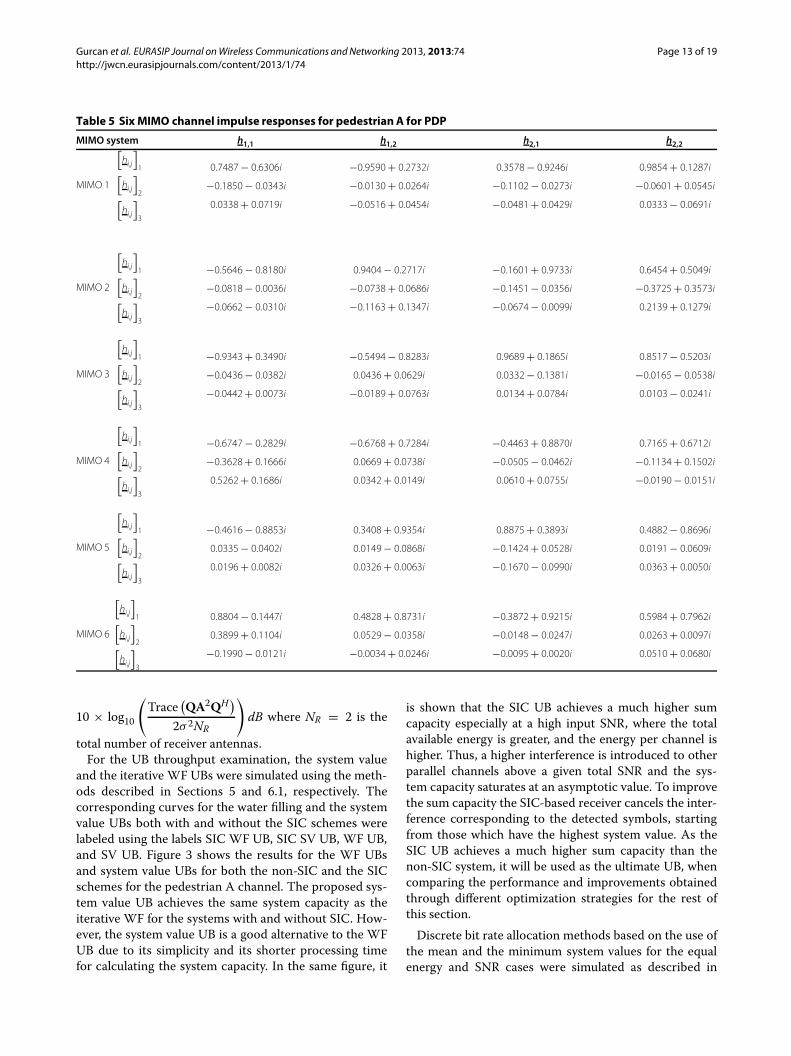
and then the response is normalized using hi,j = hi,j∣∣∣hi,j∣∣∣ .Where each coefficient al and bl for l = 0, . . . , L − 1 isdrawn from a normal distribution with zero mean andunity variance. Tables 5, and 6 list six sets of MIMOimpulse responses generated from the pedestrians A andB PDP, respectively, to produce results for the experimen-tal systems. The entries
[hi,j]l+1
in Tables 5 and 6 identifythe PDP amplitudes for the non-zero elements of vec-tors hi,j with index l + 1. These responses were used inthe Matlab and LabVIEW environments to obtain a set ofmean total throughput versus signal to noise ratio curvesfor the pedestrians A and B channels. It was observedthat both the Matlab and LabVIEW experimental setupenvironments produced almost identical results.Results were produced for the throughput UBs and dif-
ferent optimization strategies for discrete rates in termsof system throughput in bits per symbol against the totalSNR per symbol period per receiver antenna for 2 × 2MIMO. The total received SNR is expressed in dB by using
Table 4 PedestriansA and B square root PDP sampled atchip period intervals of Tc = 260ns
PDP for pedestrian A PDP for pedestrian B
PDP samples
[hped A
]1
= 0.9923[hped A
]2
= 0.1034[hped A
]3
= 0.0683
[hped B
]1
= 0.6369[hped B
]2
= 0.5742[hped B
]4
= 0.3623[hped B
]6
= 0.253[hped B
]10
= 0.2595[hped B
]15
= 0.047
Gurcan et al. EURASIP Journal onWireless Communications andNetworking 2013, 2013:74 Page 13 of 19http://jwcn.eurasipjournals.com/content/2013/1/74
Table 5 Six MIMO channel impulse responses for pedestrianA for PDP
MIMO system h1,1 h1,2 h2,1 h2,2
MIMO 1
[hi,j]1[
hi,j]2[
hi,j]3
0.7487− 0.6306i
−0.1850− 0.0343i
0.0338+ 0.0719i
−0.9590+ 0.2732i
−0.0130+ 0.0264i
−0.0516+ 0.0454i
0.3578− 0.9246i
−0.1102− 0.0273i
−0.0481+ 0.0429i
0.9854+ 0.1287i
−0.0601+ 0.0545i
0.0333− 0.0691i
MIMO 2
[hi,j]1[
hi,j]2[
hi,j]3
−0.5646− 0.8180i
−0.0818− 0.0036i
−0.0662− 0.0310i
0.9404− 0.2717i
−0.0738+ 0.0686i
−0.1163+ 0.1347i
−0.1601+ 0.9733i
−0.1451− 0.0356i
−0.0674− 0.0099i
0.6454+ 0.5049i
−0.3725+ 0.3573i
0.2139+ 0.1279i
MIMO 3
[hi,j]1[
hi,j]2[
hi,j]3
−0.9343+ 0.3490i
−0.0436− 0.0382i
−0.0442+ 0.0073i
−0.5494− 0.8283i
0.0436+ 0.0629i
−0.0189+ 0.0763i
0.9689+ 0.1865i
0.0332− 0.1381i
0.0134+ 0.0784i
0.8517− 0.5203i
−0.0165− 0.0538i
0.0103− 0.0241i
MIMO 4
[hi,j]1[
hi,j]2[
hi,j]3
−0.6747− 0.2829i
−0.3628+ 0.1666i
0.5262+ 0.1686i
−0.6768+ 0.7284i
0.0669+ 0.0738i
0.0342+ 0.0149i
−0.4463+ 0.8870i
−0.0505− 0.0462i
0.0610+ 0.0755i
0.7165+ 0.6712i
−0.1134+ 0.1502i
−0.0190− 0.0151i
MIMO 5
[hi,j]1[
hi,j]2[
hi,j]3
−0.4616− 0.8853i
0.0335− 0.0402i
0.0196+ 0.0082i
0.3408+ 0.9354i
0.0149− 0.0868i
0.0326+ 0.0063i
0.8875+ 0.3893i
−0.1424+ 0.0528i
−0.1670− 0.0990i
0.4882− 0.8696i
0.0191− 0.0609i
0.0363+ 0.0050i
MIMO 6
[hi,j]1[
hi,j]2[
hi,j]3
0.8804− 0.1447i
0.3899+ 0.1104i
−0.1990− 0.0121i
0.4828+ 0.8731i
0.0529− 0.0358i
−0.0034+ 0.0246i
−0.3872+ 0.9215i
−0.0148− 0.0247i
−0.0095+ 0.0020i
0.5984+ 0.7962i
0.0263+ 0.0097i
0.0510+ 0.0680i
10 × log10
(Trace
(QA2QH)2σ 2NR
)dB where NR = 2 is the
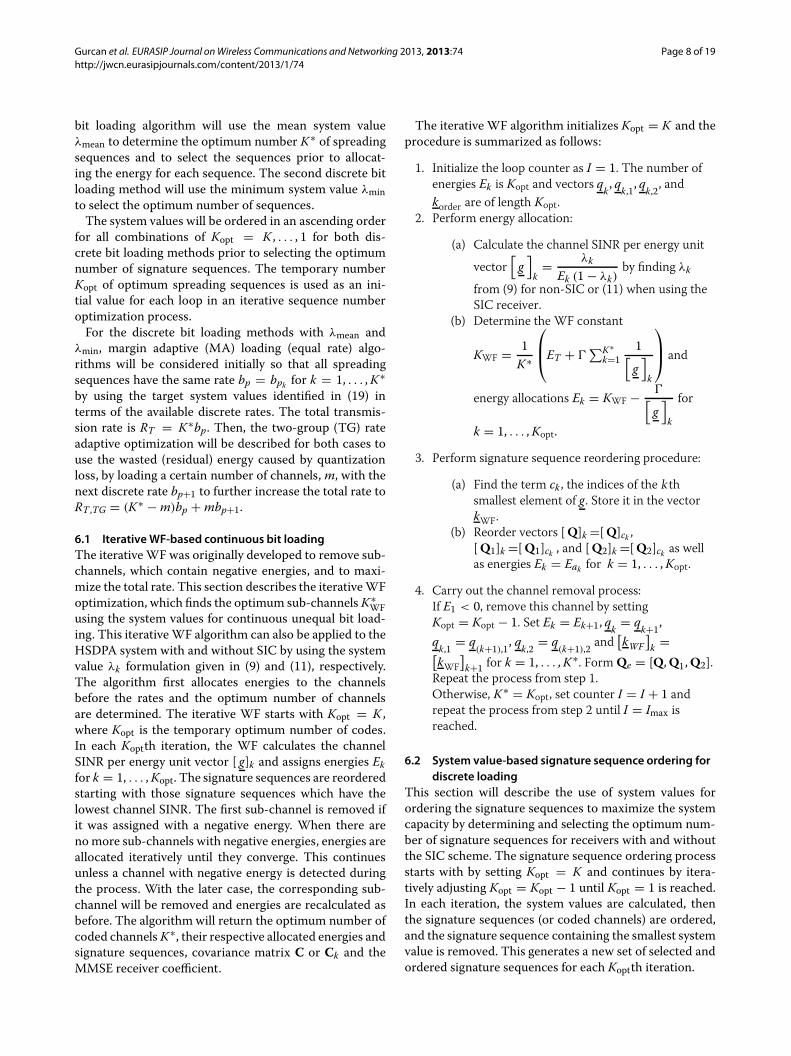
total number of receiver antennas.For the UB throughput examination, the system value
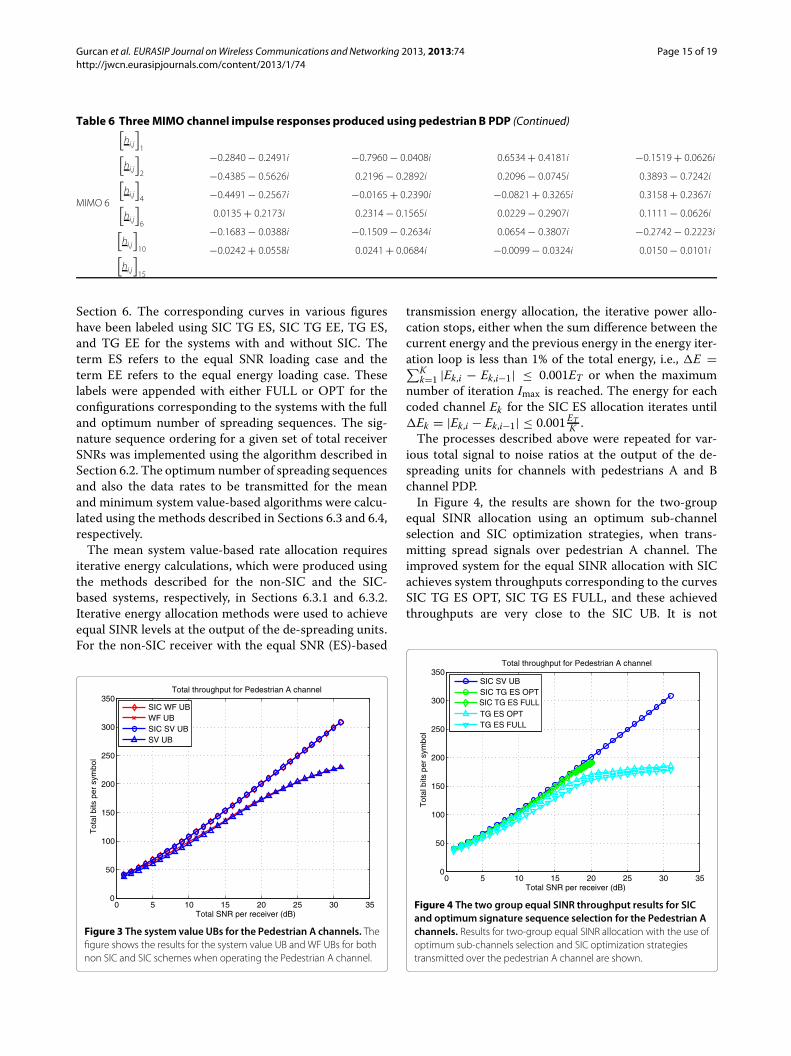
and the iterative WF UBs were simulated using the meth-ods described in Sections 5 and 6.1, respectively. Thecorresponding curves for the water filling and the systemvalue UBs both with and without the SIC schemes werelabeled using the labels SIC WF UB, SIC SV UB, WF UB,and SV UB. Figure 3 shows the results for the WF UBsand system value UBs for both the non-SIC and the SICschemes for the pedestrian A channel. The proposed sys-tem value UB achieves the same system capacity as theiterative WF for the systems with and without SIC. How-ever, the system value UB is a good alternative to the WFUB due to its simplicity and its shorter processing timefor calculating the system capacity. In the same figure, it
is shown that the SIC UB achieves a much higher sumcapacity especially at a high input SNR, where the totalavailable energy is greater, and the energy per channel ishigher. Thus, a higher interference is introduced to otherparallel channels above a given total SNR and the sys-tem capacity saturates at an asymptotic value. To improvethe sum capacity the SIC-based receiver cancels the inter-ference corresponding to the detected symbols, startingfrom those which have the highest system value. As theSIC UB achieves a much higher sum capacity than thenon-SIC system, it will be used as the ultimate UB, whencomparing the performance and improvements obtainedthrough different optimization strategies for the rest ofthis section.Discrete bit rate allocation methods based on the use of
the mean and the minimum system values for the equalenergy and SNR cases were simulated as described in
Gurcan et al. EURASIP Journal onWireless Communications and Networking 2013, 2013:74 Page 14 of 19http://jwcn.eurasipjournals.com/content/2013/1/74
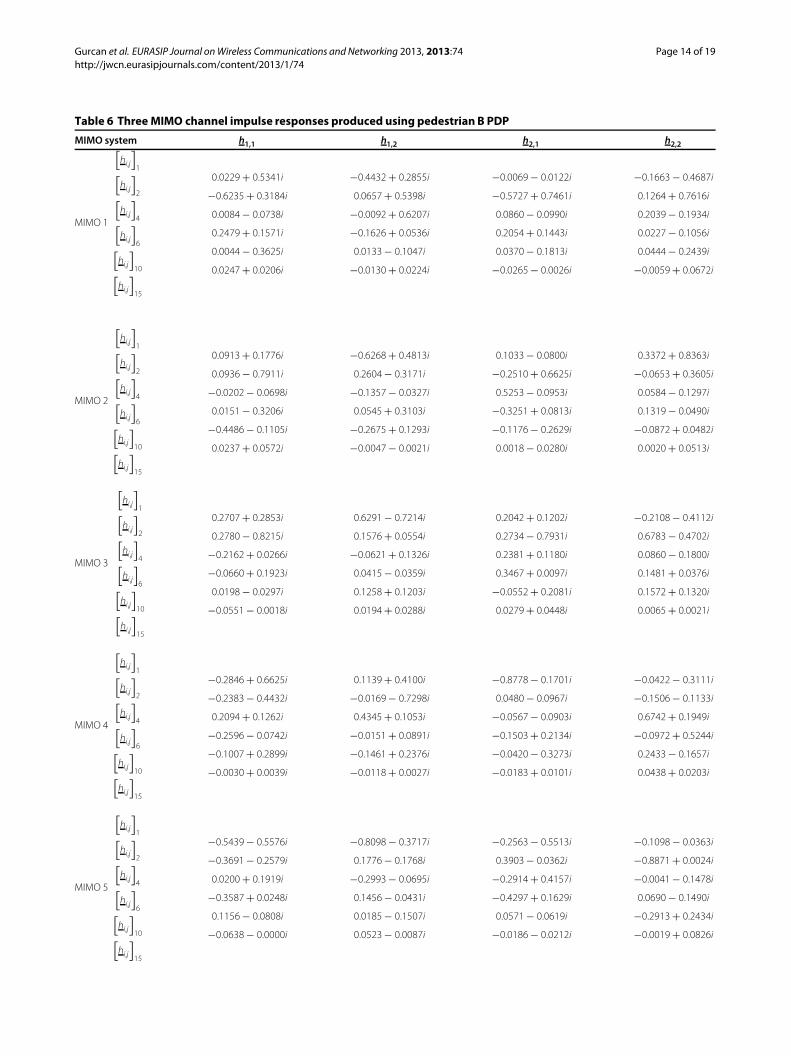
Table 6 Three MIMO channel impulse responses produced using pedestrian B PDP
MIMO system h1,1 h1,2 h2,1 h2,2
MIMO 1
[hi,j]1[
hi,j]2[
hi,j]4[
hi,j]6[
hi,j]10[
hi,j]15
0.0229+ 0.5341i
−0.6235+ 0.3184i
0.0084− 0.0738i
0.2479+ 0.1571i
0.0044− 0.3625i
0.0247+ 0.0206i
−0.4432+ 0.2855i
0.0657+ 0.5398i
−0.0092+ 0.6207i
−0.1626+ 0.0536i
0.0133− 0.1047i
−0.0130+ 0.0224i
−0.0069− 0.0122i
−0.5727+ 0.7461i
0.0860− 0.0990i
0.2054+ 0.1443i
0.0370− 0.1813i
−0.0265− 0.0026i
−0.1663− 0.4687i
0.1264+ 0.7616i
0.2039− 0.1934i
0.0227− 0.1056i
0.0444− 0.2439i
−0.0059+ 0.0672i
MIMO 2
[hi,j]1[
hi,j]2[
hi,j]4[
hi,j]6[
hi,j]10[
hi,j]15
0.0913+ 0.1776i
0.0936− 0.7911i
−0.0202− 0.0698i
0.0151− 0.3206i
−0.4486− 0.1105i
0.0237+ 0.0572i
−0.6268+ 0.4813i
0.2604− 0.3171i
−0.1357− 0.0327i
0.0545+ 0.3103i
−0.2675+ 0.1293i
−0.0047− 0.0021i
0.1033− 0.0800i
−0.2510+ 0.6625i
0.5253− 0.0953i
−0.3251+ 0.0813i
−0.1176− 0.2629i
0.0018− 0.0280i
0.3372+ 0.8363i
−0.0653+ 0.3605i
0.0584− 0.1297i
0.1319− 0.0490i
−0.0872+ 0.0482i
0.0020+ 0.0513i
MIMO 3
[hi,j]1[
hi,j]2[
hi,j]4[
hi,j]6[
hi,j]10[
hi,j]15
0.2707+ 0.2853i
0.2780− 0.8215i
−0.2162+ 0.0266i
−0.0660+ 0.1923i
0.0198− 0.0297i
−0.0551− 0.0018i
0.6291− 0.7214i
0.1576+ 0.0554i
−0.0621+ 0.1326i
0.0415− 0.0359i
0.1258+ 0.1203i
0.0194+ 0.0288i
0.2042+ 0.1202i
0.2734− 0.7931i
0.2381+ 0.1180i
0.3467+ 0.0097i
−0.0552+ 0.2081i
0.0279+ 0.0448i
−0.2108− 0.4112i
0.6783− 0.4702i
0.0860− 0.1800i
0.1481+ 0.0376i
0.1572+ 0.1320i
0.0065+ 0.0021i
MIMO 4
[hi,j]1[
hi,j]2[
hi,j]4[
hi,j]6[
hi,j]10[
hi,j]15
−0.2846+ 0.6625i
−0.2383− 0.4432i
0.2094+ 0.1262i
−0.2596− 0.0742i
−0.1007+ 0.2899i
−0.0030+ 0.0039i
0.1139+ 0.4100i
−0.0169− 0.7298i
0.4345+ 0.1053i
−0.0151+ 0.0891i
−0.1461+ 0.2376i
−0.0118+ 0.0027i
−0.8778− 0.1701i
0.0480− 0.0967i
−0.0567− 0.0903i
−0.1503+ 0.2134i
−0.0420− 0.3273i
−0.0183+ 0.0101i
−0.0422− 0.3111i
−0.1506− 0.1133i
0.6742+ 0.1949i
−0.0972+ 0.5244i
0.2433− 0.1657i
0.0438+ 0.0203i
MIMO 5
[hi,j]1[
hi,j]2[
hi,j]4[
hi,j]6[
hi,j]10[
hi,j]15
−0.5439− 0.5576i
−0.3691− 0.2579i
0.0200+ 0.1919i
−0.3587+ 0.0248i
0.1156− 0.0808i
−0.0638− 0.0000i
−0.8098− 0.3717i
0.1776− 0.1768i
−0.2993− 0.0695i
0.1456− 0.0431i
0.0185− 0.1507i
0.0523− 0.0087i
−0.2563− 0.5513i
0.3903− 0.0362i
−0.2914+ 0.4157i
−0.4297+ 0.1629i
0.0571− 0.0619i
−0.0186− 0.0212i
−0.1098− 0.0363i
−0.8871+ 0.0024i
−0.0041− 0.1478i
0.0690− 0.1490i
−0.2913+ 0.2434i
−0.0019+ 0.0826i
Gurcan et al. EURASIP Journal onWireless Communications andNetworking 2013, 2013:74 Page 15 of 19http://jwcn.eurasipjournals.com/content/2013/1/74
Table 6 Three MIMO channel impulse responses produced using pedestrianB PDP (Continued)
MIMO 6
[hi,j]1[
hi,j]2[
hi,j]4[
hi,j]6[
hi,j]10[
hi,j]15
−0.2840− 0.2491i
−0.4385− 0.5626i
−0.4491− 0.2567i
0.0135+ 0.2173i
−0.1683− 0.0388i
−0.0242+ 0.0558i
−0.7960− 0.0408i
0.2196− 0.2892i
−0.0165+ 0.2390i
0.2314− 0.1565i
−0.1509− 0.2634i
0.0241+ 0.0684i
0.6534+ 0.4181i
0.2096− 0.0745i
−0.0821+ 0.3265i
0.0229− 0.2907i
0.0654− 0.3807i
−0.0099− 0.0324i
−0.1519+ 0.0626i
0.3893− 0.7242i
0.3158+ 0.2367i
0.1111− 0.0626i
−0.2742− 0.2223i
0.0150− 0.0101i
Section 6. The corresponding curves in various figureshave been labeled using SIC TG ES, SIC TG EE, TG ES,and TG EE for the systems with and without SIC. Theterm ES refers to the equal SNR loading case and theterm EE refers to the equal energy loading case. Theselabels were appended with either FULL or OPT for theconfigurations corresponding to the systems with the fulland optimum number of spreading sequences. The sig-nature sequence ordering for a given set of total receiverSNRs was implemented using the algorithm described inSection 6.2. The optimum number of spreading sequencesand also the data rates to be transmitted for the meanand minimum system value-based algorithms were calcu-lated using the methods described in Sections 6.3 and 6.4,respectively.The mean system value-based rate allocation requires
iterative energy calculations, which were produced usingthe methods described for the non-SIC and the SIC-based systems, respectively, in Sections 6.3.1 and 6.3.2.Iterative energy allocation methods were used to achieveequal SINR levels at the output of the de-spreading units.For the non-SIC receiver with the equal SNR (ES)-based
0 5 10 15 20 25 30 350
50
100
150
200
250
300
350
Total SNR per receiver (dB)
Tot
al b
its p
er s
ymbo
l
Total throughput for Pedestrian A channel
SIC WF UBWF UBSIC SV UBSV UB
Figure 3 The system value UBs for the Pedestrian A channels. Thefigure shows the results for the system value UB and WF UBs for bothnon SIC and SIC schemes when operating the Pedestrian A channel.
transmission energy allocation, the iterative power allo-cation stops, either when the sum difference between thecurrent energy and the previous energy in the energy iter-ation loop is less than 1% of the total energy, i.e., E =∑K
k=1 |Ek,i − Ek,i−1| ≤ 0.001ET or when the maximumnumber of iteration Imax is reached. The energy for eachcoded channel Ek for the SIC ES allocation iterates until Ek = |Ek,i − Ek,i−1| ≤ 0.001ET
K .The processes described above were repeated for var-
ious total signal to noise ratios at the output of the de-spreading units for channels with pedestrians A and Bchannel PDP.In Figure 4, the results are shown for the two-group
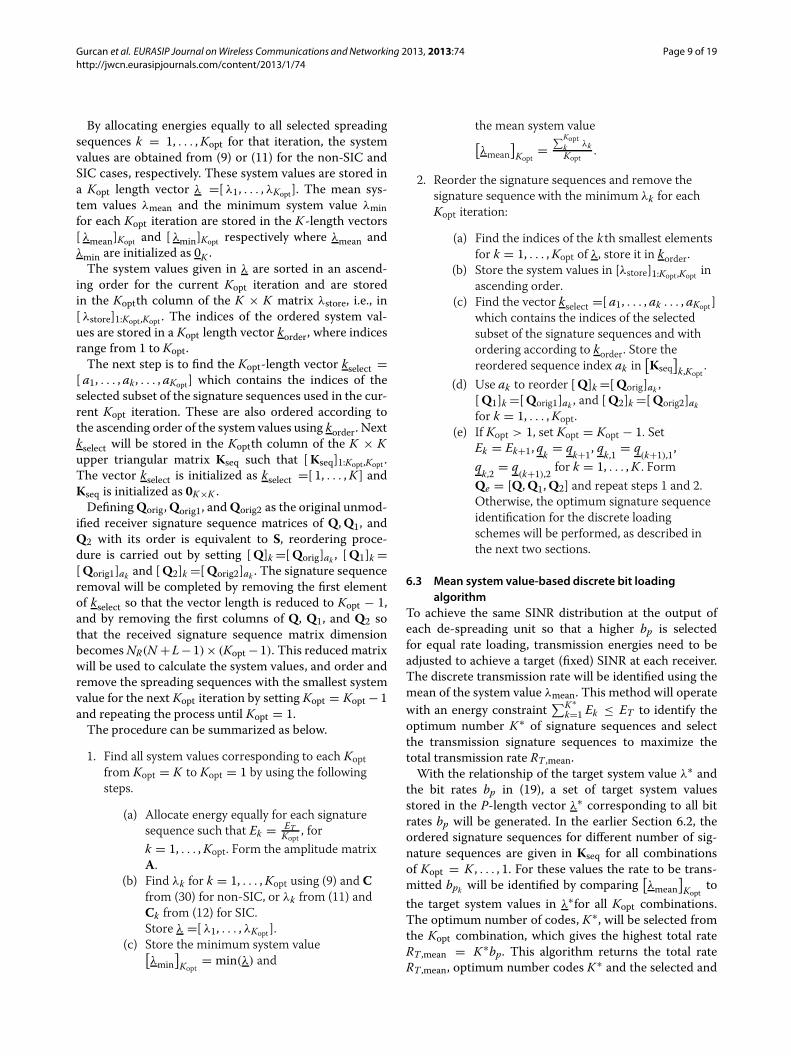
equal SINR allocation using an optimum sub-channelselection and SIC optimization strategies, when trans-mitting spread signals over pedestrian A channel. Theimproved system for the equal SINR allocation with SICachieves system throughputs corresponding to the curvesSIC TG ES OPT, SIC TG ES FULL, and these achievedthroughputs are very close to the SIC UB. It is not
0 5 10 15 20 25 30 350
50
100
150
200
250
300
350
Total SNR per receiver (dB)
Tot
al b
its p
er s
ymbo
l
Total throughput for Pedestrian A channel
SIC SV UBSIC TG ES OPTSIC TG ES FULLTG ES OPTTG ES FULL
Figure 4 The two group equal SINR throughput results for SICand optimum signature sequence selection for the Pedestrian Achannels. Results for two-group equal SINR allocation with the use ofoptimum sub-channels selection and SIC optimization strategiestransmitted over the pedestrian A channel are shown.

Gurcan et al. EURASIP Journal onWireless Communications and Networking 2013, 2013:74 Page 16 of 19http://jwcn.eurasipjournals.com/content/2013/1/74
necessary for the SIC-based receiver to determine theoptimum number of spreading sequences, when allocat-ing equal SINR as the SIC scheme reduces these inter-ferences. The SIC TG ES OPT scheme provides a 3-dBimprovement over the transmission system with the TGES FULL strategy. The TG ES OPT scheme, on the otherhand, provides a 1.5-dB enhancement over the TG ESFULL scheme, when the total SNR is 35 dB.Figure 5 shows the pedestrianA results for a systemwith
the optimum number of ordered spreading sequences, theSIC receiver and the discrete bit loading method basedon minimum system value. It is shown that the SIC TGEE OPT scheme has a 4.5-dB improvement over the TGEE FULL-based system before the system throughput sat-urates at the total SNR value of 35 dB. The use of anoptimum number of ordered signature sequences at thetotal SNR of 35 dB results in the TG EE OPT scheme hav-ing a 2.5-dB improvement over the TG EE FULL scheme.The performance of the receiver with the SIC TG EEFULL scheme is enhanced by 3 dB over the TG EE FULLscheme using the full number of spreading sequences. Itis observed that the system with the TG equal energy (EE)allocation, SIC and the optimum number of spreadingsequences approaches the non-SIC system value UB. It isfurther noted that at the total SNR value of 35-dB a 3-dBdifference is observed compared with the SIC UB beforethe system throughput diverges.Figure 6 shows the simulation results corresponding to
data transmitted over the pedestrian B channel. The sys-tem throughput saturates for the TG ES FULL scheme ata lower total SNR (at 30 dB) compared to the pedestrian Achannel. At the total discrete data rate of 100 bps, the SIC
0 5 10 15 20 25 30 350
50
100
150
200
250
300
350
Total SNR per receiver (dB)
Tot
al b
its p
er s
ymbo
l
Total throughput for Pedestrian A channel
SIC SV UBSV UBSIC TG EE OPTSIC TG EE FULLTG EE OPTTG EE FULL
Figure 5 The minimum system value based discrete bit loadingsystem throughput versus total SNR for the Pedestrian Achannels. The optimization strategies using optimum sub-channelsselection and SIC for the TG with minimum system value loading areshown.
0 5 10 15 20 25 30 350
50
100
150
200
250
300
Total SNR per receiver (dB)
Tot
al b
its p
er s
ymbo
l
Total throughput for Pedestrian B channel
SIC SV UBSIC TG ES OPTTG ES OPTTG ES FULLSIC TG EE OPTTG EE OPTTG EE FULL
Figure 6 Total throughput versus total received SNR results forthe pedestrian B channels when using SIC based receivers andoptimum signature selection scheme. Results showing greaterimprovements when using SIC based receivers and optimumsub-channels selection and when operating over the pedestrian Bchannel.
TG ES OPT provides 7 and 4 dB improvements, respec-tively, over the systems with TG ES FULL and TG ES OPTschemes. At the total discrete rate of 120 bps, more than10-dB improvement is observed when using the SIC TGEE OPT scheme with the optimum number of spread-ing sequences over the TG EE FULL scheme. An 8-dBimprovement is achieved by using the optimum numberof ordered spreading sequences. Around the total SNRvalue of 30 dB the SIC TG EE OPT receiver with theoptimum number of channels produces a 3-dB improve-ment over the TG EE OPT scheme without the SICreceiver. For the pedestrian B channel, the SIC TGEEOPTscheme for the TG discrete bit loading method producesa throughput, which exceeds the throughput of the TGmethod TG ESOPT with the optimum number of spread-ing sequences. The collaborative use of the SIC schemewith the optimum number of signature sequence selectionscheme achieves a system throughput close to the systemvalue UB.The results extracted from Figures 3, 4, 5, and 6 are tab-
ulated for the pedestrians A and B channels as shown inTables 7 and 8, respectively. The entries in Tables 7 and8 express the SNRs for specific data rates together withthe total discrete rates at specific signal to noise ratios.The SIC scheme provides higher throughputs for bothpedestrians A and B channels at an SNR of 35 dB. Specificentries as shown in Table 9 are extracted from Tables 7and 8 for achievable data rates at the SNR of 35 dB forpedestrians A and B channels. The performances for allthree SIC TG ES OPT, SIC TG EE OPT, and SIC TG EEFULL schemes for the pedestrian A channel are very close
Gurcan et al. EURASIP Journal onWireless Communications andNetworking 2013, 2013:74 Page 17 of 19http://jwcn.eurasipjournals.com/content/2013/1/74
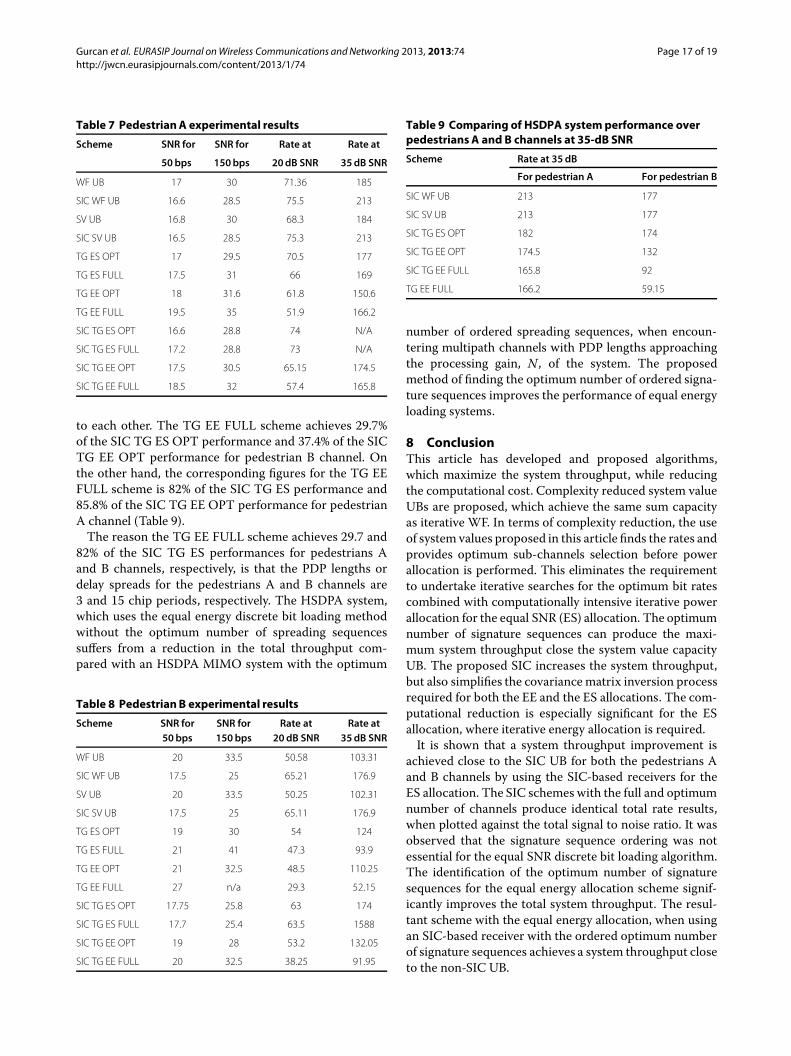
Table 7 PedestrianA experimental results
Scheme SNR for SNR for Rate at Rate at
50 bps 150bps 20dB SNR 35dB SNR
WF UB 17 30 71.36 185
SIC WF UB 16.6 28.5 75.5 213
SV UB 16.8 30 68.3 184
SIC SV UB 16.5 28.5 75.3 213
TG ES OPT 17 29.5 70.5 177
TG ES FULL 17.5 31 66 169
TG EE OPT 18 31.6 61.8 150.6
TG EE FULL 19.5 35 51.9 166.2
SIC TG ES OPT 16.6 28.8 74 N/A
SIC TG ES FULL 17.2 28.8 73 N/A
SIC TG EE OPT 17.5 30.5 65.15 174.5
SIC TG EE FULL 18.5 32 57.4 165.8
to each other. The TG EE FULL scheme achieves 29.7%of the SIC TG ES OPT performance and 37.4% of the SICTG EE OPT performance for pedestrian B channel. Onthe other hand, the corresponding figures for the TG EEFULL scheme is 82% of the SIC TG ES performance and85.8% of the SIC TG EE OPT performance for pedestrianA channel (Table 9).The reason the TG EE FULL scheme achieves 29.7 and
82% of the SIC TG ES performances for pedestrians Aand B channels, respectively, is that the PDP lengths ordelay spreads for the pedestrians A and B channels are3 and 15 chip periods, respectively. The HSDPA system,which uses the equal energy discrete bit loading methodwithout the optimum number of spreading sequencessuffers from a reduction in the total throughput com-pared with an HSDPA MIMO system with the optimum
Table 8 PedestrianB experimental results
Scheme SNR for SNR for Rate at Rate at50 bps 150 bps 20 dB SNR 35dB SNR
WF UB 20 33.5 50.58 103.31
SIC WF UB 17.5 25 65.21 176.9
SV UB 20 33.5 50.25 102.31
SIC SV UB 17.5 25 65.11 176.9
TG ES OPT 19 30 54 124
TG ES FULL 21 41 47.3 93.9
TG EE OPT 21 32.5 48.5 110.25
TG EE FULL 27 n/a 29.3 52.15
SIC TG ES OPT 17.75 25.8 63 174
SIC TG ES FULL 17.7 25.4 63.5 1588
SIC TG EE OPT 19 28 53.2 132.05
SIC TG EE FULL 20 32.5 38.25 91.95
Table 9 Comparing of HSDPA systemperformance overpedestriansA and B channels at 35-dB SNR
Scheme Rate at 35 dB
For pedestrian A For pedestrian B
SIC WF UB 213 177
SIC SV UB 213 177
SIC TG ES OPT 182 174
SIC TG EE OPT 174.5 132
SIC TG EE FULL 165.8 92
TG EE FULL 166.2 59.15
number of ordered spreading sequences, when encoun-tering multipath channels with PDP lengths approachingthe processing gain, N , of the system. The proposedmethod of finding the optimum number of ordered signa-ture sequences improves the performance of equal energyloading systems.
8 ConclusionThis article has developed and proposed algorithms,which maximize the system throughput, while reducingthe computational cost. Complexity reduced system valueUBs are proposed, which achieve the same sum capacityas iterative WF. In terms of complexity reduction, the useof system values proposed in this article finds the rates andprovides optimum sub-channels selection before powerallocation is performed. This eliminates the requirementto undertake iterative searches for the optimum bit ratescombined with computationally intensive iterative powerallocation for the equal SNR (ES) allocation. The optimumnumber of signature sequences can produce the maxi-mum system throughput close the system value capacityUB. The proposed SIC increases the system throughput,but also simplifies the covariance matrix inversion processrequired for both the EE and the ES allocations. The com-putational reduction is especially significant for the ESallocation, where iterative energy allocation is required.It is shown that a system throughput improvement is
achieved close to the SIC UB for both the pedestrians Aand B channels by using the SIC-based receivers for theES allocation. The SIC schemes with the full and optimumnumber of channels produce identical total rate results,when plotted against the total signal to noise ratio. It wasobserved that the signature sequence ordering was notessential for the equal SNR discrete bit loading algorithm.The identification of the optimum number of signaturesequences for the equal energy allocation scheme signif-icantly improves the total system throughput. The resul-tant scheme with the equal energy allocation, when usingan SIC-based receiver with the ordered optimum numberof signature sequences achieves a system throughput closeto the non-SIC UB.
Gurcan et al. EURASIP Journal onWireless Communications and Networking 2013, 2013:74 Page 18 of 19http://jwcn.eurasipjournals.com/content/2013/1/74
The mobile radio channels with a longer channelimpulse response length, which are measured in termsof the number of chip period intervals, have severe sumcapacity throughput degradations compared with the sys-tem value UBs for equal energy loading HSDPA MIMOsystems without the optimum number of ordered spread-ing sequences. The influence of the Doppler frequency onthe performance of the proposed HSDPA system is cur-rently under investigation and will be reported in futurepublications.The results presented in this article confirm that the
proposed optimum signature sequence selection schemefor the SIC receiver provides a significant performanceimprovement for the HSDPA system. As it is now possibleto obtain system throughput near the UB. The proposedschemes with HSDPA will achieve results comparable tothe LTE, without incurring significant additional cost tomodify the existing HSDPA infrastructures.
AppendicesAppendix 1The receiver matched filter sequences qk =[Q]k ,qk,1 =[Q1]k = [INR ⊗ (JTN+L−1)
N ] qk and qk,2 =[Q2]k =[INR ⊗ JNN+L−1]qk will be used to determine the covari-
ance matrix C. The covariance matrix C of the receivedsignal of dimension NR (N + L − 1) × NR (N + L − 1) isconstructed using the following equation
C = Qe(I3 ⊗ A2)QHe + 2σ 2INR(N+L−1) (30)
where⊗ is the Kronecker product,Qe = [Q,Q1,Q2] is theextended Q matrix of dimension NR (N + L − 1) × 3K∗,Q1 represents the previous symbol period componentsandQ2 represents ISI from the next symbol period formedas
Q1 =[INR ⊗ (JTN+L−1)
N]Q =
[q1,1, . . . , qk,1 . . . , qK∗,1
](31)
Q2 =[INR ⊗ JNN+L−1
]Q =
[q1,2, . . . , qk,2 . . . , qK∗,2
]. (32)
where y(ρ − 1) and y(ρ + 1) are the ISI components fromthe previous and next symbol periods; n(ρ) is the additivewhite Gaussian noise component with E(n(ρ)nH(ρ)) =2σ 2INR(N+L−1) and σ 2 = N0
2 is the noise variance perdimension.
Appendix 2Using the matrix inversion lemma, the inverse matricesD−1
k and C−1k are obtained as shown below:
D−1k =C−1
k−1 − (ζ 21 ζ2 |ξ5|2 + ζ1
)Z1
− ζ2Z2 + ζ1ζ2(ξ5 Z3 + ξ∗
5 ZH3) (33)
C−1k = D−1
k − ζZ4 (34)
where the distance vectors d, d1, d2, and d3 are formed asfollows:
d = C−1k−1qk , d1 = C−1
k−1qk,1, d2 = C−1k−1qk,2,
d3 = D−1k qk ,
(35)
the weighting functions ξ , ξ1, ξ2, ξ3, ξ4, ξ5, and ξ6 areproduced using
ξ = qHk d, ξ1 = qHk,1d1, ξ2 = qHk,2d2,
ξ3 = qHk d1, ξ4 = qHk d2, ξ5 = qHk,1d2,
ξ6 = Re(ξ3ξ
∗4 ξ5
). (36)
Then, the weighted energy terms ζ , ζ1, and ζ2 can becalculated as follows:ζ = Ek
1+Ek(
ξ−ζ1 |ξ3|2− ζ2
(|ξ4|2−2ζ1ξ6+ ζ 2
1 |ξ5|2 |ξ3|2) ) ,
where ζ1 = Ek1 + Ek ξ1
, ζ2 = Ek1 + Ek
(ξ2 − ζ1 |ξ5|2
) , (37)while the interim matrices Z1, Z2, Z3, and Z4 are formedas shown below:
Z1 = d1 dH1 , Z2 = d2 d
H2 , Z3 = d1 d
H2 ,
Z4 = d3dH3 .
(38)
For a given energy allocation Ek for k = 1, . . . ,K , theparameters qk , qk,1, qk,2, and σ 2, the matrices D−1
k andC−1k , as well as the system values λk are constructed by ini-
tializing C−10 = 1
2σ 2 INR(N+L−1) and starting with k = 1 asfollows:
1. Calculate D−1k using (33) by finding parameters in
d, d1, d2, ξ , ξ1 to ξ6, Z1 to Z3 and ζ1, ζ2 from (36) to(38).
2. Form C−1k in (34) with the given values for D−1
k , d3,Z4 and ζ .
3. Obtain the system value using λk = EkqHk C−1k qk as
shown in (11).
Repeat this process from steps 1 to 3 for all selectedtransmission channels from k = 1 to k = K∗.
Competing interestsThe authors declare that they have no competing interests.
AcknowledgementsDuring the development of the experimental apparatus several divisions ofthe National Instruments (NI) USA, UK, and Europe groups have loaned a NIPXIe-based 2 × 2 MIMO transceivers to enable Imperial College London todevelop the MIMO channel emulator. National Instruments have also supplieda copy of their channel emulation software, which was modified by ImperialCollege London to operate with the experimental apparatus. Weacknowledge the technical support given by the National Instruments teaminvolving James Kimery, Robert Morton, Yiannis Pavlou, Ben Lavasani, DavidBaker, Trang Nguyen, Erik Luther, Jaeweon Kim, Ian Wong, and Ahsan Aziz.
Received: 4 June 2012 Accepted: 22 January 2013Published: 16 March 2013

Gurcan et al. EURASIP Journal onWireless Communications andNetworking 2013, 2013:74 Page 19 of 19http://jwcn.eurasipjournals.com/content/2013/1/74
References1. C Shannon, A mathematical theory of communication. Bell Syst. Tech. J.
27, 623–656 (1948)2. G Foschini, M Gans, On limits of wireless communications in a fading
environment when using multiple antennas. Wirel. Personal Commun. 6,311–335 (1998). doi:10.1023/A:1008889222784
3. E Telatar, Capacity of multi-antenna gaussian channels. Eur. Trans.Telecommun. 10, 585–595 (1999)
4. 3GPP, Technical specification group radio access network; physical layerprocedures (FDD) (Tech. Spec. 25.214 V.10.3.0). TS 25.214, 3rd GenerationPartnership Project (3GPP) (2010). [http://www.3gpp.org/ftp/Specs/html-info/25214.htm]
5. M Cvitkovic, B Modlic, G Sisul, in IEEE ELMAR, 2007. High speed downlinkpacket access principles (Piscataway, NJ, 2007), pp. 125–128
6. 3GPP, Technical specification group radio access network; Multiple InputMultiple Output in UTRA (Tech. Rep. 25.876 V.7.0.0). TR 25.876, 3rdGeneration Partnership Project (3GPP) (2007). [http://www.3gpp.org/ftp/Specs/html-info/25876.htm]
7. C Mehlfuhrer, S Caban, M Rupp, Cellular system physical layerthroughput: how far off are we from the Shannon bound? IEEE Wirel.Commun. 18(6), 54–63 (2011)
8. C Mehlfuhrer, S Caban, M Rupp, Measurement-based performanceevaluation of MIMO HSDPA. IEEE Trans. Veh. Technol. 59(9), 4354–4367(2010)
9. M Gurcan, I Ma, A Ghani, The interference-reduced energy loading formulti-code HSDPA systems. EURASIP J. Wirel. Commun. Netw. 127, 1–17(2012)
10. J Concha, S Ulukus, in IEEE VTS 53rd Vehicular Technology Conference, 2001.VTC 2001 Spring, vol. 3. Optimization of CDMA signature sequences inmultipath channels (Piscataway, NJ, 2001), pp. 1978–1982
11. R Visoz, N Gresset, A Berthet, Advanced transceiver architectures fordownlink MIMO CDMA evolution. IEEE Trans. Wirel. Commun. 6(8),3016–3027 (2007)
12. S Kim, S Kim, C Shin, J Lee, Y Kim, in IEEE Pacific Rim Conference onCommunications, Computers and Signal Processing, 2009, PacRim 2009. Anew multicode interference cancellation method for HSDPA system(Piscataway, NJ, 2009), pp. 487–490
13. A Bastug, DTM Slock, Downlink WCDMA receivers based on combinedchip and symbol level equalizationchip and symbol level equalization.Eur. Trans. Telecommun. 16, 51–63 (2005)
14. M Wrulich, C Mehlfuhrer, M Rupp, Managing the interference structure ofMIMO HSDPA: a multi-user interference aware MMSE receiver withmoderate complexity. IEEE Trans. Wirel. Commun. 9(4), 1472–1482 (2010)
15. S Shenoy, I Ghauri, D Slock, in HSDPA/HSUPA Handbook, ed. by B Furht, SAAhson. Receiver designs and multi-user extensions to MIMO HSDPA (CRCPress, Boca Raton, 2010), pp. 89–109
16. J He, G Gu, Z Wu, MMSE interference suppression in MIMO frequencyselective and time-varying fading channels. IEEE Trans. Signal Process.56(8), 3638–3651 (2008)
17. C Mehlfuhrer, S Caban, M Wrulich, M Rupp, in IEEE 42nd AsilomarConference on Signals, Systems and Computers. Joint throughputoptimized CQI and precoding weight calculation for MIMO HSDPA(Piscataway, NJ, 2008), pp. 1320–1325
18. T Cui, F Lu, V Sethuraman, A Goteti, S Rao, P Subrahmanya, Throughputoptimization in high speed downlink packet access (HSDPA). IEEE Trans.Wirel. Commun. 10(2), 474–483 (2011)
19. N Papandreou, T Antonakopoulos, Bit and power allocation inconstrained multicarrier systems: the single-user case. EURASIP J. Adv.Signal Process. 2008 (2008). doi:10.1155/2008/643081
20. W Yu, W Rhee, S Boyd, J Cioffi, Iterative water-filling for Gaussian vectormultiple-access channels. IEEE Trans. Inf. Theory. 50, 145–152 (2004)
21. N Jindal, W Rhee, S Vishwanath, S Jafar, A Goldsmith, Sum power iterativewater-filling for multi-antenna Gaussian broadcast channels. IEEE Trans.Inf. Theory. 51(4), 1570–1580 (2005)
22. O Kaya, S Ulukus, Optimum power control for CDMA with deterministicsequences in fading channels. IEEE Trans. Inf. Theory. 50(10), 2449–2462(2004)
23. O Kaya, S Ulukus, Ergodic sum capacity maximization for CDMA: Optimumresource allocation. IEEE Trans. Inf. Theory. 51(5), 1831–1836 (2005)
24. S Shi, M Schubert, H Boche, Downlink MMSE transceiver optimization formultiuser MIMO systems: duality and sum-MSE minimization. IEEE Trans.Signal Process. 55(11), 5436–5446 (2007)
25. S Shi, M Schubert, H Boche, Rate optimization for multiuser MIMO systemswith linear processing. IEEE Trans. Signal Process. 56(8), 4020–4030 (2008)
26. S Bergman, D Palomar, B Ottersten, Joint bit allocation and precoding forMIMO systems with decision feedback detection. IEEE Trans. SignalProcess. 57(11), 4509–4521 (2009)
27. A Tenenbaum, R Adve, Minimizing sum-MSE implies identical downlinkand dual uplink power allocations. IEEE Trans. Commun. 59(3), 686–688(2011)
28. H Shen, B Li, M Tao, X Wang, MSE-based transceiver designs for the MIMOinterference channel. IEEE Trans. Wirel. Commun. 9(11), 3480–3489 (2010)
29. 3GPP, 3rd Generation Partnership Project; Technical Specification GroupRadio Access Network; High Speed Downlink Packet Access: UE RadioTransmission and Reception (TR 25.890 V1.0.0). TR 25.890, 3rd GenerationPartnership Project (3GPP) (2002). [http://www.3gpp.org/ftp/Specs/html-info/25890.htm]
doi:10.1186/1687-1499-2013-74Cite this article as: Gurcan et al.: System value-based optimum spreadingsequence selection for high-speed downlink packet access (HSDPA)MIMO.EURASIP Journal onWireless Communications and Networking 2013 2013:74.
Submit your manuscript to a journal and benefi t from:
7 Convenient online submission
7 Rigorous peer review
7 Immediate publication on acceptance
7 Open access: articles freely available online
7 High visibility within the fi eld
7 Retaining the copyright to your article
Submit your next manuscript at 7 springeropen.com