
RESEARCH OpenAccess Modelingpopulationgrowthinonlinesocial ... · as tweet. A follower can follow...
16
Zhu et al. Complex Adaptive Systems Modeling 2013, 1:14 http://www.casmodeling.com/content/1/1/14 RESEARCH Open Access Modeling population growth in online social networks Konglin Zhu 1* , Wenzhong Li 1,2 and Xiaoming Fu 1 *Correspondence: [email protected] 1 Institute of Computer Science, University of Goettingen, Goettingen, Germany Full list of author information is available at the end of the article Abstract Purpose: Online social networks (OSNs) are now among the most popular applications on the web offering platforms for people to interact, communicate and collaborate with others. The rapid development of OSNs provides opportunities for people’s daily communication, but also brings problems such as burst network traffic and overload of servers. Studying the population growth pattern in online social networks helps service providers to understand the people communication manners in OSNs and facilitate the management of network resources. In this paper, we propose a population growth model for OSNs based on the study of population distribution and growth in spatiotemporal scale-space. Methods: We investigate the population growth in three data sets which are randomly sampled from the popular OSN web sites including Renren, Twitter and Gowalla. We find out that the number of population follows the power-law distribution over different geographic locations, and the population growth of a location fits a power function of time. An aggregated population growth model is conducted by integrating the population growth over geographic locations and time. Results: We use the data sets to validate our population growth model. Extensive experiments also show that the proposed model fits the population growth of Facebook and Sina Weibo well. As an application, we use the model to predict the monthly population in three data sets. By comparing the predicted population with ground-truth values, the results show that our model can achieve a prediction accuracy between 86.14% and 99.89%. Conclusions: With our proposed population growth model, people can estimate the population size of an online social network in a certain time period and it can also be used for population prediction for a future time. Keywords: Spatiotemporal scale-space; Population distribution; Population growth; Online social networks Background Nowadays online social networks (OSNs) are considered as the most popular applications on the web, which offer platforms for people to interact, communicate and collaborate with others. The user population of online social networks is growing expeditiously. It is reported that Facebook (2013) has reached 900 million users in April 2012. Meanwhile, Twitter (2013) has also surpassed 500 million users in July 2012. The rapid development of OSNs facilitates people’s daily communications. However, the growth of user population © 2013 Zhu et al.; licensee Springer. This is an Open Access article distributed under the terms of the Creative Commons Attribution License (http://creativecommons.org/licenses/by/2.0), which permits unrestricted use, distribution, and reproduction in any medium, provided the original work is properly cited.
Transcript of RESEARCH OpenAccess Modelingpopulationgrowthinonlinesocial ... · as tweet. A follower can follow...

Zhu et al. Complex Adaptive SystemsModeling 2013, 1:14http://www.casmodeling.com/content/1/1/14
RESEARCH Open Access
Modeling population growth in online socialnetworksKonglin Zhu1*, Wenzhong Li1,2 and Xiaoming Fu1
*Correspondence:[email protected] of Computer Science,University of Goettingen,Goettingen, GermanyFull list of author information isavailable at the end of the article
Abstract
Purpose: Online social networks (OSNs) are now among the most popularapplications on the web offering platforms for people to interact, communicate andcollaborate with others. The rapid development of OSNs provides opportunities forpeople’s daily communication, but also brings problems such as burst network trafficand overload of servers. Studying the population growth pattern in online socialnetworks helps service providers to understand the people communication manners inOSNs and facilitate the management of network resources. In this paper, we propose apopulation growth model for OSNs based on the study of population distribution andgrowth in spatiotemporal scale-space.
Methods: We investigate the population growth in three data sets which arerandomly sampled from the popular OSN web sites including Renren, Twitter andGowalla. We find out that the number of population follows the power-law distributionover different geographic locations, and the population growth of a location fits apower function of time. An aggregated population growth model is conducted byintegrating the population growth over geographic locations and time.
Results: We use the data sets to validate our population growth model. Extensiveexperiments also show that the proposed model fits the population growth ofFacebook and Sina Weibo well. As an application, we use the model to predict themonthly population in three data sets. By comparing the predicted population withground-truth values, the results show that our model can achieve a prediction accuracybetween 86.14% and 99.89%.
Conclusions: With our proposed population growth model, people can estimate thepopulation size of an online social network in a certain time period and it can also beused for population prediction for a future time.
Keywords: Spatiotemporal scale-space; Population distribution; Population growth;Online social networks
BackgroundNowadays online social networks (OSNs) are considered as the most popular applicationson the web, which offer platforms for people to interact, communicate and collaboratewith others. The user population of online social networks is growing expeditiously. It isreported that Facebook (2013) has reached 900 million users in April 2012. Meanwhile,Twitter (2013) has also surpassed 500million users in July 2012. The rapid development ofOSNs facilitates people’s daily communications. However, the growth of user population
© 2013 Zhu et al.; licensee Springer. This is an Open Access article distributed under the terms of the Creative CommonsAttribution License (http://creativecommons.org/licenses/by/2.0), which permits unrestricted use, distribution, and reproductionin any medium, provided the original work is properly cited.
Zhu et al. Complex Adaptive Systems Modeling 2013, 1:14 Page 2 of 16http://www.casmodeling.com/content/1/1/14
also causes problems to service providers, such as overload of servers. One example isthe “fail whale” phenomenon in Twitter, where the requested page returns a “fail whale”image when too many burst requests occur.The issues and patterns of population growth in OSNs have drawnmuch attention from
the academia and many works have been done in the past years. A study of micro evolu-tion on OSNs (Leskovec et al. 2008) captured the best fits of population growth in fourdifferent OSNs and showed that the growth tendency varies with time. Torkjazi et al.(2009) and Rejaie et al. (2010) observed S-shaped population growth: it experiences a slowgrowth in the beginning, following a period of exponential growth and finally a significantand sudden slow down in the growth of the population. However, most of these studiesfail to provide a theoretical model to describe the population growth in OSNs. Besides,existing works study population growth only in the temporal dimension, and they lacksconcern of the dynamics in the geographic scale.In this paper, we investigate the population growth of OSNs from spatiotemporal
scale-space. Our investigation is based on three data sets randomly sampled from thepopular OSN website including Renren (2013), Twitter (2013) and Gowalla (2011),from which we explore their population distributions over various geographic loca-tions and time-varying properties on population growth. We find out that in thespatial scale, the population size follows a power-law distribution over geographic loca-tions. In the temporal scale, the population growth in the largest populated locationis revealed to fit a power function increasing with time. The number of populatedlocations also increases as a power function as time. Based on these observations,we propose an aggregated population growth model by integrating the populationgrowth over geographic locations and time. Theoretical analysis is presented to derivethis model and comprehensive experiments are conducted to verify its effectiveness.It is shown that the proposed model fits well for population growth in large scalerapid growing OSNs such as Facebook (2013) and Sina Weibo (2013). As an appli-cation, we further utilize the model to predict population growth in three data sets,which illustrates that our model can achieve a prediction accuracy between 86.14% and99.89%.There are several applications of our work. It has significant meanings for Internet
Service Providers (ISPs) to understand the population growth of OSN users, which willfurther reveal the user interaction patterns and network traffic patterns. It is also benignfor the OSN web sites to deploy servers and cast advertisements on the base of popula-tion growth model. The third-party service providers can analyze the service market bythe model and further optimize their resource deployment and investment.
DataTo conduct our analysis, we collect data from three online social network sites: Renren,a social-based application service, Twitter, a social-based media service and Gowalla,a location-based online social service. Renren, established in December 2005 and nowwith 160 million users, is a Chinese online social network which organizes users intomembership-based networks representing schools, companies and geographic locations.It allows users to post short messages known as status, blogs and pictures. It also allowspeople to share contents such as videos, articles and pictures. Twitter, with over 500 mil-lion users, launched in July 2006, is known as its microblogging services by which users

Zhu et al. Complex Adaptive SystemsModeling 2013, 1:14 Page 3 of 16http://www.casmodeling.com/content/1/1/14
can write any topic within the 140 characters limit. Such kind of short message is knownas tweet. A follower can follow any other users and receive any kind of tweets fromhis/her followings. Varied from above-mentioned two online social networks, Gowallais a location-oriented online social service. People are allowed to check-in their visitingplaces via mobile devices. It is launched in 2007 and closed in 2012 with approximately600,000 users.We collect the Renren and Twitter data sets by crawling from their sites. We start our
crawling with randomly selected users from the largest weakly connected component(WCC). Following friends’ links in the forward direction in a breadth first search (BFS)fashion, we collect a sample of each social network. To eliminate the degree bias causedby BFS, we launch the BFS-bias correction procedure described in (Kurant et al. 2011).Furthermore, according to the estimation method of the size of social networks by Katziret al. (2011), we believe the quality and quantity of our data sets are enough to reveal thelaws of population growth in OSNs.In order to capture the growth of population in different geographic locations, we need
to know the account creation time and geographic information of each user. We trace useraccount creation time in Twitter from user profile. However, we cannot explicitly retrieveaccount creation time from user profile in Renren. To estimate the account creation timeprecisely, we use the time of a user’s first activity such as updating status, posting a blogor interacting with friends as the time point when the account creates. Meanwhile, weseek users’ geographic locations from user profiles and choose users with valid geographicinformation to compose our data sets.The Gowalla data set, obtained from public source (Cho et al. 2011), contains more
than 100,000 users, as well as their social relations and check-in histories. We findthe user registration time by their first check-ins. To reveal users’ geographic infor-mation, similar as (Cho et al. 2011), we infer a user’s location by compartmentalizingthe globe into 25 by 25 km cells and defining the location as the cell with the mostcheck-ins.The statistics of three data sets are shown in Table 1. Renren data set (Renren) con-
tains around 1 million users and covers 10, 039 locations. It records user growth overthe period of January 2006 to December 2010 (60 months). Twitter data set (Twitter)consists of more than 250 thousand users covering 8, 929 locations. We collect userpopulation growth over the period of August 2006 and October 2010 (51 months).Gowalla data set (Gowalla) has around 100 thousand nodes, with 5, 088 populated loca-tions. It contains the population growth ranging from February 2009 to October 2010(21 months).
Table 1 Statistics of data sets
Renren Twitter Gowalla
Nodes 997, 849 257, 929 107, 089
Locations 10, 039 8, 929 5, 088
Period 01/06− 12/10 08/06 − 10/10 02/09− 10/10
The table presents the detail information of Renren, Twitter and Gowalla data sets. It contains the number of nodes, the numberof locations and the time period of the data set.
Zhu et al. Complex Adaptive Systems Modeling 2013, 1:14 Page 4 of 16http://www.casmodeling.com/content/1/1/14
MethodsWe present the methods for modeling of population growth in online social networks inthis section.
Basic approach
To study the population growth inOSNs, we first illustrate the basic approach ofmodelingthe population growth in spatiotemporal dimension.The population in OSNs grows over locations and time. In spatial aspect, people from
different geographic locations may register as users in an OSN, thus people from moreand more locations join in the network. The OSN expanding from locations to loca-tions, leads to the growth of population spatially. At the same time, the population ineach geographic location grows in temporal scale. People in a geographic location may beattracted to join in the network from time to time and thus the location will have moreand more people. Therefore, combining spatial and temporal effects, we model the popu-lation growth as the accumulation of populations in different geographic locations, whilepopulation in each location changes as a function of time. We describe the populationgrowth in spatial and temporal dimensions as follows.As the first step, we consider the population growthmodel in the spatial dimension. The
aggregated population GP is a sum of populations in all populated locations on a certaintime point. It can be formulated as an accumulation function:
GP =M∑x=1
Sx, (1)
where Sx denotes the population size in location x. M is the total number of populatedlocations. To calculate this formulation, one needs to know the population size of everylocation, which is not scalable in large online social networks. We take one step fur-ther. Instead of numerating all population sizes, we use the proportion of the number oflocations with population size s over the total number of populated locations, known aspopulation distribution, which is denoted as Ps, the total number of populated locations Land the largest population size N to construct the formulation of aggregated population:
GP =N∑s=1
Ps ∗ L ∗ s, (2)
This formulation describes the aggregated population on a certain time point in spatialaspect.Now we consider the population growth process with temporal factor. The aggregated
population growth is a dynamic process, with population in each location growing as afunction of t. Therefore, we consider N, L and Ps are time-dependent functions, whereN = n(t), L = l(t) and Ps = P(s, t). The discrete accumulation of Eq. 2 can beapproximated as integral as following:
GP(t) =∫ n(t)
1(P(s, t) ∗ l(t) ∗ s)ds. (3)
The formulation reflects not only the spatial characteristics that it is aggregation ofpopulations in different geographic locations, but also temporal factor that the populationgrowth is a dynamic process as a function of time.

Zhu et al. Complex Adaptive SystemsModeling 2013, 1:14 Page 5 of 16http://www.casmodeling.com/content/1/1/14
So far, we propose a population growthmodel in spatiotemporal perspective. To specifythis model, we need to study three time-dependent functions: the dynamics of popula-tion distribution P(s, t), the growth function of populated locations l(t) and the growthfunction of the largest population n(t) in the following subsections.
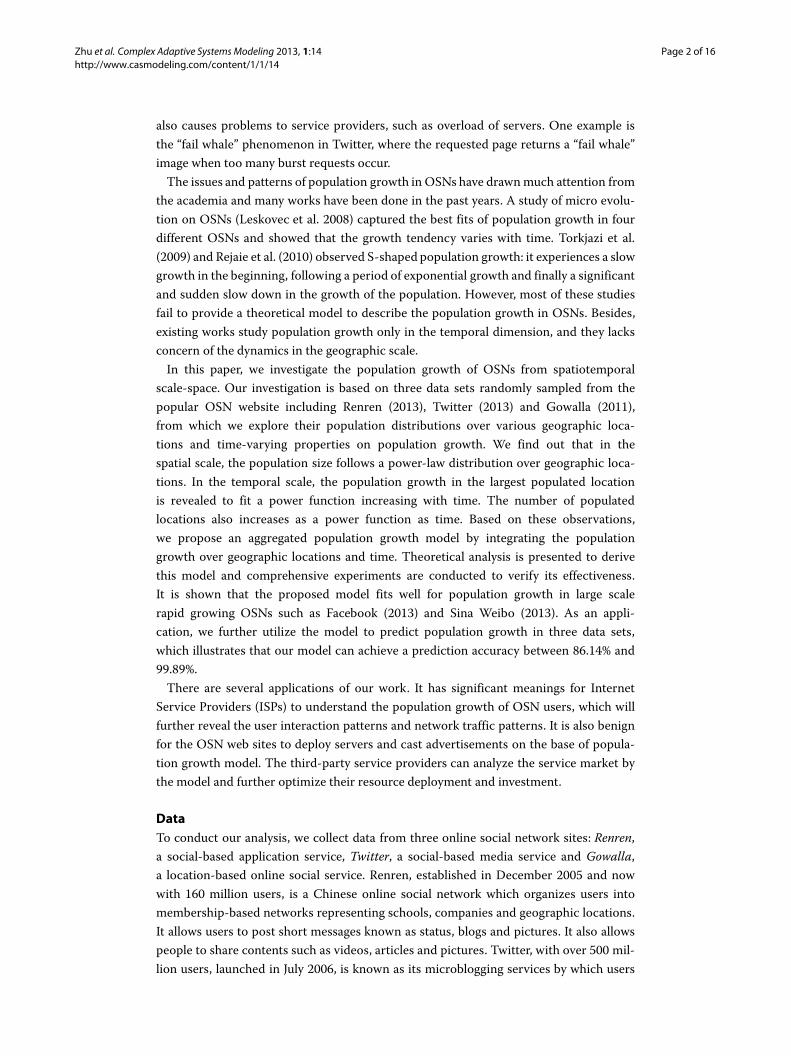
Population distribution:P(s, t)The population distribution reveals the proportions of different population sizes in anOSN. We investigate the population distribution by drawing the log-log plots of prob-ability density function (PDF) of populations in different geographic locations of threedata sets as shown in Figure 1 with respect to different time points. The observation tothe figures shows that the population distributions are close to each other in differenttime periods. In particular, the population distributions of Renren are close to each otherfrom 10th month to 50th month, as shown in Figure 1a. The similar phenomenon canalso be observed from Twitter from 8th month to 48th month in Figure 1b and Gowallafrom 5th month to 20th month in Figure 1c. It allows us to use one distribution curveapproximately fit all population distributions in one data set, whichmeans the populationdistributions of various periods are roughly can be fitted with one identical distributionfunction. Therefore, P(s, t) is a time-independent function. Then we find that the popu-lation distribution of each data set is seemingly a straight line in the log-log scale, whichindicates that the distribution can be fitted with a power-law function. To confirm thisobservation, we conduct the hypothesis testing as described in (Clauset et al. 2009), whichuses a goodness-of-fit test to determine plausibility of the power-law fit. It generates a p-value to quantify the plausibility. If p-value is close to 1, the fit is considered as plausible tothe empirical data. Otherwise, it is considered as implausible. The results of the hypoth-esis tests show that p = 1.0 for Renren, p = 0.90 for Twitter and p = 0.95 for Gowalla.All three values are close to 1. Therefore, we say that the power-law function is plausibleto fit three data sets.Alternatively, we conduct alternative hypothesis testing regarding the population dis-
tribution by the likelihood ratio test (Clauset et al., 2009), which suggests that thedistribution is a power-law if the likelihood ratio between the alternative and power-law distribution is positive. We calculated the likelihood ratio of exponential distributioncompared with power-law distribution, which is 2.23, and the likelihood ratio of log-normal distribution compared with power-law distribution, which is 0.12. The resultssuggest that power-law is the best distribution to represent population distribution.We fit each distribution in figures with maximal likelihood estimation (MLE) (Newman
2005, Clauset et al. 2009). The fitting results are shown in dashed lines. It shows thatRenren data set has a power-law exponent of 1.4, Twitter has a power-law exponent of1.78 and Gowalla has a power-law exponent of 1.4.We give themathematical model of the population distribution in different time periods
as:
P(s, t) = ϕ ∗ s−λ, (4)
where ϕ is the scaling factor and λ is the power-law exponent. The equation reveals thatthe population distribution in different time periods is a power-law function, and it isindependent from time.
Zhu et al. Complex Adaptive Systems Modeling 2013, 1:14 Page 6 of 16http://www.casmodeling.com/content/1/1/14
Figure 1 Population distribution of various periods in three data sets. (a) Renren, the distribution ofpopulation size in 10th month (circle), 20th month (square), 30th month (star), 40th month (solid circle) and50th month (triangle). Five curves are close to each other and seemingly follow the same distribution. Thedashed line is the power law distribution: y ∼ x−1.4. (b) Twitter, the distribution of population size in 8thmonth (circle), 18th month (square), 28th month (star), 38th month (solid circle) and 48th month (triangle).Five curves are close to each other and seemingly follow the same distribution. The dashed line is: y ∼ x−1.78.(c) Gowalla, the distribution of population size in 5th month (circle), 10th month (square), 15th month (star)and 20th month (triangle). Four curves are close to each other and seemingly follow the same distribution.The dashed line is: y ∼ x−1.4.

Zhu et al. Complex Adaptive SystemsModeling 2013, 1:14 Page 7 of 16http://www.casmodeling.com/content/1/1/14
Populated locations: l(t)To model the population growth in OSNs, one important aspect is to understand thegrowth of populated locations. In this subsection, we investigate the growth of populatedlocations.
The growth of populated locations is a function of time t and defined as l(t). To for-mulate l(t), we draw the number of populated locations of three data sets as a functionof time in the log-log scale, as shown in Figure 2a, 2b and 2c. The numbers of populatedlocations are approximately straight lines. Again, we use MLE to fit them shown as dashedlines in figures. The fitting function can be formulated as:
l(t) = η ∗ tε, (5)
with scaling parameter η and the power exponent ε. The power exponent of Renren is1.26, of Twitter is 1.96 and of Gowalla is 1.62.In a summary, we find that the growth of the number of populated locations in OSNs is
a power function of time.
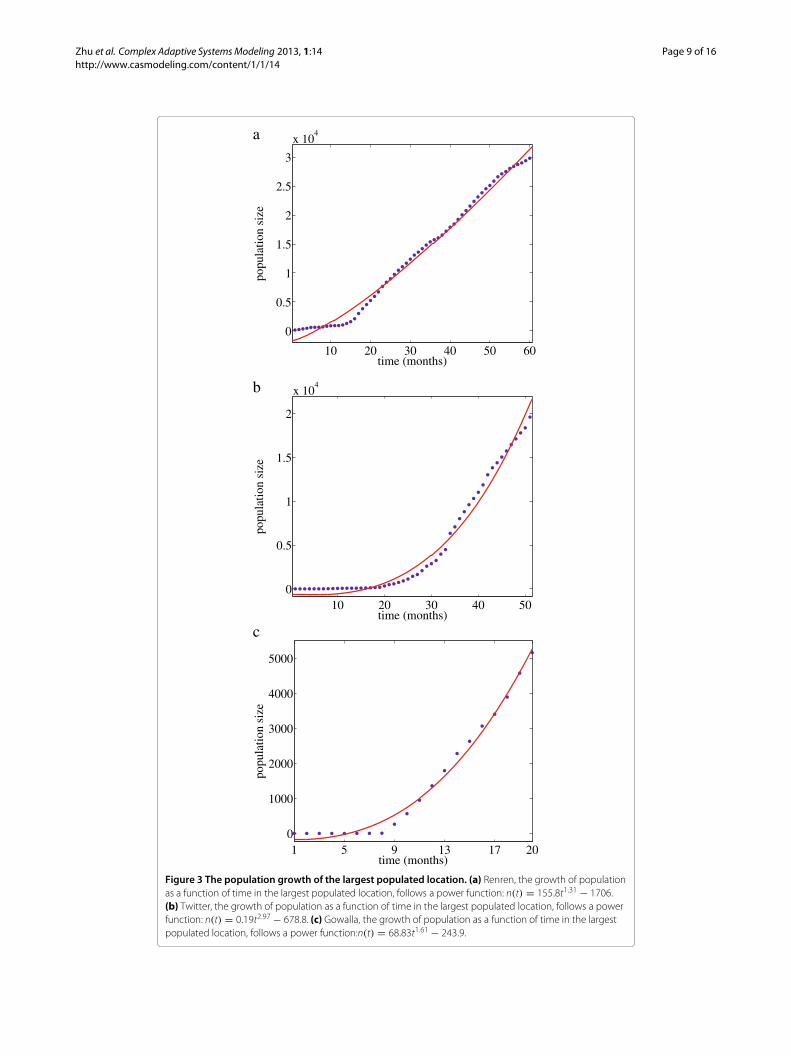
The largest population: n(t)As we model the population growth as an accumulation of populations in various loca-tions, the largest population as the upper bound of the formulation also needs to beinvestigated.To measure the largest population size, we select the location with the largest popula-
tion sizes in 10th month from three data sets and study the growth of their populationsas a function of time, respectively. We define the growth function of the largest popula-tion as n(t). To obtain n(t), we grab the largest population size from month to month ineach data set and plot the growth of the largest population size as a function of time. Thegrowth trends of them are shown in Figure 3a, 3b and 3c. Similar to the analysis of popu-lated location growth, the growth of the largest population size can also be fitted using apower function as the following:
n(t) = a ∗ tb + c. (6)
Besides the power component a ∗ tb, there is a constant number c added to the powerfunction. We use this function to fit the largest population size in each data set shown asthe solid lines in the figures. Specifically, the power parameter of Renren is 1.31, of Twitteris 2.97 and it is 1.61 for Gowalla.Therefore, the growth function of the largest population size is a power function. The
population growth of a location will affect the aggregated population growth.We will givethe detailed model of the population growth in the following subsection.
The population growth model
Given the distribution of population, the growth function of populated locations and thelargest population size, we insert the above expressions of p(s, t), l(t), and n(t) as shownin Eq. 4, Eq. 5 and Eq. 6 into Eq. 3. Then we have
GP(t) =∫ a∗tb+c
1((ϕ ∗ s−λ) ∗ (η ∗ tε) ∗ s)ds
= ηϕtε
2 − λ[ (a ∗ tb + c)2−λ − 1] .
(7)

Zhu et al. Complex Adaptive Systems Modeling 2013, 1:14 Page 8 of 16http://www.casmodeling.com/content/1/1/14
100
101
102
103
104
time (months)
num
ber
of lo
catio
ns
a
100
101
100
102
time (months)
num
ber
of lo
catio
ns
b
100
101
102
103
104
time (months)
num
ber
of lo
catio
ns
c
Figure 2 The growth of populated locations. (a) Renren, the growth of populated location as a function oftime follows a power function y ∼ x1.26. (b) Twitter, the growth of populated location as a function of timefollows a power function y ∼ x1.96. (c) Gowalla, the growth of populated location as a function of timefollows a power function y ∼ x1.62.
Zhu et al. Complex Adaptive SystemsModeling 2013, 1:14 Page 9 of 16http://www.casmodeling.com/content/1/1/14
10 20 30 40 50 60
0
0.5
1
1.5
2
2.5
3
x 104
time (months)
popu
latio
n si
ze
a
10 20 30 40 500
0.5
1
1.5
2
x 104
time (months)
popu
latio
n si
ze
b
1 5 9 13 17 200
1000
2000
3000
4000
5000
time (months)
popu
latio
n si
ze
c
Figure 3 The population growth of the largest populated location. (a) Renren, the growth of populationas a function of time in the largest populated location, follows a power function: n(t) = 155.8t1.31 − 1706.(b) Twitter, the growth of population as a function of time in the largest populated location, follows a powerfunction: n(t) = 0.19t2.97 − 678.8. (c) Gowalla, the growth of population as a function of time in the largestpopulated location, follows a power function:n(t) = 68.83t1.61 − 243.9.

Zhu et al. Complex Adaptive Systems Modeling 2013, 1:14 Page 10 of 16http://www.casmodeling.com/content/1/1/14
The above equation reveals that the population growth is a function of time, and it is sim-ilar to power function. The model describes the aggregated population growth of onlinesocial networks in both temporal dimension and spatial dimension.
ResultsTo present the effectiveness of our population growth model, we evaluate our proposedmodel from three aspects. First, we verify the model in the early stage population growthof three data sets. Then we evaluate the full population growth in Facebook (2013) andSina Weibo (2013) by our model. Finally, as an application of our model, we use it topredict the population growth on the latter part populations of three data sets.
Model verification in three data sets
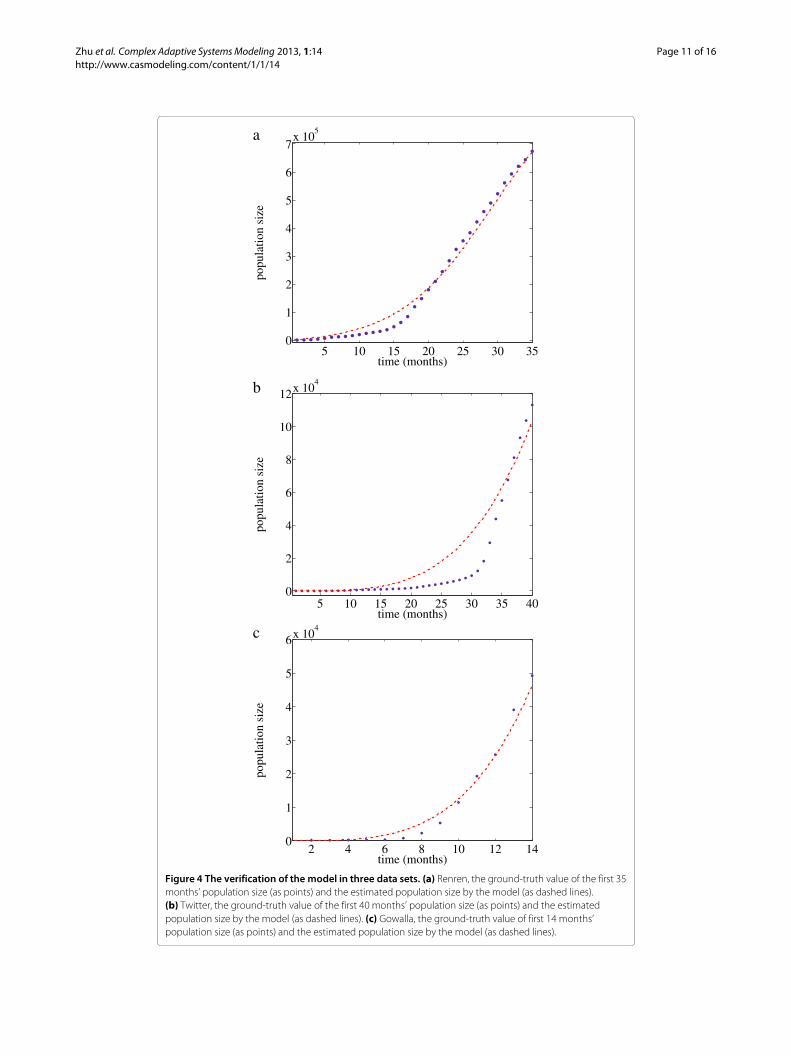
We verify our population growth model by estimating the early stages of populationgrowth in three data sets (i.e. first 35 months’ population growth of Renren, the first40 months’ population growth of Twitter and the first 14 months’ population growth ofGowalla).We use the population growth function as shown in Eq. 7 to fit the early stages of
population growth in three data sets. We plot the values estimated by the model andthe monthly ground-truth population values in three data sets as shown in Figure 4.The points in the figure denote the monthly ground-truth values of population size ineach data set, and the dashed lines are the estimated value by the growth model.Wecompare the estimated value with the value from the data sets. Figure 4a shows the com-parison of Renren. The minor difference indicates the model can represent populationgrowth in Renren well. Although the modeled curve of Twitter has the difference with thedata set value in the middle of the time period, as shown in Figure 4b, we observe that themodel tends to fit the data set population very well at the end of the period. The modelshows very good performance in Gowalla as shown in Figure 4c.In a summary, the verification of the population growthmodel in three data sets validate
the correctness of the model.
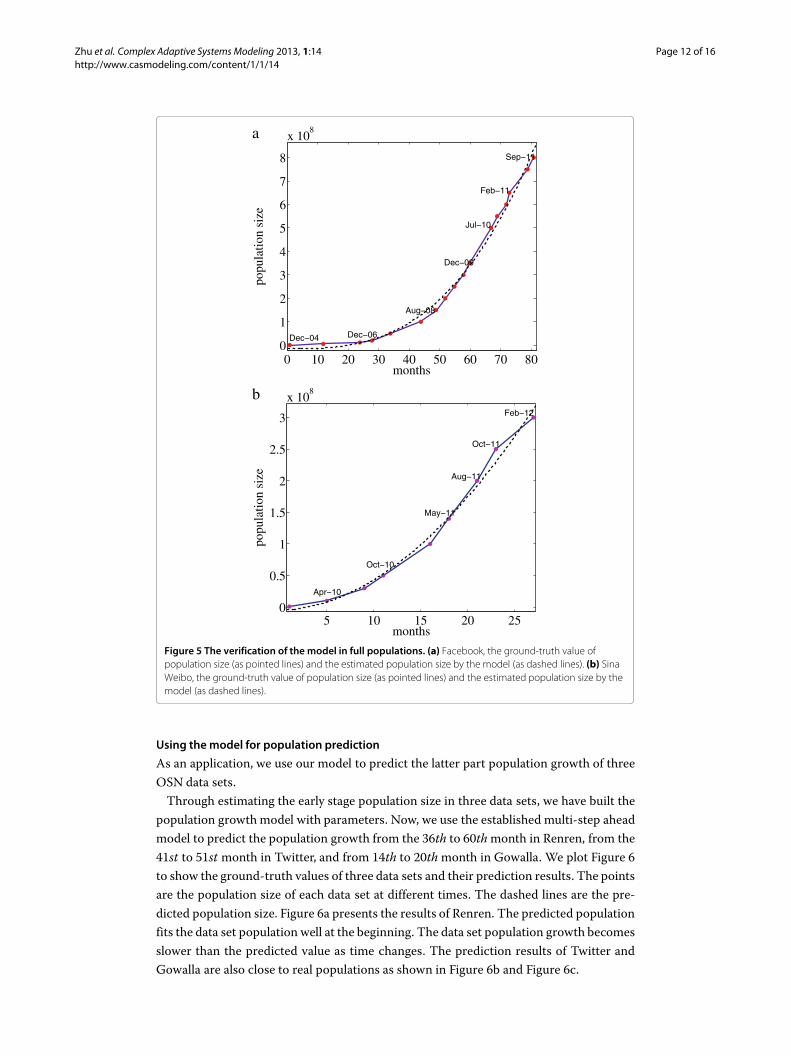
Model verification in full OSN populations
In this subsection, we verify our model in full population of Facebook (2013) and SinaWeibo (2013) to show its effectiveness in two OSNs with integral populations.We conduct experiments on the full user populations in Facebook and Sina
Weibo. Facebook was launched in 2004 and reached 800 million in September 2011.The population growth trend is shown in Figure 5a. SinaWeibo, a Chinese microbloggingweb site, was launched in 2009. Its population has reached 300 million in February 2012.The growth trend of the population is shown as Figure 5b. For each population growth,we use Eq. 7 to fit the population. We plot the value estimated by the model shown asdashed lines in Figure 5a and Figure 5b, respectively. By comparing the estimated valueswith the ground-truth population values, we find that the estimated values are close to thereal values of populations, which suggests that our model is valid for population growthof Facebook and Sina Weibo.
Zhu et al. Complex Adaptive SystemsModeling 2013, 1:14 Page 11 of 16http://www.casmodeling.com/content/1/1/14
5 10 15 20 25 30 350
1
2
3
4
5
6
7x 10
5
time (months)
popu
latio
n si
ze
a
5 10 15 20 25 30 35 400
2
4
6
8
10
12x 104
time (months)
popu
latio
n si
ze
b
2 4 6 8 10 12 140
1
2
3
4
5
6x 10⁴
time (months)
popu
latio
n si
ze
c
Figure 4 The verification of the model in three data sets. (a) Renren, the ground-truth value of the first 35months’ population size (as points) and the estimated population size by the model (as dashed lines).(b) Twitter, the ground-truth value of the first 40 months’ population size (as points) and the estimatedpopulation size by the model (as dashed lines). (c) Gowalla, the ground-truth value of first 14 months’population size (as points) and the estimated population size by the model (as dashed lines).
Zhu et al. Complex Adaptive Systems Modeling 2013, 1:14 Page 12 of 16http://www.casmodeling.com/content/1/1/14
0 10 20 30 40 50 60 70 800
1
2
3
4
5
6
7
8
x 108
months
popu
latio
n si
ze
Dec−06Dec−04
Aug−08
Dec−09
Jul−10
Feb−11
Sep−11
a
5 10 15 20 250
0.5
1
1.5
2
2.5
3
x 108
months
popu
latio
n si
ze
Apr−10
Oct−10
May−11
Aug−11
Oct−11
Feb−12
b
Figure 5 The verification of the model in full populations. (a) Facebook, the ground-truth value ofpopulation size (as pointed lines) and the estimated population size by the model (as dashed lines). (b) SinaWeibo, the ground-truth value of population size (as pointed lines) and the estimated population size by themodel (as dashed lines).
Using themodel for population prediction
As an application, we use our model to predict the latter part population growth of threeOSN data sets.Through estimating the early stage population size in three data sets, we have built the
population growthmodel with parameters. Now, we use the established multi-step aheadmodel to predict the population growth from the 36th to 60thmonth in Renren, from the41st to 51st month in Twitter, and from 14th to 20thmonth in Gowalla. We plot Figure 6to show the ground-truth values of three data sets and their prediction results. The pointsare the population size of each data set at different times. The dashed lines are the pre-dicted population size. Figure 6a presents the results of Renren. The predicted populationfits the data set population well at the beginning. The data set population growth becomesslower than the predicted value as time changes. The prediction results of Twitter andGowalla are also close to real populations as shown in Figure 6b and Figure 6c.

Zhu et al. Complex Adaptive SystemsModeling 2013, 1:14 Page 13 of 16http://www.casmodeling.com/content/1/1/14
0 10 20 30 40 50 600
2
4
6
8
10
12x 105
time (months)
popu
latio
n si
ze
a
10 20 30 40 500
0.5
1
1.5
2
2.5
x 105
time (months)
popu
latio
n si
ze
b
2 4 6 8 10 12 14 16 18 200
2
4
6
8
10
x 104
time (months)
popu
latio
n si
ze
c
Figure 6 The predicted population in three data sets using population growth model. (a) Renren, theground-truth value of the population size between 36th month and 60th month (as points) vs. thepredicated value by the model (as dashed lines). (b) Twitter, the ground-truth value of the population sizebetween 41th month and 51th month (as points) vs. the predicated value by the model (as dashed lines).(c) Gowalla, the ground-truth value of the population size between 15th month and 20th month (as points)vs. the predicated value by the model (as dashed lines).
Zhu et al. Complex Adaptive Systems Modeling 2013, 1:14 Page 14 of 16http://www.casmodeling.com/content/1/1/14
To quantify the accuracy of the prediction, We use prediction accuracy (PA) and defineit as follows:
PA = 1 − |predicted value − actual valueactual value
| (8)
According to Eq. 8, we present the prediction accuracy of our model in several monthsin Table 2. The results in the table show that our model achieves 94.30% average pre-diction accuracy for Renren, 98.94% average prediction accuracy for Twitter, and 97.73%average prediction accuracy for Gowalla. These results suggest that our model canperform very well in OSN population prediction.
Table 2 The prediction accuracy of the population growthmodel
Renren Twitter Gowalla
40th 99.36% 42th 96.90% 16th 95.55%
45th 98.71% 44th 99.04% 17th 98.25%
50th 95.50% 46th 99.35% 18th 99.62%
55th 91.77% 48th 99.89% 19th 99.80%
60th 86.14% 50th 99.53% 20th 95.43%
The table is the prediction accuracy of the population growth model of selected months in three data sets.
DiscussionIn this section, we discuss the impact of methods used for data collection and processing,the effects of populations acquirement in OSNs and the scope of our growth model.
Data collecting and processing
In this paper, we use BFS started from random selected nodes to collect the data samplesfrom online social networks. The population growth model based on random samplingdata may cause inaccurate population estimation and prediction. To avoid this issue, weconduct several actions to make the data sets fair enough. First of all, we launch a BFS-bias correlation procedure (Kurant et al. 2011) to eliminate the biases caused by randomwalking. Secondly, according to the estimation method of social network sizes by randomsampling presented in (Katzir et al. 2011), we argue that the quality of data sets cannot beaffected by random selected nodes. Finally, we use full population size in Facebook andSina Weibo to validate the effectiveness of the proposed population growth model. Allthese efforts are made to let the data samples collected from online social networks beaccurate enough for modeling population growth.
Population acquirement in OSNs
We use registered users as the population in OSNs. Thus, we count every registered userin the network as a member of the total population. It contains both active users andinactive users. In our model, we consider these inactive users as one part of the aggregatedpopulation for the following reasons: (1) Inactive users are also one part of the population.We cannot say a user who is not active in the network does not belong to this network.(2) Detecting active users is a complex process which cannot be done simply. For example,people may find the active users from the activity that the user conducts on the web site.However, many people may only browse the web site without any explicit activity. Theyperform inactive in interacting with others in OSNs, but they are also active users. By
Zhu et al. Complex Adaptive SystemsModeling 2013, 1:14 Page 15 of 16http://www.casmodeling.com/content/1/1/14
these two reasons, we consider registered users instead of active users as the populationof an OSN.
Scope of the growth model
Our population growthmodel focuses on the growing stage of OSNs.We do not intend totrack the life circle of an OSN. When an OSN’s population stops growing, our model willnot take effect on it. To specify the growing stage of an OSN, we define the populationmonthly growth rate as
r(t) = population(t) − population(t − 1)population(t − 1)
,
if r(t) > 0, we consider the population is in growing stage between time t − 1 and t.We say an OSN is in growing stage if its monthly growth rates are all greater than 0 inthe observed time period. Actually, our crawled data sets and two full population OSNs(Facebook and SinaWeibo) are all in population growing stage, which adapt to our study.Besides, most popular OSNs (such as Facebook and Twitter) are currently still in thegrowing stage. Therefore, our populationmodel focuses in the stage of population growthin OSNs.
ConclusionsIn this paper, we propose a population growth model for online social networks. Weinvestigate the population growth in spatiotemporal perspective. By studying the popu-lation growth over locations and time in three data sets of Renren, Twitter and Gowalla,we find out the population distribution is a power-law function over various locations.The growth of populated locations and the largest population are both power functionsof time. By integrating the temporal and spatial characteristics of population growth,we conduct the general population growth model. Extensive experiments show that ourmodel can fit the population growth in Facebook and Sina Weibo. As an application, weuse themodel for population predication in three data sets, and it can achieve a predictionaccuracy between 86.14% and 99.89%.
Competing interestsThe authors declare that they have no competing interests.
Authors’ contributionsAll authors contributed equally to the paper. All authors read and approved the final manuscript.
AcknowledgementsThe authors acknowledge the funding from Alexander von Humboldt Foundation and DAAD Foundation. We would liketo thank Mr. Cong Ding for the help to crawl Renren data sets. We also appreciate the comments from anonymousreviewers for improving the quality of the paper.
Author details1Institute of Computer Science, University of Goettingen, Goettingen, Germany. 2State Key Laboratory for NovelSoftware and Technology, Nanjing University, Nanjing, China.
Received: 14 March 2013 Accepted: 27 May 2013Published: 24 June 2013
ReferencesClauset, A, Shalizi CR, Newman MEJ: Power-law distributions in empirical data. SIAM Rev 2009, 51(4):661—703.Cho, E, Myers SA, Leskovec J: Friendship andmobility: user movement in location-based social networks. In
Proceedings of the 17th ACM SIGKDD International Conference on Knowledge Discovery and Data Mining (KDD ’11). NewYork: ACM; 2011:1082–1090.
Facebook; 2013. [http://www.facebook.com]

Zhu et al. Complex Adaptive Systems Modeling 2013, 1:14 Page 16 of 16http://www.casmodeling.com/content/1/1/14
Katzir, L, Liberty E, Somekh O: Estimating sizes of social networks via biased sampling. In Proceedings of the 20thInternational Conference onWorld WideWeb (WWW ’11). New York: ACM; 2011:597—606.
Kurant, M, Markopoulou A, Thiran P: Towards unbiased BFS sampling. IEEE J Selected Areas Commun 2011,29(9):1799–1809.
Leskovec, J, Backstrom L, Kumar R, Tomkins A:Microscopic evolution of social networks. In Proceedings of the 14th ACMSIGKDD International Conference on Knowledge Discovery and Data Mining (KDD ’08). New York: ACM; 2008:462–470.
Newman, MEJ: Power laws, Pareto distributions and Zipf’s law. Contemp Phys 2005, 46(5):323–351.Rejaie, R, Torkjazi M, Valafar M, Willinger W: Sizing up online social networks. IEEE Netw: Mag Global Internetworking
2010, 24(5):32–37.Renren net; 2013. [http://www.renren.com]Sina weibo; 2013. [http://www.weibo.com]Torkjazi M: Hot today, gone tomorrow: On themigration of MySpace users. In Proceedings of the 2nd ACMWorkshop
on Online Social Networks (WOSN ’09). New York: ACM; 2009.Twitter; 2013. [http://www.twitter.com]
doi:10.1186/2194-3206-1-14Cite this article as: Zhu et al.: Modeling population growth in online social networks. Complex Adaptive SystemsModeling 2013 1:14.
Submit your manuscript to a journal and benefi t from:
7 Convenient online submission
7 Rigorous peer review
7 Immediate publication on acceptance
7 Open access: articles freely available online
7 High visibility within the fi eld
7 Retaining the copyright to your article
Submit your next manuscript at 7 springeropen.com


![RESEARCH OpenAccess … OpenAccess Anovelvoiceconversionapproachusing admissiblewaveletpacketdecomposition ... posed for voice morphing [17]. …](https://static.fdocuments.net/doc/165x107/5b0354627f8b9ab9598f2a8c/research-openaccess-openaccess-anovelvoiceconversionapproachusing-admissiblewaveletpacketdecomposition.jpg)