RESEARCH Open Access A large-scale electrophoresis- and ...
11
RESEARCH Open Access A large-scale electrophoresis- and chromatography-based determination of gene expression profiles in bovine brain capillary endothelial cells after the re-induction of blood-brain barrier properties Gwënaël Pottiez 1,2,3 , Barbara Deracinois 1,2,3 , Sophie Duban-Deweer 1,2,3 , Roméo Cecchelli 1,2,3 , Laurence Fenart 1,2,3 , Yannis Karamanos 1,2,3 , Christophe Flahaut 1,2,3* Abstract Background: Brain capillary endothelial cells (BCECs) form the physiological basis of the blood-brain barrier (BBB). The barrier function is (at least in part) due to well-known proteins such as transporters, tight junctions and metabolic barrier proteins (e.g. monoamine oxidase, gamma glutamyltranspeptidase and P-glycoprotein). Our previous 2-dimensional gel proteome analysis had identified a large number of proteins and revealed the major role of dynamic cytoskeletal remodelling in the differentiation of bovine BCECs. The aim of the present study was to elaborate a reference proteome of Triton X-100-soluble species from bovine BCECs cultured in the well- established in vitro BBB model developed in our laboratory. Results: A total of 215 protein spots (corresponding to 130 distinct proteins) were identified by 2-dimensional gel electrophoresis, whereas over 350 proteins were identified by a shotgun approach. We classified around 430 distinct proteins expressed by bovine BCECs. Our large-scale gene expression analysis enabled the correction of mistakes referenced into protein databases (e.g. bovine vinculin) and constitutes valuable evidence for predictions based on genome annotation. Conclusions: Elaboration of a reference proteome constitutes the first step in creating a gene expression database dedicated to capillary endothelial cells displaying BBB characteristics. It improves of our knowledge of the BBB and the key proteins in cell structures, cytoskeleton organization, metabolism, detoxification and drug resistance. Moreover, our results emphasize the need for both appropriate experimental design and correct interpretation of proteome datasets. Background The endothelia of different organs are remarkably het- erogeneous but do present many common functional and morphological features. Given the endothelium’ s strategic position between the blood and the tissues, this cell layer (i) closely controls the transport of plasma molecules (via bidirectional receptor-mediated and receptor-independent transcytosis and endocytosis), (ii) regulates vascular tone, (iii) synthesises and secretes a wide variety of factors and (iv) is involved in the regu- lation of inflammation, haemostasis, thrombosis and immunity. It is now also generally accepted that the spe- cific ultrastructure of capillaries in the brain, retina, kid- ney and liver governs the specialized physiological properties of these respective endothelia [1]. In the brain, the blood-brain barrier (BBB) separates the brain microvasculature from the peripheral microvasculature. The BBB constitutes a physical and metabolic barrier which tightly regulates blood-brain exchanges of ions, * Correspondence: [email protected] 1 Univ Lille Nord de France, F-59000 Lille, France Full list of author information is available at the end of the article Pottiez et al. Proteome Science 2010, 8:57 http://www.proteomesci.com/content/8/1/57 © 2010 Pottiez et al; licensee BioMed Central Ltd. This is an Open Access article distributed under the terms of the Creative Commons Attribution License (http://creativecommons.org/licenses/by/2.0), which permits unrestricted use, distribution, and reproduction in any medium, provided the original work is properly cited.
Transcript of RESEARCH Open Access A large-scale electrophoresis- and ...

RESEARCH Open Access
A large-scale electrophoresis- andchromatography-based determination of geneexpression profiles in bovine brain capillaryendothelial cells after the re-induction ofblood-brain barrier propertiesGwënaël Pottiez1,2,3, Barbara Deracinois1,2,3, Sophie Duban-Deweer1,2,3, Roméo Cecchelli1,2,3, Laurence Fenart1,2,3,Yannis Karamanos1,2,3, Christophe Flahaut1,2,3*
Abstract
Background: Brain capillary endothelial cells (BCECs) form the physiological basis of the blood-brain barrier (BBB).The barrier function is (at least in part) due to well-known proteins such as transporters, tight junctions andmetabolic barrier proteins (e.g. monoamine oxidase, gamma glutamyltranspeptidase and P-glycoprotein). Ourprevious 2-dimensional gel proteome analysis had identified a large number of proteins and revealed the majorrole of dynamic cytoskeletal remodelling in the differentiation of bovine BCECs. The aim of the present study wasto elaborate a reference proteome of Triton X-100-soluble species from bovine BCECs cultured in the well-established in vitro BBB model developed in our laboratory.
Results: A total of 215 protein spots (corresponding to 130 distinct proteins) were identified by 2-dimensional gelelectrophoresis, whereas over 350 proteins were identified by a shotgun approach. We classified around 430distinct proteins expressed by bovine BCECs. Our large-scale gene expression analysis enabled the correction ofmistakes referenced into protein databases (e.g. bovine vinculin) and constitutes valuable evidence for predictionsbased on genome annotation.
Conclusions: Elaboration of a reference proteome constitutes the first step in creating a gene expression databasededicated to capillary endothelial cells displaying BBB characteristics. It improves of our knowledge of the BBB andthe key proteins in cell structures, cytoskeleton organization, metabolism, detoxification and drug resistance.Moreover, our results emphasize the need for both appropriate experimental design and correct interpretation ofproteome datasets.
BackgroundThe endothelia of different organs are remarkably het-erogeneous but do present many common functionaland morphological features. Given the endothelium’sstrategic position between the blood and the tissues, thiscell layer (i) closely controls the transport of plasmamolecules (via bidirectional receptor-mediated andreceptor-independent transcytosis and endocytosis),
(ii) regulates vascular tone, (iii) synthesises and secretesa wide variety of factors and (iv) is involved in the regu-lation of inflammation, haemostasis, thrombosis andimmunity. It is now also generally accepted that the spe-cific ultrastructure of capillaries in the brain, retina, kid-ney and liver governs the specialized physiologicalproperties of these respective endothelia [1]. In thebrain, the blood-brain barrier (BBB) separates the brainmicrovasculature from the peripheral microvasculature.The BBB constitutes a physical and metabolic barrierwhich tightly regulates blood-brain exchanges of ions,
* Correspondence: [email protected] Lille Nord de France, F-59000 Lille, FranceFull list of author information is available at the end of the article
Pottiez et al. Proteome Science 2010, 8:57http://www.proteomesci.com/content/8/1/57
© 2010 Pottiez et al; licensee BioMed Central Ltd. This is an Open Access article distributed under the terms of the Creative CommonsAttribution License (http://creativecommons.org/licenses/by/2.0), which permits unrestricted use, distribution, and reproduction inany medium, provided the original work is properly cited.

small molecules and proteins and is involved in therecruitment of immune cells prior to transfer to thebrain during inflammation [2-4].In brain capillaries, the BBB is formed by endothelial
cells, which are surrounded by a tubular sheath of astro-cytic end-feet. Pericytes are inserted into the basal mem-brane (between the endothelium and the astrocyticend-feet) [3]. This spatial cell layout and the resultingastrocyte-endothelium communication induce the estab-lishment and maintenance of the BBB [5-7]. Dysregula-tion of these processes has been linked to thepathogenesis of several human diseases [8].In the brain, only blood capillaries are endowed with a
complete BBB phenotype [9]. Under physiological condi-tions, the barrier function is performed by a number ofunique endothelial features, including (i) the lack offenestration, (ii) a decrease in the number of pinocyticvesicles, (iii) the reinforcement of complex tight junc-tions and (iv) the upregulated expression of metabolicenzymes and plasma membrane transporters and recep-tors [5]. The physiological consequences of endothelialcell differentiation include an increase in the transen-dothelial electrical resistance (due to a decrease in thepara- and transcellular endothelial permeability of ionsand low-molecular-weight hydrophilic compounds) andare associated with marked polarization of the cerebralendothelium [10,11]. In brain endothelial cells, theplasma membrane acts as the controlling interface forintracellular molecular signalling, the reinforcement oftight junctions and molecular and cell transport betweenthe brain and the blood. The plasma membrane of braincapillary endothelial cells (BCECs) has been extensivelystudied and its membrane protein expression patternhas been well defined [12]. The intracellular location ofcertain proteins was shown to be essential for the estab-lishment and maintenance of the BBB-related featuresof BCECs. These intracellular locations are frequentlyused as quality control criteria for in vitro BBB models.Furthermore, it is known that the protein distributionchanges under pathological conditions [13,14]. Paradoxi-cally, no dedicated studies in this field have beenreported. Moreover, the BBB’s metabolic proteome isnot well known and the cytosolic, nuclear and mito-chondrial protein expression profiles have yet to beextensively characterized. Therefore, the use of TritonX-100 (known to poorly solubilise sparingly soluble pro-teins [15]) appeared as the best way to select theBCECs’ cytosolic subproteome in the present study.Proteomics deals with the direct, large-scale determi-
nation of gene and cellular function at the protein level.Recent successes have emphasized the role of massspectrometry-based proteomics as an essential tool inmolecular and cellular biology. Two-dimensional polya-crylamide gel electrophoresis (2-DE) has become the
core technology for building proteomic databases, forseveral reasons. Firstly, 2-DE can display thousands ofproteins and allows the relative quantification of anygiven polypeptide. Secondly, the high-mass shifts causedby one or more posttranslational modifications can becharacterized. Thirdly, digitized 2-DE images are conve-nient, informative visual media for creating a web-baseddatabase. Although 2-DE can (in theory) separate allproteins, the technique has a number of drawbacks inpractice: (i) it is difficult to separate proteins with low(< 10 kDa) or high (> 200 kDa) molecular weights,(ii) the truly operational pI range is 3-11 and (iii) pro-tein spots are frequently superposed. Complementaryapproaches are often needed to overcome incompatibil-ities between the 2-DE separation technique and thephysical-chemical properties of certain proteins of inter-est. Liquid chromatography (LC) is an alternative (or acomplementary counterpart) to 2-DE.On the basis of the in vitro BBB co-culture model devel-
oped in our laboratory [16], we have initiated a compre-hensive proteomic approach based on the extractability ofproteins with Triton X-100. It uses a 2-DE/1D-LC combi-nation to provide a detailed expression profile for the Tri-ton X-100-soluble proteins expressed by bovine BCECs(BBCECs) with the BBB phenotype. Here, we report onthe use of a high-throughput proteomics platform in the2-DE identification of the most abundant Triton X-100-soluble proteins, together with additional 1D-LC identifi-cation. In addition to investigation of the correlationbetween the identified proteins and BBB functions, thepresent study was also designed to prime a comprehensive,interactive, web-based proteomics database for BCECs(2-DE images, comparative results, mass spectra, identifi-cation scores, protein identities, protein functions, etc.), inaccordance with published guidelines [17,18].
ResultsVerification of the re-induction of BBB propertiesWhen isolated in vitro, primary BBCECs dedifferentiateand lose their BBB properties. The latter can be restoredby 12 days of co-culture with glial cells [16]. We con-firmed the re-induction of BBB properties by (i) measur-ing an optimal value for the paracellular permeabilitycoefficient (Pe) and (ii) immunostaining the main tightjunction proteins (ZO-1, occludin and claudin-5). Asreported in the literature [19,20], the markers display apericellular distribution in differentiated BBCECs, whichcontrasts with the uniform pattern for dedifferentiatedcells (data not shown). The BBCECs were harvested andlysed according to the procedure described by Pottiezet al. [21]. The Triton X-100-solubilised protein fraction(representing 85% of the cell’s total protein) was thensubjected to either 2-DE or off-line 1D-LC tandem massspectrometry (MS/MS) analysis with a C18 column.
Pottiez et al. Proteome Science 2010, 8:57http://www.proteomesci.com/content/8/1/57
Page 2 of 11

Two-dimensional polyacrylamide gel electrophoresisProteins of interest were subjected to 2-DE over a pHrange of 4-7 and a molecular weight range of 100-10kDa. Four gels were prepared from four different filterinserts. The 2-DE-separated proteins were stained witheither silver nitrate (to evaluate the reproducibility of2-DE separation) or Coomassie brilliant blue (to per-form the subsequent protein identification steps). Next,384 of the most intense, best-resolved polypeptide spotswere automatically identified according to a Proteineer™-workflow. Of the 384 excised spots, 215 (56%), wereunambiguously identified (Figure 1, in which the num-bering corresponds to identified proteins; non-identifiedproteins are not reported) and 198 were identified asbovine proteins. Protein identifications were mainlybased on the peptide mass fingerprint (PMF) principle,in which the Mascot 2.2 identification algorithm wasused to search the NCBInr and Swiss-Prot 57.7 data-bases. The Mascot scores from the two databases weresimilar for all but 9 proteins (indicated by an asterisk inthe Table S1, see Additional File 1). Moreover, 85 pro-tein identities were confirmed by peptide fragmentationfingerprinting (PFF). The 215 identified spots corre-sponded to 130 distinct proteins (grouped together inTable S1 in alphabetical order for convenience andclarity). Interestingly, 8 protein spots (#42, 61, 90, 91,113, 121, 127 and 147) were identified as containing twoproteins. Proteins with similar primary amino acidsequences (e.g. ezrin-radixin-moesin complex proteins)were well resolved by 2-DE and, despite their sequencehomologies, were more conveniently identified by PMFthan by PFF (data not shown).
One-dimensional liquid chromatographyTwenty μg of Triton X-100-solubilized proteins fromBBCECs were subjected to a 16-hour in-solution diges-tion. The mixture of trypsin-generated peptides wasresolved by 1D-LC (on a C18 column with a linearacetonitrile gradient), spotted and concomitantly co-crystallised with a-cyano-4-hydroxycinnamic acid(CHCA) matrix on a matrix-assisted laser desorption/ionization (MALDI) target. The 380 spotted fractionsunderwent automatic MS and MS/MS measurements.Around 12000 compounds were detected in the MSstep and 3000 of these were subjected to MS/MS frag-mentation. Due to the insufficient separative power ofthe 1D-LC protocol, only a few peptides yielded a frag-mentation pattern which was suitable for identification(data not shown). Since 2D-LC technology is unavailablein our laboratory, we developed a fractionation step (seeMaterial and Methods) for reducing protein heterogene-ity prior to a 1D-LC analysis and for ensuring as manyprotein identifications as possible. Each subfraction wassubjected to the previously described off-line 1D-LCseparation, in which around 3000 components wereMS-detected in the main fractions (F0, F25, F50 andF75). Around 400 of these components were in-sourcefragmented and 250 MS/MS spectra provided unambig-uous protein identities. An average of 138 proteins wereidentified from the F0 subfraction, with 235 in the F25subfraction, 180 in the F50 subfraction, 185 in the F75subfraction and only 9 from the F100 subfraction (Fig-ure 2A). The latter figure also shows the proportion ofproteins specifically identified in only one fraction; frac-tions F0, F25, F50 and F75 contained 41, 64, 22 and 35fraction-specific proteins, respectively (black areas).Moreover, 8 proteins were found in fractions F0 andF25 (Figure 2A, diagonally hatched area), 23 proteinswere common to fractions F25 and F50 (Figure 2A, ver-tically hatched area) and only 14 proteins were identifiedin both fractions F50 and F75 (Figure 2A, horizontallyhatched area). Ultimately, no fewer than 363 proteins(all listed in Table S2, see Additional File 2) were identi-fied; 1D-LC MS/MS data are available in the EuropeanBioinformatics Institute’s PRIDE database [22] http://www.ebi.ac.uk/pride under accession numbers 12825 to12830. The data were converted using the PRIDE Con-verter [23]. In all, 134 proteins (around 37%) were iden-tified on the basis of only one peptide sequence, with103 proteins identified from 2 MS-fragmented peptidesand 183 proteins identified from between 3 and 10 frag-mented peptides. Nineteen proteins (such as vimentin,titin, meosin, alpha-actinins 1 and 3, filamins A and B,clathrin heavy chain 1, ATP synthase beta-subunit, vin-culin, spectrin alpha chain (brain isoform) andmany tubulins (beta, beta-2C, beta-4, beta-5, etc.)) wereidentified with 10 to 25 peptides sequenced. These
3 4
5 6 789
10 11
12
13
14 15 1617
18
19 20
21
22 23
24 25
2627
2829
30
31
32 33 3435 36
37
38
39
40 4142
43
44
45
4647
48
49
50 51
5352 54
55
56
5758
59 6061 62
6364 65 66
67
68
69
7071 72
73
74
75 7677
7978
80
81
8283
84
8685 8788
89 90 929193
94 9596
9798
99
100
101102
103
106104
105
107 108
109
110111 112 113 114
116
117
115 119 120
121122
123124
125
126 127128 129
130 131
132
133 134 135136
137 138139
140141
214143
144145 146
147148
149150151 152 153
158155
156
157
159
154160
162161
163
165
164 166
167
149
168170
171172173
174 175 176177
178179
180 181
182183
189 185188 184
186 187190
191192
193 194 195
196197 198
199 200
201
118
215
142
213
Figure 1 Gel image from the 2-DE of Triton X-100-extractedproteins from bovine brain capillary endothelial cellsdisplaying the blood-brain barrier properties. 215 proteinidentities are reported on this 2-DE gel image and are summarizedin Table S1 (see Additional File 1).
Pottiez et al. Proteome Science 2010, 8:57http://www.proteomesci.com/content/8/1/57
Page 3 of 11
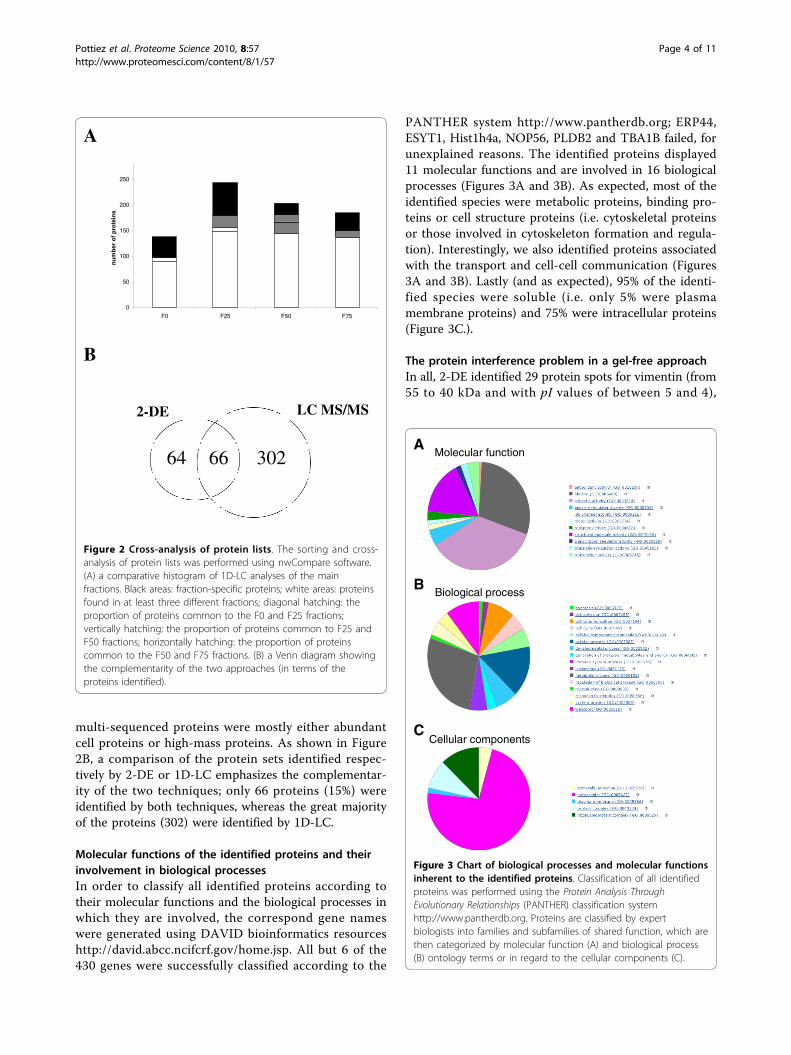
multi-sequenced proteins were mostly either abundantcell proteins or high-mass proteins. As shown in Figure2B, a comparison of the protein sets identified respec-tively by 2-DE or 1D-LC emphasizes the complementar-ity of the two techniques; only 66 proteins (15%) wereidentified by both techniques, whereas the great majorityof the proteins (302) were identified by 1D-LC.
Molecular functions of the identified proteins and theirinvolvement in biological processesIn order to classify all identified proteins according totheir molecular functions and the biological processes inwhich they are involved, the correspond gene nameswere generated using DAVID bioinformatics resourceshttp://david.abcc.ncifcrf.gov/home.jsp. All but 6 of the430 genes were successfully classified according to the
PANTHER system http://www.pantherdb.org; ERP44,ESYT1, Hist1h4a, NOP56, PLDB2 and TBA1B failed, forunexplained reasons. The identified proteins displayed11 molecular functions and are involved in 16 biologicalprocesses (Figures 3A and 3B). As expected, most of theidentified species were metabolic proteins, binding pro-teins or cell structure proteins (i.e. cytoskeletal proteinsor those involved in cytoskeleton formation and regula-tion). Interestingly, we also identified proteins associatedwith the transport and cell-cell communication (Figures3A and 3B). Lastly (and as expected), 95% of the identi-fied species were soluble (i.e. only 5% were plasmamembrane proteins) and 75% were intracellular proteins(Figure 3C.).
The protein interference problem in a gel-free approachIn all, 2-DE identified 29 protein spots for vimentin (from55 to 40 kDa and with pI values of between 5 and 4),
A
B
66 30264
2-DE LC MS/MS
0
50
100
150
200
250
F0 F25 F50 F75
nu
mb
er o
f p
rote
ins
Figure 2 Cross-analysis of protein lists. The sorting and cross-analysis of protein lists was performed using nwCompare software.(A) a comparative histogram of 1D-LC analyses of the mainfractions. Black areas: fraction-specific proteins; white areas: proteinsfound in at least three different fractions; diagonal hatching: theproportion of proteins common to the F0 and F25 fractions;vertically hatching: the proportion of proteins common to F25 andF50 fractions; horizontally hatching: the proportion of proteinscommon to the F50 and F75 fractions. (B) a Venn diagram showingthe complementarity of the two approaches (in terms of theproteins identified).
Molecular function
Biological process
A
B
Cellular componentsC
Figure 3 Chart of biological processes and molecular functionsinherent to the identified proteins. Classification of all identifiedproteins was performed using the Protein Analysis ThroughEvolutionary Relationships (PANTHER) classification systemhttp://www.pantherdb.org. Proteins are classified by expertbiologists into families and subfamilies of shared function, which arethen categorized by molecular function (A) and biological process(B) ontology terms or in regard to the cellular components (C).
Pottiez et al. Proteome Science 2010, 8:57http://www.proteomesci.com/content/8/1/57
Page 4 of 11

whereas 1D-LC identified vimentin as a unique proteinwith 24 mass-sequenced peptides and a sequence cover-age of 56% (Figures 4A and 4B). In a shotgun approach,proteins with similar primary amino acid sequences (e.g.ezrin-radixin-moesin complex proteins) were identifiedon the basis of their specific peptides. The more abun-dant moesin was identified with 8 specific peptides,whereas radixin and ezrin were identified with only twoand one specific peptides, respectively (Figure 4C).
Evidence for the existence of a 1134-amino acidbovine vinculinIn the present study, we clearly identify vinculin with1D-LC approach. However, the bovine forms (Q2PQT6-1 and Q0VCE6) listed in UniprotKB (Figure 5A) werenot reported in the MASCOT result page (Figure 5B).Fortunately (thanks to inter-species sequence homol-ogy), the identifying result (Figure 5B) indicated that thevinculin was from human, mouse and pig (with an iden-tical cumulative Mowse score of 481 for all species). Asshown in Figure 5B, 12 mass-sequenced peptidesmatched the amino acid sequence of human vinculin(only 3 MS/MS-sequenced peptides display a low MAS-COT score, due to low-quality fragmentation spectra).
In contrast, the MASCOT submission of PFF dataset tothe NCBInr database gave a positive match (Figure 5C)for a predicted bovine vinculin (XP_001790344). The 12mass-sequenced peptides were homogeneously distribu-ted from the N-terminal to the C-terminal. This recordis derived from a genomic sequence (NW_001501727)which was annotated using the GNOMON gene predic-tion method and is supported by EST evidence. Thisexample serves as a reminder that to ensure high-qualityprotein identification, the simultaneous submission of aproteomics dataset to at least two protein databases isas important as the use of a decoy database.
DiscussionThe battle against the relentless progression of neurode-generative disease, brain tumours and brain damage is apublic health priority. Although effective drugs havebeen reported on the basis of in vivo research results,drug targeting and delivery to the brain are still consti-tute a challenge [24] one century after the discovery ofthe BBB. In fact, the BBB is often the rate-limiting factorin drug transport into the brain. Models of the BBB areof major importance in efforts to expand our under-standing of how the brain maintains its integrity and
Figure 4 Protein-level evidence of the expression of vinculin within bovine brain capillary endothelial cells. (A) A screen print from theMascot results page, showing the sequence coverage obtained for bovine vimentin. (B) A detailed overview of the MS/MS sequenced peptidesfrom bovine vimentin. (C) Sequence coverage for proteins displaying similar primary amino acid sequences: MOES_BOVIN, Moesin; RADI_BOVIN,radixin; EZRI_BOVIN, ezrin (components of the ezrin-radixin-moesin (ERM) complex). The peptides common to all sequences are highlighted inblue and the amino acid sequences which are specific for a given protein are shown in red.
Pottiez et al. Proteome Science 2010, 8:57http://www.proteomesci.com/content/8/1/57
Page 5 of 11

controls the inward and outward fluxes of endogenoussubstances and drug compounds [9]. The developmentof genomic and proteomic technologies has providedseveral means of extending our knowledge of the BBBand investigating additional routes for bypassing thisbarrier [4].Several BCEC-dedicated whole-cell or plasma mem-
brane proteomic approaches have been reported. Mosthave been comparative studies designed to detect andidentify candidate proteins which are either differentiallyexpressed in two distinct conditions [25,26], involved ina given physiological process [21,27] or expressed inresponse to a particular stimulus [14,28-31]. Very fewstudies have focused on sub-proteomes such as the pro-tein content of the plasma membrane [12] or that of thecaveolae [32]. Although this type of targeted proteomicstudy is essential for unravelling the molecular mechan-isms governing the physiology and physiopathology ofthe BBB’s endothelial cells, only small sets of protein
identities tend to be reported. Hence, large-scale deter-minations of expression profiles for a given protein classor cell compartment-related protein subset in BBB-differentiated BCECs (relative to non-brain capillaryendothelial cells) have yet to be performed in any spe-cies. The large-scale determination of BCEC proteincontents is a essential analytical step in gaining a betterunderstanding of the physiopathology of the BBB [33].In the field of BBB research, proteomic analyses of
BCECs displaying BBB features and functions oftenfocus on proteins related to the tight junction, theadherens junction, transport, drug resistance and theregulation of the latter functions [34]. Most of the afore-mentioned proteins are transmembrane proteinsanchored to the actin cytoskeleton by cytosolic proteins.The importance of the intracellular location has beenwell demonstrated [13]. In general, cytosolic proteinsare ignored - despite the fact that they are known toplay a role in many BBB functions. Our present study
Figure 5 Additional evidence for the expression of vinculin within bovine brain capillary endothelial cells. (A) A screen shot fromUniprotKB for bovine vinculin files. (B) A screen shot of the MASCOT results page following a search against the 57.7 UniprotKB database,showing the 12 sequenced peptides matching the human vinculin amino acid sequence. (C); A screen shot from the MASCOT results pageshowing the distribution of peptides over the full-length amino acid sequence of the predicted bovine vinculin (NW_001501727).
Pottiez et al. Proteome Science 2010, 8:57http://www.proteomesci.com/content/8/1/57
Page 6 of 11

provided a partial list of non-characterized cytosolicproteins with possible relevance in BBB function. Firstly,many of the identified proteins (27%) are related tometabolic processes, such as the primary metabolism ofproteins, carbohydrates, nucleobases/nucleosides/nucleo-tides, lipids, amino acids and their derivatives. Weconsider that knowledge of the BCECs’ enzymatic equip-ment constitutes a breakthrough. By way of an example,levels of nitric oxide (known to modulate BBB perme-ability) are related to the metabolism of arginine [35].Oxidative stress is also an important modulator of BBBpermeability. In the present study, we showed that 31oxidoreductase proteins are expressed by BCECs. Sec-ondly, binding proteins represent around 30% of theidentified set. Of these, 32 are known to interact withCa2+. It has been reported that both increases anddepletion of intracellular Ca2+ may result in disruptionof intercellular junctions [36]. We also detected 104nucleotide-binding proteins including 34 ribonucleopro-teins and 38 RNA-binding proteins (ribosomal proteins,heterogeneous nuclear ribonucleoproteins, splicing fac-tors, eukaryotic translation initiation factors, tRNAsynthetase, etc.). Furthermore, 73 and 30 of the identi-fied proteins are respectively ATP- and GTP-bindingproteins. Sixty-five proteins are described as havingmolecular transport activities. Thirdly, structural com-ponents account for around 20% of the proteins identi-fied: half of the latter (n = 44) are cytoskeletoncomponents or cytoskeleton-associated proteins. Inaddition to the presence of proteins like ERM com-plexes, filamins, heat shock proteins, plectin, plastin 3,alpha-actinins, cofilins, actin-capping proteins, spectrinsand tropomyosins, we report the expression of (i) junc-tion plakoglobin (gamma catenin), a cytoplasmic proteinin soluble and membrane-associated forms and (ii) Talin1, a crucial protein for reinforcement of integrin-cytoskeleton bond and which binds vinculin with highaffinity [37]. Fourthly, 45 and 37 proteins reported in thisstudy are from mitochondria and endoplasmic reticulumand which are involved not only in metabolism but alsoin cell function. One example is the tumour necrosis fac-tor receptor-associated protein 1 (TRAP-1) which pro-tects cells from oxidative stress and apoptosis [38].In fine, 293 of the identified proteins are phosphopro-
teins. Hence, Triton X-100-dependent protein extractionmay constitute a way of enriching the phosphoproteomesubset.The creation of a dedicated proteomic database is the
best way of gathering and storing proteome informationbut does require perfect sample traceability and strictcompliance with protein identification guidelines [17] inorder to avoid human error and, with a view to highthroughputs, guarantee the identity of proteins by redu-cing the false positive rate as much as possible. Likewise,
the repeatability of protein identifications (at least triplemass measurement of the same spot) must be carefullychecked and not postponed within the database to assurethe latter’s clarity and avoid obstruction (especially in thecase of publicly available databases). Due to the inherentdrawbacks of each analytical technique, the use of severaldifferent approaches is the best way of ensuring thebroadest possible determination of proteins from a givenproteome. The recent development of commerciallyavailable integrated solutions for high-throughput proteinidentification (combining bio-informatics tools and auto-mated sample handling with one or several mass spectro-meters) constitutes a true source of progress; it savestime, reduces the number of errors, increases the analyti-cal throughput, centralizes the proteomic data andenables more efficient comparison of datasets. Neverthe-less, most in-house 2-DE, 1D-LC or 2D-LC databases arenot publicly available (for various reasons). As stated in arecent review article [39,40], this situation can easily beresolved by public, community-based solutions for thelong-term storage, management, sharing and comparisonof proteomic data, such as MIAPEGelDB [41], theWorld-2DPAGE repository [42], PRIDE [43,44], GPMDB[45], Peptideatlas [46] and PrestOMIC [47]. However, webelieve that a number of limitations remain.The expansion of the LC-MS proteomic data storage
is significantly greater than that of the 2-DE proteomicdata. We believe that this can be explained by severalfactors. Firstly, shotgun strategies are remarkably auto-mated and powerful and clearly increase the overall datathroughput compared with 2-DE gel. Secondly, the web-submission process in the proteomic repositories ofLC-MS proteomic data is now automatized, convenientand secure (mainly thanks to the use of converters, suchas the PRIDE converter). Thirdly, web submission of2D-PAGE proteomic data is still a manual, fastidious,time-consuming step and is prone to human error. Ittherefore requires more preparation steps (for the 2-DEgel pictures, spot location data, MS data, MS proteinidentification data, etc.); this situation clearly weakensthe commitment to communal sharing and promptsresearchers to overuse shotgun approaches.The diversity of MS file formats is now handled well
by almost all proteomic data repositories, although someproprietary file formats developed by MS manufacturersare not yet supported. Therefore, proteomic data can besubmitted over the web via protein identification resultfiles, such as Mascot .dat files and SEQUEST result files.However, whereas the MS/MS files used to create thePFF are fully supported, the files corresponding to pro-tein identifications based on PMF or combined PMF/PFF protocols are not supported and the automaticweb-submission of the latter two files types is still notpossible. Overall, these are probably the main limiting
Pottiez et al. Proteome Science 2010, 8:57http://www.proteomesci.com/content/8/1/57
Page 7 of 11
factors on the expansion of public submission of 2-DEproteomic datasets. We have contacted Dr Juan AntonioVizcaíno in the PRIDE group with a view to achievingthe parsing of PMF and combined PMF/PFF Mascotdata files from 2-DE experiments.Protein databases are now so large that syntactic errors
are now acknowledged to be one of the reasons forabsent or false protein identifications. For example,bovine vinculin is reported in UniprotKB under twoaccession numbers Q2PQT6 and Q0VCE6 with 240 and80 amino acids respectively. However, unmatured vincu-lin displays an average of 1134 amino acids for isoform-1and 1066 for isoform-2 from distinct species (human,mouse, rat and pig). The NCBInr database reports abovine vinculin sequence (NW_001501727) derived froma gene prediction process. Hence, on the basis of NCBInrdatabase and our LC-MS/MS data, we identified a 1134-amino acid bovine vinculin; this shows that vinculin isexpressed in BBCECs in a form similar to those reportedin mammals. This type of de novo sequencing informa-tion (i) provides direct evidence of the existence of listedproteins in a given cell type in a given species, (ii) enablesthe correction of certain mistakes reported in proteindatabases (e.g. bovine vinculin) and (iii) can confirm pre-dictions generated by genome annotation methods.Vimentin identification is a classic example of the
technological bias inherent in each proteomic strategy.Whereas 2-DE is able to distinguish between severalvimentin isoforms (resulting from post-translationalmodifications), 1D-LC identifies only one protein.Vimentin is one of the most prominent phosphoproteinsin various mesenchymal cells in which phosphorylationis enhanced during cell division [48], when vimentinfilaments are significantly reorganized. Phosphorylationalso determines the assembly dynamics of vimentinintermediate filaments [49]. Vimentin is also subject toacetylation. In all, more than 50 isoforms are listed inthe protein databases. Consequently, vimentin cannot besimply considered as the single protein reported by 1D-LC. The 1D-LC identification of proteins with very simi-lar primary amino-acid sequences is far from perfectbecause it is based on the PFF corresponding to pro-tein-specific peptides. This is known as the proteininterference problem [50] and, unfortunately, is stillignored in too many cases. For soluble proteins > 20kDa, the PMF obtained from 2-DE is more likely tounambiguously distinguish between paralogous proteins.Ultimately, combined PFF/PMF datasets are more discri-minant and have a greater certainty of identificationbecause they are derived from in-gel separated proteins.
ConclusionsOur combination of 2-DE and 1D-LC approachesenabled the first ever identification of about 430 Triton
X-100-soluble proteins (see Additional File 3) fromBBCECs displaying BBB characteristics. The informationon these protein identifications is now stored in in-house databases and will be soon shared through thePRIDE database for convenient comparison with proteo-mic datasets from non-brain vascular endothelial cells.Due to the extraction conditions, fewer than 5% of theproteins corresponded to membrane-associated proteins.More than 75% of the identified proteins display bind-ing, catalytic or structural functions. Most identifiedproteins were involved in metabolic and cellular pro-cesses but transport and cell-cell communication pro-cess accounted for almost 25% of the identified species.The present study also emphasized the advantage ofinter-species sequence homology comparisons for pro-tein identification in non-completely sequenced gen-omes and highlighted the drifts and drawbacksgenerated by the rapid, gel-free proteomic methods(which nevertheless provide most of today’s data). In theabsence of a physiological, human in vitro BBB model,the proteomics expression profile of BBCECs displayingBBB properties is the first step towards the creation ofan anti-BBB antibody library which will greatly facilitatelarge-scale, array-based screening of protein expression.
MethodsMaterialsHeat-inactivated calf serum and horse serum werebought from Hyclone Laboratories (Logan, UT, USA).Glutamine and gentamycin were purchased from Bio-chrom AG (Berlin, Germany). Serum, basic fibroblastgrowth factor and Dulbecco’s Modified Eagle’s Medium(DMEM) were from GIBCO (Invitrogen Corporation,Carlsbad, CA, USA). Six-well plates and Transwellinserts were from Corning Inc. (New York, NY, USA).The duracryl/bis-acrylamide solution was from GenomicSolution (Proteomic Solutions, Saint-Marcel, France).Immobilized pH gradient-ready strips were from GEHealthcare (Amersham Bioscience, Orsay, France).Trypsin digestion kits for the DP Proteineer™robot andalpha-cyano-4-hydroxycinnamic acid were from BrukerDaltonik GmbH (Bremen, Germany). All other reagentswere of analytical or electrophoresis grades.
Cell culture and the blood-brain barrier modelPrimary cultures of mixed glial cells were made from new-born rat cerebral cortex, as described by Booher and Sen-senbrenner [51]. Briefly, glial cells were cultured inDMEM supplemented with 10% (v/v) heat-inactivated foe-tal calf serum, 2 mM glutamine and 50 μg/ml gentamycin.Three weeks after seeding, the glial cell cultures were sta-bilized and used for co-culture. Bovine brain capillaryendothelial cells were isolated and characterized asdescribed by Méresse et al. [52]. The BBCECs were
Pottiez et al. Proteome Science 2010, 8:57http://www.proteomesci.com/content/8/1/57
Page 8 of 11

co-cultured until confluence (12 days) with glial cells onan extracellular matrix (rat tail collagen) in DMEM sup-plemented with 10% (v/v) heat-inactivated calf serum, 10%(v/v) horse serum, 2 mM glutamine, 50 μg/ml gentamycinand 1 ng/ml basic fibroblast growth factor.
Cell harvesting and protein extractionThe endothelial cells (8 × 10⁵ cells) were harvested bycollagenase treatment (Clostridium histolyticum, Sigma,Lyon, France) [21]. Briefly, the cells were treated at 37°Cfor 40 min with 1.5 ml of a collagenase solution (0.1% w/v). The collected cell materials were rinsed 3 times inphosphate buffered saline (PBS), centrifuged 10 min at500 g. The cell pellets were lysed in 200 μl of lysis buffer[Tris/HCl 10 mM, EDTA 1 mM, Triton X-100 1% (v/v),2-mercaptoethanol 0.1% (v/v) and protease inhibitors(Roche Biomoleculars, Meylan, France)] and centrifuged(13,500 g, 4°C, 45 min). The protein content of the Tri-ton X-100 soluble and insoluble fractions was assessed[53]. The supernatants were concentrated, desalted anddelipidated by overnight acid precipitation at -20°C.
Two-dimensional gel electrophoresisAfter resolubilization in an isoelectrofocusing buffer (7M urea, 2 M thiourea, 4% (v/v) CHAPS and 2% (v/v)ampholytes), 300 μg of cytosolic proteins were subjectedto 2-DE on 24-cm length pH 4-7 IPG strips at 100,000V and in the 10-100 kDa molecular mass range. TheIPG strips were passively and actively rehydrated for 7 hand 9 h at 50 V. The pre-focusing and focusing proce-dures were carried out at 50 mA/strip in 4 steps: 200 Vfor 1 h, a gradient up to 1000 V for 1 h, a gradient upto 10000 V for 6 h and, lastly, 10000 V for 4.5 h. TheIPG strips were wiped up and successively equilibratedfor 15 min with gentle shaking in 6 M urea, 20% (v/v)glycerol, 2% (w/v) SDS, 93 mM TRIS-HCl pH 8.8 buf-fers supplemented with 20 mM DTT and 100 mMiodoacetamide and a trace of BPB, respectively. Theequilibrated strips were sealed on the top of the second-dimension duracrylamide/bis-acrylamide gel (12% T,2.6% C) with 0.5% (w/v) low-melting point agarose(Biorad, Marnes-la-Coquette, France) in SDS runningbuffer. Migration as a function of molecular weight wasperformed in the Ettan DALTsix electrophoresis unit(Amersham Bioscience) at 16 mA/gel for 30 min andthen at 32 mA/gel until the tracking dye reached theanodic end. The proteins were stained with silver nitrate[54] for image acquisition (with a freshly calibratedUmax scanner (Amersham Biosciences, Orsay, France)at 300 dpi using Labscan 3.0 software) and with colloi-dal Coomassie Brilliant Blue for protein identification byMALDI-TOF/TOF mass spectrometry.
Protein identification experiments after 2D-PAGEProtein identifications from 2-DE gels were performedusing a Proteineer™workflow from Bruker DaltonikGmbH. Colloidal Coomassie-blue-stained spots wereexcised from gels with a spot picker (the Proteineer™-spII) equipped with a 2 mm needle and placed into 96-well microtitre plates. In-gel digestion and sample pre-paration for MALDI analysis were performed accordingto the manufacturer’s instructions using a digester/spot-ter robot (the Proteineer™dp) and tryptic digest kits (theDP 384 standard kit from Bruker Daltonik). Briefly, afterdestaining of the gel plugs with 10 mM ammoniumbicarbonate and 50% acetonitrile in 10 mM ammoniumbicarbonate, protein spots were digested essentiallyaccording to Shevshenko et al., 1996 [54]. Peptide wereextracted with acetonitrile: 0.1% TFA-acidified water(1:1) and then mixed with an a-cyano-4-hydroxycin-namic acid matrix (0.3 mg/ml in acetone:ethanol, 3:6 v/v) on the MALDI target plate (AnchorChip™, BrukerDaltonics). The molecular mass measurements wereperformed in automatic mode using FlexControl™ 2.2software on an Ultraflex™ II TOF/TOF instrument andin reflectron mode for MALDI-TOF PMF or LIFTmode for MALDI-TOF/TOF PFF. External calibrationover the 1000-3500 mass range was performed using the[M+H]+ monoisotopic ions of bradykinin 1-7, angioten-sin I, angiotensin II, substance P, bombesin and adreno-corticotropic hormone (clips 1-17 and clips 18-39) froma peptide calibration standard kit (Bruker Daltonik).Briefly, a 25 kV accelerating voltage, a 26.3 kV reflectorvoltage and a 160 ns pulsed ion extraction were used toobtain the MS spectrum. Each spectrum was producedby accumulating data from 500 laser shots. Two precur-sor ions per sample at most were chosen for LIFT-TOF/TOF MS/MS analysis. Precursor ions were acceleratedto 8 kV and selected in a timed ion gate. Metastableions generated by laser-induced decomposition (LID)were further accelerated by 19 kV in the LIFT cell andtheir masses were measured in reflectron mode. Peaklists were generated from MS and MS/MS spectra usingFlexanalysis™ 2.4 software (Bruker Daltonik). Databasesearches with Mascot 2.2 (Matrix Science Ltd, London,UK) using combined PMF and PFF datasets were per-formed in the UniProt 57.7 and NCBInr databases viaProteinScape 1.3 (Bruker Daltonik). A mass tolerance of75 ppm and 1 missing cleavage site for PMF and anMS/MS tolerance of 0.5 Da and 1 missing cleavage sitefor MS/MS searching were allowed. Variable cysteinecarbamidomethylation and methionine oxidation werealso considered. The relevance of protein identities wasjudged according to the probability-based Mowse score,calculated with p < 0.05.
Pottiez et al. Proteome Science 2010, 8:57http://www.proteomesci.com/content/8/1/57
Page 9 of 11

NanoLC-MALDI-TOF-MS/MS experimentsTriton-soluble proteins from differentiated BBCECs areextremely heterogeneous. To attenuate this phenomenon,we fractionated the samples into 5 fractions of increasingconcentration in acetonitrile (0%, 25%, 50%, 75% and100%). Following the tryptic digestion, nanoseparationswere performed on an U3000 nanoHPLC system (Dionex-LC-Packings, Sunnyvale, CA, USA). After a conventionalpre-concentration step (C18 cartridge, 300 μm, 1 mm),the peptide samples were separated on a Pepmap C18 col-umn (75 μm, 15 cm) using an acetonitrile gradient from5% to 12% over 20 minutes, 12% to 50% over 140 minutesand 50% to 70% over 15 minutes and, lastly, 15 minutes in70% of acetonitrile. The flow was set to 300 nl/min and380 fractions were automatically collected every 30 sec-onds on an AnchorChip™ MALDI target using a Protei-neer™FC fraction collector (Bruker Daltonik). 2 μl ofCHCA matrix (0.3 mg/ml in acetone:ethanol:0.1% TFA-acidified water, 3:6:1 v/v/v) were added during the collec-tion process. The MS and MS/MS mass measurementswere performed off-line using the Ultraflex™ II TOF/TOFmass spectrometer, as described above. The apparatusparameters were set to the values given above. Peptidefragmentation was driven by Warp LC software (BrukerDaltonik) according to the following parameters: signal-to-noise ratio > 15, more than 3 MS/MS by fraction if theMS signal was available, 0.15 Da of MS tolerance for peakmerge and the elimination of peaks which appears inmore than 35% of the fractions. The protein identificationwas performed as described above.
Sorting protein lists and bioinformatics resourcesThe protein lists were compared using nwCompare soft-ware [55]. All identified proteins were converted intogene names with the DAVID bioinformatics resources[56] before to be classification by the Protein AnalysisThrough Evolutionary Relationships (PANTHER) classifi-cation system. PANTHER is a unique resource that clas-sifies genes by their functions, using published scientificexperimental evidence and evolutionary relationships.Proteins are classified by expert biologists into familiesand subfamilies of shared function, which are then cate-gorized by molecular function and biological processontology terms [57,58].
Additional material
Additional File 1: Table S1. File reporting the complete gene listidentified from the 2D-PAGE experiment.
Additional File 2: Table S2. File corresponding to the complete genelist identified from the LC-MS experiment.
Additional File 3: The complete gene list extracted from PANTHERand corresponding to all identified proteins.
AcknowledgementsThis research was funded by the Ministère de la Recherche et del’Enseignement Supérieur and a grant from Oseo-Anvar. The massspectrometry facilities used for this study were funded by the EuropeanUnion (FEDER), the Fonds d’Industrialisation du Bassin Minier (FIBM), theMinistère de l’Education Nationale, de l’Enseignement Supérieur et de laRecherche and the Université d’Artois. We are also grateful to Johan Hachanifor his excellent technical assistance in the course of this work.
Author details1Univ Lille Nord de France, F-59000 Lille, France. 2UArtois, LBHE, F-62307Lens, France. 3IMPRT-IFR114, F-59000, Lille, France.
Authors’ contributionsCF designed the study and participated in its initiation and coordination,together with SDD. Cell culture was managed by GP and BD. GP and BDcarried out the 2DE-map and nanoHPLC experiments and helped draft themanuscript. YK, RC and LF participated in the study design and helped draftthe manuscript. All authors have read and approved the final manuscript.
Competing interestsThe authors declare that they have no competing interests.
Received: 22 July 2010 Accepted: 15 November 2010Published: 15 November 2010
References1. Pries AR, Kuebler WM: Normal endothelium. Handb Exp Pharmacol 2006,
1-40.2. Abbott NJ: Dynamics of CNS barriers: evolution, differentiation, and
modulation. Cell Mol Neurobiol 2005, 25:5-23.3. Ballabh P, Braun A, Nedergaard M: The blood-brain barrier: an overview:
structure, regulation, and clinical implications. Neurobiol Dis 2004, 16:1-13.4. Pottiez G, Flahaut C, Cecchelli R, Karamanos Y: Understanding the blood-
brain barrier using gene and protein expression profiling technologies.Brain Res Rev 2009, 62:83-98.
5. Abbott NJ, Ronnback L, Hansson E: Astrocyte-endothelial interactions atthe blood-brain barrier. Nat Rev Neurosci 2006, 7:41-53.
6. Haseloff RF, Blasig IE, Bauer HC, Bauer H: In search of the astrocytic factor(s) modulating blood-brain barrier functions in brain capillaryendothelial cells in vitro. Cell Mol Neurobiol 2005, 25:25-39.
7. Abbott N: Astrocyte-endothelial interactions and blood-brain barrierpermeability. J Anat 2002, 200:527.
8. Weiss N, Miller F, Cazaubon S, Couraud PO: The blood-brain barrier inbrain homeostasis and neurological diseases. Biochim Biophys Acta 2009,1788:842-857.
9. Cecchelli R, Berezowski V, Lundquist S, Culot M, Renftel M, Dehouck MP,Fenart L: Modelling of the blood-brain barrier in drug discovery anddevelopment. Nat Rev Drug Discov 2007, 6:650-661.
10. Cooray HC, Blackmore CG, Maskell L, Barrand MA: Localisation of breastcancer resistance protein in microvessel endothelium of human brain.Neuroreport 2002, 13:2059-2063.
11. Pardridge WM: Molecular biology of the blood-brain barrier. Methods MolMed 2003, 89:385-399.
12. Kamiie J, Ohtsuki S, Iwase R, Ohmine K, Katsukura Y, Yanai K, Sekine Y,Uchida Y, Ito S, Terasaki T: Quantitative atlas of membrane transporterproteins: development and application of a highly sensitivesimultaneous LC/MS/MS method combined with novel in-silico peptideselection criteria. Pharm Res 2008, 25:1469-1483.
13. Chen SH, Stins MF, Huang SH, Chen YH, Kwon-Chung KJ, Chang Y, Kim KS,Suzuki K, Jong AY: Cryptococcus neoformans induces alterations in thecytoskeleton of human brain microvascular endothelial cells. J MedMicrobiol 2003, 52:961-970.
14. Hutamekalin P, Farkas AE, Orbok A, Wilhelm I, Nagyoszi P, Veszelka S,Deli MA, Buzas K, Hunyadi-Gulyas E, Medzihradszky KF, et al: Effect ofnicotine and polyaromtic hydrocarbons on cerebral endothelial cells. CellBiol Int 2008, 32:198-209.
15. Santoni V, Molloy M, Rabilloud T: Membrane proteins and proteomics: unamour impossible? Electrophoresis 2000, 21:1054-1070.
Pottiez et al. Proteome Science 2010, 8:57http://www.proteomesci.com/content/8/1/57
Page 10 of 11

16. Dehouck MP, Meresse S, Delorme P, Fruchart JC, Cecchelli R: An easier,reproducible, and mass-production method to study the blood-brainbarrier in vitro. J Neurochem 1990, 54:1798-1801.
17. Wilkins MR, Appel RD, Van Eyk JE, Chung MC, Gorg A, Hecker M, Huber LA,Langen H, Link AJ, Paik YK, et al: Guidelines for the next 10 years ofproteomics. Proteomics 2006, 6:4-8.
18. Bradshaw RA: Revised draft guidelines for proteomic data publication.Mol Cell Proteomics 2005, 4:1223-1225.
19. Culot M, Lundquist S, Vanuxeem D, Nion S, Landry C, Delplace Y,Dehouck MP, Berezowski V, Fenart L, Cecchelli R: An in vitro blood-brainbarrier model for high throughput (HTS) toxicological screening. ToxicolIn Vitro 2008, 22:799-811.
20. Gosselet F, Candela P, Sevin E, Berezowski V, Cecchelli R, Fenart L:Transcriptional profiles of receptors and transporters involved in braincholesterol homeostasis at the blood-brain barrier: use of an in vitromodel. Brain Res 2009, 1249:34-42.
21. Pottiez G, Sevin E, Cecchelli R, Karamanos Y, Flahaut C: Actin, gelsolin andfilamin-A are dynamic actors in the cytoskeleton remodellingcontributing to the blood brain barrier phenotype. Proteomics 2009,9:1207-1219.
22. Martens L, Hermjakob H, Jones P, Adamski M, Taylor C, States D, Gevaert K,Vandekerckhove J, Apweiler R: PRIDE: the proteomics identificationsdatabase. Proteomics 2005, 5:3537-3545.
23. Barsnes H, Vizcaino JA, Eidhammer I, Martens L: PRIDE Converter: makingproteomics data-sharing easy. Nat Biotechnol 2009, 27:598-599.
24. Neuwelt E, Abbott NJ, Abrey L, Banks WA, Blakley B, Davis T, Engelhardt B,Grammas P, Nedergaard M, Nutt J, et al: Strategies to advancetranslational research into brain barriers. Lancet Neurol 2008, 7:84-96.
25. Alt C, Duvefelt K, Franzen B, Yang Y, Engelhardt B: Gene and proteinexpression profiling of the microvascular compartment in experimentalautoimmune encephalomyelitis in C57Bl/6 and SJL mice. Brain Pathol2005, 15:1-16.
26. Lu L, Yang PY, Rui Y, Kang H, Zhang J, Zhang JP, Feng WH: Comparativeproteome analysis of rat brain and coronary microvascular endothelialcells. Physiol Res 2007, 56:159-168.
27. Haseloff RF, Krause E, Bigl M, Mikoteit K, Stanimirovic D, Blasig IE:Differential protein expression in brain capillary endothelial cellsinduced by hypoxia and posthypoxic reoxygenation. Proteomics 2006,6:1803-1809.
28. Franzen B, Duvefelt K, Jonsson C, Engelhardt B, Ottervald J, Wickman M,Yang Y, Schuppe-Koistinen I: Gene and protein expression profiling ofhuman cerebral endothelial cells activated with tumor necrosis factor-alpha. Mol Brain Res 2003, 115:130-146.
29. Haqqani AS, Kelly J, Baumann E, Haseloff RF, Blasig IE, Stanimirovic DB:Protein markers of ischemic insult in brain endothelial cells identifiedusing 2 D gel electrophoresis and ICAT-based quantitative proteomics. JProteome Res 2007, 6:226-239.
30. Minagar A, Alexander JS, Kelley RE, Harper M, Jennings MH: Proteomicanalysis of human cerebral endothelial cells activated by glutamate/MK-801: significance in ischemic stroke injury. J Mol Neurosci 2009,38:182-192.
31. Alexander JS, Minagar A, Harper M, Robinson-Jackson S, Jennings M,Smith SJ: Proteomic analysis of human cerebral endothelial cellsactivated by multiple sclerosis serum and IFNbeta-1b. J Mol Neurosci2007, 32:169-178.
32. Sprenger RR, Horrevoets AJ: Proteomic study of caveolae and raftsisolated from human endothelial cells. Methods Mol Biol 2007,357:199-213.
33. Hamacher M, Meyer HE: HUPO Brain Proteome Project: aims and needsin proteomics. Expert Rev Proteomics 2005, 2:1-3.
34. Cardoso FL, Brites D, Brito MA: Looking at the blood-brain barrier:molecular anatomy and possible investigation approaches. Brain Res Rev64:328-363.
35. Daff S: NO synthase: structures and mechanisms. Nitric Oxide 23:1-11.36. Persidsky Y, Ramirez SH, Haorah J, Kanmogne GD: Blood-brain barrier:
structural components and function under physiologic and pathologicconditions. J Neuroimmune Pharmacol 2006, 1:223-236.
37. Giannone G, Jiang G, Sutton DH, Critchley DR, Sheetz MP: Talin1 is criticalfor force-dependent reinforcement of initial integrin-cytoskeleton bondsbut not tyrosine kinase activation. J Cell Biol 2003, 163:409-419.
38. Landriscina M, Laudiero G, Maddalena F, Amoroso MR, Piscazzi A,Cozzolino F, Monti M, Garbi C, Fersini A, Pucci P, Esposito F: Mitochondrialchaperone Trap1 and the calcium binding protein Sorcin interact andprotect cells against apoptosis induced by antiblastic agents. Cancer Res2010, 70:6577-6586.
39. Mead JA, Bianco L, Bessant C: Recent developments in public proteomicMS repositories and pipelines. Proteomics 2009, 9:861-881.
40. Mead JA, Shadforth IP, Bessant C: Public proteomic MS repositories andpipelines: available tools and biological applications. Proteomics 2007,7:2769-2786.
41. Robin X, Hoogland C, Appel RD, Lisacek F: MIAPEGelDB, a web-basedsubmission tool and public repository for MIAPE gel electrophoresisdocuments. J Proteomics 2008, 71:249-251.
42. Hoogland C, Mostaguir K, Appel RD, Lisacek F: The World-2DPAGEConstellation to promote and publish gel-based proteomics datathrough the ExPASy server. J Proteomics 2008, 71:245-248.
43. Jones P, Cote RG, Martens L, Quinn AF, Taylor CF, Derache W, Hermjakob H,Apweiler R: PRIDE: a public repository of protein and peptideidentifications for the proteomics community. Nucleic Acids Res 2006, 34:D659-663.
44. Vizcaino JA, Cote R, Reisinger F, J MF, Mueller M, Rameseder J,Hermjakob H, Martens L: A guide to the Proteomics IdentificationsDatabase proteomics data repository. Proteomics 2009, 9:4276-4283.
45. Craig R, Cortens JP, Beavis RC: Open source system for analyzing,validating, and storing protein identification data. J Proteome Res 2004,3:1234-1242.
46. Desiere F, Deutsch EW, King NL, Nesvizhskii AI, Mallick P, Eng J, Chen S,Eddes J, Loevenich SN, Aebersold R: The PeptideAtlas project. Nucleic AcidsRes 2006, 34:D655-658.
47. Howes CG, Foster LJ: PrestOMIC, an open source application fordissemination of proteomic datasets by individual laboratories. ProteomeSci 2007, 5:8.
48. Dephoure N, Zhou C, Villen J, Beausoleil SA, Bakalarski CE, Elledge SJ,Gygi SP: A quantitative atlas of mitotic phosphorylation. Proc Natl AcadSci USA 2008, 105:10762-10767.
49. Eriksson JE, He T, Trejo-Skalli AV, Harmala-Brasken AS, Hellman J, Chou YH,Goldman RD: Specific in vivo phosphorylation sites determine theassembly dynamics of vimentin intermediate filaments. J Cell Sci 2004,117:919-932.
50. Nesvizhskii AI, Aebersold R: Interpretation of shotgun proteomic data: theprotein inference problem. Mol Cell Proteomics 2005, 4:1419-1440.
51. Booher J, Sensenbrenner M: Growth and cultivation of dissociatedneurons and glial cells from embryonic chick, rat and human brain inflask cultures. Neurobiology 1972, 2:97-105.
52. Meresse S, Dehouck MP, Delorme P, Bensaid M, Tauber JP, Delbart C,Fruchart JC, Cecchelli R: Bovine brain endothelial cells express tightjunctions and monoamine oxidase activity in long-term culture. JNeurochem 1989, 53:1363-1371.
53. Peterson GL: A simplification of the protein assay method of Lowry et al.which is more generally applicable. Anal Biochem 1977, 83:346-356.
54. Shevchenko A, Wilm M, Vorm O, Mann M: Mass spectrometric sequencingof proteins silver-stained polyacrylamide gels. Anal Chem 1996,68:850-858.
55. Pont F, Fournie JJ: Sorting protein lists with nwCompare: a simple andfast algorithm for n-way comparison of proteomic data files. Proteomics2010, 10:1091-1094.
56. Huang da W, Sherman BT, Lempicki RA: Systematic and integrativeanalysis of large gene lists using DAVID bioinformatics resources. NatProtoc 2009, 4:44-57.
57. Thomas PD, Campbell MJ, Kejariwal A, Mi H, Karlak B, Daverman R,Diemer K, Muruganujan A, Narechania A: PANTHER: a library of proteinfamilies and subfamilies indexed by function. Genome Res 2003,13:2129-2141.
58. Mi H, Guo N, Kejariwal A, Thomas PD: PANTHER version 6: proteinsequence and function evolution data with expanded representation ofbiological pathways. Nucleic Acids Res 2007, 35:D247-252.
doi:10.1186/1477-5956-8-57Cite this article as: Pottiez et al.: A large-scale electrophoresis- andchromatography-based determination of gene expression profiles inbovine brain capillary endothelial cells after the re-induction ofblood-brain barrier properties. Proteome Science 2010 8:57.
Pottiez et al. Proteome Science 2010, 8:57http://www.proteomesci.com/content/8/1/57
Page 11 of 11