RESEARCH ON LATERAL STABILITY OF FOUR HUB- …s2is.org/Issues/v8/n3/papers/paper21.pdf · RESEARCH...
21
INTERNATIONAL JOURNAL ON SMART SENSING AND INTELLIGENT SYSTEMS VOL. 8, NO. 3, SEPTEMBER 2015 1855 RESEARCH ON LATERAL STABILITY OF FOUR HUB- MOTOR-IN-WHEELS DRIVE ELECTRIC VEHICLE Biao Jin, Chuanyang Sun and Xin Zhang School of Mechanical, Electronic and Control Engineering Beijing Jiaotong University Beijing, China Emails: [email protected] Submitted: Apr. 3, 2015 Accepted: July 15, 2015 Published: Sep. 1, 2015 Abstract- This paper focuses on the problem of lateral stability of four hub-motor-in-wheels drive electric vehicle, 7 DOF (degrees of freedom) vehicle simulation model which is verified by field test is established based on Matlab/Simulink software. On basis of simulated model, BP neural network PID torque distribution controller of lateral stability is proposed. The sideslip angle at mass center and yaw rate are selected as the control variables, and the BP neural network PID torque distribution controller is designed. The simulation result shows that proposed strategy can control the electric vehicle’s sideslip angle at mass center and yaw rate, avoid the under steer and over steer of the vehicle and improve the vehicle lateral stability. Index terms: Hub-motor-in-wheels drive, electric vehicle; lateral stability; BP neural network; PID control.
Transcript of RESEARCH ON LATERAL STABILITY OF FOUR HUB- …s2is.org/Issues/v8/n3/papers/paper21.pdf · RESEARCH...
INTERNATIONAL JOURNAL ON SMART SENSING AND INTELLIGENT SYSTEMS VOL. 8, NO. 3, SEPTEMBER 2015
1855
RESEARCH ON LATERAL STABILITY OF FOUR HUB-
MOTOR-IN-WHEELS DRIVE ELECTRIC VEHICLE
Biao Jin, Chuanyang Sun and Xin Zhang
School of Mechanical, Electronic and Control Engineering
Beijing Jiaotong University
Beijing, China
Emails: [email protected]
Submitted: Apr. 3, 2015 Accepted: July 15, 2015 Published: Sep. 1, 2015
Abstract- This paper focuses on the problem of lateral stability of four hub-motor-in-wheels drive
electric vehicle, 7 DOF (degrees of freedom) vehicle simulation model which is verified by field test is
established based on Matlab/Simulink software. On basis of simulated model, BP neural network PID
torque distribution controller of lateral stability is proposed. The sideslip angle at mass center and yaw
rate are selected as the control variables, and the BP neural network PID torque distribution controller
is designed. The simulation result shows that proposed strategy can control the electric vehicle’s
sideslip angle at mass center and yaw rate, avoid the under steer and over steer of the vehicle and
improve the vehicle lateral stability.
Index terms: Hub-motor-in-wheels drive, electric vehicle; lateral stability; BP neural network; PID control.
Biao Jin, Chuanyang Sun and Xin Zhang, RESEARCH ON LATERAL STABILITY OF FOUR HUB-MOTOR-IN-WHEELS DRIVE ELECTRIC VEHICLE
1856
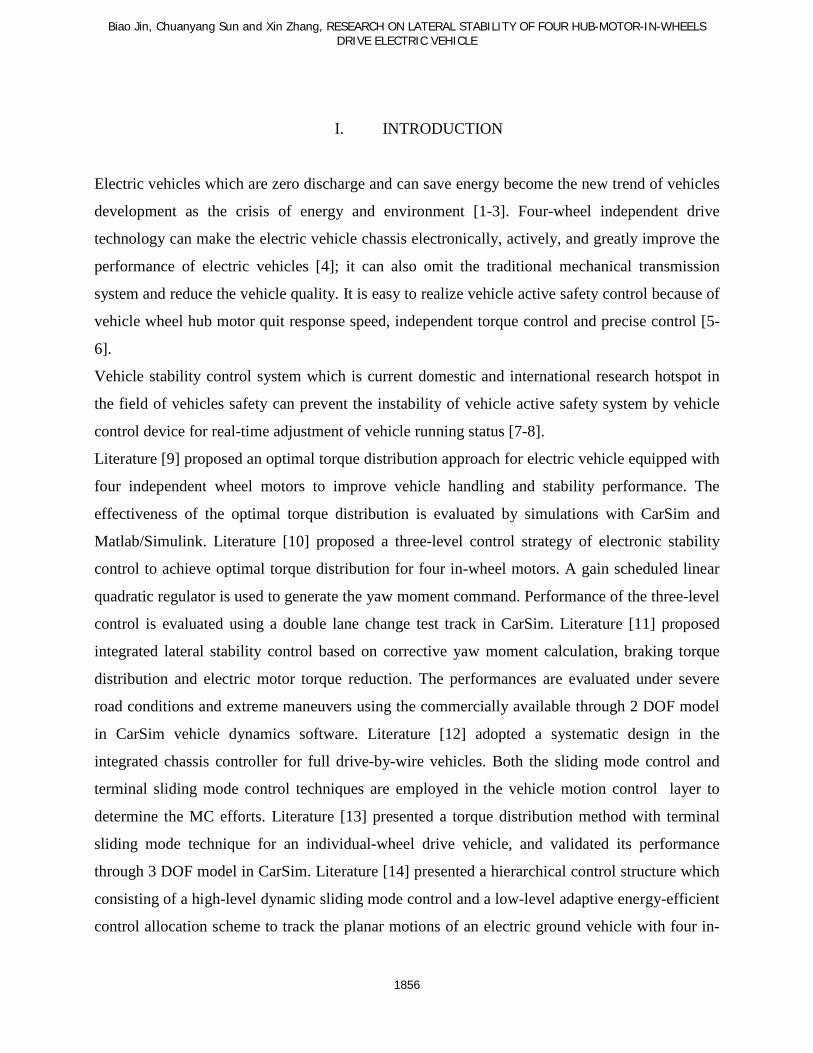
I. INTRODUCTION
Electric vehicles which are zero discharge and can save energy become the new trend of vehicles
development as the crisis of energy and environment [1-3]. Four-wheel independent drive
technology can make the electric vehicle chassis electronically, actively, and greatly improve the
performance of electric vehicles [4]; it can also omit the traditional mechanical transmission
system and reduce the vehicle quality. It is easy to realize vehicle active safety control because of
vehicle wheel hub motor quit response speed, independent torque control and precise control [5-
6].
Vehicle stability control system which is current domestic and international research hotspot in
the field of vehicles safety can prevent the instability of vehicle active safety system by vehicle
control device for real-time adjustment of vehicle running status [7-8].
Literature [9] proposed an optimal torque distribution approach for electric vehicle equipped with
four independent wheel motors to improve vehicle handling and stability performance. The
effectiveness of the optimal torque distribution is evaluated by simulations with CarSim and
Matlab/Simulink. Literature [10] proposed a three-level control strategy of electronic stability
control to achieve optimal torque distribution for four in-wheel motors. A gain scheduled linear
quadratic regulator is used to generate the yaw moment command. Performance of the three-level
control is evaluated using a double lane change test track in CarSim. Literature [11] proposed
integrated lateral stability control based on corrective yaw moment calculation, braking torque
distribution and electric motor torque reduction. The performances are evaluated under severe
road conditions and extreme maneuvers using the commercially available through 2 DOF model
in CarSim vehicle dynamics software. Literature [12] adopted a systematic design in the
integrated chassis controller for full drive-by-wire vehicles. Both the sliding mode control and
terminal sliding mode control techniques are employed in the vehicle motion control layer to
determine the MC efforts. Literature [13] presented a torque distribution method with terminal
sliding mode technique for an individual-wheel drive vehicle, and validated its performance
through 3 DOF model in CarSim. Literature [14] presented a hierarchical control structure which
consisting of a high-level dynamic sliding mode control and a low-level adaptive energy-efficient
control allocation scheme to track the planar motions of an electric ground vehicle with four in-
INTERNATIONAL JOURNAL ON SMART SENSING AND INTELLIGENT SYSTEMS VOL. 8, NO. 3, SEPTEMBER 2015
1857
wheel motors. Literature [15] estimated the lateral stability region of the vehicle related to
steering based on the built-nonlinear vehicle dynamic model by using Lyapunov and designed a
controller allocating the drive torque in terms of the vertical load and slip rate of the four wheels.
This paper selected the developed four-wheel drive electric vehicle as the research object and
established 7 DOF of four-wheel independent drive electric vehicle simulation platform based on
Matlab/Simulink software and designed the BP neural network PID controller torque distribution
by selecting the nominal side slip angle and nominal yaw rate based on linear 2 DOF of vehicle
model as the control variables, and then realized the lateral stability control of four-wheel
independent drive electric vehicle based on four wheel drive/brake control.
II. ELECTRIC VEHICLE SIMULATION PLATFORM ESTABLISHMENT
a. Electric vehicle dynamics model equations
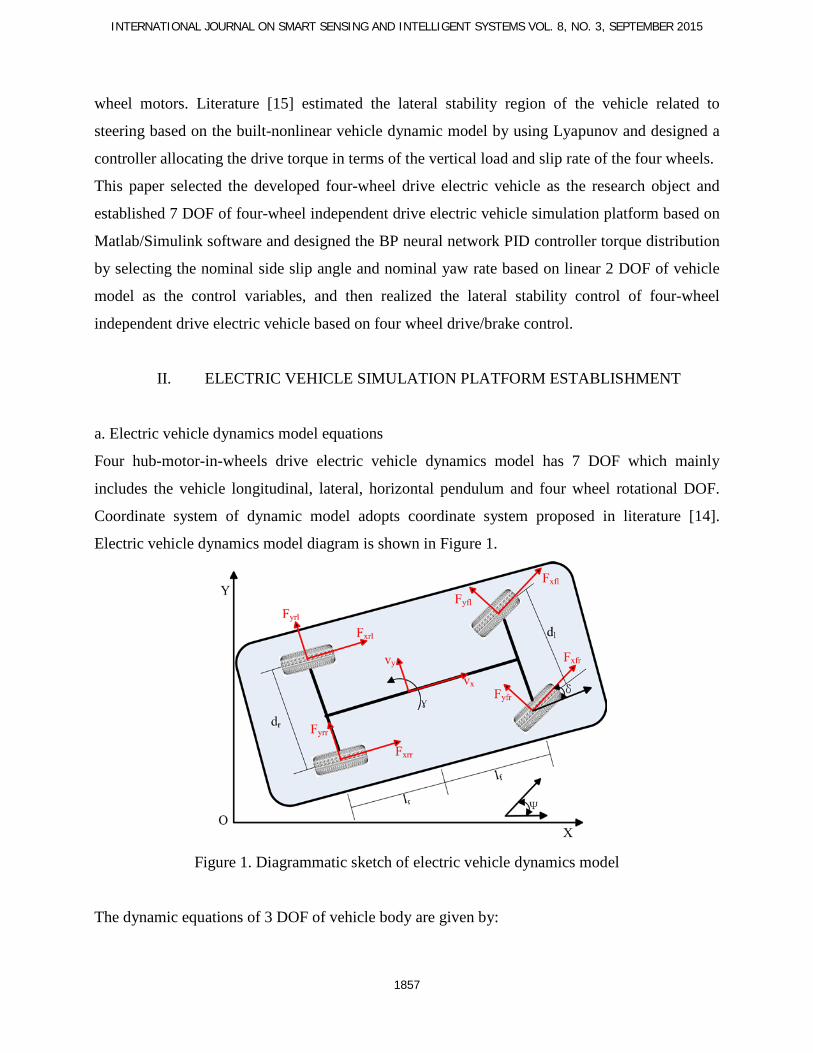
Four hub-motor-in-wheels drive electric vehicle dynamics model has 7 DOF which mainly
includes the vehicle longitudinal, lateral, horizontal pendulum and four wheel rotational DOF.
Coordinate system of dynamic model adopts coordinate system proposed in literature [14].
Electric vehicle dynamics model diagram is shown in Figure 1.
Figure 1. Diagrammatic sketch of electric vehicle dynamics model
The dynamic equations of 3 DOF of vehicle body are given by:

Biao Jin, Chuanyang Sun and Xin Zhang, RESEARCH ON LATERAL STABILITY OF FOUR HUB-MOTOR-IN-WHEELS DRIVE ELECTRIC VEHICLE
1858
xrrxrlyfryflxfrxflyx FFFFFFvvM ++⋅−⋅−⋅+⋅=
⋅−⋅
δδδδγ sinsincoscos (1)
yrryxrlyfryflxfrxflxy FFFFFFvvM ++⋅+⋅+⋅+⋅=
⋅+⋅
δδδδγ coscossinsin (2)
( ) ( )( ) ( )yrryrlryfryflxfrxflf
xrrxrlryfryflxfrxflfZ
FFlFFFFl
FFdFFFFdI
+−⋅+⋅+⋅+⋅
++−+⋅−⋅+⋅+⋅−=⋅⋅
δδδδ
δδδδγ
coscossinsin
2/2/sinsincoscos (3)
where M is vehicle mass (Kg); νx is velocity component of vehicle mass center along the x axis
(m/s); vy is velocity component of vehicle mass center along the y axis (m/s); γ is yaw rate
(rad/s); Fxfl is longitudinal force on the front and left wheel of vehicle (N); Fyfl is lateral force
on the front and left wheel of vehicle (N); Fxfr is longitudinal force on the front and right wheel
of vehicle (N); Fyfr is lateral force on the front and right wheel of vehicle (N); Fxrl is
longitudinal force on the rear and left wheel of vehicle (N); Fyrl is lateral force on the rear and
left wheel of vehicle (N); Fxrr is longitudinal force on the rear and right wheel of vehicle (N);
Fyrr is lateral force on the rear and right wheel of vehicle (N); δ is steering angle of front wheel
(rad).
b. Electric vehicle simulation platform establishment
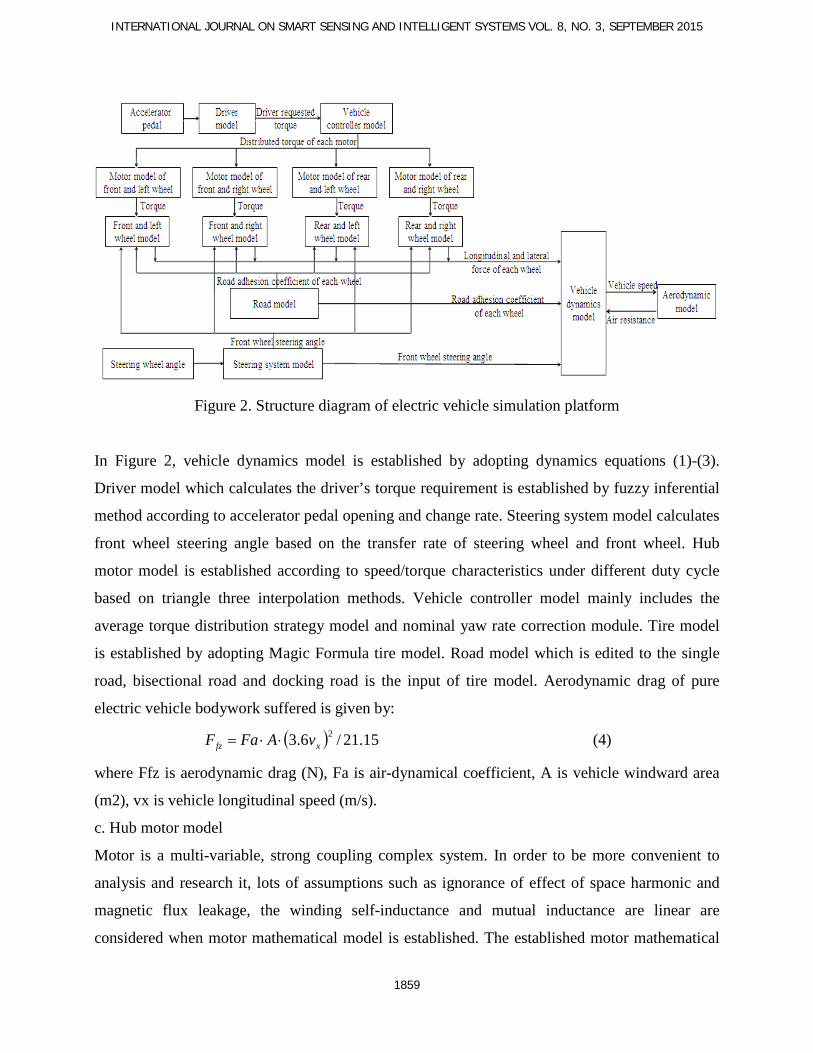
The structure diagram of the electric vehicle simulation platform is shown in Figure 2. Vehicle
model adopts module design which mainly includes vehicle dynamics model, driver model,
steering system model, motor model, tire model, road model, aerodynamic model and vehicle
controller model. In addition, vehicle controller model has linear 2 DOF of vehicle model and
torque distribution control strategy module of lateral stability.
INTERNATIONAL JOURNAL ON SMART SENSING AND INTELLIGENT SYSTEMS VOL. 8, NO. 3, SEPTEMBER 2015
1859
Figure 2. Structure diagram of electric vehicle simulation platform
In Figure 2, vehicle dynamics model is established by adopting dynamics equations (1)-(3).
Driver model which calculates the driver’s torque requirement is established by fuzzy inferential
method according to accelerator pedal opening and change rate. Steering system model calculates
front wheel steering angle based on the transfer rate of steering wheel and front wheel. Hub
motor model is established according to speed/torque characteristics under different duty cycle
based on triangle three interpolation methods. Vehicle controller model mainly includes the
average torque distribution strategy model and nominal yaw rate correction module. Tire model
is established by adopting Magic Formula tire model. Road model which is edited to the single
road, bisectional road and docking road is the input of tire model. Aerodynamic drag of pure
electric vehicle bodywork suffered is given by:
( ) 15.21/6.3 2xfz vAFaF ⋅⋅= (4)
where Ffz is aerodynamic drag (N), Fa is air-dynamical coefficient, A is vehicle windward area
(m2), vx is vehicle longitudinal speed (m/s).
c. Hub motor model
Motor is a multi-variable, strong coupling complex system. In order to be more convenient to
analysis and research it, lots of assumptions such as ignorance of effect of space harmonic and
magnetic flux leakage, the winding self-inductance and mutual inductance are linear are
considered when motor mathematical model is established. The established motor mathematical
Biao Jin, Chuanyang Sun and Xin Zhang, RESEARCH ON LATERAL STABILITY OF FOUR HUB-MOTOR-IN-WHEELS DRIVE ELECTRIC VEHICLE
1860
model can’t express the motor characteristics accurately. On basis of developed electric rotary
drum test bench, 10 groups of torque/speed test data of hub motor are get by changing drive duty
ratio of hub motor, and 10 groups of linear fitting equation of torque/speed by fitting test data
linearly. The linear fitting equations are shown in Table 1, it is found that the maximum speed of
wheel hub motor is proportional to the drive duty ratio, and speed can reach 713rpm when the
drive duty ratio is 100%.
Table 1: Hub motor speed/torque characteristics under the different driving duty ratio
Drive duty ratio Linear fitting equations Maximum speed
(rpm)
Maximum torque
(N·m)
100% N=-7.5462×T+713.0663 713.0663 94.4931
90% N=-7.0655×T+654.3733 654.3733 92.6155
80% N=-6.4457×T+606.0129 606.0129 94.0183
70% N=-5.3829×T+519.7643 519.7643 96.5579
60% N=-4.8103×T+464.1355 464.1355 96.4871
50% N=-4.5509×T+429.6174 429.6174 94.4023
40% N=-4.0681×T+380.0443 380.0443 93.4198
30% N=-3.7878×T+292.133 292.133 77.1247
20% N=-3.638×T+213.2323 213.2323 58.612
10% N=-12.0473×T+115.1787 115.1787 9.5605
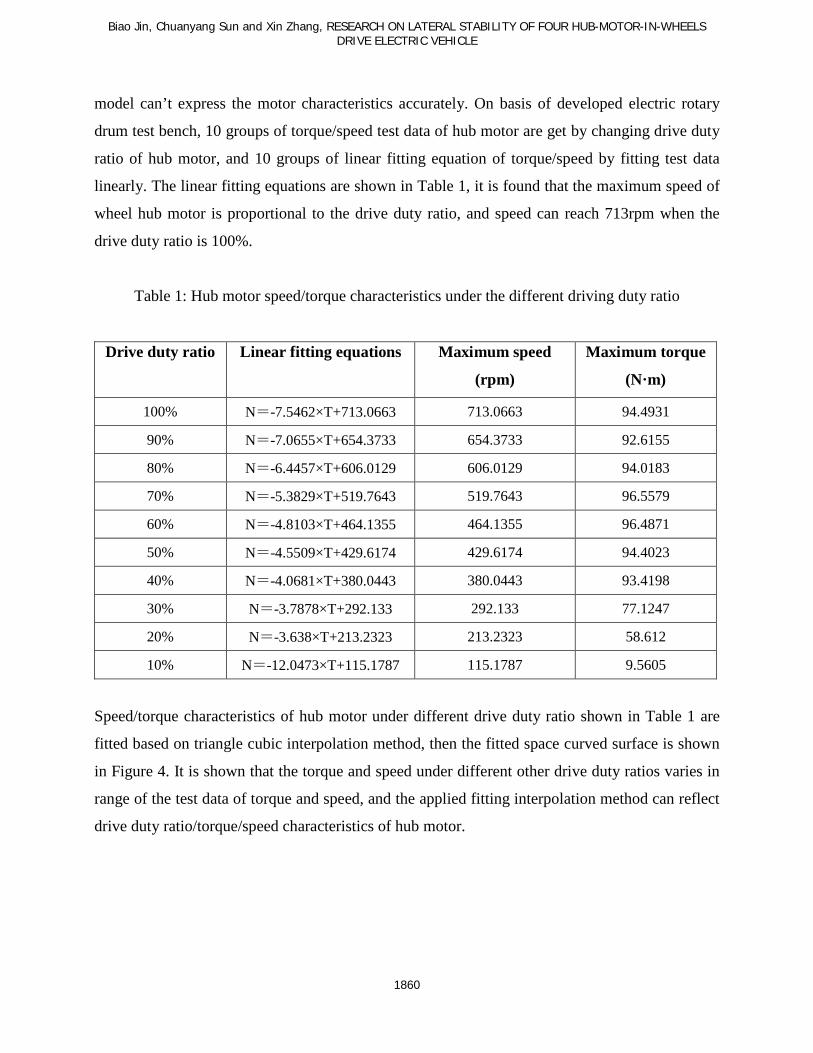
Speed/torque characteristics of hub motor under different drive duty ratio shown in Table 1 are
fitted based on triangle cubic interpolation method, then the fitted space curved surface is shown
in Figure 4. It is shown that the torque and speed under different other drive duty ratios varies in
range of the test data of torque and speed, and the applied fitting interpolation method can reflect
drive duty ratio/torque/speed characteristics of hub motor.
INTERNATIONAL JOURNAL ON SMART SENSING AND INTELLIGENT SYSTEMS VOL. 8, NO. 3, SEPTEMBER 2015
1861
Figure 3. Motor driving duty ratio/speed/torque fitting figure based on triangle cubic
III. TEXT VERIFICATION OF ELECTRIC VEHICLE SIMULATION PLATFORM
a. Test prototype vehicle
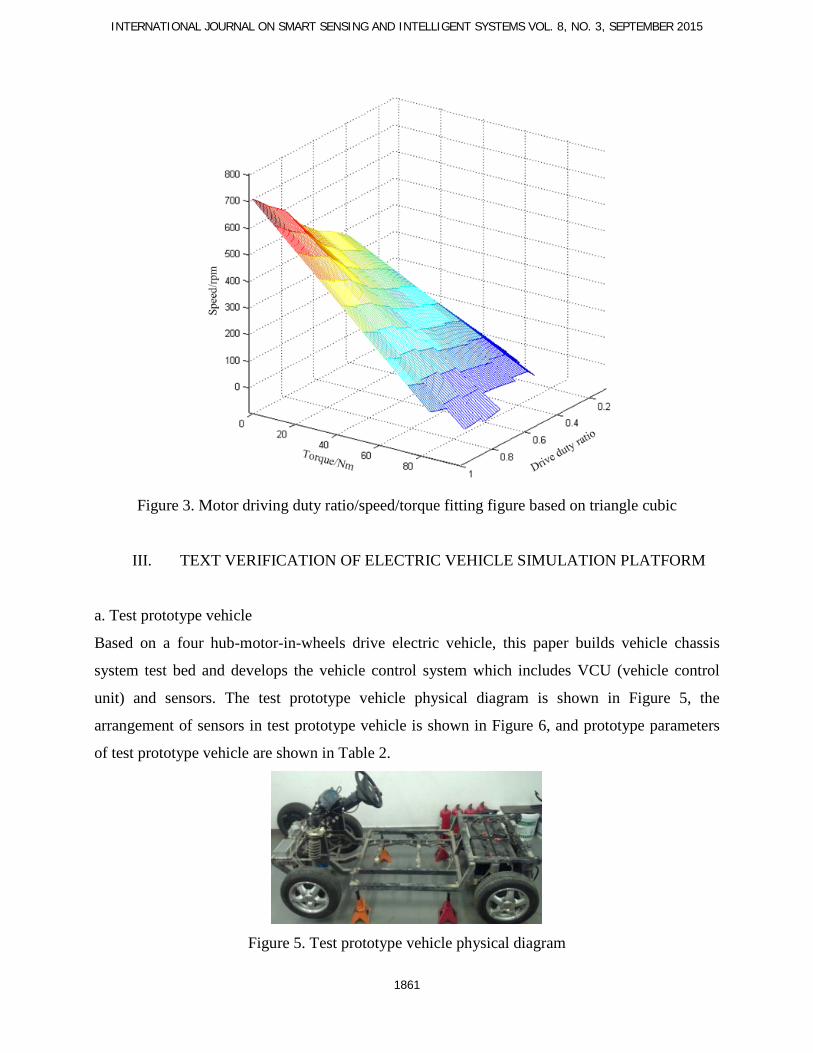
Based on a four hub-motor-in-wheels drive electric vehicle, this paper builds vehicle chassis
system test bed and develops the vehicle control system which includes VCU (vehicle control
unit) and sensors. The test prototype vehicle physical diagram is shown in Figure 5, the
arrangement of sensors in test prototype vehicle is shown in Figure 6, and prototype parameters
of test prototype vehicle are shown in Table 2.
Figure 5. Test prototype vehicle physical diagram

Biao Jin, Chuanyang Sun and Xin Zhang, RESEARCH ON LATERAL STABILITY OF FOUR HUB-MOTOR-IN-WHEELS DRIVE ELECTRIC VEHICLE
1862
Figure 6. Arrangement of sensors in test prototype vehicle
1-VCU; 2- steering wheel angle sensor; 3- pedal opening sensor; 4- longitudinal acceleration
sensor; 5-lateral acceleration sensor; 6- gear shift sensor; 7-yaw rate sensor
Table 2: Prototype parameters of test prototype vehicle
Basic parameters Value Basic parameters Value Dimensions L*W*H 2550*1350*1500mm Vehicle equipment quality 520kg
Fully loaded vehicle load 800kg Wheel base track 1085mm
Wheelbase 1635mm Maximum speed 60km/h
Steering wheel angle -540°~540° Front wheel steering angle -27°~27°
Front wheel cornering stiffness 13000 N/rad Rear wheel cornering
stiffness 15000N/rad
Centric height 0.7m
b. Test verification of electric vehicle simulation platform
The test prototype vehicle drives on the asphalt road whose tire-road friction coefficient is 0.8 in
circular motion, the pedal opening, steering wheel angle, yaw rate, longitudinal/lateral

INTERNATIONAL JOURNAL ON SMART SENSING AND INTELLIGENT SYSTEMS VOL. 8, NO. 3, SEPTEMBER 2015
1863
acceleration are obtained by sensors. Let the changing of pedal opening and steering wheel angle
of electric vehicle simulation platform to be same with the test prototype vehicles mostly, the
yaw rate, longitudinal/lateral acceleration are obtained. The accuracy of electric vehicle
simulation platform is verified by comparing the yaw rate, longitudinal/lateral acceleration of
simulation platform with them of test prototype vehicle.
In the process of verification, the changing of pedal opening of test prototype vehicle is shown as
black dotted line in Figure 7(a), the changing of pedal opening of electric vehicle simulation
platform is shown as red solid line in Figure 7(a), it is shown that electric vehicle simulation
platform can approximately simulate the changing of pedal opening of test prototype vehicle. The
steering wheel angle is 540deg when test prototype vehicle turns right. The contrast results
between yaw rates of simulation and test are shown in Figure 7(c), and the contrast results
between longitudinal/lateral acceleration of simulation and test are shown in Figure 7(d).
Figure 7(a). Accelerator pedal stroke contrast figure
Figure 7(b). Yaw rate contrast figure
Biao Jin, Chuanyang Sun and Xin Zhang, RESEARCH ON LATERAL STABILITY OF FOUR HUB-MOTOR-IN-WHEELS DRIVE ELECTRIC VEHICLE
1864
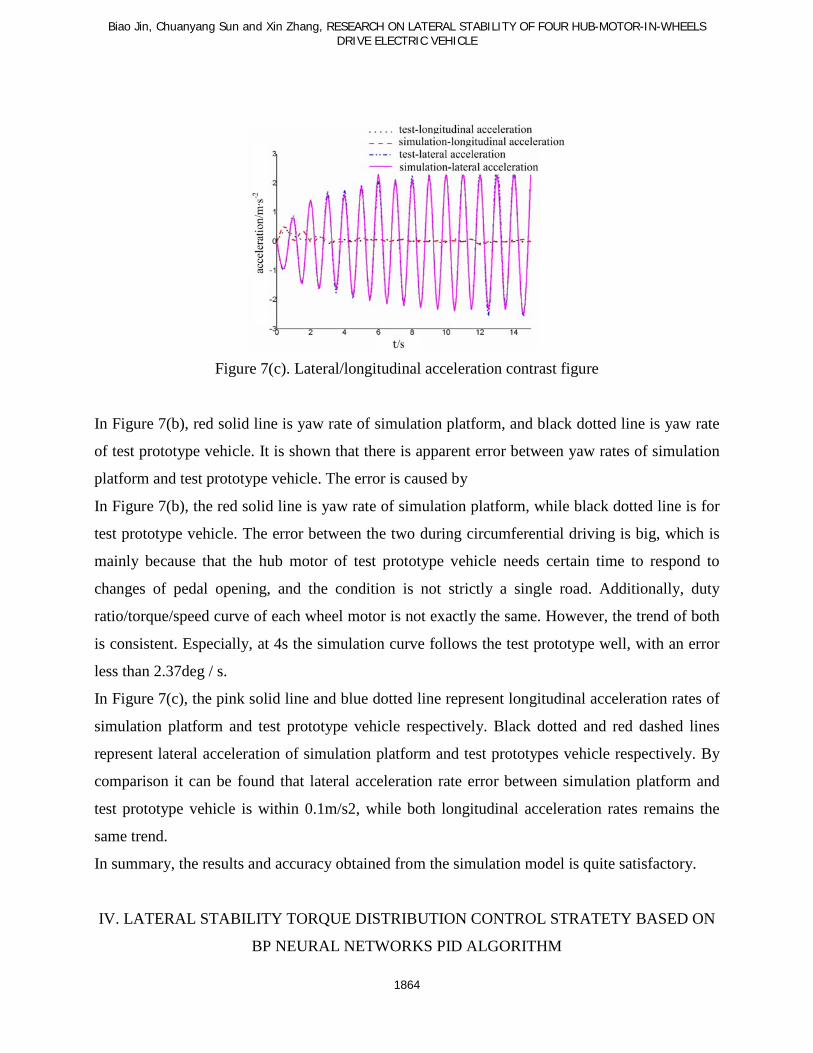
Figure 7(c). Lateral/longitudinal acceleration contrast figure
In Figure 7(b), red solid line is yaw rate of simulation platform, and black dotted line is yaw rate
of test prototype vehicle. It is shown that there is apparent error between yaw rates of simulation
platform and test prototype vehicle. The error is caused by
In Figure 7(b), the red solid line is yaw rate of simulation platform, while black dotted line is for
test prototype vehicle. The error between the two during circumferential driving is big, which is
mainly because that the hub motor of test prototype vehicle needs certain time to respond to
changes of pedal opening, and the condition is not strictly a single road. Additionally, duty
ratio/torque/speed curve of each wheel motor is not exactly the same. However, the trend of both
is consistent. Especially, at 4s the simulation curve follows the test prototype well, with an error
less than 2.37deg / s.
In Figure 7(c), the pink solid line and blue dotted line represent longitudinal acceleration rates of
simulation platform and test prototype vehicle respectively. Black dotted and red dashed lines
represent lateral acceleration of simulation platform and test prototypes vehicle respectively. By
comparison it can be found that lateral acceleration rate error between simulation platform and
test prototype vehicle is within 0.1m/s2, while both longitudinal acceleration rates remains the
same trend.
In summary, the results and accuracy obtained from the simulation model is quite satisfactory.
IV. LATERAL STABILITY TORQUE DISTRIBUTION CONTROL STRATETY BASED ON
BP NEURAL NETWORKS PID ALGORITHM
INTERNATIONAL JOURNAL ON SMART SENSING AND INTELLIGENT SYSTEMS VOL. 8, NO. 3, SEPTEMBER 2015
1865
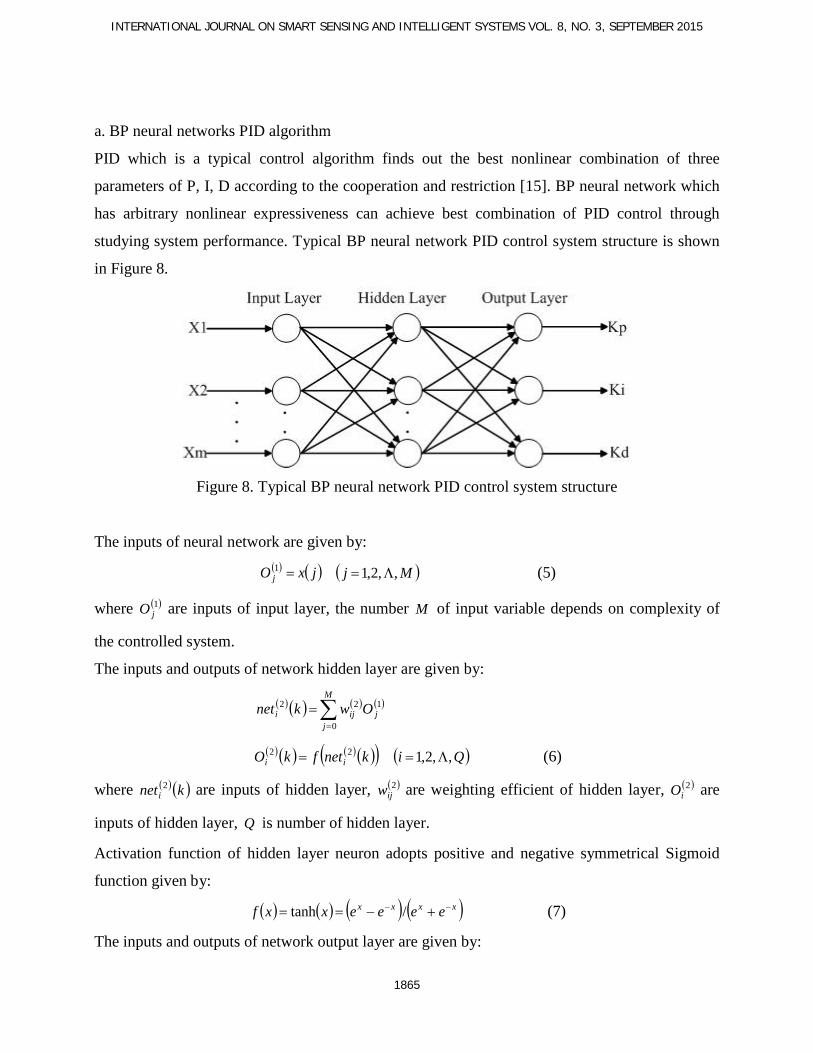
a. BP neural networks PID algorithm
PID which is a typical control algorithm finds out the best nonlinear combination of three
parameters of P, I, D according to the cooperation and restriction [15]. BP neural network which
has arbitrary nonlinear expressiveness can achieve best combination of PID control through
studying system performance. Typical BP neural network PID control system structure is shown
in Figure 8.
Figure 8. Typical BP neural network PID control system structure
The inputs of neural network are given by: ( ) ( )jxO j =1 ( )Mj ,,2,1 Λ= (5)
where ( )1jO are inputs of input layer, the number M of input variable depends on complexity of
the controlled system.
The inputs and outputs of network hidden layer are given by:
( ) ( ) ( ) ( )∑=
=M
jjiji Owknet
0
122
( ) ( ) ( ) ( )( )knetfkO ii22 = ( )Qi ,,2,1 Λ= (6)
where ( ) ( )kneti2 are inputs of hidden layer, ( )2
ijw are weighting efficient of hidden layer, ( )2iO are
inputs of hidden layer, Q is number of hidden layer.
Activation function of hidden layer neuron adopts positive and negative symmetrical Sigmoid
function given by:
( ) ( ) ( ) ( )xxxx eeeexxf −− +−== /tanh (7)
The inputs and outputs of network output layer are given by:

Biao Jin, Chuanyang Sun and Xin Zhang, RESEARCH ON LATERAL STABILITY OF FOUR HUB-MOTOR-IN-WHEELS DRIVE ELECTRIC VEHICLE
1866
( ) ( ) ( ) ( ) ( )∑=
=Q
iilii kOwknet
0
233
( ) ( ) ( ) ( )( )knetgkO ll33 = ( )3,2,1=l
( ) ( ) pkkO =31 (8)
( )( ) ikkO =32
( )( ) dkkO =33
where ( )3inet are inputs of output layer, ( )3
liw are weighting efficient of output layer, l is number
of output layer, ( )3iO are outputs of output layer which represent pk , ik and dk respectively.
Because pk , ik and dk are positive, activation function of output layer neuron adopts positive
Sigmoid function given by:
( ) ( )( ) ( )xxx eeexxg −+=+= /tanh121 (9)
b. Design of BP neural networks PID torque distribution controller
Based on above theory, the established structure diagram of torque distribution controller of four
wheel independent drive PEV lateral stability based on BP Neural Networks PID control
algorithm is shown in Figure 9.
Figure 9. Structure diagram of torque distribution controller of four wheel independent drive PEV
lateral stability
INTERNATIONAL JOURNAL ON SMART SENSING AND INTELLIGENT SYSTEMS VOL. 8, NO. 3, SEPTEMBER 2015
1867
In Figure 9, e(ω), d(e(ω))/dt, e(β) and d(e(β))/dt represent error and error rate between actual and
nominal yaw rate, error and error rate between actual and nominal side slip angle at mass center
respectively. FL-Kp, Ki, Kd, FR-Kp, Ki, Kd, LR-Kp, Ki, Kd and RR-Kp, Ki, Kd represent Kp,
Ki and Kd of front and left wheel, front and right wheel, rear and left wheel and rear and right
wheel respectively.
The control algorithm of flowchart is:
(1) BP network structure is determined, initial value of weighting coefficient of each layer is
given, learning rate and inertia coefficient are selected and k=1.
(2) The sampled error and error rate between actual and nominal yaw rate, error and error rate
between actual and nominal side slip angle at mass center are e(ω), d(e(ω))/dt, e(β) and d(e(β))/dt
respective.
(3) The inputs and outputs of neuron of each layer are calculated. The outputs of BP neural
network have 12 parameters which are Kp, Ki, Kd of 4 motor controller.
(4) The BP neural network studies and adjusts the weighting efficient ( )2ijw and ( )3
liw online. The
PID control parameters adjust adaptively.
(5) Setting K=k+1, and returning to step (1).
V. SIMULATION ANALYSIS OF TORQUE DISTRIBUTION CONTROL STRATEGY ON
LATERAL STABILITY
Based on the established 7 DOF of four hub-motor-in-wheels drive electric vehicle and designed
BP neural networks PID torque distribution controller, The error between nominal and actual yaw
rate and the error between nominal and actual side slip angle at mass center are set as control
variables. Through BP neural network PID closed-loop control, four driving conditions of step
steering, single lane, double lane and S-steering on a single road (μfl=μfr=μrl=μrr=0.5) are
simulated in order to improve lateral stability of PEV.
a. Step steering driving condition simulation
First, accelerate vehicle speed to a constant speed 10m/s. At 2s, set left front wheel steering angle
at 2 degrees, the follow response of actual yaw rate with control and without control to nominal
yaw rate under step steering driving condition is shown in Figure 10, the follow response of
Biao Jin, Chuanyang Sun and Xin Zhang, RESEARCH ON LATERAL STABILITY OF FOUR HUB-MOTOR-IN-WHEELS DRIVE ELECTRIC VEHICLE
1868
actual side slip angle at mass center with control and without control to nominal side slip angle at
mass center is shown in Figure 11.
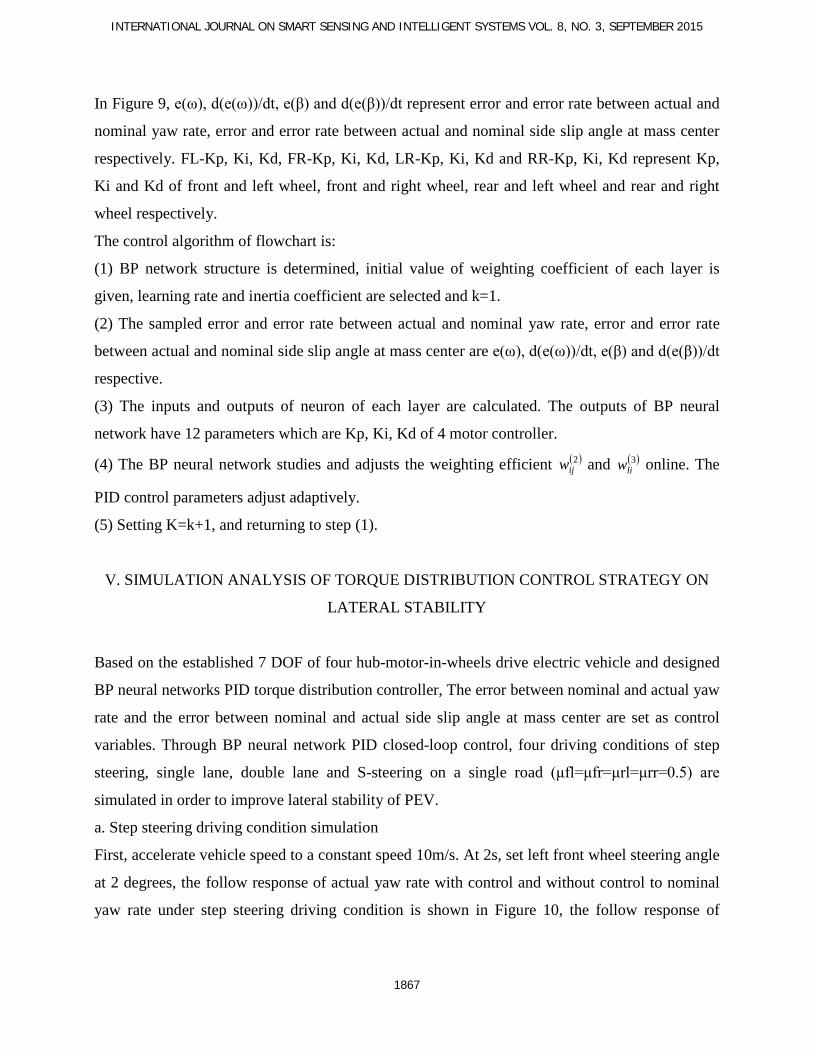
Figure 10. Follow-up response of actual yaw rate with control and without control to nominal
yaw rate under working condition of step steering
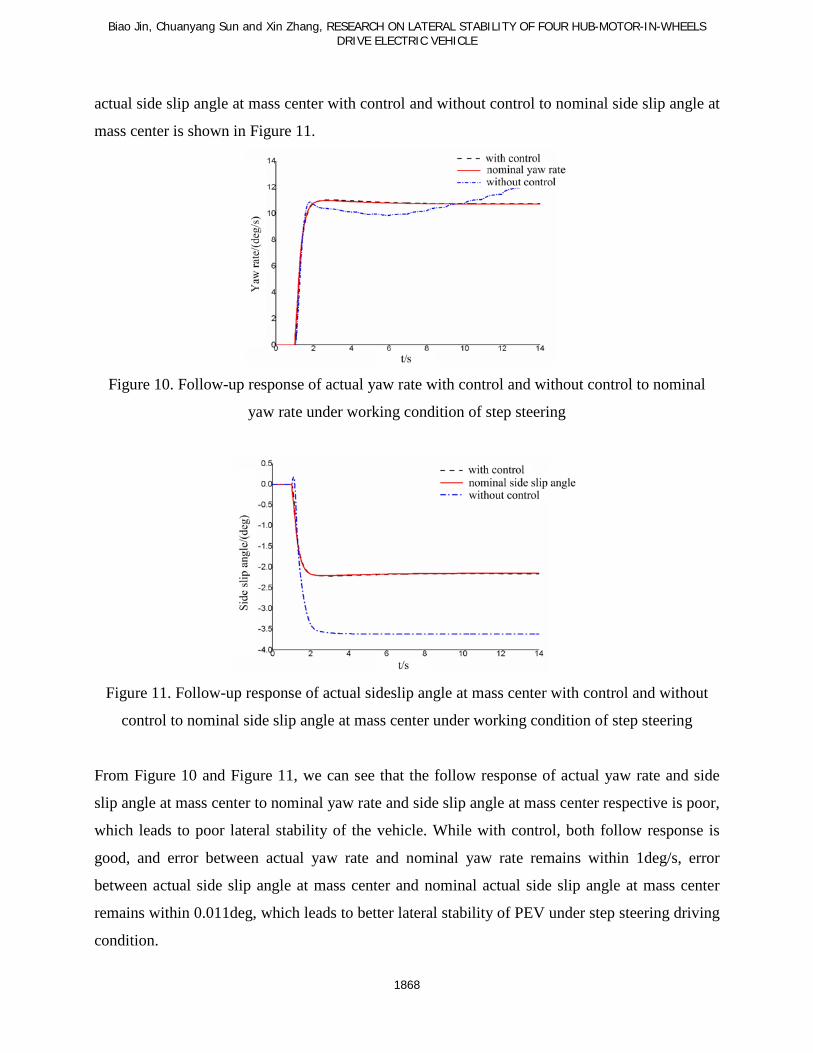
Figure 11. Follow-up response of actual sideslip angle at mass center with control and without
control to nominal side slip angle at mass center under working condition of step steering
From Figure 10 and Figure 11, we can see that the follow response of actual yaw rate and side
slip angle at mass center to nominal yaw rate and side slip angle at mass center respective is poor,
which leads to poor lateral stability of the vehicle. While with control, both follow response is
good, and error between actual yaw rate and nominal yaw rate remains within 1deg/s, error
between actual side slip angle at mass center and nominal actual side slip angle at mass center
remains within 0.011deg, which leads to better lateral stability of PEV under step steering driving
condition.
INTERNATIONAL JOURNAL ON SMART SENSING AND INTELLIGENT SYSTEMS VOL. 8, NO. 3, SEPTEMBER 2015
1869
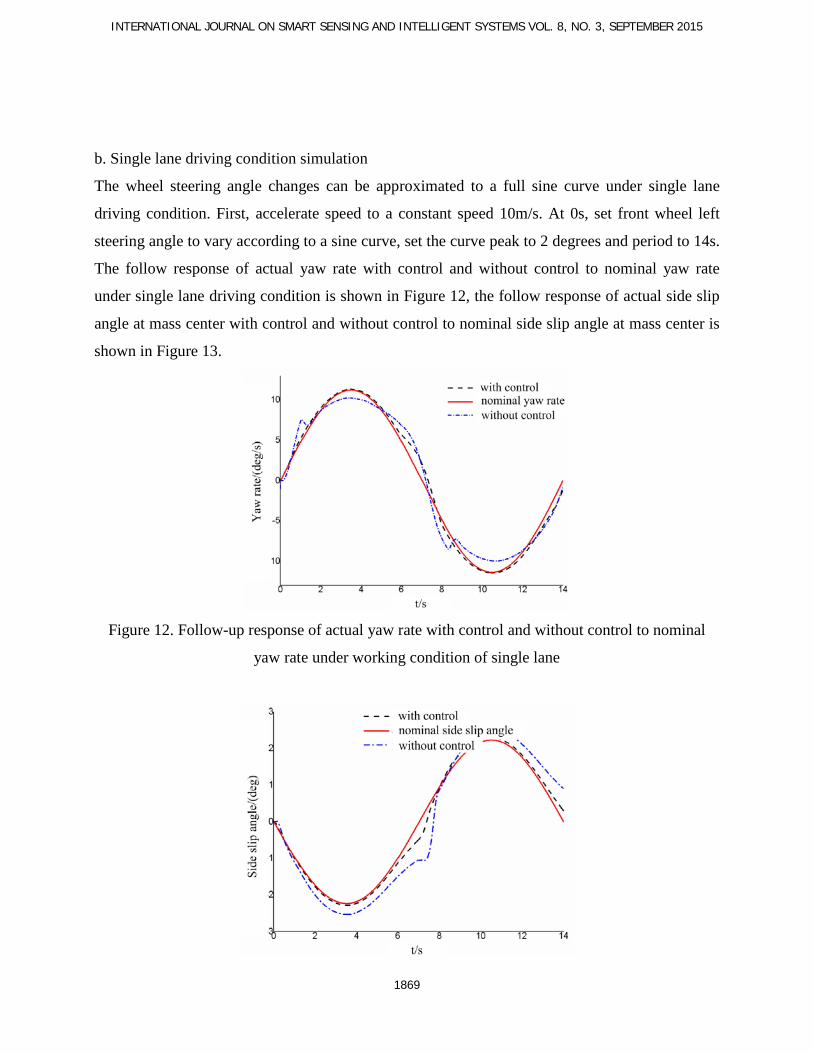
b. Single lane driving condition simulation
The wheel steering angle changes can be approximated to a full sine curve under single lane
driving condition. First, accelerate speed to a constant speed 10m/s. At 0s, set front wheel left
steering angle to vary according to a sine curve, set the curve peak to 2 degrees and period to 14s.
The follow response of actual yaw rate with control and without control to nominal yaw rate
under single lane driving condition is shown in Figure 12, the follow response of actual side slip
angle at mass center with control and without control to nominal side slip angle at mass center is
shown in Figure 13.
Figure 12. Follow-up response of actual yaw rate with control and without control to nominal
yaw rate under working condition of single lane
Biao Jin, Chuanyang Sun and Xin Zhang, RESEARCH ON LATERAL STABILITY OF FOUR HUB-MOTOR-IN-WHEELS DRIVE ELECTRIC VEHICLE
1870
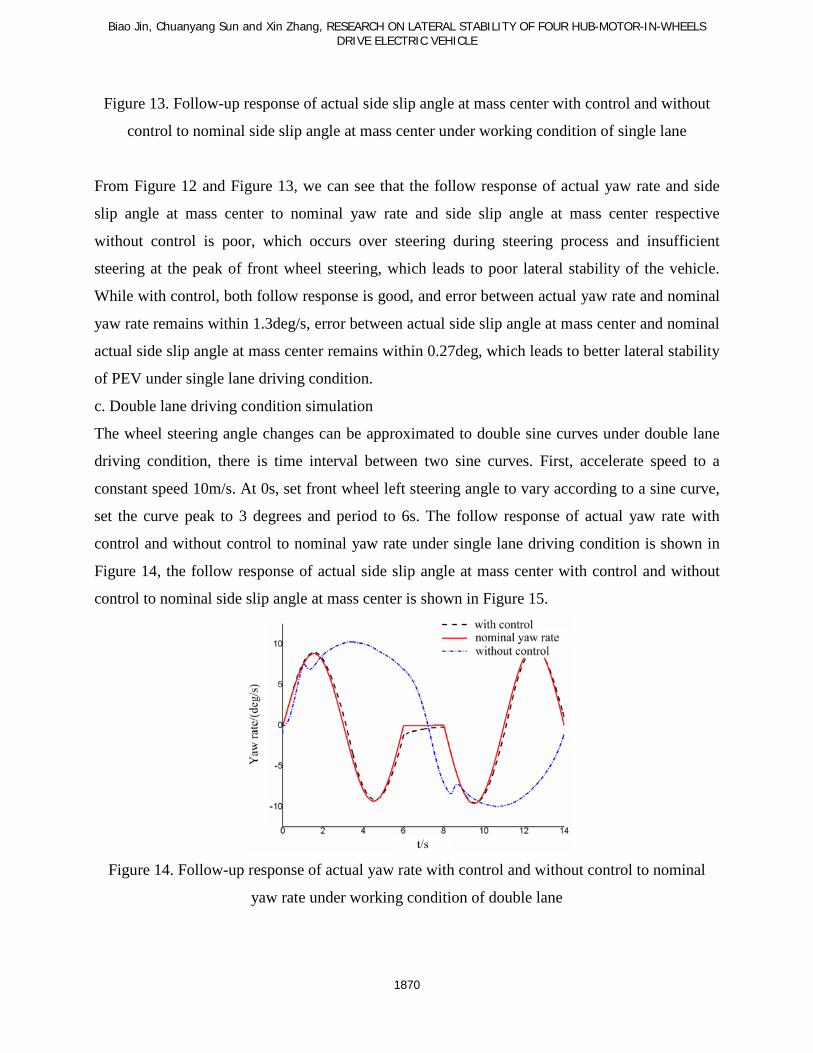
Figure 13. Follow-up response of actual side slip angle at mass center with control and without
control to nominal side slip angle at mass center under working condition of single lane
From Figure 12 and Figure 13, we can see that the follow response of actual yaw rate and side
slip angle at mass center to nominal yaw rate and side slip angle at mass center respective
without control is poor, which occurs over steering during steering process and insufficient
steering at the peak of front wheel steering, which leads to poor lateral stability of the vehicle.
While with control, both follow response is good, and error between actual yaw rate and nominal
yaw rate remains within 1.3deg/s, error between actual side slip angle at mass center and nominal
actual side slip angle at mass center remains within 0.27deg, which leads to better lateral stability
of PEV under single lane driving condition.
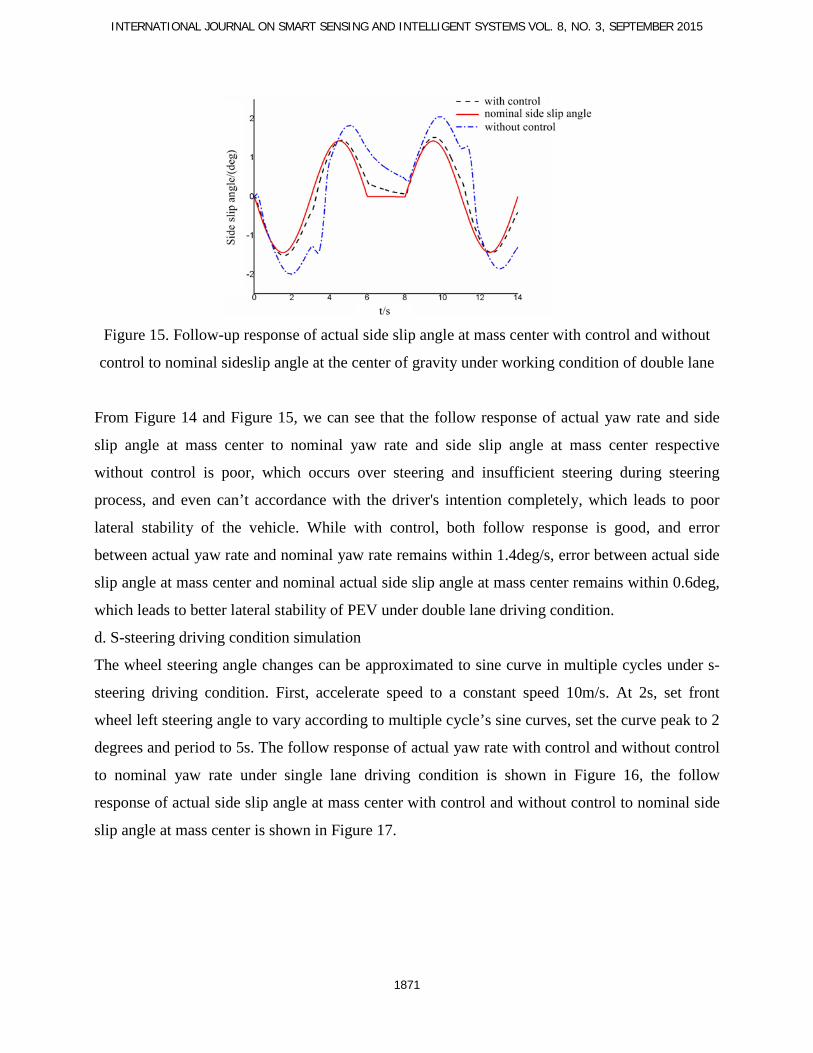
c. Double lane driving condition simulation
The wheel steering angle changes can be approximated to double sine curves under double lane
driving condition, there is time interval between two sine curves. First, accelerate speed to a
constant speed 10m/s. At 0s, set front wheel left steering angle to vary according to a sine curve,
set the curve peak to 3 degrees and period to 6s. The follow response of actual yaw rate with
control and without control to nominal yaw rate under single lane driving condition is shown in
Figure 14, the follow response of actual side slip angle at mass center with control and without
control to nominal side slip angle at mass center is shown in Figure 15.
Figure 14. Follow-up response of actual yaw rate with control and without control to nominal
yaw rate under working condition of double lane
INTERNATIONAL JOURNAL ON SMART SENSING AND INTELLIGENT SYSTEMS VOL. 8, NO. 3, SEPTEMBER 2015
1871
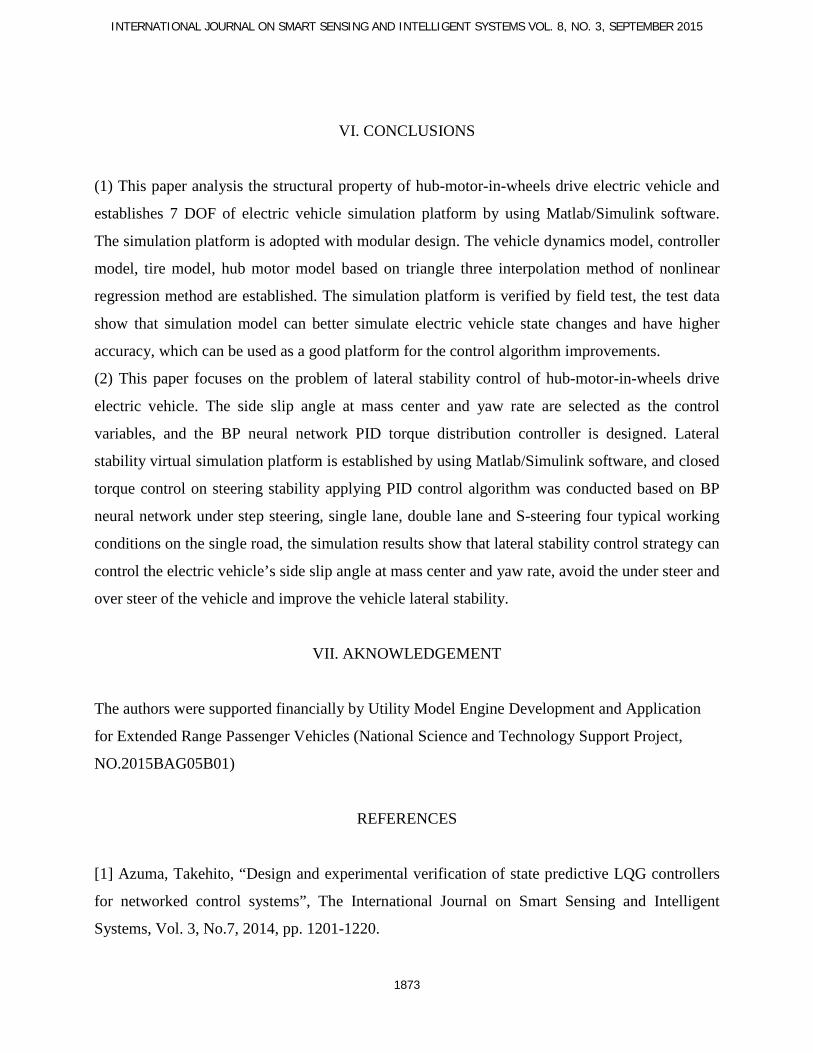
Figure 15. Follow-up response of actual side slip angle at mass center with control and without
control to nominal sideslip angle at the center of gravity under working condition of double lane
From Figure 14 and Figure 15, we can see that the follow response of actual yaw rate and side
slip angle at mass center to nominal yaw rate and side slip angle at mass center respective
without control is poor, which occurs over steering and insufficient steering during steering
process, and even can’t accordance with the driver's intention completely, which leads to poor
lateral stability of the vehicle. While with control, both follow response is good, and error
between actual yaw rate and nominal yaw rate remains within 1.4deg/s, error between actual side
slip angle at mass center and nominal actual side slip angle at mass center remains within 0.6deg,
which leads to better lateral stability of PEV under double lane driving condition.
d. S-steering driving condition simulation
The wheel steering angle changes can be approximated to sine curve in multiple cycles under s-
steering driving condition. First, accelerate speed to a constant speed 10m/s. At 2s, set front
wheel left steering angle to vary according to multiple cycle’s sine curves, set the curve peak to 2
degrees and period to 5s. The follow response of actual yaw rate with control and without control
to nominal yaw rate under single lane driving condition is shown in Figure 16, the follow
response of actual side slip angle at mass center with control and without control to nominal side
slip angle at mass center is shown in Figure 17.

Biao Jin, Chuanyang Sun and Xin Zhang, RESEARCH ON LATERAL STABILITY OF FOUR HUB-MOTOR-IN-WHEELS DRIVE ELECTRIC VEHICLE
1872
Figure 16. Follow-up response of actual yaw rate with control and without control to nominal
yaw rate under working condition of S-steering
Figure 17. Follow-up response of actual side slip angle at mass center with control and without
control to nominal side slip angle at mass center under working condition of S-steering
From Figure 16 and Figure 17, we can see that the follow response of actual yaw rate and side
slip angle at mass center to nominal yaw rate and side slip angle at mass center respective
without control is poor, which occurs over steering during steering process and insufficient
steering during at the peak of front wheel steering, which leads to poor lateral stability of the
vehicle. While with control, both follow response is good, and error between actual yaw rate and
nominal yaw rate remains within 1.4deg/s, error between actual side slip angle at mass center and
nominal actual side slip angle at mass center remains within 0.6deg, which leads to better lateral
stability of PEV under s-steering driving condition.
INTERNATIONAL JOURNAL ON SMART SENSING AND INTELLIGENT SYSTEMS VOL. 8, NO. 3, SEPTEMBER 2015
1873
VI. CONCLUSIONS
(1) This paper analysis the structural property of hub-motor-in-wheels drive electric vehicle and
establishes 7 DOF of electric vehicle simulation platform by using Matlab/Simulink software.
The simulation platform is adopted with modular design. The vehicle dynamics model, controller
model, tire model, hub motor model based on triangle three interpolation method of nonlinear
regression method are established. The simulation platform is verified by field test, the test data
show that simulation model can better simulate electric vehicle state changes and have higher
accuracy, which can be used as a good platform for the control algorithm improvements.
(2) This paper focuses on the problem of lateral stability control of hub-motor-in-wheels drive
electric vehicle. The side slip angle at mass center and yaw rate are selected as the control
variables, and the BP neural network PID torque distribution controller is designed. Lateral
stability virtual simulation platform is established by using Matlab/Simulink software, and closed
torque control on steering stability applying PID control algorithm was conducted based on BP
neural network under step steering, single lane, double lane and S-steering four typical working
conditions on the single road, the simulation results show that lateral stability control strategy can
control the electric vehicle’s side slip angle at mass center and yaw rate, avoid the under steer and
over steer of the vehicle and improve the vehicle lateral stability.
VII. AKNOWLEDGEMENT
The authors were supported financially by Utility Model Engine Development and Application
for Extended Range Passenger Vehicles (National Science and Technology Support Project,
NO.2015BAG05B01)
REFERENCES
[1] Azuma, Takehito, “Design and experimental verification of state predictive LQG controllers
for networked control systems”, The International Journal on Smart Sensing and Intelligent
Systems, Vol. 3, No.7, 2014, pp. 1201-1220.
Biao Jin, Chuanyang Sun and Xin Zhang, RESEARCH ON LATERAL STABILITY OF FOUR HUB-MOTOR-IN-WHEELS DRIVE ELECTRIC VEHICLE
1874
[2] Fallah MS, Khajepour A, Fidan B, etc., “Vehicle optimal torque vectoring using state
derivative feedback and linear matrix inequality. IEEE Transactions on Vehicular Technology”,
Vol. 62, No.4, 2013,pp.1540–1552.
[3] Tchamna, R., Youn, I. “Yaw rate and side-slip control considering vehicle longitudinal
dynamics”, International Journal of Automotive Technology, Vol.14, No.1, 2013, pp. 53−60.
[4] Yim S. “Fault-tolerant yaw moment control with steer- and brake-by-wire devices”,
International Journal of Automotive Technology, Vol.15, No.3, 2014, pp. 463−468.
[5] Suzuki Y, Kano Y, Abe M. “A study on tyre force distribution controls for full drive-by-wire
electric vehicle”, Vehicle System Dynamics, 52(Suppl. 1), 2014, pp.235–250.
[6] Chen Y, Hedrick JK, Guo K., “A novel direct yaw moment controller for in-wheel motor
electric vehicles”, Vehicle System Dynamics, Vol.51, No.6, 2013, pp.925–942.
[7] Tchamna, R., Youn, I. “Yaw rate and side-slip control considering vehicle longitudinal
dynamics”, The International Journal of Automotive Technology, Vol.14, No.1, 2013, pp. 53−60.
[8] Wang, X., Shi, S., Liu, L., etc. “Analysis of driving mode effect on vehicle stability”,
International Journal of Automotive Technology, Vol.14, No.3, 2013, pp. 363−373.
[9] Bin Li, Avesta Goodarzi, Amir Khajepour, etc. “An optimal torque distribution control
strategy for four-independent wheel drive electric vehicles”, Vehicle System Dynamics, Vol. 53,
NO.8, 2015, pp. 1172–1189.
[10] T.Ohji, S.C.Mukhopadhyay, M.Iwahara and S.Yamada, "Permanent Magnet Bearings for
Horizontal and Veryical Shaft Machines - A Comparative Study", Journal of Applied Physics,
Vol. 85, No. 8, 1999, pp 4648-4650.
[11] B.-C. Chen, C.-C. Kuo. “Electronic stability control for electric vehicle with four in-wheel
motors”, International Journal of Automotive Technology, Vol.15, No.4, 2014, pp. 573−580.
[12] M. T. Em Rler, K. Kahraman, M. Enturk., “Lateral stability control of fully electric
vehicles”, International Journal of Automotive Technology, Vol.16, No.2, 2015, pp. 317-328.
[13] Pan Song, Masayoshi Tomizuka, Changfu Zong, “A novel integrated chassis controller for
full drive-by-wire vehicles”,Vehicle System Dynamics, Vol.53, No.2, 2015,pp.215–236.
[14] Pan Song, Changfu Zong, Masayoshi Tomizuka, “A terminal sliding mode based torque
distribution control for an individual-wheel-drive vehicle”, Journal of Zhejiang University-
Science A (Applied Physics & Engineering), Vol.15, No.9, 2014, pp. 681-693.

INTERNATIONAL JOURNAL ON SMART SENSING AND INTELLIGENT SYSTEMS VOL. 8, NO. 3, SEPTEMBER 2015
1875
[15] Yan Chen, Junmin Wang, “Adaptive Energy-Efficient Control Allocation for Planar Motion
Control of Over-Actuated Electric Ground Vehicles”, IEEE Transactions on Control Systems
Technology, Vol. 22, No.4, 2014, pp. 1362-1373.
[16] GuoDong Yin, XianJian Jin, ZhiYong Qing, etc. “Lateral stability region conservativeness
estimation and torque distribution for FWIA electric vehicle steering”, Science China-
Technological Sciences, Vol.58, No.4, 2015, pp. 669-676.