Research on Community Involvement, Employee Volunteering and Corporate Giving
12
EXECUTIVE SUMMARY ccc.bc.edu COMMUNITY INVOLVEMENT STUDY 2015
-
Upload
boston-college-center-for-corporate-citizenship -
Category
Education
-
view
2.275 -
download
1
Transcript of Research on Community Involvement, Employee Volunteering and Corporate Giving

EXECUTIVE SUMMARY ccc.bc.edu
COMMUNITYINVOLVEMENTSTUDY 2015

1 Community Involvement Study © Copyright 2015 Boston College Center for Corporate Citizenship
The Boston College Center for Corporate Citizenship’s 2015 Community Involvement Study is based on a survey of 236 companies and examines
how companies are investing in their communities. The Community Involvement Study has been conducted since 1995. Corporate giving and
employee volunteer programs are the major dimensions of community involvement and are defined as follows:
About Community Involvement 2015
• Corporate giving includes financial and noncash contributions to 501(c)(3) organizations or public schools, or the international equivalent of a 501(c)(3) organization.
• An employee volunteer program is a planned and managed effort by a company to provide employees with organized opportunities to volunteer, means to recognize employee volunteer efforts, or some combination of both.
Please feel free to use these findings in your own commu-nications with the Boston College Center for Corporate Citizenship’s sourcing information included.
Data in figures and throughout the text refers to survey responses based on the entire company, unless otherwise noted by the † symbol. Figures that include the † symbol are based on data from all respondents (responses based on the entire company and those based only on regional or local operations). Eighty-eight percent of the survey responses are based on the entire company.
Companies’ community involvement efforts featured in this report (clockwise from top left): KPMG LLP; Applied Materials; Northwestern Mutual; Samsung; Farmers Insurance; and Salesforce
2 Community Involvement Study © Copyright 2015 Boston College Center for Corporate Citizenship
Companies are recognizing the value that community involvement efforts offer the business as well as society, and have found that their programs
to address social issues help to improve their reputation and achieve employee-related business benefits.
Introduction
Selected findings Corporate citizenship professionals report that com- munity involvement activities within corporate citizenship efforts contribute to enhanced reputation and the recruit-ment and retention of employees. Business executives agree—the majority of executives in the 2014 State of Corporate Citizenship study report that corporate citizen-ship contributes to achieving reputational and employee-related goals.
• More than 40% of companies indicate that community involvement is essential to their firms’ reputations.
• Companies report that community involvement contributes to achieving business goals that are important to their industry’s operating context. For example:○ More than one-half of food companies indicate that
community involvement contributes to securing a sustainable supply chain.
○ Fifty percent of energy companies report that community involvement helps improve risk management.
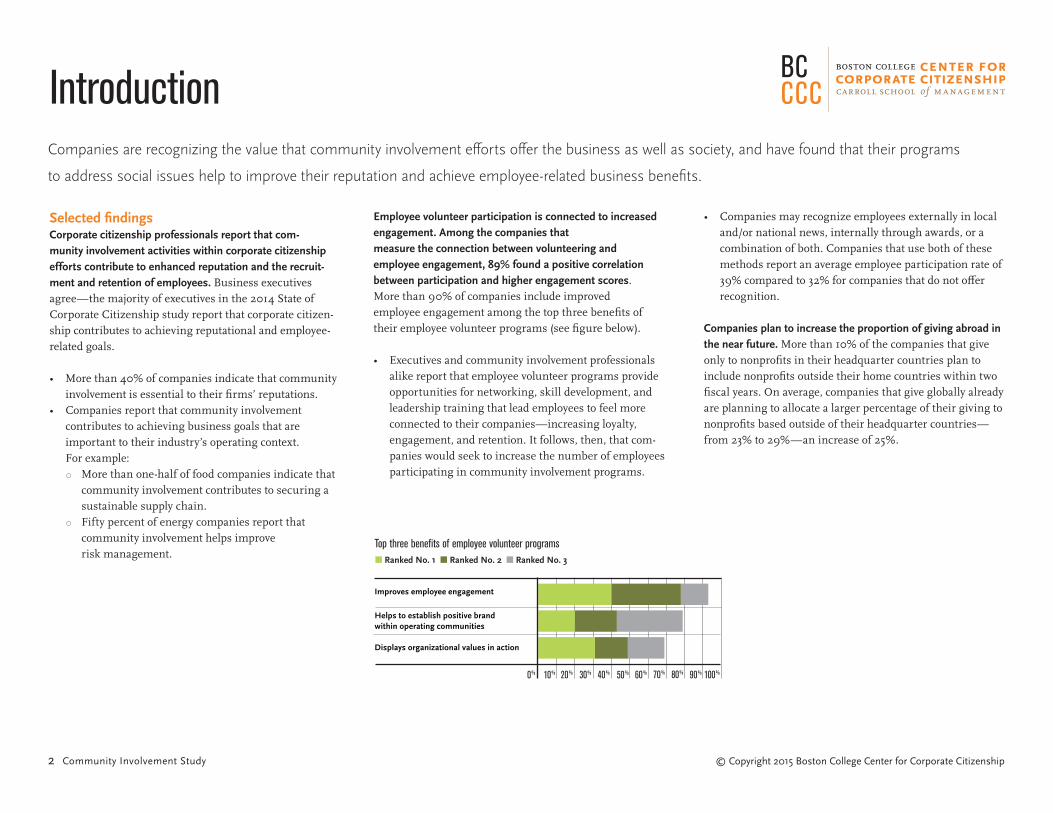
Employee volunteer participation is connected to increased engagement. Among the companies that measure the connection between volunteering and employee engagement, 89% found a positive correlation between participation and higher engagement scores. More than 90% of companies include improved employee engagement among the top three benefits of their employee volunteer programs (see figure below). • Executives and community involvement professionals
alike report that employee volunteer programs provide opportunities for networking, skill development, and leadership training that lead employees to feel more connected to their companies—increasing loyalty, engagement, and retention. It follows, then, that com- panies would seek to increase the number of employees participating in community involvement programs.
50%40% 60%30%20%10%
Figure 1Top three benefits of employee volunteer programs
Improves employee engagement
Helps to establish positive brand within operating communities
Displays organizational values in action
■ Ranked No. 1 ■ Ranked No. 2 ■ Ranked No. 3
100%0% 70% 80% 90%
• Companies may recognize employees externally in local and/or national news, internally through awards, or a combination of both. Companies that use both of these methods report an average employee participation rate of 39% compared to 32% for companies that do not offer recognition.
Companies plan to increase the proportion of giving abroad in the near future. More than 10% of the companies that give only to nonprofits in their headquarter countries plan to include nonprofits outside their home countries within two fiscal years. On average, companies that give globally already are planning to allocate a larger percentage of their giving to nonprofits based outside of their headquarter countries—from 23% to 29%—an increase of 25%.

3 Community Involvement Study © Copyright 2015 Boston College Center for Corporate Citizenship
Prioritizing issuesAs was the case in previous studies, engagement with children and
youth is a major priority for the majority of companies.
While the top areas of investment have held steady, there have been shifts in the areas companies choose to address through community involvement. Recently, companies have begun to increase focus on health and wellness programs. Now, 40% include this social issue as a top priority, while in 2009 and 2011, this issue followed environmental issues.
FIGURE 9Top social issues addressed through community involvement efforts
■ Ranked No. 1 ■ Ranked No. 2 ■ Ranked No. 3 ■ Ranked No. 4 ■ Ranked No. 5
K–12 education
Youth programs
Health and wellness
STEM training and education
Community economic development
Hunger and food security
Environmental sustainability
Higher education
Disaster relief
Arts and culture
Low-income housing
Noncommunicable diseases
Financial literacy
Work readiness
Diversity and inclusion
Small business and entrepreneurship
Gender equality
Technology access
Water
Communicable diseases
0% 10% 20% 30% 40% 50% 60%
Prioritization of social issues within industriesThe social issues that are most prioritized vary across industries, and in most cases, the issues are aligned to the core competencies and unique demands of that particular sector. For example, regional banks are most likely to focus on financial literacy, an issue to which they can strategically lend necessary materials and employee expertise, while at least 80% of companies within the computers/electronics, machine/industrial goods, and utility industries include science, technology, engineering, and mathematics (STEM) education and training among their top five issues.

4 Community Involvement Study © Copyright 2015 Boston College Center for Corporate Citizenship
Community involvement programs connect to key business goals The majority of companies report that community involvement
contributes to key business goals, including improved reputation
and the attraction and retention of employees. More than 80% of
companies offer an employee volunteer program, and almost all of
them identify improved employee engagement as a key benefit of
these programs.
The connection between community involvement and key business goals is consistent with the results of the Center’s State of Corporate Citizenship 2014 study. In the 2014 study, the majority of business executives report that the environmental, social, and governance dimensions of business contribute to enhanced reputation and the recruitment and retention of employees.
Employee volunteer programs connect to business goalsIn addition to improved employee engagement, the majority of companies identified two reputational-related benefits among those ranked in the top three: helps to establish a positive brand within operating communities and displays organizational values in action.
Enhance reputation
Improve ability to recruit employees
Improve ability to retain employees
FIGURE 2Corporate citizenship contributes to business goals†
■ Community Involvement 2015■ The State of Corporate Citizenship 2014
60% 65% 70% 75% 80% 85% 90%
50%40% 60%30%20%10%
FIGURE 3Benefits of employee volunteer programs
Improves employee engagement
Helps to establish positive brand within operating communities
Displays organizational values in action
Improves morale within teams
Enhances employee professional skills
Opportunity to identify future leaders
■ Ranked No. 1 ■ Ranked No. 2 ■ Ranked No. 3
100%0% 70% 80% 90%
† Data is based on all respondents: responses based on the entire company and those based only on regional or local operations.

5 Community Involvement Study © Copyright 2015 Boston College Center for Corporate Citizenship
Volunteer programs help increase employee engagementCompanies themselves have found empirical support for the relationship
between volunteering and employee engagement. Of the 60% of com-
panies that measure the connection between engagement in their
employee volunteer program and employee engagement, 89% found
a positive correlation.
Companies use a variety of ways to engage employees in their volunteer programs. They clearly see the value of employee volunteer programs to attract prospective employees as nearly 60% of companies include information about their volunteer programs during recruitment. Approximately 60% of companies recognize exemplary employee volunteers in some manner. Recognition may be externally in local and/or national news, internally through awards, or a combination of both. Companies that recognize employees both internally and externally report an average employee participation rate of 39% compared to 32% for companies that do not offer recognition.
50%40% 60%20%10%
FIGURE 5The ways that companies engage employees in volunteer programs
Orientation or onboarding of new employees
Team-building activity option for managers
Includes write-ups in employee newsletter
Employee ambassadors
Social outings for employees
Process of recruiting employees
Training, toolkits, and other resources
Recognizes excellent employee volunteers with awardsRecognizes employee volunteers externally (local and/or national news)Volunteer participation as a leadership development goalEmployee annual development plan/performance reviewOffers financial incentive bonuses for volunteer participation
Company requirement
70% 80% 90%30%0%
FIGURE 4Companies that measure the relationship between volunteer participation and employee engagement scores
■ Companies found a positive correlation between volunteer participation and engagement scores
■ Companies did not find a positive correlation between volunteer participation and engagement scores
89%
11%

6 Community Involvement Study © Copyright 2015 Boston College Center for Corporate Citizenship
Employee engagement through workplace giving programsEmployees play a key role in companies’ community
involvement efforts by participating in workplace
giving programs. More than 80% of companies
offer workplace giving programs. These companies
are most likely to offer giving campaigns, followed
by disaster relief programs.
The majority of companies extend workplace giving opportuni-ties beyond full-time employees to include those who work part time. However, these initiatives are not offered to other internal stakeholders by the majority of companies.
Matching information and employee participation Nearly 80% of companies that match contributions are most likely to offer a 100% match. Of all the matched-gift programs offered by organizations, company-organized giving campaigns are the most popular with employees. Thirty-six percent of employees participated in company-organized giving campaigns in the most recently ended fiscal year, while 15% of employees engaged in gifts for any purpose (median values).
50%40% 60%30%20%10%
FIGURE 20Type of gifts offered in workplace giving programs
Giving campaign
Disaster relief
Gifts to higher education
Gifts for any purpose
100%0% 70% 80% 90%
50%40% 60%30%20%10%
FIGURE 21Who is eligible to participate in workplace giving programs
Full-time employees
Part-time employees
International employees (based outside the headquarter countries)
Retirees
Other (e.g., board members, contractors, and interns)
100%0% 70% 80% 90%

7 Community Involvement Study © Copyright 2015 Boston College Center for Corporate Citizenship
Growth in global givingDespite the complexities involved with global giving, companies
are planning to expand their giving to nonprofits based outside
of headquarter countries in the near future.
More than 40% of surveyed companies give to nonprofits outside of the country in which they are headquartered. A higher percentage—67%—of global companies give to nonprofits based outside of their headquarter countries.
Planned increases for global givingOf the companies that currently give only to nonprofits in their headquarter countries, 13% plan to include nonprofits outside their home countries within two fiscal years. Companies that give globally are likely to focus the majority of their giving efforts in the country where they are headquartered. On average, 77% of corporate giving is distributed to domestic nonprofits, while 23% is distributed abroad. In two fiscal years, these companies are planning to increase the proportion of their budget allocated to global giving from 23% to 29%.
FIGURE 30Corporate giving to nonprofits based outside of headquarter countries*
■ Companies that give to nonprofits based outside of their headquarter countries
■ Companies that only give to nonprofits based within their headquarter countries
FIGURE 31Source of companies’ giving to nonprofits based outside company headquarter countries
■ Giving from the company and through the foundation
■ Giving from the company only
■ Giving through the foundation only
■ Other
FIGURE 32The average split in giving between domestic nonprofits and nonprofits based outside the headquarter countries*
■ Percentage of giving allocated to domesticnonprofits
■ Percentage of giving allocated to nonprofits based outside of the headquarter countries
42%
58%
48%
39%
11%
2%
77%
23%
*Note: Data represents only companies that give globally
*Note: Data represents domestic and global companies

8 Community Involvement Study © Copyright 2015 Boston College Center for Corporate Citizenship
Profile of companies surveyedData in figures and throughout the text refers to survey responses based on the entire company, unless otherwise noted by the † symbol. Figures that include the † symbol are based on data from all respondents (responses based on the entire company and those based only on regional or local operations). Eighty-eight percent of the survey responses are based on the entire company.
20%15%10%5%
Finance and insurance
Manufacturing
Information
Energy
Professional, scientific, and technical services
Utilities
Regional banks
Retail and wholesale trade
Health care/Pharmaceuticals/Biotechnology
Computers and electronics
Machine/Industrial goods
Food
Health insurance
Industry
0%
Note: Industries based on North American Industry Classification System (NAICS) and MSCI industries
Company typePublicly traded for-profit company
Private for-profit company Private nonprofit corporation
Other
Governmental and quasi-governmental corporations
Business type
Both B2B and B2C
B2B
B2C
Other
Company operationsGlobal
Domestic (headquarter countries only)
Company revenue for prior fiscal year< $1 billion
$1 billion to < $5 billion
≥ $5 billion
More than one-half are global companies
More than one-half are publicly traded, for-profit companies
Almost one-half of the companies are both B2B and B2C
Employee size
Fewer than 1,000 employees (17%)
More than 1,000 employees (83%)
100,000 or more (6%)
50,000 to 99,999 (5%)
25,000 to 49,999 (8%)
10,000 to 24,999
(18%)
5,000 to 9,999 (14%)2,500 to 4,999 (12%)
1,000 to 2,499(20%)
Majority of companies have an annual revenue of at least $1 billion
One-half of companies have at least 5,000 employees
54%
32%
5%
5%
4%
46%
38%
15%
1%
29%
35%
36%
58%
42%

9 Community Involvement Study © Copyright 2015 Boston College Center for Corporate Citizenship
Methodology and additional offerings
Survey 236 companies Mostly U.S.-based medium and large companies Conducted Jan. 22 – Feb. 19, 2015
History The survey has been conducted since 1995
Examines how companies are investing in their communities
Corporate citizenship professionals and executives provide insight into how their companies are managing and executing their community involvement programs
2015
Additional resources for Boston College Center for Corporate Citizenship member companies:
The full report and presentation slides are available for download from the Center website, ccc.bc.edu.
Customized presentations by industry will be available for download December 2015 from ccc.bc.edu.
Interested in a customized view of the Community Involvement report related to a business
demographic? Feel free to contact [email protected].
Not a member of the Boston College Center for Corporate Citizenship but are
interested in learning more about the value that membership provides?
Contact our membership department at [email protected] or 617-552-4545.
Methodology

10 Community Involvement Study © Copyright 2015 Boston College Center for Corporate Citizenship
Celebrating 30 years helping companies align corporate citizenship objectives and business goals, the Boston College Center for Corporate Citizenship comprises a network of more than 420 member companies creating one of the largest membership organizations in the United States.
Join. Connect. Grow.
20%15%10%5%
Finance and insurance
Utilities
Professional, scientific, and technical services
Health care and social assistance
Computers and electronics
Retail trade
Machine/Industrial goods
Food/Beverage/Tobacco
Information
Consumer products
Top 10 industries (21 industries represented)
0%
■ Fortune 1,000 companies■ Fortune 500 companies■ All other companies
More than 40% of our members are from
Fortune 1,000 companies
Company type
■ Publicly traded for-profit company
■ Private for-profit company ■ Private nonprofit corporation■ Governmental corporation
or congressionally authorized organization
Company revenue
■ < 1 billion■ 1 billion to < 5 billion■ ≥ 5 billion
Both B2B and B2C
B2B
B2C
Business type
40%30% 50% 60%20%10%
Business region Members represent 13 countries, 43 U.S. states (plus DC), 7 Canadian provinces
66% Global companies
34% Domestic companies (headquarter countries only)
Company membership
23% of our members have
been with us for 10 years or more.
12% 27% 15% 21% 11% 7% 7% < 1,000 1,000–4,999 5,000–9,999 10,000–24,999 25,000–49,999 50,000–99,999 ≥ 100,000
Employee size
42%
58%
64%
32%
4% 1%
22%
33%
45%
28%

Based in the Carroll School of Management, the Boston College
Center for Corporate Citizenship combines the most valuable aspects
of a professional community and the resources of a leading academic
institution for our members. We integrate the perspectives and
experience of some of the leading corporate citizenship professionals
in the field today with management best practices, helping you align your
corporate citizenship objectives and business goals. We also conduct
ongoing research, which is available to members through weekly, monthly,
and biannual publications. Center resources and professional develop-
ment opportunities support positive outcomes for your functional area,
your organization as a whole, and for you as a leader.
140 Commonwealth Ave., Chestnut Hill, MA 02467 | t: 617 552 4545 f: 617 552 8499 e: [email protected]
KNOW MORE. DO MORE. ACHIEVE MORE.
ccc.bc.edu


![teachers notes 1-7 vq6[1]:KS 3 11/01/2010 16:47 Page 21 6 ... 6 Volunteering and giving... · If you don’t have that then offer a kind word. ... 8 Volunteering is the same as giving](https://static.fdocuments.net/doc/165x107/5aa803537f8b9aca258b48f9/teachers-notes-1-7-vq61ks-3-11012010-1647-page-21-6-6-volunteering-and.jpg)