Research on buying and selling homes - gov.uk · Buying or selling a home is often claimed to be...
75
RESEARCH ON BUYING AND SELLING HOMES Research paper number BIS/283 October 2017
Transcript of Research on buying and selling homes - gov.uk · Buying or selling a home is often claimed to be...
RESEARCH ON BUYING AND SELLING HOMES Research paper number BIS/283
October 2017

Contents Summary ________________________________________________________________ 3
Context ________________________________________________________________ 3
Survey Design __________________________________________________________ 4
Key findings – successful purchases and sales _________________________________ 4
Survey of failed transactions _______________________________________________ 9
1. Introduction __________________________________________________________ 11
2. Use of traditional estate agents __________________________________________ 16
Key findings ___________________________________________________________ 16Who uses a traditional estate agent? ________________________________________ 17Who does not use a traditional agent? _______________________________________ 19
3. Marketing properties and finding a property to buy __________________________ 21
Key findings ___________________________________________________________21 The seller experience ____________________________________________________ 22 The buyer experience ___________________________________________________ 31
4. From offer to completion _______________________________________________ 38
Accepting the offer ______________________________________________________ 39Taking the property off the market __________________________________________ 40Buyers’ and sellers’ concerns after the offer was accepted _______________________ 41Willingness to Enter a Legal Commitment ____________________________________ 44Surveys and valuations __________________________________________________ 48Renegotiating the offer ___________________________________________________ 50Delays and their impacts _________________________________________________ 52
5. Satisfaction with the home buying and selling process ______________________ 56
Key findings ___________________________________________________________56 Estate agents __________________________________________________________ 57 Satisfaction with other services ____________________________________________ 60 Length and complexity of the process _______________________________________ 63
6. Failed transactions ____________________________________________________ 68
Key findings ___________________________________________________________68 Research design _______________________________________________________ 69 Reasons for failure ______________________________________________________ 70 The cost of a failed transaction to buyers and sellers ___________________________ 72
2

Summary
Context
Buying or selling a home is often claimed to be among the most stressful of life experiences. The process can be lengthy, uncertain and carry unexpected costs, especially if the sale collapses, and is often criticised for not being as efficient, effective, or consumer friendly as it could be. Despite high numbers of successful transactions (last year there were over 1 million1 residential property transactions), many consumers are thought to have poor experiences when transactions take too long to complete, or are subject to a difficult renegotiation midway through the process.
Moreover, many transactions fall through before they can complete. Various anecdotal sources put the fall through rate at between one quarter and one third2, implying that the total number of transactions that collapse before completion could be in the region of 400,000. When this happens any costs incurred in progressing the transaction (e.g. legal, survey etc.) are effectively lost to consumers, and in many cases these can be high.
The transaction is also characterised by low levels of trust between all parties, with estate agents often coming in for the most criticism about their practices. Indeed, the Homeowners Alliance reported that only 20% of homeowners and aspiring homeowners trust agents when buying or selling a home, a far lower level than for conveyancers, surveyors or mortgage lenders3. They have also criticised the sector for the lack of transparency about their commission and other fees.4
Since 2008, estate agents have been required to register with government approved Ombudsman schemes, who uphold codes covering practices and transparency of fees. However, during the passage of the Consumer Rights Bill and the Consumer and Competition Landscape reforms during 2013 and 2014, concerns were again raised in Parliament and the media about estate agents. Anecdotal examples were given of misleading and aggressive practices designed to close a deal; agents encouraging gazumping by continuing to market properties after offers have been accepted and encouraging ‘ghost gazumping’ where the seller demands a higher price between offer and exchange5.
1 HM Revenue and Customs UK Property Transactions Count – Feb 2016 www.gov.uk/government/uploads/system/uploads/attachment_data/file/500443/UK_Tables_Feb_2016__cir_.pdf
2 www.quickmovenow.com/news/house-sale-fall-through-rate-increases-q2-2015/ 3 Home Owners Alliance (2013) Connecting with the concerns of homeowners and aspiring
homeowners 4 Homeowners Alliance (2014) Why the mystery? 5 BBC (2014) Ghost gazumping: Buyer’s peril from rising house prices 25th July 2014
3

At the same time there were an unprecedented number of complaints regarding the buying and selling of property. The largest scheme, The Property Ombudsman Ltd, reported a 25% increase in sales complaint enquiries between 2012 and 2013 despite only a 5% increase in the number of sales agent offices affiliated with the scheme6. Since then, complaint levels have stabilised but the Property Ombudsman figures show that consumers continue to complain typically about communication failure (20%); misleading sales details or advertising (12%); a failure in the agent’s duty of care (10%) and commission fees (9%)7.
Survey Design
The Department for Business Innovation and Skills (BIS) commissioned TNS BMRB to conduct a survey of the experience of recent home buyers and sellers to obtain a detailed and measured understanding of the scale and nature of detriment in the home buying and selling sector.
We conducted online interviews with around 2,000 people who had bought or sold a residential property in England or Wales in the two years prior to March 2015. This could have been their own home, a second home, a buy to let property or a probate sale. The survey covered the entire ‘journey’ from the initial marketing or property search, to negotiating an offer and all aspects of the conveyancing prior to completing the sale.
For an additional part of the study, we also explored the experience of failed transactions, both among those in our survey sample who had experienced a purchase or sale fall through in the run up to their successful transaction plus a further group of 600 respondents who had experienced a transaction failure without then going on to successfully buy or sell.
Key findings – successful purchases and sales
Use of traditional estate agents
Although some sellers are turning to online agents with lower fixed fees or selling entirely privately, the majority are still using ‘traditional’ estate agents with a high street presence to market their homes. This is mainly a consumer preference and people have concerns over using alternative methods for home buying and selling:
• Most sellers (83%) sold through a traditional estate agent rather than selling privately (10%), through an online agent (5%) or by auction (1%).
• Older sellers and those involved in the complexities of an onward chain were more likely to use a traditional agent.
• Those choosing a traditional agent tended to say that they simply prefer to do it that way (63%), but some were concerned that it would be hard to
6 The Property Ombudsman (2014) Annual Report 2013 7 The Property Ombudsman (2015) Annual Report 2014
4

communicate without an agent to assist (20%) or that something would go wrong with the process otherwise (20%).
• Buyer behaviour was generally determined by how the seller marketed the property they wanted to buy, again, 83% of buyers purchasing their home through a traditional estate agent.
The remainder of this survey concentrated on those who had used a traditional estate agent as the focus of this study.
Marketing a property and finding a property to buy
Sellers Previous experience of selling a home was the key factor determining how much control sellers took of the process of marketing their home through an estate agent.
• Most (75%) sellers asked more than one estate agent to value their home but nearly all (94%) opted for a sole agency contract when they put the property on the market. Although one in ten (12%) of those opting for sole agency would have rather appointed multiple agents, they were put off by the higher fees.
• Experienced sellers were more likely to negotiate the terms of their contracts (typically fees or length of contract) (42%) than first time sellers (30%).
• Similarly experienced sellers were more likely to change agents to achieve a sale (18% compared to 13%), most commonly because they believed they were not getting enough viewings. Similarly, those in a chain and often under pressure to complete a deal were more likely to change agents (21%) than those with no onward purchase (15%)
• Around two thirds (66%) sold their home on a percentage commission basis, whilst one in five (18%) paid a flat fee, sometimes still broadly linked to the price of their property.
Buyers The experience for buyers inevitably reflected the local housing market with considerable reports, particularly among first time buyers, with a sense of being short of time and feeling pressure to make offers sooner or higher than they wanted to in property hotspots.
Overall, buyers found information they received from estate agents helpful. There was a high degree of interest in viewing a surveyor’s valuation or survey upfront but, as has previously been found, only a minority would rely on this information without commissioning their own report.
• Three in ten (30%) buyers only viewed the property they went on to buy once before making an offer.
• One in five (20%) buyers would have liked another viewing but this was not noticeably higher among those who had only one viewing. Instead, first time buyers (29%) and those buying in London (28%) were the most likely to feel they didn’t view the property as much as they would have liked.
• Among those who would have liked to view the property again, nearly one in three (29%) simply felt there wasn’t time before needing to make an offer and
5

similarly, nearly one in four (24%) reported that the estate agent had told them there was a lot of interest in the property.
• As well as property descriptions and measurements, nearly all buyers found further information such as the level of interest in the property; the seller’s position or answers to their specific questions when given helpful when provided.
• Only flood risk reports and Energy Performance Certificates were less likely to be considered helpful among those that were shown them (found helpful by 67% and 63% of buyers respectively).
• In the minority of cases were a current surveyor’s valuation and/or survey of the property was available (14%), buyers were very likely to find this information helpful (83% and 89% respectively). There was also most interest in receiving this type of information from those who did not receive it.
• Despite this interest, only 50% of buyers would be prepared both to rely on an independent survey and valuation provided by the seller as a basis to exchange contracts rather than commission their report.
• Nearly two thirds of buyers (63%) reported the estate agents encouraging them to offer on the property, including around one in four being told it was priced for a quick sale (26%) or there was a lot of interest in the property (24%).
• Buyers in property hotspots such as London and the South East were most likely to be told there had already been an offer on the home (26% in both regions) with Londoners being put under further pressure hearing that someone else was about to offer on the property (21%).
• Clearly advice will follow the nature of the local housing market but of those buyers that received these types of messages from agents, nearly one in four (39%) felt that they had put in an offer sooner or at a higher level, or both, than they wanted to.
• Inexperienced first time buyers were most vulnerable to this pressure with 47% regretting the speed or level of their offer, compared to 36% of experienced buyers.
6

From offer to completion
Despite some concerns about marketing or finding a property, the conveyancing period from offer acceptance to completion carried most of the stress, frustration and uncertainty for both buyers and sellers, with low levels of trust between all parties. Many experienced delays to the process and some incurred costs as a result.
• The vast majority of offers were made in the conventional way via the estate agent. Only a small minority (2% of buyers and 3% of sellers) reported using the sealed bid process.
• Whilst over half of agents (56%) did not offer the seller any particular advice about whether to accept the offer, just over four in ten (42%) told the seller either that it was likely to be the best price they would get or that no other offers were likely.
• Experienced sellers were better at establishing information about the prospective buyer from the agent at the time of offer, such as their financial circumstances or whether the buyer was in a position to move.
• There were discrepancies in reports of whether the home was taken off the market after the offer was accepted. Nearly nine in ten buyers (88%) believed this had occurred with their property, often making it a condition of their offer, but only just over three quarters of sellers (77%) reported doing so.
• Buyers continued to be concerned that a survey would reveal something unexpected about the property (35%) while sellers worried that the buyer would change their mind and withdraw their offer (46%).
• Nearly four in ten (39%) of buyers reported paying for a full structural survey on the home as well as a further 41% saying they commissioned a homebuyer’s report. Those who didn’t tended to be more experienced buyers who considered they could rely on their own knowledge and experienced to evaluate the property.
• Mistrust between the buyer and the seller was a characteristic of the process after offer. Thirty three per cent of buyers were concerned that their seller would change their mind and would not sell 46% of sellers said that they had concerns that buyers would change their mind and would not buy. A quarter (26%) were concerned that buyer would lower their price in the mid-process
• Despite concerns from buyers, only 2% reported the seller demanding a higher price after they had accepted the offer whilst nearly one in five (18%) of buyers reduced their offer, usually because of something identified in the survey or a lower than expected mortgage lender’s valuation.
• For many (38% of buyers and 41% of sellers) the time taken from offer to exchange of contracts took longer than they expected. First time buyers, who might have had unrealistic expectations, were only slightly more likely to report delays (40%) than experienced buyers (37%).
• Over those who experienced delays, around four in ten incurred additional costs as a result, such as paying for rented accommodation or putting their possessions into storage. This amounts to about one in seven of all buyers and sellers incurring additional costs because of delays in the process. Average cost for delays might be in the region of £500-£750.
• Buyers were more frustrated with the impact on their intended completion date with over half of those affected (57%) saying their completion date had to be put back compared to nearly four in ten (39%) of sellers. But this still
7

amounts to over one in seven sellers and one in four buyers not achieving their planned completion date.
• Those experiencing delays tended to hold the other party’s solicitor or licensed conveyancer responsible with nearly half (47%) of buyers blaming the seller’s solicitor as did 58% of sellers did the buyer’s solicitor.
Satisfaction with the process
Consistent with previous home buying and selling research8, the most common frustration among home buyers and sellers was with the length of time that the conveyancing process takes and satisfaction with the services received during the process reflected this.
• Satisfaction with estate agents was high (81% among buyers and 84% among sellers) whilst consumers were most likely to express dissatisfaction with the other party’s solicitor; with 32% of sellers and 28% of buyers dissatisfied with the other party’s solicitor.
• Only about one third of sellers and one fifth of buyers who were dissatisfied with their estate agent went on to complain. Most said they didn’t think it was worth complaining or they just wanted to move on. Attitudes were similar among those dissatisfied with solicitors, surveyors or EPC providers.
• Whilst only a minority of home buyers or sellers found the process particularly complicated, those that did tended to have issues with solicitors (24%) rather than estate agents (9%).
• Taking the whole experience into account, over half of buyers (51%) and nearly four in ten sellers (39%) said that if they were buying or selling this home again they would negotiate harder on the sale price. Nearly one in four buyers (24%) would have quotes for any work that needing doing before making an offer. Those who hadn’t commissioned a survey or homebuyer’s report were very likely to say they would do next time whilst some first time buyers (15%) had learned to arrange their mortgage before making an offer.
• Given the low levels of dissatisfaction, a notable proportion (24%) of sellers still felt that if they had their time again they would use a different estate agent. Rather than the quality of service this seemed most related to the one third of sellers who considered estate agents offered poor or very poor value for money.
• Nearly three quarters (74%) of buyers and 68% of sellers had at least one suggestion to improve the home buying and selling system. The most common area identified for improvement was a faster service from solicitors (34% of buyers and 31% of sellers).
• Many buyers were also seeking more information about the home and its condition up front whilst nearly four in ten (38%) of sellers wanted to make offers legally binding and seventeen per-cent of buyers said more legal commitment upfront would have improved the process.
8 DCLG (2007) HIP Baseline Research: Main Report
8

Survey of failed transactions
In the survey among those who had experienced a failed transaction, the same issues of uncertainty, lack of trust and blame of other parties found in the main study were amplified.
• Buyers who’d experienced a purchase fall through were more likely to point to problems identified in the survey as the cause of the failure than personal reasons (15%), whereas sellers were more likely to consider it was the buyers’ personal circumstances that cause them to withdraw (37%).
• Although buyers were less likely to experience failure, when they did, they were more likely to incur costs (56%) than sellers (44%). Most commonly this was on survey or valuation fees (74%) whereas sellers were more likely to have spent money on solicitors’ fees.
• Although estimates are approximate, of those who experienced transaction failure, about one in four buyers (24%) and sellers (25%) had incurred wasted costs of more than a £1,000. Where a transaction failure incurred costs, the average might be between £650 and £740.
The diagram on the next page outlines some of the key findings that were drawn out from this research.
9

.
10

1. Introduction
Objectives
The Department for Business Innovation and Skills (BIS) commissioned TNS BMRB to conduct a survey of the experience of recent home buyers and sellers in England and Wales to obtain a detailed and measured understanding of the scale and nature of detriment in the home buying and selling sector.
The survey was designed to provide current evidence of the consumer journey through buying and selling a home, to analyse the causes of transactions falling through, delays and impact of the delays and failed transactions in the process. We also explored consumers’ satisfaction with the service they received from estate agents, solicitors and other services they encountered and whether, if dissatisfied, they had gone on to complain about the service. We explored what consumers found most frustrating about the process and, if they had suffered detriment, asked about both the financial and personal impact.
Methodology
We used the TNS Online Panel to identify respondents who had either bought or sold a residential property in the two years prior to March 2015 or who had an offer accepted or accepted an offer but did not go on to complete the transaction9. This could include their own home, a second home, a buy to let property or a probate sale.
Those respondents who had both bought and sold (or tried to buy and seller) were randomly assigned to either our surveys of buyers or sellers to minimise respondent burden.
Table 1- 1 shows the composition of the total sample achieved for the survey of successful buyers and sellers as well as the additional respondents who had tried unsuccessfully to buy or sell a home. We discuss the sample of failed transactions in more detail in Chapter 5.
9 Fieldwork was conducted between March 10th and March 26th 2015
11

Table 1- 1 Sample composition
Number of interviews
Successful buyers 1185 Successful sellers 920 Unsuccessful buyers 130 Unsuccessful sellers 123 Total interviews 2358
In our survey of successful purchases, about one in four respondents were first time buyers, but it is notable that despite the rising average age of first purchase, nearly one third of under 35s had previously bought a home.
Table 1- 2 Successful buyers by age and whether first time buyer
Age 25-34 35-44 45-54 54-64 65+ Total
% % % % % % First time buyer 68 21 8 3 2 24
Experienced buyer 32 79 92 97 98 76 Base* 284 292 228 249 132 1185
*All successful buyers
In our survey of successful sales, 22% of sellers were selling a property for the first time. Not surprisingly, sellers had an older age profile than buyers but still, over one in four of the under 35s (27%) in the survey had previous experience of selling a home.
12
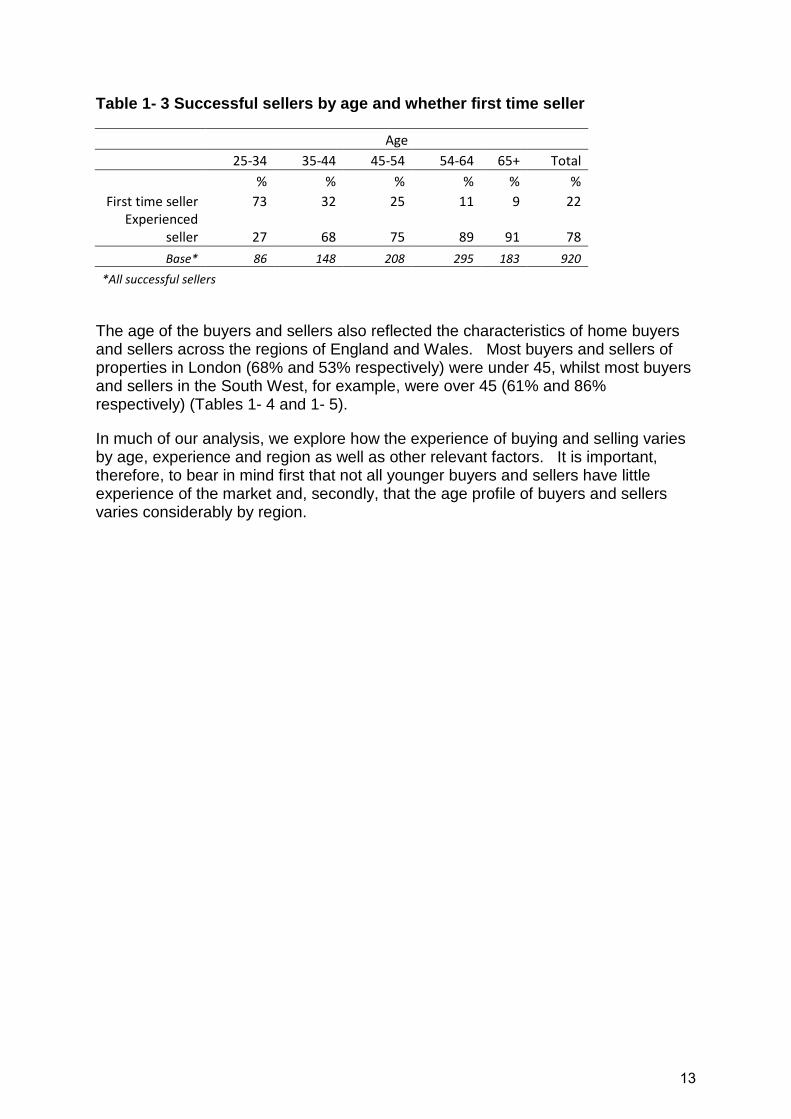
Table 1- 3 Successful sellers by age and whether first time seller
Age 25-34 35-44 45-54 54-64 65+ Total
% % % % % %
First time seller 73 32 25 11 9 22 Experienced
seller 27 68 75 89 91 78 Base* 86 148 208 295 183 920
*All successful sellers
The age of the buyers and sellers also reflected the characteristics of home buyers and sellers across the regions of England and Wales. Most buyers and sellers of properties in London (68% and 53% respectively) were under 45, whilst most buyers and sellers in the South West, for example, were over 45 (61% and 86% respectively) (Tables 1- 4 and 1- 5).
In much of our analysis, we explore how the experience of buying and selling varies by age, experience and region as well as other relevant factors. It is important, therefore, to bear in mind first that not all younger buyers and sellers have little experience of the market and, secondly, that the age profile of buyers and sellers varies considerably by region.
13

Table 1- 4 Age of buyers by region
Region
N.East N.West Yorks. E.Mids W.Mids E.Eng Lon S.East S.West Wales Total
Age % % % % % % % % % % % 25-44 39 55 50 41 50 53 68 42 39 43 59
45+ 61 45 50 59 50 47 32 58 61 58 41 Base* 62 132 127 80 123 148 124 157 148 80 1181
*All successful buyers except four with missing information.
Table 1- 5 Age of sellers by region
Region
N.East N.West Yorks. E.Mids W.Mids E.Eng Lon S.East S.West Wales Total
Age % % % % % % % % % % %
25-44 25 19 30 28 29 23 53 21 14 12 25
45+ 75 81 70 72 71 77 47 79 86 88 75
Base* 56 101 94 69 96 101 97 133 106 66 919
*All successful sellers except one with missing information.
14

For those taking part in the full survey (who had bought or sold through a traditional estate agent), results were weighted by region and property value using Land Registry data available from March 2013 to February 2015. There is no means to weight further by the characteristics of consumers in this sector as only the characteristics of those applying to mortgage lenders are available10.
Similarly with no national data on failed transactions, the second survey of unsuccessful attempts to buy or sell a home is based on unweighted data.
Glossary of terms
We define below the terms that we use throughout this report.
• Home: The residential property being bought or sold. It may be the respondent’s home, second home, a buy to let property or probate sale.
• Traditional estate agent: An estate agent with a high street as well as online presence.
• Successful buyer: Respondents who completed a sale in the two years prior to the survey. If they completed more than one sale we asked them about their most recent transaction.
• Successful seller: Respondents who completed a sale in the two years prior to the survey. If they completed more than one sale we asked them about their most recent transaction.
• First time buyer: Respondents whose most recent transaction in the previous two years was their first purchase of a home.
• First time seller: Respondents who sold their home in the past two years and who did not sell any other property before or after this sale.
• Experienced buyer: Respondents who had bought a home prior to the transaction discussed in the survey.
• Experienced seller: Respondents who had sold a home prior to the transaction discussed in the survey.
• Failed transaction: When a sale/purchase falls through after the offer has been accepted.
• Failed Buyer: A buyer who experienced a failed transaction • Failed Seller: A seller who experienced a failed transaction • Solicitor: For brevity we use this term inclusively to mean solicitor or licensed
conveyancer.
10 For example the Council of Mortgage Lenders provides data on the whether a borrower is a first time buyer and distribution of mortgage lending but there is no equivalent data on the characteristics of cash buyers who are believed to account for nearly 40% of purchases in 2015. www.nationwide.co.uk/~/media/MainSite/documents/about/house-price-index/May_2015.pdf
15

2. Use of traditional estate agents
Key findings
• Over four out of five buyers and sellers bought or sold a home that wasmarketed by a traditional estate agent (83%).
• Older sellers and those involved in the complexities of an onward chain weremore likely to use a traditional agent.
• Those using traditional agents to sell their home tended to say they simplyprefer to do it that way (63%), but some were concerned that it would be hardto communicate without an agent to assist (20%) or that something would gowrong with the process otherwise (20%).
• Younger sellers who used a traditional agent were less likely to hold a strongpreference for this choice but were more likely to feel they lacked theexperience necessary to do otherwise.
• Buyers’ channel of purchase tended to be driven by the choice of the seller ofthe home they wanted to buy, but there is some evidence that older buyerswere more likely to have found their property through a traditional agent.
• Around 10% of buyers and sellers completed their transaction privately witharound one in five (20%) of this group selling to a friend or relative.
• About one in twenty (5%) sellers used an online estate agent with higher levelsamong younger sellers.
16

Who uses a traditional estate agent?
This survey was primarily concerned with the experience of buying and selling a property through a traditional estate agent with a high street presence. Among our initial sample of all home buyers and sellers, 83% had completed their transaction using the services of a traditional estate agent, about one in 10 (10%) had bought or sold privately and one in 20 (4% of buyers and 5% of sellers) used an online only agent. A small number of properties were bought through other channels such as new build homes bought directly from a developer (Figure 2.1)
Figure 2- 1 Method of home buying and selling (%)
Unweighted base: all successful buyers (1185) Unweighted base: all successful sellers (920) Source: Q21: Did you buy your home through a…? Source: Q32. Did you sell the property through…?
Differences are most pronounced among sellers given that they determine the channel by which the property is marketed. Older sellers were more likely to have used a traditional agent (85% of those aged 45 or older compared to 79% of those under 45). Sellers with an onward chain, who may be under more pressure to find a buyer and complete the sale, were also more likely to sell through a traditional agent (88% compared to 80% of those not in a chain). Although numbers are small, there appeared to be higher use of private sales in Yorkshire and Humberside as well as Wales (Table 2-1).
83
4 10
1 2
83
5 10
1 1
Traditionalestate agent
Online estateagent
Private sale Auction Other
Buyers Sellers
17

Table 2- 1 Methods of home selling across regions
N.East N.West Yorks. E.Mids W.Mids E.Eng Lon S.East S.West Wales Total
% % % % % % % % % % % High street agent with a branch or branches 86 83 71 88 82 86 89 86 88 79 83 An online estate agent with no branches 4 6 5 7 6 7 7 3 3 5 5
Private sale 9 11 18 3 1 6 1 8 8 14 10
An auction 2 0 3 1 0 0 1 1 0 3 1
Other 0 0 2 0 1 1 1 2 1 0 1
Base* 56 101 94 69 96 101 97 133 106 66 920 *Successful sellers who sold a property in the specified region
Source: Q95: Did you sell your property through…?
Differences among buyers were smaller and were generally driven by the choice of the seller of the property they wanted to buy, but there was a slightly higher tendency to buy through a traditional agent among older buyers (84% of over those aged 45 or over compared to 81% of under 45s).
Reasons for choosing a traditional estate agent
When asked why they used a traditional agent rather than selling another way, nearly two thirds (63%) of this group of sellers simply reported that they preferred to do so, but one in five were concerned that something was ‘more likely to go wrong’ or that it would be ‘harder to communicate’ if they managed the process differently (20% each). Buyer preferences were less strong, again reflecting the fact that the choice of sales channel has been made by the seller of the home they want to buy. Only just over one third (36%) of those who bought through a traditional agent had a clear preference for this method, but there were shared concerns about communication (20%) and whether the process would be secure without a traditional agent (18%) (Figures 2- 2 and 2- 3)
18

Unweighted Base: Successful buyers who used a traditional estate agent (979) and successful sellers who used a traditional estate agent (765) Source: Q96: Why did you decide not to use another way to sell your home? (Multi coded) Source: Q22: Why did you decide not to use another way to buy your home? (Multi coded)
Although younger sellers and buyers were more likely to choose non-traditional channels overall (19% of sellers under 44 and 21% of buyers under 44 did not use a traditional agent compared to 16% of sellers and 15% of buyers aged 45 and over), those who did use a traditional agent were more likely to cite their lack of experience in the market as a factor affecting their choice rather than a positive preference for traditional agents more common among older sellers. Three in ten sellers under 35 (30%) mentioned that they used a traditional agent because they had little experience in the housing market compared to only 3% of those aged 65 or older. But only four in ten of this younger group (39%) said they preferred to use a traditional agent compared to nearly seven in ten (69%) of those aged 65 or over.
The stronger preference for traditional agents by both sellers and buyers who were in a chain were borne out by their concerns that using other means ‘might be less secure’ (23% of sellers and 22% of buyers compared to 14% of sellers and 15% of buyers who were not in a chain). Sellers in a chain were also concerned about the difficulties of communicating up and down the chain without a traditional agent working for them; with 26% reporting that it would be ‘harder to communicate’ if they used non-traditional methods compared to 15% of those not in a chain.
Who does not use a traditional agent?
Nearly one in five of our initial sample (17%) did not buy or sell their property using a traditional agent. One in ten (10%) achieved a private sale and one in twenty (5%) used an online agent. Only 1% of respondents bought or sold at auction. Younger
36
23
19
19
18
15
0
Prefer to use atraditional agent
The method I usedwas the only option
available to me
Might be less secure
Might be harder tocommunicate
Little experience
More likely to gowrong
Other
Buyers
63
20
20
18
8
4
Prefer to use atraditional agent
Might be harder tocommunicate
More likely to gowrong
Might be less secure
Little experience
Other
Sellers
Figure 2- 2 Why buyers did not decide to use another way to buy their home (%)
Figure 2- 3 Why sellers did not decide to use another way to sell their home (%)
19

sellers were more likely to used online agents (6% of those under 45 compared to 3% aged 45 or over) than older age groups.
Reasons for not using a traditional agent
Respondents who sold privately quite often had a buyer in mind that removed the need to market the property; one in five sold their property to a friend or relative or at least had a private buyer ready (12%). Buyers in this group again had less strong preferences with indeed nearly one in four (24%) who had bought privately reporting that they still prefer to use a traditional agent (Figure 2-4 and 2-5).
Unweighted Base: Successful buyers who bought their home through a private sale (114) Unweighted Base: Successful sellers who sold their home through a private sale (89) Source: Q96: Why did you decide not to use another way to sell your home? (Multi coded) Source: Q22: Why did you decide not to use another way to buy your home? (Multi coded)
24
9
8
8
8
8
5
Prefer to use atraditional agent
Bought fromfamily/friend
The method I usedwas the only option
available to me
More likely to gowrong
Little experience
I would not trust thedetails provided
Other
Buyers
20
12
10
8
6
4
Bought fromfamily/friend
Had a privatebuyer
The method I usedwas the only
available to me
Concerned thatfees would need to
be paid upfront
More likely to gowrong
Other
Sellers
Figure 2- 5 Why private buyers did not buy a home another way (%)
Figure 2- 4 Why private sellers did not decide to sell their home another way (%)
20

3. Marketing properties and finding aproperty to buy
Key findings
Sellers • Most (75%) sellers asked more than one estate agent to value their home
but nearly all (94%) opted for a sole agency contract when they put theproperty on the market. Although one in ten (12%) of those opting for soleagency would have rather appointed multiple agents, they were put off bythe higher fees.
• Experienced sellers were more likely to negotiate the terms of their contracts(typically fees or length of contract) (42%) than first time sellers (30%).
• Similarly experienced sellers were more likely to change agents to achieve asale (18% compared to 13%), most commonly because they believed theywere not getting enough viewings. Similarly, those in a chain and oftenunder pressure to complete a deal were more likely to change agents (21%)than those with no onward purchase (15%)
• Around two thirds (66%) sold their home on a percentage commission basis,whilst one in five (18%) paid a flat fee, sometimes still broadly linked to theprice of their property.
Buyers • Three in ten (30%) buyers only viewed the property they went on to buy
once before making an offer.• One in five (20%) buyers would have liked another viewing but this was not
noticeably higher among those who had only one viewing. Instead, firsttime buyers (29%) and those buying in London (28%) were the most likely tofeel they didn’t view the property as much as they would have liked.
• Among those who would have liked to view the property again, nearly one inthree (29%) simply felt there wasn’t time before needing to make an offerand similarly, nearly one in four (24%) reported that the estate agent had toldthem there was a lot of interest in the property.
• As well as property descriptions and measurements, nearly all buyers foundfurther information such as the level of interest in the property; the seller’sposition or answers to their specific questions when given helpful whenprovided.
• Only flood risk reports and Energy Performance Certificates were less likelyto be considered helpful among those that were shown them (found helpfulby 67% and 63% of buyers respectively).
• In the minority of cases were a current surveyor’s valuation and/or survey ofthe property was available (14%), buyers were very likely to find thisinformation helpful (83% and 89% respectively). There was also mostinterest in receiving this type of information from those who did not receive asurvey.
21

This chapter discusses the experience of marketing a property or finding a property to buy among those who eventually completed their transaction using a traditional estate agent. The seller experience
Choosing an agent
When preparing to market their property, three quarters of sellers (75%) obtained a valuation from more than one estate agent (Figure 3- 1) but over nine in ten (94%) then initially appointed one agent on a sole agency contract (Figure 3- 2)
Figure 3- 1 Number of agents who valued the property
Base: all successful sellers who used a traditional agent (765) Source: Q97: When you were preparing to sell your home, how many estate agents did you get to value your home?
24%
36%
34%
5%
1 2 3 4
• Nearly two thirds of buyers (63%) reported the estate agents encouraging them to offer on the property, including around in four being told it was priced for a quick sale (26%) or there was a lot of interest in the property (24%).
• Buyers in property hotspots such as London and the South East were most likely to be told there had already been an offer on the home (26% in both regions) with Londoners being put under further pressure hearing that someone else was about to offer on the property (21%).
• Clearly advice will follow the nature of the local housing market but of those buyers that received these types of messages from agents, nearly one in four (39%) felt that they had put in an offer sooner or at a higher level, or both, than they wanted to.
• Inexperienced first time buyers were most vulnerable to this pressure with 47% regretting the speed or level of their offer, compared to 36% of experienced buyers.
22

Figure 3- 2 Whether home was sold with sole or multiple agents
Base: all successful sellers who used a traditional agent (765) Source: Q98: And did you initially instruct an agent or agents as…?
Of those who chose a sole agent, over one in ten (12%) would have rather used multiple agents to sell their homes. When we asked why they used sole agency despite this preference, unsurprisingly, over half (57%) were motivated by the lower fees but nearly three in ten (29%) felt they were not offered the option of a multiple agency contract by their agent.
Base: All successful sellers who directed a sole agent
but would rather have instructed multiple (85) Source: Q:100 Why did you choose sole agency? (Multi coded)
94%
6%
Sole agent Multiple Agent
57
19
12
11
2
The commission/feewas lower
The estate agent didnot offer me theoption of multiple
agentsI would rather onlydeal with one agent,even if meant fewer
viewings
The estate agentadvised me against
using multiple agents
Other
Figure 3- 4 Why sellers chose sole agency (%)
23

Although cost may determine the dominance of sole agency contracts in the market, it is not the greatest determinant of the final choice of agent. Over half of sellers reported that they took reputation into account when choosing their agent (53%) rather than choosing the agent with the lowest fees (31%). Sellers also selected agents on the basis of proximity to their home (34% citing ‘located very near to my home’ as a reason for their choice). (Table 3-1)..
Table 3- 1 Reasons for choosing an estate agent
%
They have a good reputation 53 They are located very near to my home 34 They charged the lowest fees/commission 31 They have a high level of professionalism 25 I was confident in the speed they could sell my property 20 They gave me the highest valuation 17 They have a large branch network 15 They were recommended to me 14 They belong to a professional body or a scheme with a code of conduct 14 I used them to buy this home 9 Other 1 Base* 765 *All successful sellers who used a traditional estate agent
Source: Q101: thinking of the agent you initially instructed to sell your home, what made you decide to use them? (Multi coded)
First time sellers were more likely to choose the agent that gave them the highest valuation (26% giving this reason for their choice) than those with more experience in the market (15% saying this was a factor) and had a stronger preference for the agent that charged the lowest fees (38% compared to 29% of more experience sellers). Experienced sellers were more likely to consider the speed with which they thought the agent could sell the property to be important (21%) than first time sellers (15%).
24

Switching agents
Nearly one in five (17 per cent) sellers changed estate agent before they eventually completed their sale. Thirteen per cent changed from one sole agency contract to another, with the remaining 4% switching between sole and multiple agency contracts or changing their agents on a multiple agency contract.
Experienced sellers were slightly more likely to switch (18%) than first time sellers (13%) but younger sellers were more likely to change than older age groups (22% of those aged under 45 compared to 15% of those aged 45+). Whilst age and experience in the housing market were clearly correlated, younger consumers who do have experience in the housing market were appearing to exercise more choice not only over whether to use a traditional agent at all, but also over whether to stay with that agent if they were not receiving the service they would expect.
Although numbers are too small to report it is not surprisingly that sellers who had complained about their estate agent were most likely to switch, but switching was also more common among those who may be more likely to feel under pressure to find a buyer such as those in a chain (21% compared to 13% among those not in a chain) or those who perceived that prices were falling in their local area (23% compared to 13% who felt they rising).
The most common reason cited for changing agents was because they were ‘not getting enough viewings’ (54%) or had not received any offers (45%). (Table 3- 2).
Table 3- 2 Reasons for changing estate agent
%
I was not getting enough viewings 54 I did not receive any offers 45 I was receiving poor service from the previous agent(s) 37 I did not receive any offers that were high enough 22 Other 4 Base* 128 *Successful sellers using a traditional estate agent who changed their agent
Source: Q103: Why did you change estate agents? ((Multi coded)
For those that did switch, the majority found it easy or very easy (90%) with only around one in ten reporting it to be difficult or very difficult.
25

Information provided by the estate agent
We asked sellers about the type of information that they recall receiving from the estate agent that successfully sold their property Nearly all (93%) recall receiving confirmation of at least one aspect of their contract with the agent but respondents had relatively low recall of terms such as the length of the contract (45%) or whether any charges that might be incurred if they take the property off the market (41%). (Table 3- 3).
Table 3- 3 Information received from the agent
%
Their terms of business (whether sole selling rights, sole agency etc.) 66 A scale of their charges for a successful sale 58 The length of their contract with you 45 Their fees or charges should the property be taken off the market without a sale 41 A breakdown of the different components of their fees and charges 38 None of the above 7 Base* 765 *All successful sellers who used a traditional estate agent
Source: Q109: When originally discussing the arrangement for selling your home, did the agent give you information or tell you about any of the following? (Multi coded)
Negotiating the contract with an estate agent
Less than four in ten sellers (39%) successfully negotiated any terms of their contract with the agent that went on to sell their property such as its length or fees.
First time sellers were least likely to negotiate any terms (30%) compared to those with experience of selling (42%). But it is experience rather than age that is driving this difference. Indeed, younger sellers overall were more likely to negotiate on terms (50% of the under 45s) than those aged over 45 (35%).
Sellers who felt that prices were increasing were in a stronger position given the likely competition among agents locally, with 42% negotiating terms, than those who felt prices were falling (34%). Also sellers entering into a chain were more likely to negotiate (44%) than those with no onward purchase (35%). Over four out of five (82%) of those not in a chain were aged over 45 (compared to 69% of those that were) and we can speculate that these older sellers may be less prepared to negotiate.
Where sellers did negotiate terms it was most commonly the fee (31% of all sellers) although over one in ten (11%) changed the length of their contract. (Table 3- 4).
26

Table 3- 4 Terms that sellers negotiated with estate agents
%
A lower fee 31 Length of the contract 11 Charges if the property is taken off the market without a sale 7 Other 2 None 61
Base* 765 *All successful sellers who used a traditional estate agent
Source: Q111: Did you negotiate a lower fee with the agent from the one they initially offered?; Q111: did you negotiate any other terms of your contract with the estate agent? (Multi coded)
Sellers in London and the South East were more likely to have negotiated a lower fee (38% and 40% respectively) largely reflecting the more buoyant market in these regions and those selling properties in London were also more likely to have negotiated the length of their contract (17%). Considering that the average value of properties sold in London was £356,492 and the South East £296,150, compared to a national average of £266,043, it is not surprising that these sellers were more price sensitive. Less than one in four first time sellers (24%) had negotiated on their fees but again this was the inverse of the age differences where the under 45s were more likely to negotiate (37%) than those over 45 (29%).
27

Contract Length
Only two thirds of sellers (66%) could recall the length of their contract with their agent. Of those that could give a duration, two thirds (66%) had a contract of seven or more weeks (Figure 3- 6).
Figure 3- 3 Length of contract with estate agent
Base: All successful sellers who used a traditional agent and knew how long their contract had been (506) Source: Q112: And how long was your contract with the estate agent?
The vast majority (94%) of those sellers who could remember the length of their contract were happy to accept that length of time.
Fees paid to the agent
Two thirds (66%) of sellers agreed to pay their agent a percentage of the achieved sale figure as commission whilst 18% agreed a flat fee whether linked to their property value or not.
Table 3- 5 Type of fees paid to the agent
%
A percentage of the achieved sale price 66 A pre-defined flat fee irrespective of the value of your home 16 A pre-define flat fee that was linked to the value of your home 17 Other 1 Base* 765 *All successful sellers who used a traditional estate agent
Source:Q105: Thinking of the agent that eventually sold your property, did you agree to pay them..?
2% 2%
10%
19%
66%
<1 week 1-2 weeks3-4 weeks 5-6 weeks7+ weeks
28

First time sellers were notably more likely to sell on the basis of a flat fee that was not explicitly linked to the eventual sale value (25%) than experienced buyers (14%). The reasons are not clear from the data but may reflect some practices of minimum fees charged by agents for selling lower value properties.
Of those that agreed to pay a percentage and could recall the amount, over half (52%) paid between 1.0 and 1.4% commission with few paying 2% or more (Figure 3- 4)
Figure 3- 4 Agreed percentage of final sale paid as fee to agent (where able to recall)
Base: all successful sellers who had used a traditional agent and had agreed to pay them a percentage of the achieved sale value and could recall what this was (430) Source: Q107: Can you remember the percentage of commission you agreed to pay?
9%
52%
33%
6%
>1.0% 1.0-1.4 1.5-1.9% 2%+
29

Of those who agreed a fixed fee, and could recall the amount, over half (57%) reported paying up to £1500 for their sale. By December 2013, the average house price in the UK had reached £250,00011 for which a 1% commission would therefore be £2,500. As percentage commission has become more competitive between agents, fixed fees are sometimes now charged for the sale of lower value properties. Table 3- 6 Value of fee paid to agent
Value of fee paid % <=£1,000 39 £501-£1,000 19 £1,001-£1,500 18 £1,501-£2,000 16 £2,001-£2,500 8 £2,501-£3,000 5 £3,001-£4,000 7 £4,001+ 6 Base* 259 *All successful sellers using a traditional agent who agreed to pay their agent a fixed fee Source: Q108: Can you remember the fee you agreed to pay?
Nearly all fees (97%) were paid on completion of the sale with only a small minority entering into other agreements.
11 Office for National Statistics (2014) House Price Index December 2013 release www.ons.gov.uk/ons/rel/hpi/house-price-index/december-2013/stb-december-2013.html
30

The buyer experience
Viewing the property
Three in ten (30%) buyers only viewed the property they bought once before making an offer and over half (53%) viewed it twice with no noticeable differences between first time buyers (31%) and more experienced purchasers (29%).
Instead perception of the market had some influence, with those perceiving prices to be rising more likely to make a decision after one viewing (31%) compared to those who consider them to be falling (26%). This was consistent with some regional variation in the speed of decision reflecting housing market hotspots such as the South East (34%), East of England (33%) and London (31%) as well as other areas of the county such as Yorkshire and the Humber (31%).
Also those buying a flat or apartment (whether purpose built or converted) were more likely to make a decision after one viewing (34%) compared to those buying any type of house (29%). This was more pronounced when looking at the size of the property, with 42% of those buying a studio or one bedroom property making an offer after only one viewing compared to 29% of those buying a property with two or more bedrooms.
Figure 3- 5 Number of viewings before making an offer
Base: all successful buyers who used a traditional agent (979) Source: Q26 Can you recall how many times you viewed this property before making an offer?
One in five buyers (20%) would have preferred to view the property more before making their offer although interestingly this was not noticeably higher among those who had only had one viewing. Instead first time buyers, who lacked experience in
30%
53%
14%
2% 1%
1 2 3 4 5+
31

the market, were more likely to want to see the property again (29%) than those who had bought before (17%).
Reflecting the pressure on the market, buyers in London were most likely to say they would have like to have seen the property again (28%), as did buyers in the East of England (27%). Those in the South East seem less concerned with only 16% wishing they had seen the property again, although base sizes mean this should be interpreted with caution.
Figure 3- 6 Viewed property once and whether would have liked to have viewed property again by region (%)12
Base: All buyers who used a traditional agent – North East (45), North West (102), Yorkshire and the Humber (104), East Midlands (71), West Midlands (103), East of England (118), London (104), South East (139). South West (130), Wales (61) Source: Q26 Can you recall how many times you viewed this property before making an offer? Source: Q27 Would you have preferred to view the property further before making an offer?
Among those who would have liked to view the property again, there was a sense of pressure with 29% feeling they did not have time to go back again before offering and 24% making a decision because the agent told them there was a lot of interest in the property.
12 Due to low base sizes, some scores should be treated with caution
18 21
31
35
17
33 31
34
30
37
14
18
22
17 20
27 28
16 15
21
N.East N.West Yorks. E.Mids W.Mids EastEng.
Lond S.East S.West Wales
Viewed property once Would like to have viewed again
32

Table 3- 7 Reasons for buyers not viewing the property again
%
I did not have the time to go and view the property again 29 I offered because the estate agent told me there was a lot of interest in the property 24 I did not feel comfortable asking for another viewing 22 I was worried about prices going up generally 20 I offered because the estate agent set a deadline to decide 13 I was worried the seller would put the price up 12 My partner didn’t want to view the property again 9 Other 11
Base* 195 *All successful sellers who used a traditional agent and would have liked to view their property again Source: Q28: Why were you not able to view the property again? (Multi coded)
Information from the agent
We asked buyers what information they recall receiving when they viewed the property they went on to buy and, for those that did receive it, whether they found it helpful. Whilst the reporting of receiving essential information such as the asking price and a property description appears rather low this may be due to respondent interpretation. With most buyers initially inspecting properties on property sale portals they may consider that they got the information from the portal, although it had, of course, been uploaded by the agent.
As well as the essential information, we asked buyers what other types of information the agent provided alongside the viewings. Around half recalled the agent answering their questions at the time of viewings (56%) as well as confirming how long the property had been on the market (49%) and details of the seller’s position (46%). Fifty five per cent recalled having been provided with an Energy Performance Certificate (despite it being a legal requirement) although many may have recalled this as part of the property description. Most buyers found the information they recalled receiving helpful (Figure 3-7).
33
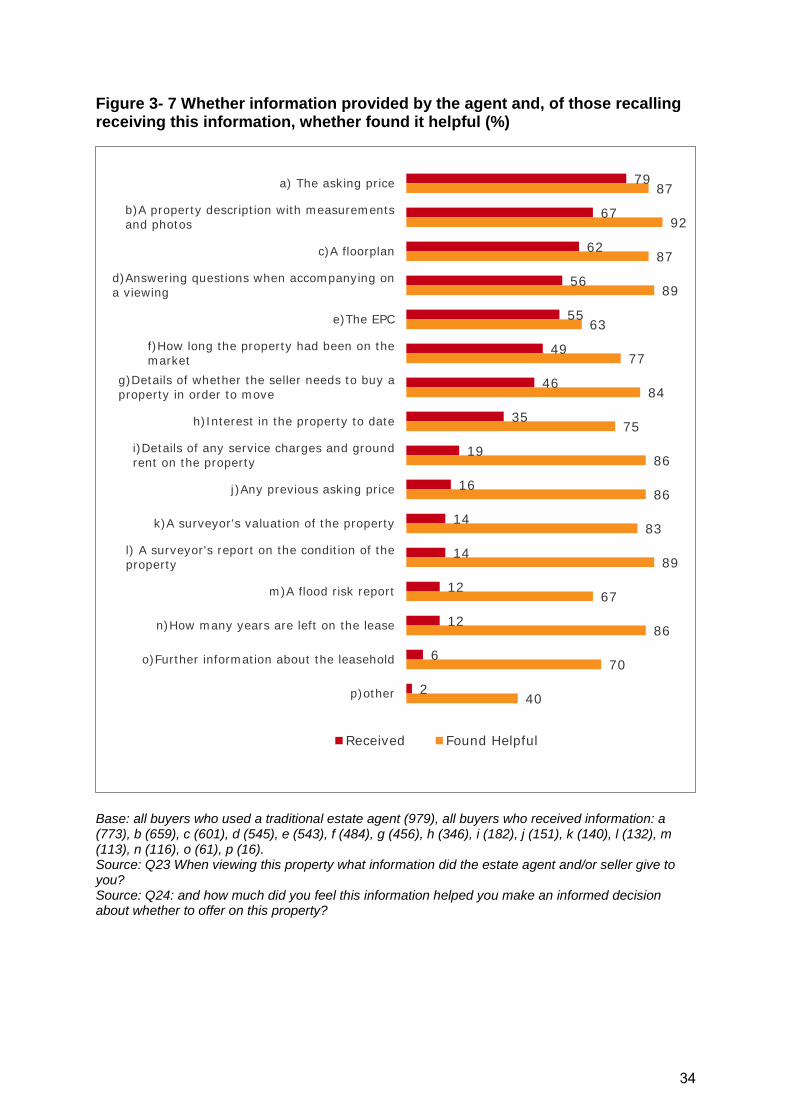
Figure 3- 7 Whether information provided by the agent and, of those recalling receiving this information, whether found it helpful (%)
Base: all buyers who used a traditional estate agent (979), all buyers who received information: a (773), b (659), c (601), d (545), e (543), f (484), g (456), h (346), i (182), j (151), k (140), l (132), m (113), n (116), o (61), p (16). Source: Q23 When viewing this property what information did the estate agent and/or seller give to you? Source: Q24: and how much did you feel this information helped you make an informed decision about whether to offer on this property?
79
67
62
56
55
49
46
35
19
16
14
14
12
12
6
2
87
92
87
89
63
77
84
75
86
86
83
89
67
86
70
40
a) The asking price
b)A property description with measurementsand photos
c)A floorplan
d)Answering questions when accompanying ona viewing
e)The EPC
f)How long the property had been on themarket
g)Details of whether the seller needs to buy aproperty in order to move
h)Interest in the property to date
i)Details of any service charges and groundrent on the property
j)Any previous asking price
k)A surveyor's valuation of the property
l) A surveyor's report on the condition of theproperty
m)A flood risk report
n)How many years are left on the lease
o)Further information about the leasehold
p)other
Received Found Helpful
34

Figure 3- 8 Information buyers would have liked to have received (%)
Base: successful buyers who used a traditional agent and did not receive information: a (206), b (320), c (378), d (434), e (436), f (495), g (523), h (633), i (797), j (828), k (839), l (847), m (866), n (863), o (918). Source: Q25: Would you have liked to receive any of these types of information at the time of viewing the property
We also asked the buyers whether the agent gave them any advice or information that may have influenced their decision to offer (Table 3- 8). Around one in four were told that the property was priced for a quick sale (26%) or that there had been a lot of interest in the property (23%). One in five buyers (20%) were told there had already been an offer on the property.
26
25
29
23
36
41
26
42
17
35
53
58
29
10
17
a)The asking price
b)A property description with measurementsand photos
c)A floorplan
d)Answering questions when accompanyingon a viewing
e)The EPC
f)How long the property had been on themarket
g)Details of whether the seller needs to buya property in order to move
h)Interest in the property to date
i)Details of any service charges and groundrent on the property
j)Any previous asking price
k)A surveyor's valuation of the property
l)A surveyor's report on the condition of theproperty
m)A flood risk report
n)How many years are left on the lease
o)Further information about the leasehold
Would have liked to receive
35

Table 3- 8 Advice given to buyers by agents
%
The seller wants a quick sale so it’s a good price 26 There was a lot of interest in the property 23 There had already been an offer on the property 20 That there aren’t many properties like this on the market 15 Someone was about to make an offer on the property 13 That you should make a sealed bid 1 None of the above 37 Base* 979 *All successful buyers who used a traditional agent
Source: Q29: Before you made your offer did the estate agent tell you or do any of the following? (Multi coded)
Advice from agents tended to follow expected regional patterns. Over one third of buyers in London (36%) were told there was a lot of interest in the property and over one quarter in both London and the South East (26%) were informed there had already been an offer. Londoners were put under further pressure being more likely to be told that someone was about to make an offer (21%). Buyers in Yorkshire and Humber were more likely to be told the property was priced for a quick sale (34% compared to only 21% in London).
Clearly advice will reflect the nature of the local market but we did ask whether respondents felt that as a result of these statements they made an offer sooner than they would have liked or at a higher level than they had planned. Of those who had received these types of advice from agents, nearly four in ten (39%) made took one of these actions; being told that someone else was about to make an offer was most likely to affect the buyers’ behaviour.
36

Figure 3- 9 Whether made a higher/sooner offer following the advice from agents13 (%)
Base: Successful buyers who were using traditional agents and were told: The seller wants a quick price so it’s a good price (257), There was a lot of interest in the property (217), There (had already been an offer on the property (196), That there aren’t many properties like this on the market (138), Someone was about to make an offer on the property (120) Source: Q30 Do you think any of these comments made you put in an offer [sooner,higher] than you wanted to?
First time buyers were more vulnerable to these pressure statements with 47% regretting the speed and/or level of their offer compared to 36% of experienced buyers.
Fees paid by buyers
Nearly three in ten (28%) of buyers reported being charged a fee by the seller’s agent for arranging the purchase. Although the question was clear that this excluded fees for additional services such as mortgage advice or surveyors recommended by the agent, or for the sale of their own property, it appears that buyers have included additional fees in their response. Of those charged a fee, over two thirds (67%) were aware of it up front, although awareness was lower among first time buyers (60%). The median level of fees was £600.
13 The statement ‘that you should make a sealed bid’ is not included due to low base size
20
27
21 17
35
22
6
13
19
8
20
12
5 10 8
5 5 5
The seller wants a quick price so it’s a
good price
There was a lotof interest inthe property
There hadalready been
an offer on theproperty
That there aren’t many
properties like this on the
market
Someone wasabout to makean offer on the
property
Total
Higher only Sooner only Both
37
4. From offer to completion
K Key findings
• The vast majority of offers were made in the conventional way via the estateagent. Only a small minority (2% of buyers and 3% of sellers) reported usingthe sealed bid process. Over half of agents (56%) did not offer the seller anyparticular advice about whether to accept the offer, whilst 41% told the sellerthat it was likely to be the best price they would get or that no other offers werelikely.
• Experienced sellers were better at establishing information about theprospective buyer from the agent at the time of offer, such as their financialcircumstances (68% compared to 58% of first time sellers) or whether thebuyer was in a position to move (64% compared to 51%)
• Properties were generally likely to have been taken off the market after theoffer was accepted but buyers were more likely to believe this had happened(88%) than sellers reported to be the case (77%).
• Even after the offer was accepted, most buyers (70%) and sellers (66%)continued to have at least one concern about whether they would definitelymake it to completion stage.
• Buyers were most commonly worried that a survey would reveal somethingunexpected (35%) and sellers tended to be concerned that the buyer wouldchange their mind and withdraw their offer (46%)
• Two in five (41%) buyers commissioned a homebuyer’s report. Those whodidn’t tended to be more experienced buyers who considered they could relyon their own knowledge and experienced to evaluate the property.
• For many (38% of buyers and 41% of sellers) the process took longer than theyexpected. As well as the stress and worry, particularly if the parties were in achain, around four in ten (38% of buyers and 42% of sellers) incurred costs asa result of the delay.
• At this stage it was most common to hold the other party’s solicitor responsiblefor the delays. Nearly half (47%) of buyers considered the seller’s solicitor tobe responsible, as did 58% of sellers believe about the buyer’s solicitor.
• Half of buyers (50%) said they would be willing to enter a legal commitmentupfront to agree on a schedule for exchanging contracts with the seller ifindependent survey and valuation information was available up front. Sellerswere more enthusiastic with 70% willing to enter into this type of contract.
38

This chapter focuses on the experience of both buyers and sellers between making or receiving the successful offer and completing the transaction. Again the sample is restricted to only those who bought or sold using a traditional estate agent.
Accepting the offer
We asked sellers about the offer that they accepted on their home and any advice that they received from their estate agent at the time. In total, over half (56%) of sellers said that their agent did not offer any particular advice over whether or not to accept the offer, whilst nearly four in ten (39%) encouraged the seller to accept saying no other offers were likely or that it was likely to be the best offer they would receive. One in twenty sellers (5%) accepted an offer despite the agent advising them to decline and wait for a better offer.
Table 4- 1- Advice offered to buyers by the estate agent for the accepted offer
%
Encouraged to accept, saying no other offers were likely 5 Encouraged to accept, saying it was best offer likely to receive 34 Encouraged to decline, saying other offers were likely 2 Encouraged to decline, saying you could get a better offer 3 Not offer any particular advice 56
Base*: 765 *All successful sellers who used a traditional estate agent
Souce: Q122: And did the agent…?
Most sellers (90%) received some level of information about the buyers’ circumstances at the time of the offer. Nearly three quarters (73%) were made aware whether the buyer was in a chain or not and two thirds (66%) received information about the buyers’ financial circumstances. First time sellers were less likely to elicit this type of information from their agent than those with more experience (Table 4- 2).
Table 4- 2 Information given to sellers by agents by whether first time seller
First Time Seller
Experienced Seller
% %
Information on the financial circumstances of the buyer 58 68 Information whether the buyer was in a chain 70 74 Information on whether the buyer was in a position to move – under offer/renting 51 64 Any personal information demonstrating the buyers’ commitment to move 25 35 Other information about the buyer 14 18 None 15 9 Base 174* 591** *Successful sellers who used a traditional estate agent and who did not sell a house before
**Successful sellers who used a traditional estate agent and who sold more than one house Source:Q123: And when advising you of the offer did the agent provide you any of the
following? (Multi coded)
39

Agents were also more likely to confirm if the buyer was in a position to move if the seller was in a chain (66%) than if not (56%).
Four per cent of sellers reported that they became aware at some point that an offer from a potential buyer had not been passed on to them by their estate agent which, for those that have agreed to comply with the Property Ombudsman Code of Practice for Residential Estate Agents14 would be a breach of the Code. Reports were higher among first time sellers (9%) and although base sizes are small, there appeared to a higher perception of this practice among younger sellers.
Taking the property off the market
Half of the buyers in our survey (50%) said they made it a condition of their offer that the property was taken off the market once their offer was accepted but only 23% of sellers reported receiving this condition as part of the offer. Similarly almost nine out of ten (88%) buyers believed the property was taken off the market after their offer was accepted but only just over three quarters (77%) of sellers reported doing so.
Figure 4- 1 Whether the property was taken off the market
Unweighted base: all successful sellers who used a traditional estate agent (765) Unweighted base: all successful buyers who used a traditional estate agent (979) Source: Q121. Did the estate agent take the property off the market once you had accepted the offer? Source: Q32. Did the estate agent take the property off the market once your offer had been accepted?
Buyers in property hotspots such as London, the South East and East of England were slightly more likely to make it a condition of their offer that the property should be taken off
14 The Property Ombudsman Code of Practice for Residential Estate Agents http://www.tpos.co.uk/downloads/TPOE27-3%20Code%20of%20Practice%20for%20Residential%20Estate%20Agents.pdf
50% 38%
12%
Yes – made it a condition of my offer
Yes – Agent did it anyway
No
Buyers
23%
54%
23%
Yes – buyer made it condition of their offer Yes – Agent did it anyway
No
Sellers
40
the market (59%, 55% and 52% respectively) as were those in a chain (54% compared to 43% of those who were not).
Buyers’ and sellers’ concerns after the offer was accepted
Buyers’ concerns
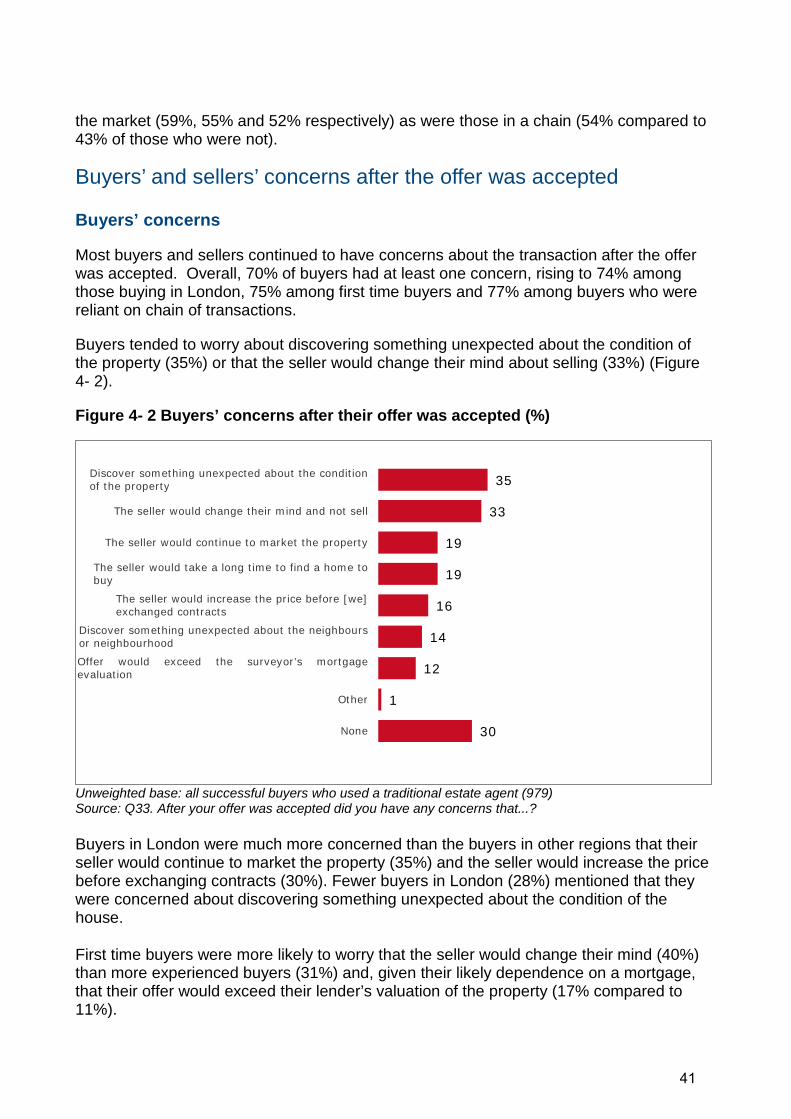
Most buyers and sellers continued to have concerns about the transaction after the offer was accepted. Overall, 70% of buyers had at least one concern, rising to 74% among those buying in London, 75% among first time buyers and 77% among buyers who were reliant on chain of transactions.
Buyers tended to worry about discovering something unexpected about the condition of the property (35%) or that the seller would change their mind about selling (33%) (Figure 4- 2).
Figure 4- 2 Buyers’ concerns after their offer was accepted (%)
Unweighted base: all successful buyers who used a traditional estate agent (979) Source: Q33. After your offer was accepted did you have any concerns that...?
Buyers in London were much more concerned than the buyers in other regions that their seller would continue to market the property (35%) and the seller would increase the price before exchanging contracts (30%). Fewer buyers in London (28%) mentioned that they were concerned about discovering something unexpected about the condition of the house.
First time buyers were more likely to worry that the seller would change their mind (40%) than more experienced buyers (31%) and, given their likely dependence on a mortgage, that their offer would exceed their lender’s valuation of the property (17% compared to 11%).
35
33
19
19
16
14
12
1
30
Discover something unexpected about the conditionof the property
The seller would change their mind and not sell
The seller would continue to market the property
The seller would take a long time to find a home tobuy
The seller would increase the price before [we]exchanged contracts
Discover something unexpected about the neighboursor neighbourhood
Offer would exceed the surveyor’s mortgage evaluation
Other
None
41

Buyers in a chain had different concerns reflecting their dependence on others in the process. They were most likely to worry that the seller would change their mind (39% compared to 25% of those not in a chain) and understandably concerned that the seller would take a long time to find a property to buy (28%). There does, however, appear to be some confusion with this question given that a small proportion of buyers and sellers who previously reported not being in chain reporting concerns about failures elsewhere in the chain at this question.
Figure 4- 3 Concerns after accepting the offer by whether in a chain (%).
Unweighted base: all successful buyers who were in a chain (562) and all successful buyers who were not in a chain (417) Source: Q33. After your offer was accepted did you have any concerns that...?
34
39
22
28
18
15
12
1
23
36
25
16
6
14
14
13
1
40
Discover something unexpected about thecondition of the property
The seller would change their mind and notsell
The seller would continue to market theproperty
The seller would take a long time to find ahome to buy
The seller would increase the price before[we] exchanged contracts
Discover something unexpected about theneighbours or neighbourhood
Offer would exceed the surveyor’s mortgage evaluation
Other
None
In a chain Not in a chain
42

Sellers’ Concerns
Two thirds of sellers (66%) continued to have concerns after they accepted the offer. They were most commonly concerned about the buyer withdrawing their offer (46%) or reducing it (26%). They also worried that buyers would continue to look at other properties even though they had begun the conveyancing process (22%) (Figure 4-4)
Figure 4- 4 Sellers’ concerns after their offer was accepted (%)
Unweighted base: all successful sellers who used a traditional estate agent (765) Source: Q125. After you accepted the offer, did you have any concerns that
First time sellers tended to be more concerned about the buyer withdrawing their offer (53%) than those with experience (44%) but otherwise there were fewer differences by region or type of seller. Sellers in a chain were additionally concerned about other transactions falling through (26%).
Sellers in a chain were additionally concerned about other transactions falling through (26%) which reflect their dependence on others. They were also slightly more concerned that (26%) the buyer would continue to look at other properties. Apart from that, sellers in a chain had similar concerns as those not in a chain. (Figure 4-5)
46
26
22
17
16
9
3
34
The buyer would change their mind and withdrawthe offer
The buyer would lower the price mid-process
The buyer would continue to look at other properties
The buyer would discover something unexpectedabout the condition of the house/ the neighbourhood
Other transactions in the chain falling through
The buyer’s offer would exceed their surveyor’s mortgage valuation
Other
None
43

Figure 4- 5 Concerns of the sellers in a chain after their offer was accepted (%)
Unweighted base: all successful sellers who were in chain (348) and all successful sellers who were not in a chain (417) Source: Q125. After you accepted the offer, did you have any concerns that…15
Willingness to Enter a Legal Commitment
Given the insecurity that underlies the process after the offer has been made, we asked if buyers or sellers would be willing to make a legal commitment to the other party committing them to exchange and complete to an agreed schedule, conditional upon having a fully independent survey and valuation available upfront. Overall, sellers were more prepared to consider this option (70%) than buyers (50%). Buyers were also more likely to be uncertain whether this was a good or bad idea (with 44% answering ‘maybe’ or ‘don’t know’ compared to 24% of sellers).
15 The survey did not prevent respondents reporting not being in a chain reporting concerns about the chain falling through.
45
24
26
17
24
9
2
28
The buyer would change their mind and withdrawthe offer
The buyer would lower the price mid-process
The buyer would continue to look at other properties
The buyer would discover something unexpectedabout the condition of the house/ the neighbourhood
Other transactions in the chain falling through
The buyer’s offer would exceed their surveyor’s mortgage valuation
Other
None
Sellers in a chain
Sellers not in a chain
8
3
34
44

Figure 4- 6 Willingness to enter a legally binding contract if a fully independent survey and valuation was available (%)
Unweighted base: all successful buyers who used a traditional estate agent (979) Source: Q34 If you had a fully certified and independent survey and valuation available up front, would you be willing to make a legal commitment with the seller to exchange/complete to an agreed schedule? Unweighted base: all successful sellers who used a traditional estate agent (765) Source: Q126. At the time of receiving the offer would you be willing to enter a legally binding contract with the buyer to exchange / complete to an agreed schedule?
First time buyers were the most nervous of this approach, with over half (54%) unable to give a firm answer, whereas more experienced buyers were more willing to contemplate this option with over half (52%) saying that they would be prepared to enter into a commitment (Figure 4- 7)
Figure 4- 7 First Time and Experienced Buyers’ willingness to enter a legally binding contract (%)
Unweighted base: First time buyers (234) and experienced buyers (745) Source: Q34 If you had a fully certified and independent survey and valuation available up front, would you be willing to make a legal commitment with the seller to exchange/complete to an agreed schedule?
50%
7%
33%
11%
Buyers
Yes No
Maybe/Not Sure Don't know
70%
6%
21%
3% Sellers
Yes No
Maybe/Not Sure Don’t know
41
6
38
16
52
7
32
9
Yes No Maybe/Not Sure Don't know
First time Buyers Experienced Buyers
45

Similarly, first time sellers were more apprehensive about entering into a commitment but in this case were more likely to conclude that they would firmly not want to do so (9%) rather than answering maybe or don’t know. (Figure 4-8).
Figure 4- 8 First time and experienced sellers’ willingness to enter a legally binding contract (%)
Unweighted base: Buyers in a chain (562) and buyers not in a chain (417) Source: Q34 If you had a fully certified and independent survey and valuation available up front, would you be willing to make a legal commitment with the seller to exchange/complete to an agreed schedule?
Buyers who were in a chain were most likely to be willing to enter a legally binding contract (54% compared to 44% of those not in a chain) (Figure 4- 9). Sellers did not show the same differences by whether in a chain (not shown).
Figure 4- 9 Buyers’ willingness to enter a legally binding contract by whether in a chain (%)
Unweighted base: Buyers in a chain (562) and buyers not in a chain (417) Source: Q34 If you had a fully certified and independent survey and valuation available up front, would you be willing to make a legal commitment with the seller to exchange/complete to an agreed schedule?
67
9
21
3
72
4
21
3
Yes No Maybe/Not Sure Don't know
First time seller Experienced Seller
54
8
29
9
44
5
39
12
Yes No Maybe/Not Sure Don't know
In a chain Not in a chain
46

Reasons for not wanting a legal contract
Of the 40% of buyers who responded that they would not be prepared to enter a contract or only ‘maybe’, 44% said they would prefer to have their own survey/valuation and 41% would not trust the independence of a survey commissioned by the seller. Three in ten (29%) said they would not be prepared to enter a legally binding commitment early in the process and 27% said they would be more comfortable using a surveyor they know and trust.
Figure 4- 10 Buyers’ reasons not to enter a legally binding contract upfront (%)
Unweighted base: Successful Buyers who were not willing to enter a legally binding contract with the seller if the seller provided a fully independent survey upfront (384) Source: Q35 Why is this? (follow up question after Q34)- Multi-code question
Sellers were more likely to be averse to entering a legal commitment this early in the process (53% of those who were not prepared to enter into a contract) and 44% of those who were not willing were concerned about factors beyond their control leading the transaction to collapse, resulting in financial penalties for them.
1
3
21
27
29
41
44
Other
I would still want to see other details aboutthe property
Would be concerned that external factorswould lead the sale to collapse and I would
be left with financial penalties
More comfortable using a surveyor I knowand I trust
Would not be willing to make a legallybinding commitment easrly in the process
Would not trust the independence of asurvey commissioned by a seller
Prefer to have my own survey/valuation
47

Figure 4- 11 Sellers’ reasons not to enter a legally binding contract upfront (%)
Unweighted base: Successful sellers who were not willing to enter a legally binding contract with the seller if the seller provided a fully independent survey upfront (198) Source: Q127 Why is this? (follow up question after Q126) Multi-code question
Surveys and valuations
Eighty five per cent of buyers commissioned a valuation and/or survey on the property they went on to buy (Figure 4-12). Indeed nearly four in ten (39%) reported paying for a full structural survey, especially if they were buying a house rather than flat/apartment (41% compared to 24%). First time buyers were understandably more likely to receive a lender’s valuation given the high dependency on borrowing to fund their purchase.
Buyers in London were the most likely to seek independent advice before proceeding with only one in ten (9%) commissioning no inspections of the property.
2
24
23
29
29
44
Other
Would be concerned about limiting the timeavailable to find somewhere to live after
selling
Would want to see if better offers wereavailable
Would not be willing to make a legallybinding commitment easrly in the process
Would not be willing to make a legallybinding commitment easrly in the process
Would be concerned that external factorswould lead the sale to collapse and I would
be left with financial penalties
48

Figure 4- 12 Surveys and valuations commissioned by the buyer (%)
Unweighted base: all successful buyers who used a traditional estate agent (979) ‘Any type of survey’ comprises of mortgage valuation, homebuyer’s report and full structural survey. Source: Q41. Which, if any, of the following did you have completed on the property?
Buyers who did not commission a survey or homebuyer’s report were also less likely to be concerned about finding out anything unexpected about the property. Over half of this group (56%) did not report any concerns subsequent to their offer being accepted. When we asked why they took this option we found a considerable proportion were confident buyers who were happy to rely on their own knowledge or experience, others were buying relatively new homes that were still under NHBC guarantee and some had condition information provided by the seller. Only a minority of this group took this decision because they thought it was too expensive.
Table 4- 3 Buyers’ reasons for not commissioning a survey or homebuyer’s report
%
Rely on own knowledge and experience 41 Too expensive 17 Seller provided survey 15 Nearly new (NHBC guarantee) 11 Lender didn’t require one 1 Other 16
Base* 146 *All successful buyers who used a traditional agent and who did not commission a survey or valuation Source: Q42: Why did you choose not to have a homebuyer’s report or building survey done on the property? (Multi coded)
Trusting a survey provided by the seller?
Having considered a legal commitment, we went on to ask buyers if they would still commission their own survey if the seller provided a fully certified and independent survey and valuation of the property. Generally buyers were unsure with 51% answering ‘maybe’ or ‘don’t know’. Only one in five buyers (21%) would trust a survey provided by the seller and 29% said they would still commission their own.
43
41
39
81
17
13
15
Mortgage valuation for lender
Homebuyer’s report
Full structural survey
Any type of survey
Specialist survey
Inspection by local tradesperson
None
49

Figure 4- 13 Would buyers commission their own survey if the seller provided a fully certified, independent survey upfront?
Unweighted base: all successful buyers who used a traditional estate agent (979) Source: Q36 If the seller provided a fully certified, independent survey of the property, would you commission your own?
Buyers’ explanations for still commissioning their own survey focussed on trust and knowing the report was independent. Respondents said:
“I wouldn't trust it; I would want one of my own in case it had been manipulated.”
“A big purchase like this I would want to be totally sure everything was OK”
“Always safer to have a second opinion when dealing with such a large investment. However if there was a method of independent survey mandatory as part of the sale then both parties could be protected”
Renegotiating the offer
Despite considerable concern from buyers, only 2% of sellers demanded a higher sale price after they had accepted the offer (with consistent reports of this occurrence from both buyers and sellers). Whilst a small group, about a third of these sellers had received a higher offer from another party.
Buyers were more likely to reduce the offer, usually as a result of information uncovered in the survey. In total, around one in five (19%) of buyers reduced their offer price. Nearly half of these (48%) were because of information in the survey with a further 11% receiving a lender valuation that was lower than their offer (some received both). But over one third of buyers who reduced their offer (38%) simply ‘wanted to achieve a better deal’, sometimes because they perceived the market to be falling or had been put in this position by their own buyer reducing their offer (Figure 4- 14).
29%
21%
43%
8%
Yes NoMay be Don't know
50

Figure 4- 14 Buyers’ reasons for reducing their offer on the property after their offer was accepted (%)
Unweighted base: All successful buyers using a traditional agent who reduced their offer as a result of commissioning surveys on their property (118) and all successful buyers using a traditional agent who reduced their offer for reasons aside from the findings of surveys on their property (112) Source: Q43. Did any of those you had completed on the property lead you to reduce your offer on the property; and Q45. Did you reduce your offer on the property for any [other] reasons?
Although numbers are small, there seemed to be a higher level of buyers reducing their offer in the West Midlands for reasons other than the information provided in the survey or valuation (20% compared to 11% nationally). Most of these buyers reported simply that they wanted to achieve a better deal.
Not surprisingly, the older the property being bought or sold, the more likely there were to be complications. Buyers of older properties were both more likely to reduce their offer and, among those that did, more likely to say it was because of information that came to light in the survey (Table 4- 14).
6
1
3
7
7
38
2
14
48
Other (non-survey)
I was not made aware the of the level of…
I would need to pay to extend the lease
The market was falling
The person buying my home reduced their…
I wanted to achieve a better deal
Other (survey)
Lender's valuation was lower than my offer
Survey revealed new information about…
51

Table 4- 4 Buyers reducing their offer as a result of a survey by age of property
Pre-1900
1900-1944
1945-1964
1965-1989
1990-2003
2004 or later
% % % % % %
Reduced their offer after survey 22 17 11 13 6 6 Reduced their offer for other reasons 9 14 11 10 10 11
Base: all who commissioned a survey 117 204 135 307 135 81
Source: Q43: did you any of those you had completed on the property lead you to reduce your offer on the property? Q45:Did you reduce your offer on the property for any other reasons?
In most cases the reduced offer was accepted by the seller (63%) although around a quarter (24%) negotiated a figure in between and 13% of buyers reported that their seller insisted on the original asking price.
Sellers appeared to have much lower recall of price negotiations with only 8% reporting that their buyer reduced their offer.
Delays and their impacts
Around four in ten buyers (38%) and sellers (41%) said that in their opinion, the exchange of contracts was delayed.
Figure 4- 15 Whether experienced delays in exchanging contracts, buyers and sellers
Unweighted base: all successful buyers who used a traditional estate agent (979) Unweighted base: all successful sellers who used a traditional estate agent (765) Source: Q55/Q139 Would you say that your exchange of contract was delayed?
Of those reporting delays over four in ten buyers and half of sellers reported a delay of five weeks or more over and above what they originally expected.
38%
62%
Buyers
Yes No
41%
59%
Sellers
Yes No
52

Figure 4- 16 The length of delay in exchanging contracts (%)
Unweighted base: all successful buyers who were delayed with exchanging contracts (362) Source: Q58. How long would you say you were delayed in exchanging contracts? Unweighted base: all successful sellers who were delayed with exchanging contracts (307) Source: Q142. How long would you say you were delayed in exchanging contracts?
Unsurprisingly, those in a chain were most likely to experience delays; affecting 41% of buyers and 42% of sellers in a chain. And as we discuss in Chapter 4, those who experienced delays were more likely to have been dissatisfied with some aspect of the service they received as part of the process and similarly, more likely to have complained.
Those buying flats or apartments (whether purpose built or converted) were more likely to suffer delays (45% compared to 36% of those buying houses) but this did not seem to be driven by specific issues with leasehold properties. Neither was it largely driven potentially unrealistic expectations of younger first time buyers who were more likely to be buying flats; 40% of first time buyers reported delays compared to 37% of experienced buyers.
Delays in the process are a source of both stress and cost to the parties involved. Of those who experienced delays, over six out of ten buyers (62%) and sellers (69%) reported stress and worry as a result of the delay. In total, around four in ten buyers (38%) and sellers (42%) who experienced delays reported some additional costs (see below) as a result of the delay, this amounts to about one in seven of all buyers and sellers having to find additional funds as part of their transaction as a result of delays.
3
15
42
14
26
Less than 1 week
1-2 weeks
3-4 weeks
5-6 weeks
More than 6 weeks
Buyers
2
16
34
26
24
Less than 1 week
1-2 weeks
3-4 weeks
5-6 weeks
More than 6 weeks
Sellers
53

Table 4- 5 Average cost of delays
Average cost incurred by delay
£
Seller only 747 Seller and buyer 919 Buyer only 665 Buyer and seller 714
Source: Q60: Did you incur any additional costs as a result of the delays? Q144: Did you incur any additional costs as a result of the delays? Note: figures based on small base sizes and should be treated with caution
Nearly one in five buyers who experienced delays (18%) had to pay for temporary rented accommodation or put their possessions into storage while they lived elsewhere (11%) in order to ensure the sale of their own property still went through even if their purchase was delayed. Sellers were slightly less affected by a delay to their sale with 7% of those who experienced delays moving into rented accommodation to allow the sale to grow through without further delay and 6% paying for storage.
Over half of buyers (57%) and nearly four in ten sellers (39%) who reported delays considered they had to reschedule their completion date to accommodate the delay. Buyers may have had more ambitious plans for completion but this still amounts to over one in seven of all sellers and one in four of all buyers not achieving their desired completion date.
Responsibility
Sellers were more likely to identify the buyer’s solicitor or licensed conveyancer as most responsible for the delay (36%) compared to the proportion of buyers blaming the seller’s solicitor (24%). Consistent with this, buyers were indeed more likely to find their own solicitor mainly responsible (16%) than sellers (12%). Quite similar proportions blamed each other directly (with 22% of sellers blaming the buyer and 24% of buyers blaming the seller).
54

Buyers were also more likely to point to problems elsewhere in the chain than sellers (16% compared to 10%). Figure 4- 17 Who was most responsible for the delay- buyers (%)
Unweighted base: Successful buyers whose exchange of contract was delayed (362) Source: Q56. Who or what would you say was the most responsible for the delay? Unweighted base: Successful sellers whose exchange of contract was delayed (307) Source: Q140. Who or what would you say was the most responsible for the delay?
22
36
12
4
2
1
11
10
The buyer
The buyers’ solicitor
The sellers’ solicitor
Estate Agents
Local authorities
Mortgage lender
Problem elsewherein the chain
Other
Sellers 24
23
16
1
4
5
16
7
The sellers
The sellers' solicitor
The buyers' solicitor
Estate agents
Local authorities
Mortgage lender
Problem elsewherein the chain
Other
Buyers
55

5. Satisfaction with the home buying and selling process
In this chapter we explore the levels of satisfaction among buyers and sellers with the service they received from estate agents and other professionals involved in completing the transaction.
Key findings
• The majority of buyers and sellers were satisfied with the service they received from estate agents (81% satisfaction among buyers and 84% among sellers)
• Buyers and sellers were most likely to be dissatisfied with each other’s solicitor with 32% of sellers and 28% of buyers dissatisfied with the other party’s solicitor.
• Most dissatisfied buyers and sellers did not complain about the service they were unhappy with. When they were asked why, most said they did not think it was worth it or they simply wanted to forget and move on.
• In their opinion, 59% of buyers and 57% of sellers found the process longer than they expected.
• Despite finding it longer than their expectations, more than half of buyers (55%) and sellers (60%) found the process straightforward.
• Those who found the process complicated tended to report issues with solicitors (24% of buyer sand 31% of sellers), over issues with estate agents (7% of buyers and 15% of sellers).
56

Estate agents
Overall satisfaction
Over four out of five buyers (82%) and sellers (83%) were satisfied with the service they received from the agent they bought and sold their property through. Sellers, who would have had more dealings with their agent, were more likely to be very satisfied (33%) (Figure 5-1)
Figure 5- 1 Satisfaction with Estate Agents’ Services- Buyers and Sellers (%)
Unweighted base: all successful buyers who used a traditional estate agent (979) Unweighted base: all successful sellers who used a traditional estate agent (765) Source: Q61/Q149. How satisfied were you with the services provided by…?
Satisfaction with estate agents was much lower among buyers who experienced delays (68%) despite only 4% of them actually holding the agent responsible for these delays (Chapter 3). By contrast, sellers experiencing delays showed no lower levels of satisfaction (85%) than their counterparts who had a quicker sale. Given the seller is the client of the estate agent, we might assume that communication during a delay period may be better with the seller than the buyer.
Interestingly, the experience diverges in London, where buyers were less likely to be satisfied with the estate agent than other regions (73%) and more likely to be actively dissatisfied (22%) whilst sellers were more satisfied (88%) than elsewhere.
Aspects of estate agents’ services for sellers
We explored satisfaction with estate agents among sellers in more detail following their experience from their initial appointment of the agent to completing the sale. Levels of satisfaction were generally very high (around 80% for most aspects) with only slightly lower levels (77%) of satisfaction with the agents’ role in chasing progress at the closing stages between exchange and completion.
25
57
13
4
1
33
50
11
5
0
Very satisfied
Quite satisfied
Quite dissatisfied
Very dissatisfied
n/a
BuyersSellers
57

Figure 5- 2 Sellers’ satisfaction level with the services received from their estate agents (%)
Unweighted base: all successful sellers who used a traditional estate agent (765) Source: Q146. How satisfied were you each of these aspects of the service from the agent that sold your home?
Thinking about the fees that they paid to the agent, two thirds (66%) of sellers considered them to be good or very good value for money with nearly three in ten (29%) concluding they were not very good value for money. Only 5% of sellers went as far as saying that they thought their agent provided very bad value for money.
90
89
87
87
83
81
81
79
79
79
77
1
1
6
1
3
1
2
10
0
1
3
9
10
7
12
14
18
17
11
21
20
20
Quality of advertising
Advice on likely selling price
Advice on EPC
Accessibility/ ability to contact
Suitability of potential buyers
Numbers of viewings arranged
Support/advice during negotiations
Accompanying viewings
Keeping seller informed about the progress
Working in sellers’ best interests
Chasing progress after exchange of contracts
Satisfied n/a Dissatisfied2
58

Table 5- 1 Sellers’ feelings on their agents’ value for money by region
(%)Region N.Eas N.Wes Yorks E.Mids W.Mids East Lon S.Eas S.Wes Wales
% % % % % % % % % %
NET: Good value 75 60 63 62 62 66 68 68 68 64 Not very good value 18 36 30 32 31 28 29 30 24 30 Very bad value 7 4 7 6 7 7 2 2 9 6
Base* 48 84 67 61 79 87 78 115 93 52
*Successful sellers who used a traditional agrent
Source: Q147: Do you think the fees that you paid the agent represented
Of the one third who did not rate agents’ value positively, there was one set of concerns that the fee seemed disproportionate to the effort required in that ‘they did not earn it’ (55%), ‘did not have much to do (49%) or ‘the home sold very quickly’ (22%) whilst remaining concerns were about the quality of the service that the agent delivered either generally that ‘they gave poor service’ (22%), or specifically that there was ‘poor communication/no feedback’ (28%), they ‘made little effort to advertise’ (22%) or ‘I had to do most of the work myself’ (21%) (Table 5-1).
Table 5- 2 Why sellers didn’t consider estate agents’ services value for money
%
They didn’t earn it 55 They didn’t have to do much 49 Poor communication/no feedback 28 They gave poor service 26 The sold very quickly 22 I had to do most of the work myself 21 They made little effort to advertise 12 They only put in effort it at the end of the contract 11 Other 9
Base* 261 *Successful sellers who did not believe their estate agent gave good value for money
Source: Q148:Why do you say that? (Multi code)
Complaining about the service from estate agents
Over one third (34%) of the sellers who were dissatisfied with their agent went on to complain. Although the group is too small for further analysis, the majority complained directly to the estate agent, typically achieving nothing or an apology. Of the majority that didn’t complain, typical answers given involved a lack of belief in any benefit that could come of it, typically that ‘it wasn’t worth it (56%) or they ‘wanted to move on and forget about it’ (39%) ‘could not be bothered’ (24%) or didn’t want to ‘make matters worse’ (17%). Some disgruntled sellers were put off pursuing a complaint because they didn’t know who to complain to (21%) or considered the process too complex (8%).
59

Dissatisfied buyers were even less likely to complain (20%) and again it was unlikely to amount to more than apology for those who did.
Similar to sellers, more than half of the dissatisfied buyers didn’t complain because they didn’t think it was worth it (59%) or they ‘wanted to move on and forget about it’ (40%), could not be bothered (24%) or didn’t want to make the matters worse (16%). Thirteen per cent found the process too complex to complain and 17% didn’t know who to complain to.
Satisfaction with other services
Buyers
Of the other services that buyers relied on to buy their home, they were most satisfied with their own solicitor (84%) but far more likely to be disgruntled with the seller’s solicitor (67% satisfaction, 28% dissatisfaction). The majority (81%) were happy with the efficiency of their Local Searches and their own surveyor (70%) (Figure 5-3).
Again, not surprisingly, levels of satisfaction with solicitors fell considerably among buyers who’d experience delays (to 65%).
Figure 5- 3 Buyers’ satisfaction with other services (%)
Unweighted base: all successful buyers who used a traditional estate agent (979) Source: Q61 How satisfied were you with the services provided by…?
First time buyers showed considerably lower levels of satisfaction with their solicitors (73%) as did buyers in London (75%)
85
71
86
89
92
15
29
14
11
8
Buyers’ solicitor/licensed conveyancer
Sellers’ solicitor/ licensed conveyancer
The Local Authority (for localsearches)
Buyers’ mortgage lender
Buyers’ surveyor
Net Satisfied Net Dissatisfied
60

Sellers
Sellers’ satisfaction levels were largely similar to buyers (and similarly high with their EPC provider) with nearly one third (34%) reporting being dissatisfied with the other party’s solicitor.
Figure 5- 4 Sellers’ satisfaction with other stakeholders (%)
Unweighted base: all successful sellers who used a traditional estate agent (765) Source: Q149 How satisfied were you with the services provided by…?
Complaints about other services.
Most people who were dissatisfied with a service did not complain. Understandably, respondents were more likely to have complained if they had a direct relationship with the service provider rather than when they were acting on behalf of the other party. Over one third of buyers and sellers who were dissatisfied with their own solicitor complained (33% and 39% respectively), as did sellers who were dissatisfied with their estate agent (36%).
Table 5- 3 Proportion of dissatisfied buyers who complained to..
% Base
Their solicitor 33 152 The seller’s solicitor 16 276 The Local Authority 7 123 Base: successful buyers who were dissatisfied with the service
Table 5- 4 The proportion of dissatisfied sellers who complained
% Base
Their solicitor 39 115 The buyer’s solicitor 20 240 The EPC Providers 7 58 Base: successful sellers who were dissatisfied with the service
85
66
92
15
34
8
Sellers’ solicitor/licensed conveyancer
Buyers’ solicitor/ licensed conveyancer
The EPC provider
Satisfied Dissatisfied
61

Buyers who chose not to complain tended to think it wasn’t worth it or preferred to move on and forget about it. Depending on the service, between one in five and one in four dissatisfied buyers were put off from complaining because they thought the process would be too complex or did not know who to complain to (Table 5-4).
Table 5- 5 Why buyers did not complain about the services they were dissatisfied with
Their Solicitor
Sellers Solicitor
Local Authority
Their mortgage Lenders
Their Surveyor
% % % % %
Didn’t think it was worth it 44 51 41 32 38 Wanted to move on and forget about it 33 37 22 17 19 Didn’t want to make matters worse 10 17 9 16 20 Could not be bothered 15 21 23 12 24 Always expected there were bound to be problems anyway 18 17 15 18 13 Didn’t know who to complain to 11 15 16 5 12 Process too complex 8 10 10 15 11 Base* 102 232 115 41 61 *Buyers dissatisfied with the services specified and who did not complain
Source:Q78: Why did you not complain given your satisfaction with….? (Multi coded)
Similarly, sellers were most likely not to complain because they didn’t think it was worth it or wanted to move on. Although numbers are small, they were slightly more likely to say they found the process too complicated or did not know who to complain to (Table 5-5)
Table 5- 6 Why sellers did not complain about the services they were dissatisfied with:
Their solicitor
Buyers’ solicitor
The EPC provider
% % %
Didn’t think it was worth it 65 56 51 Wanted to move on and forget about it 45 38 22 Didn’t want to make matters worse 22 24 8 Could not be bothered 20 22 20 Always expected there were bound to be problems anyway 19 22 10 Didn’t know who to complain to 16 22 32 Process too complex 14 12 10
Base* 69 192 53 *Sellers dissatisfied with the services specified and who did not complain Source: Q160:Why did you not complain about your problems with…? (Multi coded)
62

Length and complexity of the process
In all, over half buyers (59%) and sellers (57%) found the process of buying and selling a home longer than they expected; around one in four found it much longer than expected.
Figure 5- 5 Whether the process was longer than expectations (%)
Unweighted base: all successful buyers who used a traditional estate agent (979) Unweighted base: all successful sellers who used a traditional estate agent (765) Source: Q52/Q136 Thinking of the time it took from accepting the offer on this home to completing the sale, did it take…?
As would be expected, buyers who were in a chain were more likely to find the process longer than expected (65% of buyers) and reporting dissatisfaction with the process, complaining and finding the process too long were all highly associated with each other. Whereas 50% of those not in a chain said the process was longer than they expected. Although base sizes are small and should be interpreted with caution there did appear to be some regional variation with buyers in the East of England more likely to find the process too longer (70%) compared to 42% in the West Midlands.
Sellers in a chain were as likely as those not in a chain to find the process longer than their expectations (57% each) There was not any significant variation across regions among sellers.
Although over half of buyers and sellers found the whole process quite straightforward, nearly in one in four (24% of buyers and 23% of sellers) reported finding it complicated (Figure 5-6).
23
36
39
1
1
25
32
38
4
1
Much Longer
A little longer
About as long asexpected
A little shorter
Much shorter
BuyersSellers
63

Figure 5- 6 How straightforward/complicated the process was
Unweighted base: all successful buyers who used a traditional estate agent (979) Unweighted base: all successful sellers who used a traditional estate agent (765) Source: Q53/Q137 Thinking of the time it took from accepting the offer on this home to completing the sale, did it take…?
Given their inexperience, it is understandable that a lower proportion (44%) of first time buyers found the process straightforward compared with experienced buyers (58%). Consistent with their higher levels of satisfaction with the length of the process, buyers in the West Midlands were more likely to find the process straightforward (65%), whilst buyers in the East of England, with their frustrations about the length of the process, were more likely to find it complicated.
Again, not surprisingly, buyers and sellers who were dissatisfied and/or complained about a service were more likely to consider the process complicated.
Of those who found the process complicated, it was most commonly a mixture of frustration with the process taking too long and issues with solicitors and licensed conveyancers (Table 5-6)
55
20
24
60
17
23
Straightforward
Neither
Complicated
Buyers Sellers
64

Table 5- 7 Why buyers and sellers found the process complicated.
Buyers Sellers
% %
Issues with solicitors/conveyancers 24 31 Took too long 20 19 Issues with seller/buyer 19 23 Lack of communication 9 15 Issues with estate agent 7 15
Base* 234 176 *Successful buyers/sellers who found the process complicated
Source: Q137 Thinking of the time from accepting the offer to completing the sale would you say the process was…? Q53 Thinking of the time from making the offer to completing the purchase would you say the process was…?
All successful buyers and sellers were asked what they would have done differently if they had bought a property again. Both buyers and sellers said they would negotiate harder on price next time (51% and 39% respectively). Otherwise buyers would take more time to understand what work might need doing to the property and how much it might cost whereas one in four sellers said that (Table 5-5, Table 5-6). Table 5-8- What buyers would do differently if they bought a property again
%
Negotiate harder on the price 51 Have quotes for any work that needed doing to the property before making an offer 24 Insist on more viewings before making an offer 15 Have a buildings or structural survey done 15 Have a homebuyer's report done 11 Arrange my mortgage before making an offer 9
Base* 979 *Successful buyers who used a traditional estate agent
Source: Q79: If you were buying this home again, what would you do differently? (Multi coded)
65

Both first time and experienced buyers were equally likely to plan to negotiate harder next time whilst first time buyers had learnt to arrange their mortgage before making an offer in the future (15%).
Table 5-9- What sellers would do differently if they sold a property again
%
Negotiate harder on the price 39 Use a different estate agent 25 Use a different solicitor 17 Sell the house myself 15
Base* 765 *Successful sellers who used a traditional estate agent
Source: Q161: If you were selling this home again, what would you do differently? (Multi coded)
As well as negotiating harder, one in four agents (24%) said they would use a different estate agent if they had their time again. Whilst dissatisfaction levels with agents were low, this appears to be associated with finding the agent to be poor value for money. Fewer than one in five (18%) of sellers would have used a different solicitor rising to 28% among those who were dissatisfied.
In all, when asked what could improve the home buying process, over one in four (26%) buyers said they were happy with the system and it did not need improvement. However, the most common area identified for improvement was a faster service from solicitors (34%) as well as the provision of a survey or home condition report for information (29%) as well as other information about the property up front (21%). Sellers were even more likely to be happy with the system (32%) but others were seeking a legally binding commitment to offers (38%) as well as, again, a faster service from solicitors (31%).
66

Table 5-9- What sellers would do differently if they sold a property again
Buyers Sellers % % Nothing, happy with the process 26 32 Any type of improvement 74 68 Faster service from the solicitor/conveyancer 34 31 Able to exchange contracts earlier and pay a deposit 21 24 Provide survey/home condition report up front 29 14 Make offers legally binding - 38 Provide more information on the home up front 21 8 More legal commitment up front 17 - Faster service from estate agents 15 17 Thorough checks up the chain that buyers have sufficient funds 8 15
Base* *Succesful buyers/sellers who used a traditional agent Source: Q80 What could improve the home buying process?, Q162 What could improve the home selling process? Top five changes for each group shown
67

6. Failed transactions
Key findings
• Sellers who had now successfully sold their property were more likely to haveexperienced a previous attempt to sell fall through after the offer wasaccepted (21%) than buyers a previous attempt to buy prior to a successfulpurchase (13%).
• We conducted an additional survey about these failed transactions with thisgroup, supplemented with a sample of home buyers and sellers who had alsoexperienced transaction failure in the last two years but had not, by the time ofinterview, gone on to successfully buy or sell a home.
• Buyers who’d experience a purchase fall through were more likely to point toproblems identified in the survey as the cause of the failure than personalreasons (15%) whereas sellers were more likely to consider it was the buyers’personal circumstances that cause them to withdraw (37%)
• Although buyers were less likely to experience failure, when they did, theywere more likely to incur costs (56%) than sellers (44%). Most commonly thiswas on survey or valuation fees (74%) whereas sellers were more likely tohave spent money on solicitors’ fees.
• Although estimates are approximate, of those who experienced transactionfailure, about one in four buyers (24%) and sellers (25%) had wasted morethan a £1,000 in their failed attempt.
68
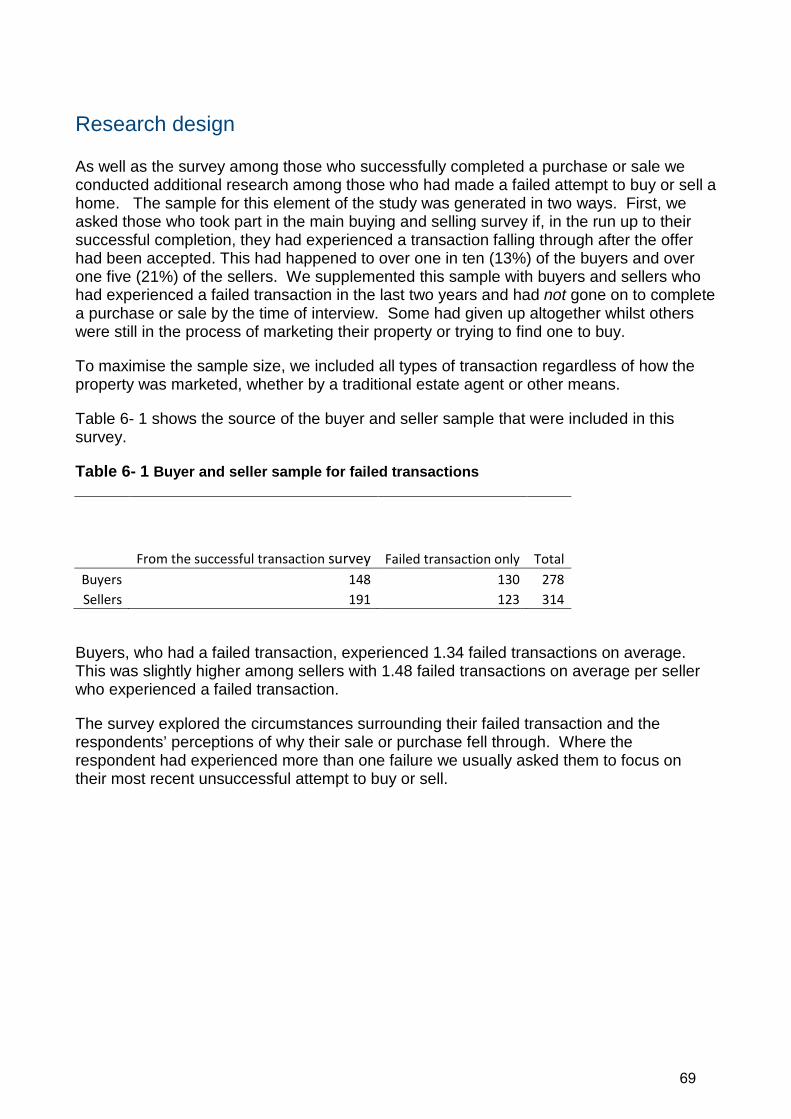
Research design
As well as the survey among those who successfully completed a purchase or sale we conducted additional research among those who had made a failed attempt to buy or sell a home. The sample for this element of the study was generated in two ways. First, we asked those who took part in the main buying and selling survey if, in the run up to their successful completion, they had experienced a transaction falling through after the offer had been accepted. This had happened to over one in ten (13%) of the buyers and over one five (21%) of the sellers. We supplemented this sample with buyers and sellers who had experienced a failed transaction in the last two years and had not gone on to complete a purchase or sale by the time of interview. Some had given up altogether whilst others were still in the process of marketing their property or trying to find one to buy.
To maximise the sample size, we included all types of transaction regardless of how the property was marketed, whether by a traditional estate agent or other means.
Table 6- 1 shows the source of the buyer and seller sample that were included in this survey.
Table 6- 1 Buyer and seller sample for failed transactions
From the successful transaction survey Failed transaction only Total Buyers 148 130 278 Sellers 191 123 314
Buyers, who had a failed transaction, experienced 1.34 failed transactions on average. This was slightly higher among sellers with 1.48 failed transactions on average per seller who experienced a failed transaction.
The survey explored the circumstances surrounding their failed transaction and the respondents’ perceptions of why their sale or purchase fell through. Where the respondent had experienced more than one failure we usually asked them to focus on their most recent unsuccessful attempt to buy or sell.
69

Reasons for failure
The buyer’s perspective
Nearly four in ten buyers reported that they withdrew their offer either because of personal or financial circumstances or they encountered issues with the home following a survey or problems with the leasehold.
The remainder lost the property due to the actions of others either because they were gazumped (13%), the seller withdrew without explanation (10%) or the chain collapsed elsewhere (9%).
Table 6- 2 Reasons given by buyers for the collapse of their purchase
Reasons %
I withdrew my offer for personal reasons 17 I withdrew following a survey that showed problems 16 I didn’t have sufficient funds/the lender would not agree the funds needed 5 Leasehold related issues 4
Another buyer made a better offer (gazumped) 13 The seller withdrew without explanation 10 The seller hadn’t found a property or accommodation 6 Other seller related reasons 8
Problem elsewhere in the chain 9
Other reasons16 12 Base* 278 *Buyers who experienced transaction failure
Source:Q169: thinking of the most recent property that you had an offer accepted on, can you say why the purchase fell through?
16 Where less than 2% of respondents gave this reason.
70

The seller’s perspective
In contrast to the buyers’ perspective, over seven out of ten sellers held the buyers responsible for the failure both for personal reasons and because they could not raise the funds. They were less likely to say the sale fell through because the buyer was concerned about a problem identified in the survey.
Further, only 1% of sellers said the transaction failed because they accepted a higher offer (gazumping). Whilst there has been concern about ‘ghost gazumping’ in recent years, where buyers are led to believe that another party has made a higher offer in order to either obtain a higher price or an agent wishes to put the property back on the market at a higher level, we cannot say for sure whether this is part of the explanation for buyers tending to report gazumping far more often than sellers as well as any reluctance among sellers to admit this practice.
Reports of the chain collapsing were similar to buyers (9%).
Table 6- 1 Sellers’ reasons for collapse of their transaction
Reasons %
The buyer withdrew for personal reasons 35 The buyer withdrew following a survey that showed problems 8 The buyer did not have sufficient funds / the lender would not agree the funds needed 28
Accepted a better offer from a different buyer 1
Problem elsewhere in the chain 9
Other reasons17 16 Base* 278
*Sellers who experienced transaction failureSource: Q174: Thinking of the most recent offer that you accepted but the sale fell through, can you recall why the purchase fell through?
17 Where less than 2% of respondents gave this reason.
71

The cost of a failed transaction to buyers and sellers
It is notoriously difficult to ask those involved in buying and selling to unpick the specific costs of a failed attempt to buy or sell. Fees can be complicated and obscured by the total outlay on the final successful transaction. We asked respondents in this survey to give us a broad indication of how much and what type of expense they believe they had incurred in total on all of their failed attempts to buy or sell either in the run up to their successful transaction or their most recent unsuccessful attempts. Although, to minimise respondent burden, we only interviewed people about their failed purchase or sale, the total cost could include money they had lost if they missed out on their purchase as a result of a failed sale or vice versa.
Buyers
Over half of buyers (56%) reported that they had incurred costs. Of those who incurred costs, the majority had to pay for a survey or valuation (74%), over half had paid a mortgage arrangement fee (57%) and a further 28% had incurred solicitors’ fees.
Figure 6- 1 Type of expenses incurred by buyers in connection with failed home buying transactions (%)
Base: Successful buyers who had a transaction falling through and buyers who had a transaction falling through and who incurred costs (164) Source: Q167: Did you incur any of the following expenses for any of these attempts to purchase falling through?
Of those who incurred a costs, nearly six out of ten buyers lost less than £750 on their failed attempts to buy but nearly one in four (24%) lost over £1,000 (Figure 6-2.). The mean cost of failed purchases (calculated from the banded responses) for those who only bought a property was £744, for those who both bought and sold it was £740 and for those who failed to make a purchase it was £695.
74
57
28
3
Survey valuation fees
Mortgage arrangement fees
Solicitor fees
Other
72

Figure 6- 2 Amount of expenses incurred by buyers due to failed transactions (%)
Base: Successful buyers who had a transaction falling through and failed buyers who had a transaction falling through and who incurred costs (164) Source: Q168 Can you estimate how much you spent in total on these attempts to buy?
Sellers
Just over two in five (44%) of the sellers who experienced transaction failure incurred wasted cost. Most commonly they had spent money on solicitors’ fees or the valuation of a property they wanted to buy (Figure 6- 3).
Figure 6- 3 Type of expenses incurred by sellers for failed sale attempts (%)
Base: Successful sellers who had a transaction falling through and failed sellers who had a transaction falling through and who incurred costs (138) Source: Q172: Did you incur any of the following expenses for any of these attempts to sell falling through?
2
5
29
23
16
11
8
5
Less than £100
£101-£249
£250-£499
£500-£749
£750-£999
£1000-£1249
£1250-£1499
£1500 or more
30
17
7
4
Solicitor fees
Survey valuation (for the home theywant to buy)
Mortgage Arrangement fees (for thehome they want to buy)
Other
73

Of those who incurred a cost, a similar proportion to buyers (six out of ten) spent less than £750 whilst one in four (25%) also lost more than £1,000 (Figure 6- 4). The average cost for a failed transaction for those respondents who only sold a property was £582, for those sellers who also bought a property it was £740 and for sellers who never successfully sold it was £650.The average cost reported was slightly lower than among buyers.
Figure 6- 4 Amount of expenses incurred by sellers due to failed transactions (%)
Base: Successful sellers who had a transaction falling through and failed sellers who had a transaction falling through and who incurred costs (138) Source: Q173: Can you estimate how much you spent in total on these attempts to sell? Although the main survey asked for the respondents’ experience of their eventual successful transaction (most likely with a different estate agent and perhaps new lender or solicitor), we can examine whether previously experiencing a transaction falling through, along with the stress and cost that it entails, affects buyers and sellers attitudes to greater legal commitment at an early stage. We found that the experience did make buyers more likely to support the idea of entering into a legal commitment (59% rather than 50% among all buyers) but had no effect on attitudes among sellers.
9
14
23
14
14
11
5
9
Less than £100
£101-£249
£250-£499
£500-£749
£750-£999
£1000-£1249
£1250-£1499
£1500 or more
74

© Crown copyright 2017
This publication is licensed under the terms of the Open Government Licence v3.0 except where otherwise stated. To view this licence, visit nationalarchives.gov.uk/doc/open-government-licence/version/3 or write to the Information Policy Team, The National Archives, Kew, London TW9 4DU, or email: [email protected] we have identified any third party copyright information you will need to obtain permission from the copyright holders concerned.
This publication is available from: www.gov.uk/beis
Contacts us if you have any enquiries about this publication, including requests for alternative formats, at: [email protected]