Research on 3D Surveying Based on Binocular Stereo Vision
10
Research on 3D Surveying Based on Binocular Stereo Vision The 9th International Symposium on Computational Intelligence and Industrial Applications (ISCIIA2020) 1 Abstract. Surveying technology is a technology to obtain the spatial information of the target. With the development of computer technology, the use of computer technology for surveying can effectively improve the accuracy and speed of surveying. As for surveying equipment, compared with some distance sensors, the binocular camera has the advantages of simple structure, low price and easy operation. This research will study the method of surveying using binocular vision technology and perform the surveying on a specific object. Binocular stereo vision surveying includes five steps: camera calibration, stereo rectification, stereo matching, calculating coordinates and three-dimensional reconstruction. This work uses OpenCV and OpenGL libraries to implement each step on the VS2016 platform to complete the surveying of a specific object. Then this research proposes an evaluation criterion to evaluate the surveying results. Evaluation results show that, method using binocular stereo vision technology is able to carry out the surveying successfully, its accuracy is close to method using laser rangefinder and its resolution is higher under the same price. Keywords: Computer Vision, Binocular Vision, Surveying 1. INTRODUCTION The main function of surveying technology is to obtain and draw spatial information. In recent years, with the development of all walks of life, traditional analog surveying technology has been unable to fully meet the higher surveying requirements for accuracy, speed, and real-time. Against this background, modern measuring instruments and measuring technology have made tremendous improvements. Binocular vision technology which refers to technology that imitates humans to acquire and analyze visual information is used to measure the spatial position of objects. This technology has the advantages of possessing simple measurement system, easy operation and high measurement efficiency, and has broad application prospects. Binocular stereo vision originated in the 1960s, Roberts (MIT) realized the conversion of plane images into three-dimensional stereoscopic images for the first time [1]. In the 1980s, Marr proposed a complete set of theoretical computing systems from 2D to 3D in his book "Vision" [2]. Currently the binocular vision technology is mainly composed of camera calibration technology, stereo rectification technology, stereo matching technology. Camera calibration refers to obtaining the imaging parameters of the camera. In 1999, Professor Zhang Zhengyou proposed the noted "Zhang Zhengyou Calibration Method" [3,4]. This method uses a black and white checkerboard as a calibration tool, by taking multi- angle photos of the checkerboard to calculate the camera's internal parameters and position information. Stereo rectification refers to the rectification of the captured image, whose purpose is to make the corresponding points on one line in the two images. Hartley proposed a rectification algorithm by matching points [5], which completes the rectification through observation points. Stereo matching is to match two coordinates on two images that mapped from one point in the space. Stereo matching algorithms can be divided into local-based stereo matching algorithms and global- based stereo matching algorithms [6]. The local-based stereo matching algorithm includes stereo matching algorithms based on region, feature and phase [7]. The global matching algorithm needs to process the information of the entire image whose calculation is more complicated, and its matching accuracy is higher. Dynamic programming method [8], belief Propagation method [9], graph cut method [10] are the commonly used methods. This work applies binocular vision technology to the field of surveying. This work will employ camera calibration, stereo rectification, stereo matching and other technologies to perform binocular stereo vision surveying on a specific object, and propose an evaluation criterion to evaluate the surveying results. Haoran Wei *1 and Xiangyang Xu **2 *1 Beijing Institute of Technology, No.5 Zhong Guan Cun South Street, Haidian District, Beijing, China E-mail: [email protected] **2 Beijing Institute of Technology, No.5 Zhong Guan Cun South Street, Haidian District, Beijing, China E-mail: [email protected] Research on 3D Surveying Based on Binocular Stereo Vision The 9th International Symposium on Computational Intelligence and Industrial Applications (ISCIIA2020) Beijing, China, Oct.31-Nov.3, 2020
Transcript of Research on 3D Surveying Based on Binocular Stereo Vision

Research on 3D Surveying Based on Binocular Stereo Vision
The 9th International Symposium on Computational Intelligence and Industrial Applications (ISCIIA2020)
CITIC Jingling Hotel Beijing, Beijing, China, Oct.31-Nov.3, 2020
1
Abstract. Surveying technology is a technology to obtain the spatial information of the target. With the development of computer technology, the use of computer technology for surveying can effectively improve the accuracy and speed of surveying. As for surveying equipment, compared with some distance sensors, the binocular camera has the advantages of simple structure, low price and easy operation. This research will study the method of surveying using binocular vision technology and perform the surveying on a specific object. Binocular stereo vision surveying includes five steps: camera calibration, stereo rectification, stereo matching, calculating coordinates and three-dimensional reconstruction. This work uses OpenCV and OpenGL libraries to implement each step on the VS2016 platform to complete the surveying of a specific object. Then this research proposes an evaluation criterion to evaluate the surveying results. Evaluation results show that, method using binocular stereo vision technology is able to carry out the surveying successfully, its accuracy is close to method using laser rangefinder and its resolution is higher under the same price.
Keywords: Computer Vision, Binocular Vision, Surveying
1. INTRODUCTION The main function of surveying technology is to obtain
and draw spatial information. In recent years, with the
development of all walks of life, traditional analog
surveying technology has been unable to fully meet the
higher surveying requirements for accuracy, speed, and
real-time. Against this background, modern measuring
instruments and measuring technology have made
tremendous improvements. Binocular vision technology
which refers to technology that imitates humans to
acquire and analyze visual information is used to measure
the spatial position of objects. This technology has the
advantages of possessing simple measurement system,
easy operation and high measurement efficiency, and has
broad application prospects.
Binocular stereo vision originated in the 1960s,
Roberts (MIT) realized the conversion of plane images
into three-dimensional stereoscopic images for the first
time [1]. In the 1980s, Marr proposed a complete set of
theoretical computing systems from 2D to 3D in his book
"Vision" [2]. Currently the binocular vision technology
is mainly composed of camera calibration technology,
stereo rectification technology, stereo matching
technology. Camera calibration refers to obtaining the
imaging parameters of the camera. In 1999, Professor
Zhang Zhengyou proposed the noted "Zhang Zhengyou
Calibration Method" [3,4]. This method uses a black and
white checkerboard as a calibration tool, by taking multi-
angle photos of the checkerboard to calculate the
camera's internal parameters and position information.
Stereo rectification refers to the rectification of the
captured image, whose purpose is to make the
corresponding points on one line in the two images.
Hartley proposed a rectification algorithm by matching
points [5], which completes the rectification through
observation points. Stereo matching is to match two
coordinates on two images that mapped from one point
in the space. Stereo matching algorithms can be divided
into local-based stereo matching algorithms and global-
based stereo matching algorithms [6]. The local-based
stereo matching algorithm includes stereo matching
algorithms based on region, feature and phase [7]. The
global matching algorithm needs to process the
information of the entire image whose calculation is more
complicated, and its matching accuracy is higher.
Dynamic programming method [8], belief Propagation
method [9], graph cut method [10] are the commonly
used methods.
This work applies binocular vision technology to the
field of surveying. This work will employ camera
calibration, stereo rectification, stereo matching and
other technologies to perform binocular stereo vision
surveying on a specific object, and propose an evaluation
criterion to evaluate the surveying results.
Haoran Wei*1 and Xiangyang Xu**2
*1Beijing Institute of Technology, No.5 Zhong Guan Cun South Street, Haidian District, Beijing, China
E-mail: [email protected] **2Beijing Institute of Technology, No.5 Zhong Guan Cun South Street, Haidian District, Beijing, China
E-mail: [email protected]
Research on 3D Surveying Based on Binocular Stereo Vision
The 9th International Symposium on Computational Intelligence and Industrial Applications (ISCIIA2020)CITIC Jingling Hotel Beijing, Beijing, China, Oct.31-Nov.3, 2020
The 9th International Symposium on Computational Intelligence and Industrial Applications (ISCIIA2020) Beijing, China, Oct.31-Nov.3, 2020

Research on 3D Surveying Based on Binocular Stereo Vision
The 9th International Symposium on Computational Intelligence and Industrial Applications (ISCIIA2020)
CITIC Jingling Hotel Beijing, Beijing, China, Oct.31-Nov.3, 2020
2
2. PRINCIPLE 2.1. Binocular Stereo Vision
Humans can estimate the distance from the target
object to themselves, which is accomplished by the
vision system established by the two eyes. The binocular
vision system is a vision system that imitates the human
to obtain the spatial position of the target object from two
cameras. The camera linear imaging model is shown in Fig. 1,
and the equation of the camera linear imaging model is
shown as (1). The world coordinates of point P are (wX ,
wY ,wZ ), the camera coordinates are (
cX ,cY ,
cZ ); point p
is a point projected onto the image plane, its image pixel
coordinates are ( u , v ); xf and yf are the equivalent focal
lengths of the camera in the x-axis direction and y-axis
direction respectively; (0u ,
0v ) are the coordinates of the
camera's principal point; R and T represent the position
of the camera coordinate system in the world coordinate
system. The first matrix on the right side of the (1) is the
internal parameter matrix I, and the second matrix is the
external parameter matrix E.
w
0
w
c 0
w
0
= 0
1 0 0 11
x
y
Xu f u
YZ v f
Z
R T (1)
In reality, the image captured by the camera is
distorted, and nonlinear terms are added to optimize the
model. Formula (2) describes the nonlinear distortion
terms [11], ( x , y ) are the real coordinates in the image
physical coordinate system, ( x , y ) are the calculated
ideal coordinates, ( ),x x y and ( ),y x y are the
nonlinear distortion items in the x-axis and y-axis
directions respectively. The expression of the nonlinear
term is (3). The first three terms in (3) represent radial
distortion, and the last two terms represent tangential
distortion. Set the vector 1 2 1 2 3, , , ,k k p p k=D as the
distortion vector of the camera.
( )( )
,
,
x
y
x x x y
y y x y
= +
= + (2)
( ) ( ) ( )( )( )( )
( ) ( ) ( )( )( )( )
22 2 2 2
1 2
32 2
3 1
22 2 2
2
22 2 2 2
1 2
32 2
3 2
22 2 2
1
, =
2
2
,
2
2
+
x
y
x y k x x y k x x y
k x x y p xy
p x y x
x y k y x y k y x y
k y x y p xy
p x y y
+ + +
+ +
+ + +
= + + +
+ +
+ + +
+
(3)
Fig. 1 Model of Camera Imaging
Fig. 2 Geometric Model of Binocular Vision
Obviously, a system composed of one camera cannot
calculate (wX ,
wY ,wZ ) from ( u , v ), it only needs to
establish an equation set composed of two sets of (1) to
form four constraints by using a model composed of two
cameras that the three-dimensional coordinates (wX ,
wY ,
wZ ) of a point in space can be figured out, as shown in
Fig. 2.
2.2. Surveying Method Binocular stereo vision surveying includes five steps:
camera calibration, stereo rectification, stereo matching,
calculating coordinates and 3D reconstruction. This
section will briefly introduce the principles of camera
calibration, stereo rectification and stereo matching.
Camera calibration is divided into single-camera
calibration and double-camera calibration. The purpose
of single-camera calibration is to figure out the internal
parameter matrix I, distortion vector D and external
parameter matrix E of the camera. The purpose of
double-camera calibration is to obtain the position
relationship of the two camera coordinate systems. In
1998, Professor Zhang Zhengyou proposed a calibration
method based on a plane checkerboard. The principle is
as follows.
Firstly, carry out the single-camera calibration.
Suppose that the wZ of the checkerboard plane is in the
world coordinate system is 0, and (1) can be converted
The 9th International Symposium on Computational Intelligence and Industrial Applications (ISCIIA2020)CITIC Jingling Hotel Beijing, Beijing, China, Oct.31-Nov.3, 2020
The 9th International Symposium on Computational Intelligence and Industrial Applications (ISCIIA2020) Beijing, China, Oct.31-Nov.3, 2020
Research on 3D Surveying Based on Binocular Stereo Vision
The 9th International Symposium on Computational Intelligence and Industrial Applications (ISCIIA2020)
CITIC Jingling Hotel Beijing, Beijing, China, Oct.31-Nov.3, 2020
3
into (4). Set the homography matrix 1 2=H r rI T ,
where c1/Z = . The homography matrix is a 3 3
matrix of 7 uncorrelated parameters, that is, has 7 degrees
of freedom, and only four pairs of corresponding points
are needed to figure out the homography matrix. By
rotating matrix R to be an orthogonal matrix, the inner
product of 1r and
2r is 0, and 1 2= =1r r , two equations
can be established. After taking calibration pictures from
two angles on the calibration board, two homography
matrices can be obtained, with the same internal
parameter matrix and different external parameter matrix.
After obtaining the homography matrix, by listing the
constraint equations of two homography matrices, the
internal parameter matrix of the camera can be figured
out. After the internal parameter matrix is figured out, the
external parameter matrix can be obtained. The number
of squares in the calibration checkerboard obviously
exceeds 1, and the number of calibration checkerboards
exceeds 2, the least-squares is used to find the fitting
solution. In order to improve the reliability of the
calibration results, Zhang's calibration method uses the
maximum likelihood estimation to optimize the results.
Then, the least-squares is used to solve the distortion
vector D, and the maximum likelihood estimation is used
to optimize the result. Then perform the double-camera
calibration. According to the external parameter matrices
of the left and right camera coordinate systems, their
position relationship can be obtained using (5). Rotation
matrix lrR that can convert the direction of the left
camera coordinate system to the direction of the right
camera coordinate system is 1
lr l r
−=R R R , translation
vector lrT of the two camera coordinate systems is
1
lr r l r l
−= −T T R R T .
w
c 1 2 w=
1 1
u X
Z v Y
r r TI (4)
cr cl
1 1cr cll r r l r l
cr cl1
1 1
X X
Y Y
Z Z
− −
− =
0R R T R R T
(5)
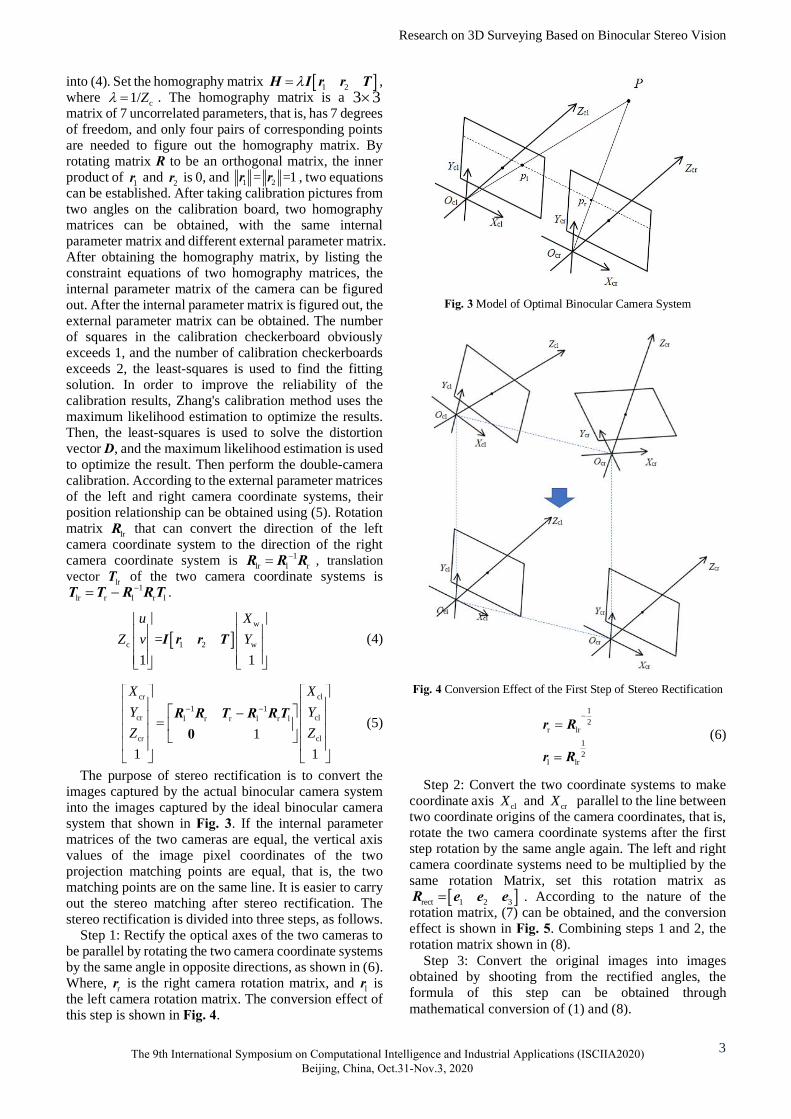
The purpose of stereo rectification is to convert the
images captured by the actual binocular camera system
into the images captured by the ideal binocular camera
system that shown in Fig. 3. If the internal parameter
matrices of the two cameras are equal, the vertical axis
values of the image pixel coordinates of the two
projection matching points are equal, that is, the two
matching points are on the same line. It is easier to carry
out the stereo matching after stereo rectification. The
stereo rectification is divided into three steps, as follows.
Step 1: Rectify the optical axes of the two cameras to
be parallel by rotating the two camera coordinate systems
by the same angle in opposite directions, as shown in (6).
Where, rr is the right camera rotation matrix, and
lr is
the left camera rotation matrix. The conversion effect of
this step is shown in Fig. 4.
Fig. 3 Model of Optimal Binocular Camera System
Fig. 4 Conversion Effect of the First Step of Stereo Rectification
1
2r lr
1
2l lr
−=
=
r R
r R (6)
Step 2: Convert the two coordinate systems to make
coordinate axis clX and
crX parallel to the line between
two coordinate origins of the camera coordinates, that is,
rotate the two camera coordinate systems after the first
step rotation by the same angle again. The left and right
camera coordinate systems need to be multiplied by the
same rotation Matrix, set this rotation matrix as
rect 1 2 3=R e e e . According to the nature of the
rotation matrix, (7) can be obtained, and the conversion
effect is shown in Fig. 5. Combining steps 1 and 2, the
rotation matrix shown in (8).
Step 3: Convert the original images into images
obtained by shooting from the rectified angles, the
formula of this step can be obtained through
mathematical conversion of (1) and (8).
The 9th International Symposium on Computational Intelligence and Industrial Applications (ISCIIA2020)CITIC Jingling Hotel Beijing, Beijing, China, Oct.31-Nov.3, 2020
The 9th International Symposium on Computational Intelligence and Industrial Applications (ISCIIA2020) Beijing, China, Oct.31-Nov.3, 2020

Research on 3D Surveying Based on Binocular Stereo Vision
The 9th International Symposium on Computational Intelligence and Industrial Applications (ISCIIA2020)
CITIC Jingling Hotel Beijing, Beijing, China, Oct.31-Nov.3, 2020
4
Fig. 5 Conversion Effect of the Second Step of Stereo Rectification
1
T
2 1
22 2
2 1
13 2
0T T
T T
=
−=
+
=
TT
e
e
e e e
(7)
'
l rect l
'
r rect r
r
r
==
R RR R
(8)
Stereo matching refers to the process of matching the
corresponding points in the images taken by the left and
right cameras, and then calculating the disparity.
Disparity refers to the difference between a pixel in the
left image and a matching pixel in the right image in the
horizontal coordinate. SGBM matching algorithm is a
kind of a semi-global block matching algorithm, which is
a special global matching algorithm. This method uses a
local energy function to establish a global energy
function, and minimizes the global energy function to
obtain the optimal disparity. This algorithm is divided
into three steps, as follows.
Step 1: Use the sobel operator to calculate the
grayscale vector image s of the original image, as shown
in (9). Then convert s to positive value image news
through the mapping function as shown in (10), C
represents the cutoff value.
( ) ( ) ( )( ) ( )( ) ( )
, 2 1, 1,
1, 1 1, 1
1, 1 1, 1
s u v P u P u v
P u P u v
P u P u v
= + − −
+ + − − − −
+ + + − − +
(9)
( ) ( )new
0
, , C
2 C
s u v s u v
= +
( )( )
( )
, , C
,C , C
, , C
s u v
s u v
s u v
(10)
Step 2: Use the SAD algorithm to calculate the local
cost, as shown in (11).
( )
( ) ( )n n
n n
, ,
, ,i j
C u v d
L u i v j R u d i v j=− =−
=
+ + − + + + (11)
Step 3: Use dynamic programming for global energy
accumulation. The SGBM algorithm builds an energy
function by accumulating energy from multiple
directions, and its expression is shown in (12). p
represents the coordinate vector of a pixel, r represents
the direction vector of the accumulated energy, p-r
represents the vector of the previous pixel of this pixel in
the r direction, ( ),L dr p represents the global energy
function when the disparity of the pixel is d, ( ),C dp
represents the local energy function of this pixel. 1P and
2P are the penalty terms, and its function is to limit the
discontinuous disparity. ( ),S dp represents the energy
function accumulated in all directions. The disparity
when the energy function is smallest is selected as the
disparity of this pixel.
( ) ( ) ( )( )
( )( )
( )( )( ) ( )
min max
min max
, ,
1
2, ,
, , min ,
,
min , 1 P
min , P
, ,
i d d
i d d
L d C d L i
L d
L d
L i
S d L d
=
=
= − −
− + − +
− +
=
r r
r
r
r
rr
p p p r
p r
p r
p r
p p
(12)
3. EXPERIMENTS 3.1. Camera Calibration
According to the calibration method introduced above,
the actual camera is calibrated. The calibration here is a
mobile phone camera with a resolution of 34564680.
In order to shorten the calculation time, the captured
image is compressed to 864 1152, and the shooting
conditions are all at the same exposure level. The
calibration board is made into a 50 mm 50 mm
checkerboard and the number of corner points is 7 6
eliminating the outermost corner points. The single-
camera calibration procedure is as follows.
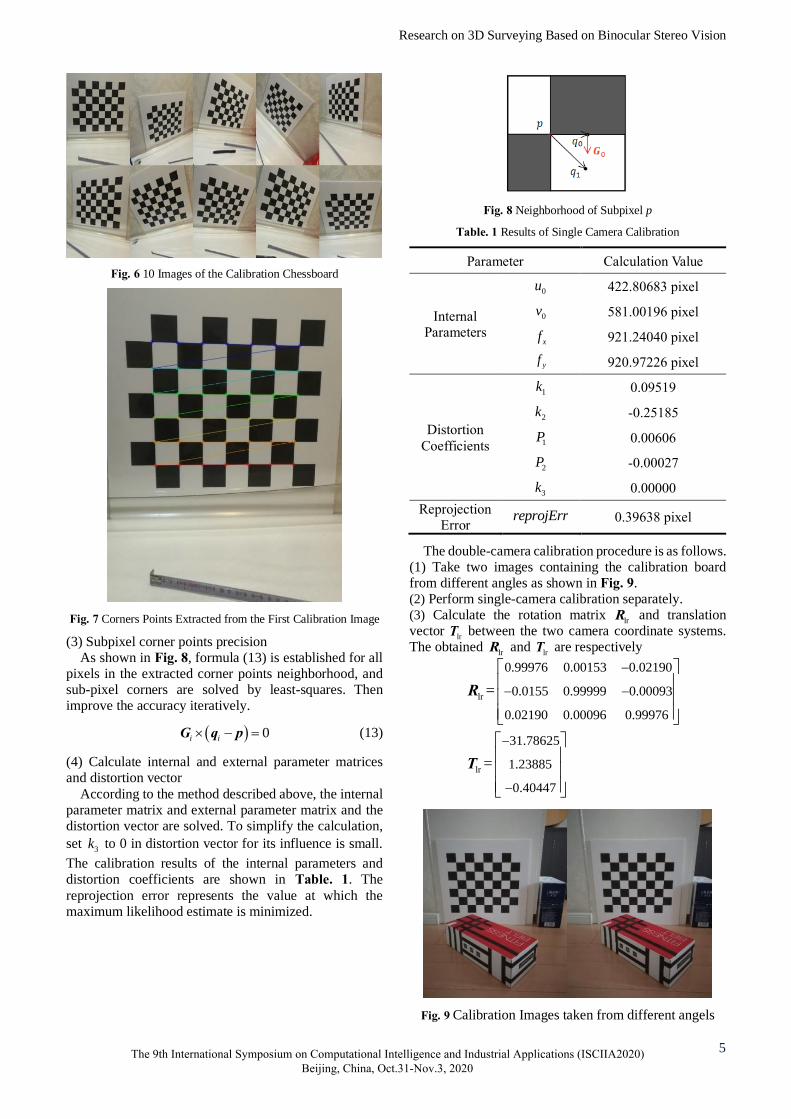
(1) Take calibration images
Shoot the calibration board from different angles. In
this experiment, the calibration plate will be shot from 10
different angles. The photos taken are shown in Fig. 6.
(2) Extract corner points
The corner points are extracted from the corner points
in the ten images, as shown in Fig. 7.
The 9th International Symposium on Computational Intelligence and Industrial Applications (ISCIIA2020)CITIC Jingling Hotel Beijing, Beijing, China, Oct.31-Nov.3, 2020
The 9th International Symposium on Computational Intelligence and Industrial Applications (ISCIIA2020) Beijing, China, Oct.31-Nov.3, 2020
Research on 3D Surveying Based on Binocular Stereo Vision
The 9th International Symposium on Computational Intelligence and Industrial Applications (ISCIIA2020)
CITIC Jingling Hotel Beijing, Beijing, China, Oct.31-Nov.3, 2020
5
Fig. 6 10 Images of the Calibration Chessboard
Fig. 7 Corners Points Extracted from the First Calibration Image
(3) Subpixel corner points precision
As shown in Fig. 8, formula (13) is established for all
pixels in the extracted corner points neighborhood, and
sub-pixel corners are solved by least-squares. Then
improve the accuracy iteratively.
( ) 0i i − =G q p (13)
(4) Calculate internal and external parameter matrices
and distortion vector
According to the method described above, the internal
parameter matrix and external parameter matrix and the
distortion vector are solved. To simplify the calculation,
set 3k to 0 in distortion vector for its influence is small.
The calibration results of the internal parameters and
distortion coefficients are shown in Table. 1. The
reprojection error represents the value at which the
maximum likelihood estimate is minimized.
Fig. 8 Neighborhood of Subpixel p
Table. 1 Results of Single Camera Calibration
Parameter Calculation Value
Internal
Parameters
0u 422.80683 pixel
0v 581.00196 pixel
xf 921.24040 pixel
yf 920.97226 pixel
Distortion
Coefficients
1k 0.09519
2k -0.25185
1P 0.00606
2P -0.00027
3k 0.00000
Reprojection
Error reprojErr 0.39638 pixel
The double-camera calibration procedure is as follows.
(1) Take two images containing the calibration board
from different angles as shown in Fig. 9.
(2) Perform single-camera calibration separately.
(3) Calculate the rotation matrix lrR and translation
vector lrT between the two camera coordinate systems.
The obtained lrR and
lrT are respectively
lr
0.99976 0.00153 0.02190
0.0155 0.99999 0.00093
0.02190 0.00096 0.99976
=
−
− −
R
lr 1.23885
31.78625
0.40447
=
−
−
T
Fig. 9 Calibration Images taken from different angels
The 9th International Symposium on Computational Intelligence and Industrial Applications (ISCIIA2020)CITIC Jingling Hotel Beijing, Beijing, China, Oct.31-Nov.3, 2020
The 9th International Symposium on Computational Intelligence and Industrial Applications (ISCIIA2020) Beijing, China, Oct.31-Nov.3, 2020

Research on 3D Surveying Based on Binocular Stereo Vision
The 9th International Symposium on Computational Intelligence and Industrial Applications (ISCIIA2020)
CITIC Jingling Hotel Beijing, Beijing, China, Oct.31-Nov.3, 2020
6
3.2. Stereo Rectification (1) The distortion vector is used to correct the distortion,
and then calculate the rectification matrices '
lR and '
rR
of the left and right camera coordinate systems. At the
same time, the rectified internal parameter matrices lp
and rp of the two cameras, and the depth disparity
mapping matrix Q are obtained. The depth disparity
mapping matrix Q can directly convert the pixel
coordinates and disparity of the pixel points into the
corresponding world coordinates, as shown in (14). The
experimental results of the first step of stereo rectification
are shown in Table. 2.
'
1 0 0
0 1 0
0 0 0
10 0
1
u
v
u u
C
C
f
C C
X u
Y v
Z d
W
− − =
−−
=
Q
T T
Q
(14)
(2) Calculate the mapping tables that convert the original
images into the rectified images.
(3) The mapping tables obtained in the second step are
used for mapping to obtain the final rectified images.
Then draw a horizontal line every 20 pixels, as shown in
Fig. 10.
Table. 2 Results of the First Step of Stereo Rectification
Parameter Calculation Value
'
lR
0.99925 0.03739 0.00913
0.03739 0.99930 0.00085
0.00915 0.00050 0.99995
− − −
'
rR
0.99916 0.03894 0.01271
0.03893 0.99924 0.00092
0.01274 0.00043 0.99991
− − −
lp
920.97226 0 417.0654 0
0 920.97226 595.97401 0
0 0 1 0
rp
920.97226 0 417.0654 0
0 920.97226 595.97401 0
0 0 1 0
Q
1 0 417.0654
0 1 0 595.97401
0 0 0 92
0
0 0 0.031
0.97226
43 0
− −
Fig. 10 Images after Stereo Rectification
3.3. Stereo Matching (1) Use the sobel operator to convert the original images
into gradient maps and perform mapping filtering. As
shown in Fig. 11, the left image shows the image which
is the R channel of the left image that processed through
the stereo rectification and then converted to grayscale,
and the right image shows the left image processed by the
sobel operator, filtered with a filter cutoff value of 63 and
converted to grayscale.
(2) Calculate the SAD cost function. In total six images
including the three channels RGB of the image and the
three channels of the image preprocessed are used to
calculate the SAD cost. The final SAD cost is the sum of
the six SAD costs. The SAD window used in this
experiment is 11×11, and the Birchfield-Tomasi
algorithm [12] is used to improve the traditional
calculation method.
(3) Use dynamic programming to calculate the global
energy function of each pixel. The penalty terms 1P and
2P use the general value in engineering practice, the
value of 1P is 8 × number of channels × window size, the
value of 2P is four times that of
1P . The energy
accumulation is performed from the five directions of the
left side, the upper left side, the upper side, the upper
right side, and the right side, and the disparity map
obtained is shown in Fig. 12.
Fig. 11 Results of Stereo Matching Preprocessing
The 9th International Symposium on Computational Intelligence and Industrial Applications (ISCIIA2020)CITIC Jingling Hotel Beijing, Beijing, China, Oct.31-Nov.3, 2020
The 9th International Symposium on Computational Intelligence and Industrial Applications (ISCIIA2020) Beijing, China, Oct.31-Nov.3, 2020

Research on 3D Surveying Based on Binocular Stereo Vision
The 9th International Symposium on Computational Intelligence and Industrial Applications (ISCIIA2020)
CITIC Jingling Hotel Beijing, Beijing, China, Oct.31-Nov.3, 2020
7
Fig. 12 Disparity Map Generated by Stereo Matching (without Postprocessing)
(4) Postprocess the resulting disparity map. Perform
sub-pixel interpolation on the disparity map using (15).
This formula changes the minimum step-size of disparity
to 1/SCALE , improving the accuracy to sub-pixel
accuracy. The SCALE value used in this experiment is
16.
( ) ( )( )
( ) ( ) ( )
SCALE
, 1 , 1 SCALE
* 2
, 1 + , 1 2 ,max
1
d d
S d S d t
t
S d S d S dt
= +
− − + +
− + − =
p p
p p p
(15)
3.4. Coordinates Calibration and 3D reconstruction According to the depth disparity mapping matrix Q
and the disparity d obtained by stereo matching, the
world coordinates of each pixel can be obtained using
(13). Three-dimensional reconstruction of the object can
be completed by drawing space points in three-
dimensional space through OpenGL, as shown in Fig. 13.
Fig. 13 3D Points Cloud Model of Target Object
4. EVALUATION 4.1. Evaluation Criterion
It is necessary to establish an evaluation criterion to
evaluate the accuracy of surveying. The usual evaluation
criterion compares the measured value with the standard
value, but for this experiment, the standard coordinate
values of each corresponding point cannot be directly
obtained. Therefore, another evaluation criterion needs to
be proposed.
By establishing the positional relationship between
points, the relative position information can be obtained.
All pixel points are divided into two categories. The first
category is feature points. The relative position between
these feature points is easy to obtain, and usually
expressed as the standard physical size of the object. The
second type is non-feature points. These points are
usually distributed around the feature points, which can
reflect the relative modeling situation around the feature
points to a certain extent. Therefore, two aspects can be
evaluated from. From the first aspect, calculate the
distance between the feature points, that is, the corners of
the object, then evaluate the results by comparing the
calculated distance and actual size. From the second
aspect, two indicators are specifically proposed to
evaluate the relative modeling situation. They are the
calculated surface area occupied by each pixel and the
distance from the corresponding spatial point of each
pixel to the surface. The two indicators can respectively
reflect different surface modeling situations. Here, the
object surface modeling situations are divided into 4
categories, as shown in Fig. 14.
(a) (b)
(c) (d)
Fig. 14 Four Situations for Surface Modeling
The first category is shown in Fig. 14 (a), the points on
the surface of the object are roughly evenly distributed
on both sides of the object surface like folds; the second
category is shown in (b), a small number of pixels on the
surface of the object are far from the surface of the object;
the third category is shown in (c), the continuous block
pixels on the surface of the object are largely deviated
from the surface plane of the object in one direction; the
fourth category is shown in (d) , which represents the
offset of the spatial points corresponding to the pixels
along the surface of the object. The actual modeling
situation is very complicated, and the above four
The 9th International Symposium on Computational Intelligence and Industrial Applications (ISCIIA2020)CITIC Jingling Hotel Beijing, Beijing, China, Oct.31-Nov.3, 2020
The 9th International Symposium on Computational Intelligence and Industrial Applications (ISCIIA2020) Beijing, China, Oct.31-Nov.3, 2020

Research on 3D Surveying Based on Binocular Stereo Vision
The 9th International Symposium on Computational Intelligence and Industrial Applications (ISCIIA2020)
CITIC Jingling Hotel Beijing, Beijing, China, Oct.31-Nov.3, 2020
8
situations and other situations always appear at the same
time.
Indicator one, the surface area of each pixel on the
surface and its statistical law can mainly reflect the first,
second and fourth types of modeling situations. Indicator
two, the distance from the corresponding spatial point to
the surface of each pixel on the surface and its statistical
law mainly reflect the modeling situations of the first,
second and third categories.
For the evaluation result, this paper divides it into three
levels as shown in Table. 3.
4.2. Evaluation Results Firstly, evaluate the corner points size. The letters of
each corner are recorded as shown in Fig. 15, and the
comparison between the calculated size and the actual
size is recorded in Table. 4.
According to the data in Table. 4, the average absolute
error between the corner points distance and the actual
size is 3.026mm, the average relative error is 1.59%, the
maximum absolute error is 5.36mm, and the absolute
value of the maximum relative error is 4.87%.
Then, evaluate the modeling situation using two
indicators proposed above. Through indicator one, take
the object surface ABCD as an example to evaluate the
modeling situation of the object surface. The surface area
calculated from each pixel is compared with the surface
area estimated from the corner points, and the
comparison results are shown in Table. 5.
Fig. 15 Marking Letters for Corners of Target Object
Table. 3 Three Accuracy Levels of Evaluation Result
Evaluation
Result
Average
Relative
Error of
Corners
Distance
Relative
Error of
Average
Surface
Area
Average
Value of
distance from
pixels to
surface(mm)
Accurate ≤1% ≤20% ≤1
Generally
Accurate 1%-3% 20%-50% 1-3
Inaccurate >3% >50% >3
Table. 4 Comparison Between Corners Distance and Actual Size
Corner
Points
Pair
Calculated
Distance
(mm)
Actual
Size
(mm)
Absolute
Error
(mm)
Relative
Error
AB 384.31 380.00 4.31 1.13%
AC 156.63 160.00 -3.37 -2.10%
BD 162.76 160.00 2.76 1.73%
BC 416.30 412.31 3.99 0.97%
AD 414.11 412.31 1.80 0.44%
CD 382.28 380.00 2.28 0.60%
AE 106.45 110.00 -3.55 -3.22%
EF 382.34 380.00 2.34 0.62%
FB 113.31 110.00 3.31 3.01%
AF 399.59 395.60 3.99 1.01%
BE 397.81 395.60 2.21 0.56%
FG 156.12 160.00 -3.88 -2.43%
DG 104.64 110.00 -5.36 -4.87%
BG 194.01 194.17 -0.16 -0.08%
DF 192.09 194.17 -2.08 -1.07%
Table. 5 Comparison of Surface Area Between Pixels Calculated and Estimated by Corners
Indicator
Calculated
Value by
Pixels
(mm2)
Estimated
Value by
Corners
(mm2)
Relative
Error
Total Surface
Area 89511.84 61210.30 46.23%
Average
Surface Area 1.36 0.93 45.93%
Maximum
Value 203.58 / /
Minimum
Value 0.25 / /
Then, evaluate the modeling situation using two
indicators proposed above. Through indicator one, take
the object surface ABCD as an example to evaluate the
modeling situation of the object surface. The surface area
calculated from each pixel is compared with the surface
area estimated from the corner points, and the
comparison results are shown in Table. 5.
It can be seen from Table. 5 that the integral surface
area of the surface calculated by the pixels is 45.93%
larger than that estimated by the corner points. It shows
that the overall degree of unevenness on the surface of
the object is high, and the first type of modeling situation
is widespread and its degree is high; the standard
deviation is very large, and the maximum and minimum
The 9th International Symposium on Computational Intelligence and Industrial Applications (ISCIIA2020)CITIC Jingling Hotel Beijing, Beijing, China, Oct.31-Nov.3, 2020
The 9th International Symposium on Computational Intelligence and Industrial Applications (ISCIIA2020) Beijing, China, Oct.31-Nov.3, 2020

Research on 3D Surveying Based on Binocular Stereo Vision
The 9th International Symposium on Computational Intelligence and Industrial Applications (ISCIIA2020)
CITIC Jingling Hotel Beijing, Beijing, China, Oct.31-Nov.3, 2020
9
values deviate far from the average value, indicating that
the surface area occupied by each pixel is highly
dispersed, the fourth type of modeling situation is also
common and many pixels appear very close to their
neighboring pixels and there are some pixels of second-
type modeling situation with large deviations.
Through indicator two, calculate the distance from the
corresponding spatial point of each pixel of surface
ABCD to the plane fitted by the pixels ABCD. The plane
fitted by pixels ABCD is
w w w0.0023 0.96 0.29 303.04 0X Y Z− − + =
The calculated distance of each pixel shows in Fig. 16, its histogram shows in Fig. 17 and its statistics show in Table. 6.
As can be seen from Fig. 16, Fig. 17, and Table. 6, the
average value of the distance from the corresponding
spatial point of each pixel to the fitting plane is 0.31mm,
indicating that the overall distance is balanced. But the
standard deviation is much larger than the average value,
and the overall distribution is normal, indicating that the
first type of modeling conditions is widespread and its
degree is high. The neighboring pixels are clustered away
from zero indicating that the third type of modeling
situation exists. The maximum and minimum values far
deviate the average value, indicating that the second type
of modeling exists but its proportion is very large less.
Combining the two indicators can draw conclusions
that modeling situation of type one exists universally and
its degree is high, modeling situation of type two exists
but its proportion is low, modeling situation of type three
exists partially and modeling situation of type four exists
universally and many pixels is very close to their
neighboring pixels.
Fig. 16 Distance Calculated of Each Pixel
Fig. 17 Histogram of Distance calculated of each pixel
Table. 6 Statistics of Distance calculated of each pixel
Indicator Statistic(mm)
Average Value 0.31
Standard Deviation 2.12
Maximum Value 7.10
Minimum Value -43.58
According to the analysis above, feature points such as
object corners can be surveyed relatively accurately.
Non-feature points can be roughly surveyed accurately
overall but exist some regular errors.
Through Table.3, the result of surveying using
binocular stereo vision can be evaluated as generally
accurate, therefore, surveying using this method can be
carried out successfully. Compared with other automatic
surveying equipments like lidar or laser range-finder,
under the same price, the accuracy of surveying using
binocular camera is about the same and the resolution can
be improved by one order of magnitude.
5. CONCLUSION AND PERSPECTIVIES The main content of this paper is to use binocular
stereo vision technology for surveying. Firstly, this work
uses Zhang Zhengyou camera calibration method, self-
makes the calibration board, shots the calibration board
from multiple angles to complete the camera calibration.
Secondly, capture images from multiple angles of the
specific object and convert the actual images into
standard images using stereo rectification method.
Thirdly; using the SGBM stereo matching algorithm to
match the corresponding pixels between two images to
get the disparity map. Fourthly, measure the three-
dimensional coordinates of the target object and
reconstruct the three-dimensional points of cloud. Finally,
this paper proposed an evaluation criterion to evaluate the
surveying results. According to the evaluation results, the
feasibility of binocular stereo vision surveying is proved
and the existing errors are analyzed.
The main innovative contributions of this paper are
from two aspects. Firstly, this paper proved another
method which is of low-cost to do the computer
surveying and analyzed the accuracy of it. Secondly, this
paper proposed a new method to evaluate the surveying
results and it can be used in the case of usual evaluation
method does not work.
The experimental results are still flawed. Although the
binocular surveying method used in this work is able to
complete the surveying, its precision is far less than the
accuracy of traditional surveying. For the future research,
using different camera calibration, stereo rectification,
and stereo matching methods to perform the surveying
can be studied more, so as to find out binocular surveying
methods with higher accuracy, especially for non-feature
points. In addition, performing surveying on objects of
different shapes to improve its universality can be studied
ae well.
0 20000 40000 60000
-40
-20
0
20 Distance calculated of each pixel
Dis
tan
ce c
alcu
late
d o
f ea
ch p
ixel
(m
m)
Pixel number
36 293
7225
45100
13062
137 0
< -10 -10 - -6 -6 - -2 -2 - 2 2 - 6 6 - 10 > 100
10000
20000
30000
40000
50000
Fre
qu
ency
Distance calculated of each pixel(mm)
Frequency of “Distance calculated of each pixel”
The 9th International Symposium on Computational Intelligence and Industrial Applications (ISCIIA2020)CITIC Jingling Hotel Beijing, Beijing, China, Oct.31-Nov.3, 2020
The 9th International Symposium on Computational Intelligence and Industrial Applications (ISCIIA2020) Beijing, China, Oct.31-Nov.3, 2020

Research on 3D Surveying Based on Binocular Stereo Vision
The 9th International Symposium on Computational Intelligence and Industrial Applications (ISCIIA2020)
CITIC Jingling Hotel Beijing, Beijing, China, Oct.31-Nov.3, 2020
10
REFERENCES: [1] L. G. Roberts, “Machine perception of three-dimensional solids,”
Optical Electro-Optical Information Processing, pp. 159-197, 1965.
[2] D. Marr, S. Ullman and T. A. Poggi, “Vision: A Computational
Investigation into the Human Representation and Processing of
Visual Information,” The MIT Press, 2010.
[3] Z. Zhang, "Flexible camera calibration by viewing a plane from unknown orientations," Proceedings of the Seventh IEEE
International Conference on Computer Vision, Kerkyra, Greece, vol.
1, pp. 666-673, 1999.
[4] Z. Zhang, "A flexible new technique for camera calibration," in IEEE
Transactions on P xattern Analysis and Machine Intelligence, vol.
22, no. 11, pp. 1330-1334, Nov. 2000.
[5] HARTLEY and I. Richard, “Theory and practice of projective
rectification,” International Journal of Computer Vision, vol. 35, no.
2, pp. 115-127, 1999.
[6] A. R. Patel and A. Patel, "Comparative Analysis of Stereo Matching
Algorithms," 2019 IEEE 10th Annual Ubiquitous Computing, Electronics & Mobile Communication Conference (UEMCON), New
York City, NY, USA, pp. 0620-0626, 2019.
[7] Y. Tseng and T. Chang, "Fast algorithm for local stereo matching in
disparity estimation," 2011 17th International Conference on Digital
Signal Processing (DSP), Corfu, pp. 1-6, 2011.
[8] M. Hallek, H. Boukamcha, F. Smach and M. Atri, "Real Time Stereo Matching Using Two Step Zero-Mean SAD and Dynamic
Programing," 2018 15th International Multi-Conference on Systems,
Signals & Devices (SSD), Hammamet, pp. 1234-1240, 2018.
[9] A. Klaus, M. Sormann and K. Karner, "Segment-Based Stereo
Matching Using Belief Propagation and a Self-Adapting Dissimilarity Measure," 18th International Conference on Pattern
Recognition (ICPR'06), Hong Kong, pp. 15-18, 2006.
[10] D. A. Altantawy, M. Obbaya and S. Kishk, "A fast non-local based stereo matching algorithm using graph cuts," 2014 9th International
Conference on Computer Engineering & Systems (ICCES), Cairo, pp.
130-135, 2014.
[11] D. J. FLEET, A. D. JEPSON, M. R. JENKIN, “ Phase-based
disparity measurement,” CVGIP: Image Understanding, vol. 53, no.
2, pp. 198-210, 1991.
[12] S. Birchfield and C. Tomasi, “Depth discontinuities by pixel-to-
pixel stereo,” Sixth International Conference on Computer Vision,
Bombay, India, IEEE, vol. 35, no. 3, pp. 269-293, 1999.
The 9th International Symposium on Computational Intelligence and Industrial Applications (ISCIIA2020)CITIC Jingling Hotel Beijing, Beijing, China, Oct.31-Nov.3, 2020
The 9th International Symposium on Computational Intelligence and Industrial Applications (ISCIIA2020) Beijing, China, Oct.31-Nov.3, 2020