RESEARCH OF METAL SOLIDIFICATION - NASA
73
Transcript of RESEARCH OF METAL SOLIDIFICATION - NASA


RESEARCH OF METAL SOLIDIFICATION
I N ZERO-G STATE
FINAL RE PORT
(Reporting Period: June 14, 1972 t o May 14 , 1973)
William M. Aubin
Dave Larson, J r .
Gary I. Geschwind
Research Depar trnen t Grumnan Aerospace Corpora t ion
Bethpage New York 11714
Prepared under Contrac t i4AS 8-28604
f o r the
Nat ional Aeronautics and Space Adminis t ra t ion George C . Marshal l Space F l i g h t Center
Marshall Space F l i g h t Center , Alabama 35312
September 1973
t ,l&, d;;i ' ' Approved by: fif~lik , Charles E . Mhck, J r . Di rec to r of Research

ABSTRACT
An experiment t e s t apparatus t h a t allows metal melting and
reso l id i f i ca t ion i n the three seconds avai lable during f r e e f a l l
i n the Marshall Space Fl ight Center drop tower was b u i l t and
t e s t ed i n the tower. Droplets (X 0.05 cm) of pure nickel and
1090 s t e e l were prepared i n t h i s fashion. The apparatus, includ-
ing instrumentation, i s described. As pa r t of the instrumentation,
a method f o r measuring temperature-time h i s t o r i e s of the f r ee
f loa t ing mstal droplets was developed. Final ly , there i s pre-
sented a metallurgical analysis of the specimens prepared i n the
apparatus.

The program described i n t h i s repor t i s the work of many
people. Leroy H . Berge, the contract ing o f f i c e r ' s representat ive,
wss always ready w i t h suggestions or encouragement when needed.
The MSFC drop tower team performed w i t h dedica t ioqand our in-
terface w i t h the team was smoothed by the constant a t t en t ion of
V. Yost and L. F.amsey, the P.E. Laboratory personnel responsible
fo r the drop tower experiments.
A t Grumman, the design team of E . Kennell.;., M. Kesselman,
and V . Taibbi handled the e n t i r e design and fabr ica t ion . Labora-
tory technicians C . Lottermoser and W . Poi t worked both a t
Grumman and a t MSFC i n conducting experiments. A l l of the thermal
diagnostics was car r ied out by G . Busch and T . Hilgeman. F ina l ly ,
A . Cobrin and M. Sudwischer ca r r i ed out the ed i t ing and typing of
t h i s repor t .
The authors w i s h t o thank everyone for t h e i r help and a s s i s -
tance. The t am e f f o r t has made our job much eas ie r .
iii

TABLE OF CONTENTS
Item
Introduction ............................................. Program Aims ............................................. Hardware Design and Development . . . . . . . . . . . . . . . . . . . . . . . . . .
Battery Pack . . . . . . . . . . . . . . . . . . . . . . . . . . . . . . . . . . . . . . . . Control Panel . . . . . . . . . . . . . . . . . . . . . . . . . . . . . . . . . . . . . . . Vacuum Chamb~r . . . . . . . . . . . . . . . . . . . . . . . . . . . . . . . . . . . . . . Telemetry Anplifier and Signal Conditioner . . . . . . . . . . System Grounding . . . . . . . . . . . . . . . . . . . . . . . . . . . . . . . . . . . .
Experiments . . . . . . . . . . . . . . . . . . . . . . . . . . . . . . . . . . . . . . . . . . . . . . . . . . . . . . . . . . . . . . . . . . . . . . . . . . . . Laboratory Experiments
Bench Test Experiments .............................. . . . . . . . . . . . . . . . . . . . . . . . . . . . . . . Drop Tower Experiments
Analysis of Data ......................................... Telemetered Data . . . . . . . . . . . . . . . . . . . . . . . . . . . . . . . . . . . . Temperature Measurements . . . . . . . . . . . . . . . . . . . . . . . . . . . . Microstructural Analysis ............................
Conciusions and Recommendations .......................... References ............................................... Appendix .. Calculation of Temperature and Energy
from Voltage and Current Measurements ........
Page . 1

LIST OF ILLUSTRATIONS
Figure
1 Tungsten Wire Being Resistance Melted i n the Laboratory .................................... Drming of Chamber ............................ Schematic Drawing of Electronic Circui t ....... Cover t o Vacuum Chamber ....................... Amplifier Circui t ............................. Time t o Form a Sphere of a Given Radius ....... Time t o Sol id i fy a Sphere of a Given Diameter . Threshold Voltage f o r Sphere Formation Using Chroml Wire .................................. Threshold Voltage f o r Sphere Formation Using Nickel Wire ................................... Photograph of Vacuum Pumping Sta t ion .......... Schematic of NASA Drop Tower .................. Specimen Resistance versus Time f o r F i r s t Ser ies of Drops ............................... Energy versus Time fo r F i r s t Series of Drops . . Res i s t iv i ty of S tee l versus Temperature ....... Temperature-Time History f o r 0.051 cm Nickel Wire .......................................... Idealized Temperature-Time Heating Curve f o r a Metal ....................................... Local o r Segmented Fai lures ...................
Page --

Figure
18
19
Page
41 \.
Droplet Shape a s a Function of Time ........... Droplet Shape as a Function of "ecreasing Viscosity ..................................... Art i fac t Is lands a t Sphere Surface (Surface Morphologies) ........................ K6ster Predendrites on Sphere S, i:face (Surface Morphologies) . . . . . . . . . . . . . . . . . . . . . . . . Equiaxed Surface Grains and I n t e r i o r Grain Structure (Surface Morphologies) .............. Typical Dendritic Growth Structures (Surface Morphologies) . . . . . . . . . . . . . . . . . . . . . . . . Eutectoid Transformation i n S tee l (Surface
................................. Morphologies)
An Example of Surface Ghost Grains ....................... ( In terna l Morphologies)
In terna l Voids in Drop Tower Specimen ......... Two Primary In terna l Structures for S tee l Specimens ( In te rna l Morphologies) ............. Iron-Iron Carbide Phase Diagram ............... Isothermal Transformation Diagram f o r S tee l ... Continuous Cooling Diagram fo r S tee l . . . . . . . . . . Carbon Depletion i n S tee l Droplet ( In terna l Morphologies) ................................. Time History of Power for Run T3 .............. Time History of Energy f o r Run T3 ............. Resistance Ratio Versus Temperature fo r S tee l and Nickel .............................. Time History of Resistance for Run T 3 .........

INTRODUCTION
The explo i ta t ion of the space environment f o r mater ials
processing i s very a t t r a c t i v e . This environment, unobtainable
i n an earthbound laboratory, could allow the development of new
materials with v a s t l y improved proper t ies . How we bring about
t h e f u l l u t i l i z a t i o n of t h i s environment t o car ry out unique
types of mater ials processing,however, i s both subt le and per-
plexing. This i s t r u e because the zero gravi ty of space, the
feature most l i k e l y t o a f f e c t materials processing, i s qu i t e d i f -
f i c u l t t o r e a l i z e short of o r b i t a l f l i g h t . Also, most s c i e n t i s t s
and engineers have spent only a few years contemplating the f u l l
meaning of t h i s new environment.
In the present program, conducted under p a r t i a l support from
NASA under Contract NAS 8-28604, Grumman Aerospace Corporation has
explored the use of a f ree f a l l f a c i l i t y , located a t NASAIMarshall
Space Fl ight Center, t o study the e f f e c t s of zero gravi ty on ~ e t a l
melting and s o l i d i f i c a t i o n . The f a c i l i t y i s described i n d e t a i l
i n Ref. 1. In essence, one i s able t o obtain a f u l l three seconds
of zero gravi ty t e s t time. For t h i s br ie f time, the environment
is very close t o an absolute zero gravi ty.
The e f f e c t s of zero gravi ty on metal melting and s o l i d i f i c a -
t ion can bes t be understood i f we have a f a c i l i t y i n a zero gravi ty
environment t h a t i s capable of producing s o l i d i f i e d specimens in
the absence of a crucible with control led specimen heating and
cooling r a t e s , controlled degree of superheat and undercooling,
specimen centering o r d r i f t control , and control led atmosphere,
while recording the f r ee f loa t ing specimen temperature-time h i s -
to ry . The f a c i l i t y should a l so be able t o handle specimens of a
su f f i c i en t s i z e t h a t both microstructure and mechanical propei-ties
can be determined.

In the present contract , we have taken a f i r s t s tep toward
t h i s ult imate f a c i l i t y . The experiment t e s t package developed
under the contract has indi rec t (and l imited) control over heating
and cooling r a t e s , no control over superheat o r undercooling, no
d r i f t control (but, because of low i n i t i a l forces and uniform
specimen heating, very low specimen d r i f t r a t e s ) , a potent ia l f o r
high vacuum, and, f i n a l l y , the capabi1it.y of monitoring the t e m -
perature-time h i s to ry . Specimen s i z e i s too sclali a t present fo r
measurement of propert ies ; i t i s , however, adequate fo r microstruc-
t u r e determination.
This report describes the design and fabr ica t ion of the t e s t
apparatus outlined ebove and discusses the preliminary t e s t s con-
ducted both i n the laboratory and i n the Marshall drop tower.
Microstructural analysis of the specimens prepared both in the
laboratory and during f ree f a l l i n the t e s t package was car r ied
out, and these r e s u l t s a re presented.

PROGRAM AIMS
The t a s k of ascer ta in ing the e f f e c t of zero g r a v i t y on metal
melting and s o l i d i f i c a t i o n i s s impl i f ied i f some time i s spent on
pred ic t ing r e s u l t s . If c e r t a i n r e s u l t s a r e an t i c ipa t ed , they a r e
f a r e a s i e r t o de tec t than e f f e c t s t h a t were not expected. For
t h i s reason, an extensive e f f o r t was expended i n at tempting t o
s t a t e i n advance of experimentation what t h e e f f e c t of zero g r a v i t y
metal processing would be.
Under separa te cont rac t (NAS 8-27891), we developed a n a l y t i c a l
t oo l s t o study segregation efLects i n zero g rav i ty . This work
( R e f . 2) showed t h a t metal d rop le t s s o l i d i f y i n g under zero g r a v i t y
( f r e e l y suspended i n space) would s o l i d i f y from the sur face toward
the cen te r and t h a t t he microst ructure of the d rop le t s would be
s t rongly dependent upon cooling r a t e . The ana lys i s showed t h a t
f o r very slow cooling the sur face s t r u c t u r e would be equiaxed
hexagonal g ra ins t h a t would prt?ceed t o grow toward the sphere cen-
ter. The f i n a l microst ructure would d i sp l ay complete sphe r i ca l
symmetry and a hollow core due t o mater ia l shrinkage upon cool ing.
Our a n a l y t i c a l work gave us o the r information. A model of sur -
face evaporation of binary a l l oys (Ref. 3) showed the importance
of evaporative segregat ion. O f more s ign i f i cance f o r a f r e e f l o a t -
ing molten specimen was the equivalent "g " f l e l d brought about
by d i f f e r e n t i a l evaporation due t o d i f f e r e n t i a l hea t ing . Any hea t
gradient w i l l r e s u l t i n an acce l e ra t i on of the specimen due t o
j e t t i n g a c t i o n .
F ina l ly , considerat ion of t he s p a t i a l environment and consul-
t a t i o n wi th personnel having considerable undercooling experience
l ed us t o t he conclusion t h a t metals cooled i n zero g r a v i t y should
be experiencing a considerable degree of undercooling. There i s

no thermal convection, no container, and a very low vibr~tion en-
vironment. All of these fac?ors will decrease the pr~b:~o~i ' v of
nucleation and growth of the solid phase.
The amount of undercooling can be determined by exami.nation
of the specimen microstructure after solidification in zero gravity.
The undercooled specimen has a spherical grain structure that be-
comes more equiaxed, finer, and more spherical as the degree of
undercooling increases (Ref. 4 ) .
Undercooling takes on a special importance in this program
because we do not see that the zero gravity environment will have
a direct effect on the microstructure of polycrystalline materials.
Undercooling, however, has a marked effect on microstructure. Fur-
thermore, preliminary studies (Refs. 4 and 5) show that mechanical
properties are continually improved as the undercooling increases.
Here then is a way of realizing significant improvements in the
mechanical properties of polycrystalline materials.
This section is intended to point the direction for the ex-
perimental analysis described in the follow,ng sections. It should
be made clear at this time, however, that this program is a con-
tinuing one. The limitations in both time and funds dictated that
the first part of the program (covered by this report) be intended
primarily to confirm the experimental approach. The present effort
culminated with two series of drops in the MSFC drop tower. These
arops confirmed the effectiveness of the experimental approach,
pointed out several shortcomings of the hardware as it is presently
constituted, and supplied us with both high carbon steel and pure
nickel specimens that had been melted and solidified in the three-
second free fall time of the drop tower. These specimens have
been examined mi.-.-.ostructurally and results compared with specimens
prepared in the laboratory.

HARDWARE DESIGN AND DEVELOPMENT
In t he present con t r ac t , w e a r e .-.?quired t o design and de-
velop an experiment package t h a t w i l l m e l t and s o l i d i f y metals i n
vacuum and i n zero g . The package i s t o be capable o f : 1 ) being
t e s t e d i n t he drop tower a t Marshall Space F l ikn t Center and
(2) being launched i n t o a zero g t r a j e c t o r y by an Aerobee rocke t .
The Aerobee rocket places a maximum s i z e l i m i t on t he package
of 15 inches diameter and 36 inches long. The drop tower imposes
a dece le ra t ion load of 25 g l s on the package and has a zero g
p r o f i l e of approximately 3 seconds.
Because of t he shor t time durat ion of zero g i n t he drop
tower, specimens were d i r e c t r e s i s t a n c e melted. In t h i s melt ing
method, an unstable l i q u i d column i s f i r s t formed t h a t cbq 7es i t s
shape through sur face tension f -c ' ces t o one of lower . Thus,
t he column f i r s t forms a s e r i e s of unduloids t h a t u l t l n h - e l y sepa-
r a t e i n t o a s e r i e s of spheres (Ref. 6 ) . Figure 1 shows t h i s se-
quence.
For s imp l i c i t y of f ab r i ca t ion , a c y l i n d r i c a l vacuum chamber
was designed. (All c i r c l e d numbers r e f e r t o p a r t s shown i n Fig . 2 . )
The cover @ on one end i s secured by a quick -.cting clamp @ . The cover contains two high cu r r en t feed-throughs @ on which a r e
fas tened two ad jus tab le buss bars @ , which accommodate var ious
length samples @ . The buss bars a r e braced so a s t o t ake the
dece le ra t ion loads. The cover a l s o has a viewing por t @ , an
e igh t -p in low vol tage feed-through @ , and a mirror a i d pos i t ion-
ing arm (@ and @ ) On t he o the r end of t h e chamber, t h e r e i s a
viewing po r t f o r t he NASA-supplied high speed motion p i c t u r e cam-
e r a @) , a vacuum valve @) , and a vacuum gauge @ . For t he
drop tower experiment, t he chamber and camera a r e fas tened t o a
NASA-supplied 36 inch x 36 inch x 18 inch instrument package frame.

F i g . 1 Tungsten Wire Being Resistance Melted in t h e ~aboratory


PRECEDING PAGE B L A . NOT FILMED
Mounted on one of the buss bars t h a t pass through the cover
and within view of the camera, there i s a reference filament @ f o r measuring sample temperature. On the other buss bar , there i s
mounted a reference cube @ . This mass i s released a t the begin-
ning of the drop by quickly melting a f ine wire on which it i s
suspended. I t s posi t ion with respect t o time is recorded by the
camera. This i s done t o v e r i f y t h a t the samples a re not acceler-
a t ing due t o some in te rna l forces. The reference cube, however,
was never illuminated s u f f i c i e n t l y t o be seen by the camera during
the two se r i e s of drops.
The e lec t ronic system consis ts of four major packages (see
Fig. 3):
NASA-supplied ba t t e ry pack t o power the specimen
NASA-supplied timing relays and control pane 1
Specimen vacuum system and experiment wiring
Telemetry amplifier and s ignal condi- t ioner
Battery Pack -- The ba t te ry pack i s made up of nickel cadmium rechargeable
c e l l s packaged i n two containers and wired i n s e r i e s , r e su l t ing i n
two 14.5 vol t b a t t e r i e s wired i n s e r i e s . The containers a r e
e a s i l y separated, providing e s s e n t i a l l y two independznt 14.5 v o l t
ba t t e r i e s .
Control Panel
The control panel (Fig. 3) has been programed t o zontrol a l l
aspects of the experiment. &on rece ip t of the drop sequence

command (approximately two seconds before ac tua l drop), the follow-
ing equipment i s energized:
High-speed camera
Reference temperature wire
Telemetry amplifier
A l l timing re lays
Approximately one second before drop, the ca l ib ra t ion r e l a y
i s energized. This es tabl i shes known signals f o r the two telemetry
channels. The ca l ib ra t ion duration i s about 100 milliseconds,
thus approximating expected experiment data (melt occurs i n about
100 milliseconds f o r specimens under consideration). A t t he time
the ca l ib ra t ion is terminated, the NASA-supplied f i lm timing mark
generator i s energized, providing a timing reference on t h e f i lm
fo r l a t e r data reduction.
About 0.2 seconds in to the drop, the reference cube acceler-
ometer i s released, followed 0 .1 seconds l a t e r by melting of the
specimen wire. A l l timing is control led by Agastat re lays , Num-
bers 1-4 (see Fig. 3) .
The vacuum chamber has a removable cover a t one end (see
Fig. 4 ) . The cover has e l e c t r i c a l feed-through currents t o speci-
mens of various thickness and length. The specimen holder i s made
of 1/4-inch copper buss bars , and the vacuum feed-throughs a r e of
No. 10 threaded copper. The cover a l s o includes an eight-terminal
e l e c t r i c a l feed-through capable of carrying 10 amps per terminal.
This pravi.des power fo r the observation Imp, reference temperature
lamp, and reference cube re lease wire.

OCTAL COUPLmG
OBSERVATION LAMP
REFERENCE TEMPERATURE
TEST SPECWEN
MIRROR
Fig. 4 Cover t o Vacuum Chamber

Telemetry Amplifier and Signal Conditioner
Contained on t h i s c i r cu i t board is a Zener regulated power
supply, current monitor amplifier, and voltage dividers necessary
for interfacing with the telemetry system. The schematic diagram
i s included in the system wiring diagram (Fig. 3) ; the physical
layout is shown i n Fig. 5.
The regulated supply provides power fo r . the integrated c i r c u i t
operational amplifier, as well as a voltage reference during the
cal ibrat ion interval . Calibration i s accomplished by switching
the input signal t o the current amplifier t o a known reference,
thereby cal ibrat ing the en t i r e telemetry channel including the
current monitor amplifier. The voltage channel i s calibrated i n a
similar manner providing cal ibrat ion of the channel including a l l
loading effects .
The c i rcu i t ry fo r the current monitor necessitated the use of
a biased output signal of about one vol t . As t h i s amplifier i s
energized two seconds before drop, t h i s change i n level (1 volt)
indicates i n i t i a t i on of the timing sequence.
System Grounding
Owing t o the low level monitoring signals and the high cur-
rents drawn by the melting wires, grounding has been careful ly
studied. The experiment has been divided in to f ive blocks fo r
grounding purposes. A l l grounds are returned t o the ground buss
located on the re lay control panel, which provides a s ingle ground
point thereby minimizing ground loops.
Currents from the camera are d i rec t ly returned t o the ground
buss and from there back t o the power source. Current return
l ines from the reference temperature wire, observation lamp and
reference cube release wire are t i ed together inside the vacuum

on the relay control panel . The telemetry amplifier draws only
milliamperes providing very small errors in data acquisition. I /
-
L -rL+ I
I chamber and returned t o the ground buss. Zhe ground return tor the
telemetry amplifier is t i e d to the low side of the specimen cir- * ' *.
cuit arnoeter shunt, and from the shunt returned to the ground buss
Fig. 5 Amplifier Circuit
14
4
1

EXPERIMENTS
Laboratory Experiments
Our i n i t i a l wire melting experiments were ca r r i ed out i n a
b e l l j a r on several mater ials t h a t were avai lab le i n the labora-
tory. These a re tabulated below with the wire diameter i n cent i -
meters. With s u f f i c i e n t power, it was possible t o form spheres
from a l l of these mater ials .
Metals Alloys Coated Wires Other
Ag (0.025) Nichrome (0.051) N i on Cu (0.015) N i T i (0.160)
N i (0.102) Chrome1 (0.038)
W (0.064) Constatan (0.051)
SAE 1080 (0.102)
The wide range of mater ials t h a t were successful ly melted in-
d ica tes t h a t the formation of unduloids and the r e s u l t a n t spheres
is re l a t ed t o the process of power input and not the mater ials .
Since even the highest melting metal, tungsten, formed spheres, it
i s expected t h a t the wire melting experiment can be used t o form
spheres from any meta l l ic conductor as long as it can be fabricated
in to wire o r rod and su f f i c i en t power can be rapid ly applied.
Since, a t present, almost a l l zero gravi ty experiments a r e
time-limited, it i s ins t ruc t ive t o consider what i s the l imi t ing
s i z e of sphere t h a t we can form and s o l i d i f y during t h i s experi-
mentation. If w e assume the process t o be the decay of a l iqu id
column t o a sphere, then the decay time f o r t h i s process has been
I given by (Ref. 7) : I

where
p = density
o = surf ace tension
2R = f i n a l sphere diameter
A survey of the l i t e r a t u r e indicates t h a t p / o has a value
of about 0.06 f o r many metals a t t h e i r melting points . Using
t h i s value, we have p lo t ted the time t o form spheres of various
s i zes , and t h i s i s shown i n Fig. 6 . The arrows indicate the l i m -
i t s on the s i zes of spheres t h a t could be formed i n three seconds
i n the drop tower- (5.1 cm) and i n 12 seconds i n a KC-135 f l i g h t
(- 13 cm) i f su f f i c i en t power i s avai lable .
It i s next of i n t e r e s t t o consider how large a sphere we can
s o l i d i f y i n the time avai lable i f we assume it i s molten a t the
ins tan t of achieving zero g . h i s has been done f o r two cases
(Ref. 8) , both of which assume the sphere is a pure metal a t i t s
melting point . In the f i r s t case, a l l the hea t of fusion i s re-
jected by radia t ion , and evaporation i s neglected. The second
case i s f o r a very v o l a t i l e element and assumes rad ia t ion heat
t r ans fe r i s small. Figure 7 presents some of the r e s u l t s f o r d i f -
fe rent metals. Consideration of Figs. 6 and 7 shows t h a t i n the
time avai lable i n t h e drop tower we can form very large molten
spheres, but they w i l l not be completely s o l i d i f i e d before the
r e s to ra t ion of gravi ty . I f large spheres a r e formed, then only
the outer s h e l l w i l l have a chance t o s o l i d i f y before impact. The
s t r u c t u r e s r e su l t ing from such a s o l i d i f i c a t i o n a r e discussed
under Microstructural Analysis.
When performing the experiment i n a b e l l jar i n the labora-
tory, using ac heating, it was observed t h a t a threshold voltage
(or power) e x i s t s below which no spheres a r e formed. Figures 8 and
9 show examples of t h i s f o r chrome1 and n ickel wire. As the

I - I I i 10 i
1 KC- 135
1 i 1 ! ; - - - . . . - - . . . -- ... .- -- - .- /' . . , - . .. IC-
i
AEROBEE, ASTP
or
SHUTTLE
DROP TOWER
SPHERE RADIUS, R (cm)
Fig. 6 Time t o Form a Sphere of a Given Radius
17


0.04 cm CHROMEL WIRE
1 x 10.4 torr
40 VOLT SECONDARY T A P SLTTING
,
0
C
-
- - - -
- -
- - - - -
-
- I I A
2 0 40 60 80 100 120
PRIMARY VOLTAGE
Fig. 8 Threshoid Voltage for Sphere Formation Using Chrome1 Wire
19

0- 7 . - - J "rn NICKEL WIRE
500 t Cfr HELIU;4 GAS
40 VOLT SECONDARY T A P SETTING
PRIMARY VOLTAGE
Fig. 9 Threshold Voltage for Sphere Formation Using Nickel Wire

voltage increases, the number of spheres formed r i s e s rapidly.
Since the sphere diameter remains re la t ive ly constant, t h i s resu l t
indicates that more of the length of the wire forms spheres. As
expected, increasing the w i r e diameter increases t h i s threshold
voltage; however, the shape of the curve remains the same.
-4 The resu l t s shown i n Fig. 8 are fo r a vacuum of 10 t o r r .
If the pressure i n the chamber i s increased, the threshold voltage
also increases, as shown in Fig. 9. The curves i n Figs. 8 and 9
have the same shape, but the number of spheres formed increases
more rapidly with voltage a t the higher pressure.
Bench TesC Experiments
The apparatus underwent a thorough bench t e s t prior t o shipping
t o Marqhall Space Flight Center. The chamber was connected t o a
vacuum s ta t ion containing a 4-inch diffusion pump and a roughing
pump (see Fig. 10). The one leak found during these t e s t s was i n t l t l the 0 -ring s l i p seal for the ion gauge. This seal was elimi-
nated by welding the gauge flange d i rec t ly t o the chamber. The
gauge was then bolted again t o the flange.
During the vacuum check runs, the chamber was baked out fo r
several days using an e l ec t r i c b l~ .nket . By the time the f i r s t
specimen was f i red in the chamber, we were able t o consistently -4 reach vacuums of 1 x 10 t o r r in the chamber. About 15 t o 20
minutes were required t o reach t h i s vacuum level .
Nine complete bench runs were made. Five of these were re-
corded with color C i l m and one in black and white. No film record ,
was made on the remaining three. These runs showed the need for
several millor changes. The ser ies resistance fo r the chamber view-
ing lamp was decreased, the ser ies resistance t o the reference
temperature bulb w e s selected and ins ta l led , and, f ina l ly , the

F i g . 10 Photograph of Vacuum Pumping Station

f i r i n g sequence was modified because it w a s seen from the s t r i p
chart records t h a t the camera and reference cube c i r c u i t s both
affected the current and voltage of the specimen c i r c u i t . The
sequencing w a s s e t up, therefore, so t h a t the secondary c i r c u i t s
were act ivated p r io r t o a c t i v a ~ i n g the primary specimen c i r c u i t .
This sequencing is shown i n the serv ice manual (Ref. 9) . The
developed f i lm confinned the operation of the specimen melting
c i r c u i t and the reference temperature lamp. The l a t t e r was s e t a t
a i-er'rrer~ce temperature of 1450°C with an o p t i c a l pyrometer.
The bench t e s t s completed the t e s t i n g a t Grumman. The r i g
was a t t h i s point c ra ted and shipped t o MSFC t o begin the t e s t i n g
in the drop tower.
Drop Tower Experiments
The drop tower f a c i l i t y a t MSFC i s described i n Ref. I . It
consis ts of a cyl indr ica l chamber eight f e e t i n diameter and t e n
fee t long where the experiment package, described i n the Hardware ----.-
Design and Development Section of t h i s repor t , is allowed t o f l o a t
f r ee during a 300 foot drop. The chamber has a hemispherical
cap on the bottom. This cap houses a bank of NiCd b a t t e r i e s
used t o power the telemetry t ransmi t te r and other accessories dur-
ing the drop. The top of the chamber i s a cone and houses the
pressure spheres used t o th rus t the e n t i r e chamber (cal led a drag
shield) toward the ground. This t h r u s t overcomes the a i r drag of
the drag sh ie ld and extends the length of zero g t e s t time. The
e n t i r e setup is shown i n Fig. 11 i n a schematic prepared by EWX.
Two s e r i e s of drops about one month apa r t were car r ied out i n
the drop tower. Seven drops were made i n the f i r s t s e r i e s and t en
i n the second. Table 1 lists mater ials and s i z e of specimen f o r
each drop.

1 F
ig.
11
Sch
emat
ic
of
NA
SA D
rop
Tow
er

TABLE 1 MATERIALS AND SPECIMEN SIZES FOR DROPS
Run No. Y: ' :erial Diameter Length (cm) (cm)
T1 Nickel 0.117 6.03
T2 Nickel 0.051 6.03
T3 Nickel 0.051 6.03
T4 Stee l 0.051 6.03
T5 Stee l 0.102 6.03
T6 Nickel 0.102 6.03
T7 Stee l 0.051 6.03
Nickel
Nickel
Nickel
Nickel
Nickel
Nickel
Nickel
Nickel
Nickel
Nickel
Nickel

In t he f i r s t s e r i e s of drops, spheres were formed i n four of
the seven drops. Only i n drops TI , T5, and T6 (where a heavy 11 ,.
wire w a s used) d id spheres f a i l t o form. Drops T6 and T7 had
only 14.5 v o l t s i n t he specimen c i r c u i t (one b a t t e r y ) , but even i wi th reduced vo l tage , Run T7 (0.051 cm d i a s t e e l wire) gave spheres.
. I In only one drop of the second s e r i e s were spheres success-
f u l l y formed. A l l of t h e runs made i n t he second s e r i e s were sim-
u l a t ed i n t h s laboratory p r i o r t o en te r ing the dron tower. Spheres I
were formed i n most cases . In t he Laboratory Exp2riments s ec t ion
we discussed the threshold power needed f o r sphere formation. The -4
laboratory t e s t s were c a r r i e d out i n a vacuum of 10 t o r r and
i n an i n e r t gas (argon) a t atmospheric pressure . In both cases ,
t he re was a threshold power, but it was not markedly d i f f e r e n t .
Subsequent t o t he second s e r i e s of drops, l abora tory exper i -
ments were conducted using "Die Hard" b a t t e r i e s , 0.10 cm N i wire
f i v e c m long, and th ree pressure l eve l s : d i f fu s ion pump vacuum -4 - 2
(Q 1 x 10 t o r r ) , roughing pump vacuum (- 5 x 10 t o r r ) , and
atmospheric p ressure . A t the h ighes t and lowest pressures , spheres
formed, although a t atmospheric pressure they were oxidized. A t
the intermediate pressure , no spheres ever formed; the wire always
broke i n t o segments.
Thus, the explanation f o r t he nonformation of spheres i n t he
second s e t of drops may have r e s u l t e d from t h e outgassing o r leak-
ing of the chamber up t o a c r i t i c a l pressure l e v e l between valve-
o f f and dropping. The pressure-voltage-sphere formation tendency
w i l l be inves t iga ted more f u l l y i n t h e next phase of t h i s work.

ANALYSIS OF DATA
Telemetered Data
Telemetered data f o r sample current and voltage were obtained
i n the form of char t recordings. The char t paper was run a t
25.4 cm per second. The ca l ib ra t ion sequence permitted ca l ib ra -
t i o n of the overa l l instrumentation and chart recorder system.
The time h i s t o r y f o r voltage and current was sampled at
0.254 cm in te rva l s (corresponding t o 0.010 second i n t e r v a l s ) .
The data were e s s e n t i a l l y d i g i t i z e d by measuring the time h i s t o r y
from the reference l i n e t o an accuracy of t0.040 cm,
Measured voltage and current were used t o ca lcu la te instan-
taneous res is tance and power as a function of t i m e . The power
curve was integrated t o develop t h e energy curve as a function of
time. These graphs appear i n Ftgs. 12 and 13. Sample calcula-
t ions a r e included i n the Appendix.
The runs t h a t produced spheres were Runs T2 and T3 (0.051 cm
diameter nickel) and Runs T4 and T7 (0.051 cm d i m s t e r s t e e l ) .
The majority of the da ta reduction e f f o r t w a s d i rec ted t o analyzing
these four runs.
One must remember t h a t res i s tance calculat ions r e s u l t i n qual-
i t a t i v e r e s u l t s , assuming uniform temperature d i s t r ibu t ion and an
equivalent length equal t o the s e t length. In addi t ion, no attempt
has been made t o compensate f o r hockup wiring res is tance , contact
resis tance, heating of contacts, e t c . Energy ca lcula t ions are,
therefore, subject t o Large e r r o r s .
Discussion of Nickel [Runs T2 and T3 (0.051 c m dia) ]
The two runs on 0.051 cm diameter nickel were e s s e n t i a l l y
dupl icates . They were run on d i f fe ren t days but with the same

. I
260 - I -- T7 (0.051 St)
Fig. 12 Specimen Resistance Versus Time for First Series of Drops
200 i ' ' h ! hti 1 : ~ - T2 (0.051 Ni)
180 ; ; <. 1!i ii - - T3 (0.051 Ni)
160 I-; I t :
r -T5 (0.102 St)
... -- /
I
/ i
- - mu-
40
20
I / r--TI (0.127 Ni)
~ . , /
- - T6 (0.102 Ni) 4' f -1
7- ../--- .- .---/ .-. - -.
,H. . . / --- i 1 I. - J - . .... 1 .---- L - L - L . . . - -- L ..--. I- 0 0.02 0.04 0.06 0.08 0.10 0.12 0.14 0.16 0.18 0.20 0.22 0.24
TIME (sec)

TIME (sec)
F i g . 13 Energy Versus Time for F i r s t Ser i e s of Drops
i I
730 " T1 (0.127 Ni)
I / /
/ 600 - ,/
i ,/ i
1 ,#,{
I ,/' , / ,/ !
L 500 -T6 (0.102 Ni) /'
/'
i
T S (0.102 stj 400 r I I' !f ! //
T7 (0.051 St) t
I - T 3 (0.051 N i ) 4
'L T2 (0.051 Ni) ..---A .--.-
0.18 0 .20 0 .~22 0 .~24

ba t t e ry supply, e t c . The r e s u l t s were very similar, providing
almost iden t i ca l f i n a l hot res is tances (0.2250 R - Run T2,
0.2285 R - Run T3) . Resistances determined f o r nickel a t room temperature (cold)
were not i n agreement with published data . It was f e l t t h i s was
dua, t o the d i f f i c u l t y i n reading voltage and current during the
i n i t i a l rapid r i s e i n both values. For t h i s reason, the published
values f o r res is tance a t 20°C were used i n the calculat ions. Tem-
perature calculat ions fo r nickel a t the ins tan t of breaking (hot)
using the f i n a l res i s tances computed from the telemetry resul ted
i n melting temperatures of 1743K f o r Run T2 and 1753K f o r
Run T3. These temperatures agree well with the published melting
temperature f o r nickel of 1728K.
Discussion of Nickel [Run T 1 (0.127 cm dia) and Run T6 (0.102 cm dia) ]
The calculated f i n a l temperature i n Run T1 was 1833K, which
was in reasonable agreement with the published melt temperature.
This specimen did not provide the desired samples but broke i n t o
la rge lengths. From t h i s act ion, it seems the f i n a l temperature
should have been under the melt temperature.
Run T6 was conducted with reduced voltage and calculat ions
give a low f i n a l temperature (1243K). One of the two nickel /
cadmium b a t t e r i e s w a s used, and voltage t o the specimen was
14.5 vo l t s as compared t o 29 v o l t s f o r Runs Tl through T5.
The high speed camera revealed a slow heating rate (0.075 seconds
from v i s i b i l i t y t o f a i l u r e as compared t o 0.025 seconds f o r Run T4)
and an uneven temperature distributLon. The temperature d i s t r ibu-
t ion i s the probable reason f o r the low calculated temperature. As
s t a t e d e a r l i e r , without correct ing f o r the temperature gradient,
ana ly t ica l ca lcula t ions a r e not possible.

Discussion of S tee l
The res is tance versus time curves f o r s t e e l show a nonlinear
behavior with f l a t t en ing of the res is tance of the s t e e l versus
time (see Fig. 12). Published da ta f o r the s t e e l used a re incLuded
in Fig. 14. Note t h a t there i s a change i n the slope of t h e r e -
s i s t i v i t y versus temperature curves on heating above the eutectoid
temperature, 996K. The change i n res is tance versus temperature
i s so small a t temperatures above 1073K t h a t small e r r o r s i n ca l -
culated res is tance can cause very large e r r o r s i n temperature.
As an example, consider a +5 percent e r r o r i n calculat ing
the r e s i s t i v i t y of s t e e l at 1273K. Res i s t iv i ty would vary from
113.5 t o 125.05 microhm centimeters. This corresponds t o a tem-
perature range of from 1063-1626K, an e r r o r band of +35.3 t o
-21 percent, corresponding t o only a +5 percent change i n r e s i s -
t i v i t y . It i s f e l t , therefore, t h a t calculat ions of res is tance
fo r s t e e l w i l l have no value i n obtaining a f i n a l temperature.
No attempt was made t o reduce any of the telemetry da ta from
the second s e r i e s of drops. We can summarize the r e s u l t s from the
f i r s t s e r i e s as follows: In a l l of the energy calculat ions, it i s
obvious t h a t unless the heating is very rapid, resu l t ing i n a uni-
form temperature d i s t r ibu t ion , la rge e r r o r s ensue. S tee l , having
an extremely nonlinear res is tance versus temperature, cannot have
melt temperature calculated from telemetered da ta t o any apprecia-
b le degree of accuracy. Nickel, on the o ther hand, has a l i n e a r
res is tance versus temperature c h a r a c t e r i s t i c yielding qu i t e con-
s i s t e n t r e s u l t s .
A major problem e x i s t s t ry ing t o compute specimen temperature
by t h i s ca lcula t ion method. The method assumes a uniform tempera-
t u r e across a known length and thermal equilibrium, ne i the r of
which appl ies t o t h i s experiment. It i s f e l t t h a t the nickel most

TEMPERATURE ( ' C x 100)
Fig. 14 Resistivity of Steel Versus Temperature

closely approximates the requirements due t o the close agreement
from run t o run.
The r e l a t i v e l y la rge percentage e r r o r f o r low currents should
be avoided through a change i n e i t h e r instrumentation gain or char t
recorder gain when low currents a re expected.
Temperature Measurements - The temperature-time h i s t o r y of a sample i n a melting atid
s o l i d i f i c a t i o n experiment i s of primary importance. In t h i s ex-
periment, temperature measurement i s d i f f i c u l t because of the
rapid i ty of heating and cooling and because of the movement of the
sphere following i t s formation. To follow the specimen and record
i t s temperature-time h i s to ry , a photographic technique using a high-
speed movie camera was developed (Ref. 10) .
Because color f i lm is highly nonlinear, it i s impossible t o
make absolute temperature measurements without a standard. The
use of a standard t o produce reference temperatures i n the appara-
tus allows f o r the necessary corrections on moving from the bench
t e s t ca l ibra t ion t o the drop tower chamber.
The photometric r e l a t i o n is such t h a t the energy density
reaching the film, Eh, i s proportional t o the Planck blackbody
radia t ion function, F, t he exposure time, t , the wire emissivity,
, a geometrical f ac to r , G, and the f i lm bandwidth, A A , and
can be expressed as:
Calibration curves f o r the f i lm were generated i n the labora-
tory using a Bolex model H16M 16n.n motion p ic ture camera and
Kodak Ectachrome EF fi lm, type 7242, from a s ing le batch
(No. 7242779086). The e m l s i o n of t h i s f i lm is balanced f o r 3200K
tungsten l i g h t with an ASA r a t ing of 125. Tung3ten wires approxi-
mately 0.006 cm and 0.010 cm i n diameter were phctographed a t I
various temperatures from 1173-2573K. The wire temperatere WHB
checked before and a f t e r filming with an op t i ca l pyrometer. Be- I
cause of the high in tens i ty of the emission from the wires h i these
temperatures, the camera was run a t 64 frames per second at an . I
aperture se t t ing of f/22. A lens distance of 55.88 cm was t ~ i n -
tained throughout, and the f i lm was developed using the standard . I
Kodak ME4 process. I The developed f i lm wes then analyzed with a Joyce Lobel micro-
densitometer. The microdensitometer was s e t with a l a t e r a l magni-
f i ca t ion r a t i o of 500 t o 1 and a spot s i z e of 0.02 square !
millimeters. Separate traverses were made across each frame f o r I I
the three wavelengths studied (4400, 5300, and 63001). These
correspond, approximately, t o the cha rac te r i s t i c wavelengths of I
the three emulsions. The t r aces f o r each wavelength and each frame
were ca l ibra ted f o r op t i ca l density by inser t ing a precision neut ra l
den i t y f i l t e r i n the microdensitometer beam. The op t i ca l densi ty
of the wire center , fo r each wavelength and frame, was then calcu-
la ted and plot ted as a function of Planckts blackbody radia t ion
I function, a t the anpropriate temperature, These ca l ib ra t ion curves . , I
were then u t i l i z e d , i n conjunction with the Lntcrnal reference wire
in the drop tower package, t o yield specimen temperature data . This
data required a fur ther correct ion f o r the spectr:tl emissivi ty of
the specimen material r e l a t i v e t o t h a t of the tungsten ca l ib ra t ion !
material . I
The experimental sequence i n the drop tower was t o standardize
the reference temperature wire p r io r t o each drop, typ ica l ly 1773K, j
with an op t i ca l pyrometer. The drop tower fi lms, taken a t a speed
of - 300 pictures/second on a 1 6 m Milliken camera, were then I

analyzed for the three wavelengths, and both the specimen wire and
reference optical densities were mnf-tored. For a given wavelength,
the drop tuwer densities of each frame were compared with the pre-
viously generated calibration curves. The reference temperature
was adjusted to the calibration curve, and the unknown zmperature
was then read from the calibration curve. This cross-reference
technique corrected directly for such nonlinear film responses as
development variation, exposure time, geometrical differences, and
the band-pass filters utilized.
This left only one additional photometric correction, which
was the previously mentioned spectral emissivity. This proved to
be somewhat of a problem as the spectral emittance of the test
materials is likely to vary with wavelength, temperature, and sur-
face condition. The emissivity correction is the final c~rrection
and directly alters the apparent specimen temperature, and conse-
quently, is a critical adjustment. Further work will have to be
done to improve this correction. Despite these problems, however,
the brightness temperature technique gives reasonable values and
is fully capable of operating within the experimental time con-
s traints . Several methods are available to obtain mre accurate tempera-
tures. One obvious technique would be to determine emissivity of
the materials of interest at the three wavelengths and as a function
of temperature. This technique has already been developed else-
whe-e and merely requires application to materials of interest.
Another approach would be to make use of the mvltispectral informa-
tion from the three emulsions to measure color temperature instead
of brightness temperature. This would can2el all but second order
emissivity changes with wavelength and temperature. Color tempera-
ture measurement, however, is more sensitive to errors in photome- i 1
try of the film because the blackbody emission is an exponential

function of wavelength f o r our case. A so lu t ion t o t h i s problem
would be t o use a color balance f i l t e r , which would at tenuate the
strong red emission but not the blue. This would require t h a t the
complementary f i l t e r be used f o r v i sua l viewing t o r e s t o r e t r u e
colors . The color balance f i l t e r would have the added advantage
t h a t a l l three emulsions could be u t i l i z e d f o r increased accuracy,
whereas f o r the present work, only two of the three wavelengths
could be u t i l i z e d f o r any given frame.
Figure 15 shows a typica l temperature-time h i s t o r y f o r drop
tower Run T3 (0.051 cm d ia nickel wire) . Shown are the calcula-
t ions fo r the 0 . 5 3 0 ~ and 0.630vm wavelengths. These curves
q u a l i t a t i v e l y follow the ideal ized temperature-time heating and
cooling curves of a pure metal, shown i n Fig. 16. The i n i t i a l , rapid temperature r i s e i s due t o res is tance heat ing of the s o l i d ,
and the plateau, o r thermal a r r e s t , i s due t o the time and heat . . required f o r melting. The sample is now a l iqu id column and super-
heating begins a s the column goes unstable. Unduloids a re formed
and these i n turn spheroidize. A t t h i s point, t he c i r c u i t is
opened and cooling ensues. Cooling progresses u n t i l the sol idus
temperature is reached, and then there i s a thermal a r r e s t due t o
the hea t of s o l i d i f i c a t i o n .
Figure 6 shows t h a t the time required t o form a sphere of
approximately 0.051 cm is about 0.003 second. This i s c lose t o
t h a t shown i n Fig. 15 f o r the f i lm technique. Figure 7 indicates
t h a t the time t o s o l i d i f y a sphere of t h i s diameter while under
f r ee f a l l conditions is s ign i f i can t ly longer, of t h e order of
seconds. This, too, i s recorded i n t h e f i lm temperature-time h i s -
to ry data (Fig, 15) with the l imi ta t ion t h a t sampling was stopped
w e l l before s o l i d i f i c a t i o n was completed. It i s c l e a r , then , tha t
q u a l i t a t i v e l y the f i lm technique o f fe r s confirmation of the idea l -

?IRE '
+I ' A K L COOLING -m- 1
I 0 6 12 18 24 3 0
- - IL - . - - L -..,.-- .-..- . .,
TIME (sec x 10'3)
Fig. 15 Temperature-Time History for 0.051 cm Nickel Wire

ized temperature-time histmy, and althcugh the quantitative agree-
ment is reasonable, we feel that we can improve it.
_A_. _- . . .-.
TIME - Fig. 16 Idealized Temperature-Time Heating Curve for a Metal
Microstructural Analysis
This section describes the surface and interior microstruc-
tures of both the laboratory and drop tower specimens and their
experimental conditions and material parameters. Specimens were
examined for specimen geometry, surface morphology, and interior
microstructure. Each of these is discussed.
Specimen Geometries
Samples of both pure nickel and 1090 steel experienced local
or segmented failures ( F i f 17). The microstructure of these sam-
ples indicated that the bulk of the samples had been heated well
into the grain growth region, but without melting. Melting was
localized to the segment surfaces and some grain boundaries. The
former might be attributed to "skin effect, " whereas the latter might be attributable to chemical, morphological, or electrical
heterogeneity associated with the specific grain boundary.
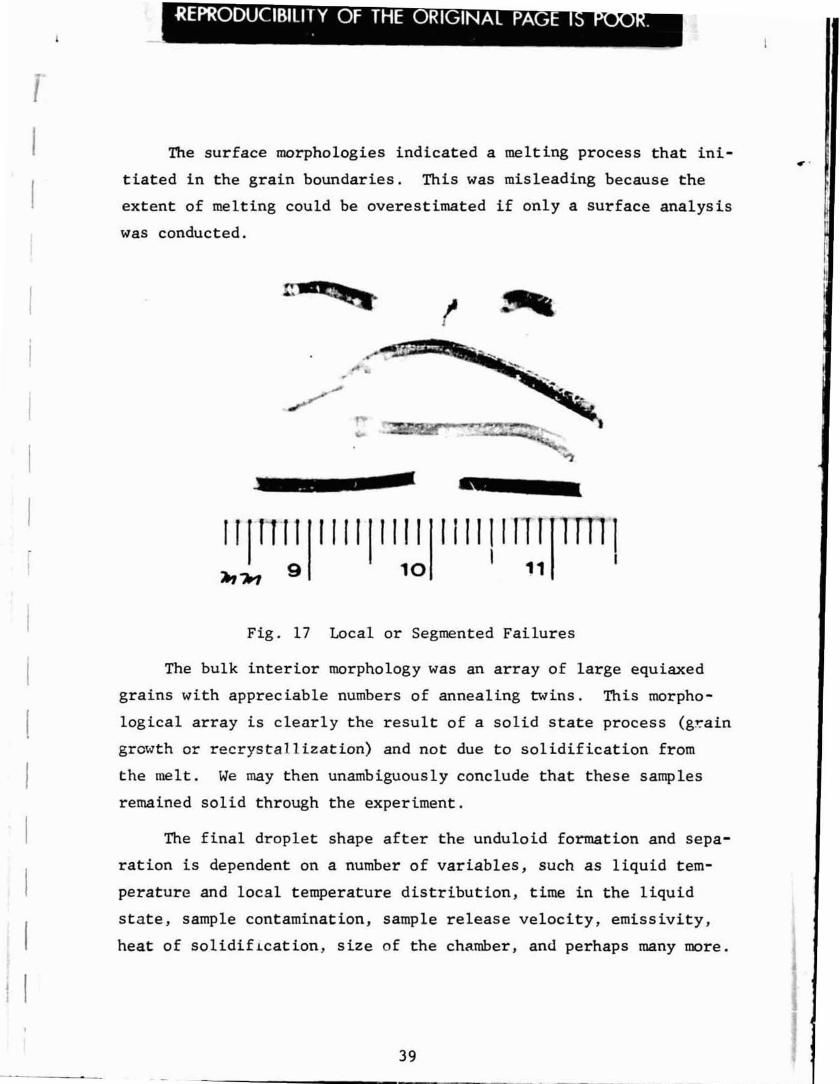
The surface morphologies indicated a melting process that in i - I
t iated in the grain boundaries. This was misleading because the
extent of melting could be overestimated if only a surface analysis
was conducted.
Fig. 17 Local or Segmented Failures
The bulk interior morphology was an array of large equiaxed
grains with appreciable numbers of annealing twins. This morpho-
logical array is clearly the result of a sol id sta te process (grain
growth or recrystallization) and not due to solidification f r o m
the melt. We may then unambiguously conclude that these samples
remained s o l i d through the experiment.
The f inal d r o p l e t shape after the unduloid formation and sepa-
ration is dependent on a number of variables, such as liquid tem-
perature and local temperature distribution, t i m e in the l iqu id
state, sample contamination, sample release velocity, emissivity,
heat of solidif~cation, s i z e of the chamber, and perhaps many more.

We w i l l not pursue each var iable spec i f i ca l ly ; however, t h e i r
overa l l e f fec t s may be grouped i n t o the following considerations:
sample ve loc i ty upon reaching the chamber w a l l , specimen v i scos i ty
upon reaching the chamber w a l l , and the t i m e of so l id i f i ca t ion .
Uti l iz ing t h i s generalization, an in te res t ing analogy can be made,
with reference t o work conducted i n the study of l iqu id wetting
(Ref. 11). In t h i s work, a drop of l i q u i d a t constant temperature,
and therefore of constant v i scos i ty as q = f (T), i s placed on
substrat2 at the same temperature. The droplet of wetting l iqu id
i s then watched as a function of time, and the droplet shape se-
quence i s shown diagrammatically (see Fig. 18) . If we now consider an analog t o be somewhat consis tent with
our expe:riment, we must consider v i scos i ty the primary var iable ,
and we nrdst approximate t h a t the time avai lab le f o r s o l i d i f i c a t i o n
on impact w i l l be small and, therefore, r e l a t i v e l y constant
(constant - t ) . We may now present a new sequence of specimen
geometries i n Fig. 19. It i s c l ea r t h a t t h i s new geometrical se-
quence i s s imilar t o t h a t shown i n Fig. 18 (Ref. l l ) . It appears,
then, t h a t the observed macroscopic geometrical shapes noted a re
r e l a t ed most d i r e c t l y t o specimen v iscos i ty . Decreasing v i scos i ty
o r increasing ve loc i ty w i l l r e s u l t i n a specimen shape comparable
t o tha t shown i n Fig. 19.
Some samples have a s o l i d i f i e d s h e l l p r i o r t o contact with
the chamber wal ls . In t h i s case, i f the s h e l l i s of s u f f i c i e n t
s t rength t o withstand the impact, t he specimens w i l l remain spheri-
c a l o r only be p a r t i a l l y f la t tened , and the s o l i d i f i c a t i o n pa t t e rn
w i l l not emanate from the region of t h e f l a t .
In general, it was found t h a t the degree of spher ic i ty of the
drop tower samples was considerably g rea te r than t h a t of the
laboratory samples. This r e f l e c t s t h e increased s o l i d i f i c a t i o n

Fig . 18 Drople t Shape as a Function o f Time
q = f (T) = c o n s t
ti + 1 > ti

*u
t t = const .
qi %+l
Fig. 19 Droplet Shape a s a Function of Decreasing V i s c o s i t y

time i n the drop tower before contact i s made with the chamber
wal ls . Consistent with t h i s increased time, the samples were
b e t t e r able t o withstand the wal l contact . As the thermal contact
with the wal l was poorer, due t o enhanced spher ic i ty , the samples
indicated a slo-ier s o l i d s t a t e cooling r a t e .
Droplet Surface Morphologies
The sphere surface morphologies were var ied, but , as noted
previously, were not always representat ive of the in te rna l morphol-
ogies. They were a l so s ign i f i can t ly a f fec ted by res idual so l id ,
contamination, and cooling r a t e .
Figure 20 i l l u s t r a t e s how a p a r t i c l e of res idual s c l i d a t the
sphere surface can a c t as a s o l i d i f i c a t i o n nucleus. This r e s u l t s
i n rapid dendri t ic growth emanating from the edges of the s o l i d
" a r t i f a c t . " These a r t i f a c t s may be regions s t a b i i i z e d by oxygen
o r nitrogen contamination o r may simply be regions t h a t were not
at a temperature grea ter than the l iquidus temperature long enough
t o completely melt, e i t h e r during primary melting o r during r e -
calescence. They a re s ign i f i can t ly l a rge r than the c r i t i c a l nuc le i
needed f c r s o l i d i f i c a t i o n and cauge a rapid surface s o l i d i f i c a t i o n .
Figrire 20a show thi.a art i fac t ef fec t using 1.i.ght opt ics , and
Fig. 20b shows the same region with the scanning e lec t ron micro-
scope (SEM) . When the cooling w a s rapid, i n addi t ion t o having the s o l i d i -
f i ca t ion nuclei present, the surface morphology emanating from
these a r t i f a c t nucle i was an extremely f i n e dendri te s t ruc tu re
with no secondary o r t e r t i a r y dendrite arms. These a re sometimes
referred t o as K6ster predendrites and a re shown o p t i c a l l y and i n
the SEM i n Fig. 21, respect ively. Although these have been re -
ported i n c h i l l cast ings, they a re unusual s t ruc tu res f o r these
containerless cooling conditions. It i s in te res t ing t o note, too, I
I

(a) Optical (2 SOX)
F i g . 20 Artifact Islands at Sphere Surface (Surface Morphologies)

Optical (2 50X)
Fig. 21 K6ster Predendrites on Sphere Surface (Surface Morphologies)

t h a t a t t h e i r f u r t h e s t ex ten t they seem t o demonstrate an e f f e c t
s imi l a r t o a vor tex. This may be more of an o p t i c a l e f f e c t than
ac tua l mapping of t he kinematic l i q u i d motion. These microstruc-
t u r e s were noted i n both the laboratory and drop tower samples.
The sur face morphologies of those samples t h a t had the h ighes t
degree of sphe r i c i t y invar iab ly exhibi ted an equiaxed sur face g r a i n
morphology. These g ra ins were not always represen ta t ive of t h e in -
t e r i o r g ra in s t r u c t u r e . That i s , they were not always c a r r i e d
through i n t o the i n t e r i o r , and sometimes t h e i n t e r i o r g r a i n s t r u c -
t u r e could be seen i n addi t inn t o t he equiaxed sur face morphology.
This is shown i n Fig . 22a and i s reproduced schematically i n
Fig. 22b. Although the i n t e r n a l g ra in s are l i k e l y t o be t i e d t o
s p e c i f i c sur face g ra ins t h a t were favorably or ien ted f o r r ap id
growth from both the m 2 l t and i n t l ~ e so l id s t a t e , t h e i r r e l a t i o n -
ship t o these "parent" g ra ins i s not always an obvious one. This
phenomenon may be concluded t o be a sur face a r t i f a c t and a s o l i d
s t a t e g ra in growth phenomenon.
Class ica l dendr i t i c growth was a l s o noted i n a l imi ted number
of cases, and a p a r t i c u l a r l y good example i s shown i n Fig. 23.
This was f o r a pure n i cke l l abora tory sample, and t h e dendr i te
arms a r e mutually perpendicular and correspond t o (100) d i r ec -
t i o n s i n t he face centered cubic l a t t i c e .
An add i t i ona l sur face f ea tu re , but one t h a t i s not d i r e c t l y
r e l a t e d t o t h e s o l i d i f i c a t i o n process, i s shown i n Fig. 24. This
i s a t considerably higher magnification and r e l a t e s only t o t h e
1090 s t e e l samples. This morphological e f f e c t i s due t o t he s o l i d
s t a t e eu tec to id transformation i n s t e e l s . In the case shown, t h e
sample transformed rnar tens i t i ca l ly (without d i f fus ion) , and the
sur face rumpling may be due t o t h i s process. Al te rna t ive ly , t h e
samples may transform by d i f fu s ion , forming p e a r l i t e r a t h e r than

(a) Optical ( 2 SOX)
Fig. 22 Equiaxed Surface Grains and Interior Grain Struc tute (Surface Morphologies)

Fig. 23 Typical Dendritic Growth Structures (Suw face Morphologies)

F i g . 24 Eutectoid Transformation in Steel (Surface Morphologies)
Metallically Bright
(Opt ica 1) (1500X)
'Ghost' Grains
Fig. 2 5 An Example of Surface Ghost Grains (Internal Morphologies)

martensite, and t h i s a l so may r e s u l t i n surface rumpling. Marten-
s i t i c and p e a r l i t l c s t ruc tures were noted i n both the laboratory
and drop tower samples, but the former was more prevalent i n the
laboratory samples, implying a f a s t e r cooling r a t e fo r the labcra-
tory specimens.
One l a s t fea ture noted i s tha t the samples t h a t l ingered f o r
the longest period of time i n the f r ee f l o a t condition a l s o showed
some surface discolorat ion due t o oxidation reac t ions . This d i s -
coioration was most noticezblc f o r the steelsl but was noted a l s o
f o r the nickel samples. It is ant ic ipated t h a t improvements i n
the f a c i l i t y pumping s t a t i o n w i l l cor rec t t h i s s i t u a t i o n ,
Droplet Internal b rpho log ies
The majority of the in te rna l morphologies a re analogous t o
those previously mentioned and so t h i s sect ion emphasizes those
aspects tha t a re d i f f e ren t .
Figure 25 i s the reverse of Fig. 22 i n t h a t the enlarged in-
t e r n a l grains a re shown, and, in t h i s near-surface sect ion, the
debris from the primary surface s t ruc tu re i s superimposed on the
equiaxed in te rna l grain s t ruc ture . This sample i s a laborary
sample, but t h i s e f f e c t was noted f o r a l l samples t h a t had moder-
a t e o r low so l id cooling r a t e s .
Figure 26 shows a sample tha t demonstrates a grea t deal of
in terna l porosity, as predicted by the solidification theor ies
(Ref. 2 ) . The void area i s d is t r ibuted uniforinly throughout the
i n t e r i o r of the sphere and may have resul ted from rapid s o l i d i f i -
cat ion due t o impact a f t e r an external s h e l l had formzd.
Figure 27 demonstrates the two primary in te rna l s t ruc tures
noted for the 1090 s t e e l . The varying i n t e r i o r grain morphology
i s a r e s u l t of the varying cooling r a t e s on t r a n s i t i n g the

Fig. 26 Interne1 Voids in Drop Tower Specimen ( 5 0 ~ )
eutectoid transformation at 9961(, as shown in ~ i g . 28. his trans-
f0rmatiQII occurs without diffusion (martensttically) on very rapid
cooling (Fig . 27a) or w i t h diffusion on slow cooling (Fig. 27b)
forming a pearlitic array of alternating lamrllae of ferrite and
cementite. An intermediate structure is normally anticipated that
is referred t o as bainite . Figure 29, t h e isothermal transform- tion diagram for t h i s steel, would lead us to anticipate t h i s as a -
prevailing structure for most cooling rates. T h i s , however, was
not the case, and the reason As that our experimentation involved
cont inuo~s cooling. A continu~us-c~oling transf *-tion diagram
i s shown in Fig. 30 f o r a steel that behaves simflarly t o the 1090
steel u t i l i z e d in our experimentation, This c lear ly shows that the
readily available I -T diagrams are invalid far continuous cooling,
and tha t the anticipated bainitic transformation is virtually

CbE Pear litic
(1SOOX)
Fig. 27 Two Primary Internal Structures for Stea, Specimens (Internal Morphologies)

Fig. 28 Iron-Iron Carbide Phase Diagram
completely shrouded by the martensitic and pearlitic reactions.
As a result, no appreciable bainite is formed nor should be antici-
pated.
One f inal effect should be noted for the steel samples: Al- though t h i s IB a surface effect, it is most clearly demonstrated
bv shwing the near-surface microstructure (Fig. 31). Clearly, -
there has been an appreciable loss in carbon, and reference to
Fig. 28 w i l l shm that carbon loss will result in increased amounts
of proeutectoid ferrite (white) and reduced amounts of pearlite.
Thi.8 is emctly what is shown i n Fig. 31.

Fig. 29 Isothermal Transformation Diagram for Steel
. I - I
Martensite . . I

Fig. 30 Continuous Cooling Diagram for Steel

Decazrburf zed Region (1 soox)
F i g . 31 Caebon Depletion in Steel Droplat (Internal Morphologies)
56

In conclusion, we may say that the macroscopic and microscopic
morphologies vary appreciably, but consideration or extension of
the available technology base i s capable of explaining the varia-
tions.

CONCLUSIONS AND RECOMMENDATIONS
Direct r e s i s t ance melting of wire specimens has proven t o be
a very e f f e c t i v e way of preparing molten metal specimens i n any . I l imi ted time zero g rav i ty f a c i l i t y . In the f i r s t s e r i e s of drops,
we success fu l ly melted and r e s o l i d i f i e d both n i cke l and s t e e l speci- . I mens during the th ree seconds of f r e e f a l l . I
Because of a lack of con t ro l over cooling r a t e , d rop le t s with
t r u e sphe r i ca l symmetry i n the gra ins were no t r ea l i zed . Droplets
were cooling from the ou ts ide i n toward the cen te r and there were . I
s t rong ind ica t ions on some specimens of ma te r i a l dep le t ion a t the
cen te r of the drople t . . I
Shadow gra ins were i n evidence on severa l specimens. An equi- - 1 axed surface g ra in o f t e n had a wel l ordered hexagonal g ra in j u s t
below i t , which was v i s i b l e i n the surface micrographs. This i s a -. : I s o l i d s t a t e , g ra in growth phenomenon. i
Many of the specimens contacted the container wal l before
s o l i d i f i c a t i o n was complete. The phenomena of very rap id cool ing
a f t e r a pa t t e rn of g ra in s t r u c t u r e had been es tab l i shed introduce
s t r u c t u r e s t h a t a r e q u i t e d i f f e r e n t from t h a t found on d rop le t s
t h a t completely s o l i d i f i e d before contact ing the container wal l .
The p a r t i a l l y s o l i d i f i e d specimens a r e experiencing e s s e n t i a l l y a
rap id quench a t a point i n t he cool ing cyc le . S t ruc tures formed
under these condi t ions need more a n a l y t i c a l and empir ical study.
A f i lm technique f o r measuring temperature of t h e f r e e f l o a t -
ing d rop le t was developed during the con t r ac t . Although r e f ine -
ments a r e needed, temperature-time h i s t o r i e s of the d rop le t s were
computed.

From the f i r s t two ae r i e s of drops, severa l needed modifica-
t ions t o the apparatus became evident. Specimen s i z e scale-up
proved more d i f f i c u l t than ant ic ipa ted . It appears now tha t only
through added cont ro l i n the specimen heating c i r c u i t can we hope
t o reach t h e s i ze l i m i t d ic ta ted by cooling time avai lable .
The melting process has tntroduced more forces on the speci-
men than was o r ig ina l ly ant ic ipa ted . The forces seem t o be p r i -
marily due t o an elongation i n the wire specimen j u s t prio: t o
unduloid formation. Since we have no way of cont ro l l ing specimen
motion a f t e r the droplets formed, i t becomes very important t h a t
the droplets a r e released w i t h l i t t l e or no accelerat ing forces .
Careful study of the wire melting process i n the laboratory should
lead t o ways of minimizing these forces .
Wi th an improved apparatus, the next s e r i e s of drops i n the
MSFC drop tower w i l l allow another s t e p forward i n the understand-
ing of metals so l id i fy ing i n a zero gravi ty environment.

REFERENCE S
1. McAnelly, w. B. and Covington, S. S. , Low-Gravity Fluid Mechan- I
i c s Drop Tower F a c i l i t y , NASA Tech. :demorandurn No. 53817, Feb- . I
ruary 1969.
2 . L i , C . H . , "Segregation E f f e c t s during S o l i d i f i c a t i o n i n Weight-
l e s s Melts," Grumman Research Proposal RP-425, J u l y 1971. I 1 3 . Li, C . H . , "Segregation E f f e c t s during S o l i d i f i c a t i o n i n Weight-
l e s s Melts," F i n a l Report on NASA Contract NAS 8-27891, June . I 1973. 1 - #
4. Kattamis, T . 2 . and Flemings, M. C . , Prod. Cast ing, Vol. 52,
No. 1, 1967, p. 191.
5. Kattamis, T . Z . , Current Inves t ig s t i ons , Department of Metal- .. I - 1
lurgy, I n s t i t u t e of Mater ia ls Science, Univers i ty ef Connecti- - I c u t , Stans, Connecticut.
1
6. Chace, W . G . , Liquid Behavior of Exploding Wires ," Physics of - 1 Flu ids , Vol. 2 , No. 2 , March-April 1959.
7. Paynter, H . L . , AIAA Jour . , Vol. 2 , p. 1624, 1964.
8 . Reichman, J . , t ' So l id i f i ca t ion of Molten Spheres i n Vacuum,"
Grumman Research Department Memorandum, RM-544, June 1972.
I I
9. Service Manual f o r Apparatus t o Be Used i n NASAIMSFC Drop I
Tower i n Inves t iga t ing Metal S o l i d i f i c a t i o n i n Zero Gravity
(Contract NAS 8-28604), December 1972. I
10. Busch, G. and Hilgeman, T . , "A Photographic Technique f o r Mea- l su r ing Temperatures," Grumman Pceeearch Department Memorandum,
t o be published.
11. Zisman, W . , "Spreading of O i l s on Water ," J. Chem. Phys . , Vol. 9 , p. 534, J u l y 1941.

APPENDIX
CALCULATION OF TEMPERATURE AND ENERGY
FROM VOLTAGE AND CURRENT MEASUREMENTS
During each drop, voltage and current i n the specimn c i r c u i t
were telemetered t o a cen t ra l receiving s t a t i o n , This information
was used t o compute a time h i s t o r y of energy and a f i n a l specimen
temperature, The analysis f o r each of these ca lcula t ions is ire-
sented i n t h i s Appendix,
Enerey Computation - Current and voltage were read from the telemetry records at
every 0.010 second. The data f o r Run T3 a re ::! -;.ven i n Table A-I..
The product was then plot ted t o give a power time h i s to ry . A
typica l power curve (taken from data of Run T3) is shown i n
Fig. A-1.
TABU A - 1 RUN NO. T3 (0.051 cm d i a Mi)
Calculated Calculated Time Current Voltage Wattage Resistance
0 406 25.24 10,247 62,167
0.01 218 26.19 5,709 120.138
0.02 156 27.62 4,309 177.051
0.025 12 5 28.57 3,571 228.560
(Wire Separation)
The power curve was numerically integrated t o obtain the
energy as a function of time. The energy curve from the integrated
p w e r cume is shown i n Fig. A-2, Energy curves f o r a l l of the
f i r s t series of runs were computed i n t h i s manner and a re presented
i n t h e main t e x t .

TIME (sec)
F i g . A - 1 Time History of Power for Run T3
TIME (sec)
Fig. A02 Time History of Energy for Run T3

Temperature Calculations
To obtain the final nhkel specimen temperature, a linear re-
lation between temperature and resistance was assumed. Thus the
resirtance at any temperature, T, is related to the resistance
at 0°C by
The temperature coefficient of resistance, a, is the proportion-
ality constant and is given in the literature (Ref. A-1) for most
materials. A value of 0.0047 per "C was used in this report.
For T = 20°C this becomes
Thc ratio of R ~ / R ~ ~ is then equal
For the value of a = 0.0@47,
This equation is plotted in Fig. A-3.
For steel the relationship wae nonlinear and taken from
Ref. A-1. The c4! I for steel is also plotted on Fig. A-3.
The resistance was plotted as a function of time by computing
E/I at 0.01 second intervals from the telemetry charts. A I -
typical resistance curve is shown in Fig. A-4. These data were
taken from Run T3 also, To compute the final specimen tempera- I -,
ture, the final resistance was read from the time history and 1 , , - , . R


TIME (sec)
Fig . A-4 Time History of Resistance fo r Run T3
divided by the res is tance a t 20°C. The r a t i o was used with the
curves in Fig. A-3 t o read f i n a l temperature,
The res is tance a t 20°C was computed from the r e s i s t i v i t y p .
The r e s i s t i v i t y was taken from the l i t e r a t u r e (Ref. A-1). The
values used were
Nickel 9.5un-cm ( 0 ° C )
Stee l 1 8 . 0 ~ 0 - c m (20 "C)
The res is tance f o r n ickel at 20°C i s then equal t o
where 1 is t h e length of the specimen and A .s t he cross-
sec t ional area.

The res is tance f o r s t e e l a t 20°C is then equal t o 11
Since the va r i a t ion of the c h a r a c t e r i s t i c constants of any
material depend upon physical changes Cn the mater ial , the r e l a -
t ionships a re of ten qu i t e complex and c e r t a i n l y not l inea r . For
the calculat ions i n t h i s Appendix, t h i s is true f o r the tempera-
t u r e coeff ic ient of res is tance . Over small temperature ranges,
the l inea r re la t ionship is qu i t e accurate. But, from room t e m -
perature t o melt temperature where the mater ial i s undergoing
severa l complex physical and chemical changes, t h i s assumption
probably introduces appreciable e r r o r . This explains why a
material l i k e pure nickel i s more amenable t o the ca lcula t ions
than a complex a l l o y l i k e 1090 s t e e l .
A-1 Lyman, T.. Metals Handbook of the ASM, The knericar.1 Society
fo r Metals, 1948.