Research Note Linking Outcomes From Peabody Picture ... · JSLHR Research Note Linking Outcomes...
10
JSLHR Research Note Linking Outcomes From Peabody Picture Vocabulary Test Forms Using Item Response Models Lesa Hoffman, a Jonathan Templin, b and Mabel L. Rice c Purpose: The present work describes how vocabulary ability as assessed by 3 different forms of the Peabody Picture Vocabulary Test (PPVT; Dunn & Dunn, 1997) can be placed on a common latent metric through item response theory (IRT) modeling, by which valid comparisons of ability between samples or over time can then be made. Method: Responses from 2,625 cases in a longitudinal study of 697 persons for 459 unique PPVT items (175 items from Peabody Picture Vocabulary Test—Revised [PPVT–R] Form M [Dunn & Dunn, 1981], 201 items from Peabody Picture Vocabulary Test—3 [PPVT–3] Form A [Dunn & Dunn, 1997], and 83 items from PPVT–3 Form B [Dunn & Dunn, 1997]) were analyzed using a 2-parameter logistic IRT model. Results: The test forms each covered approximately ±3 SDs of vocabulary ability with high reliability. Some differences between item sets in item difficulty and discrimination were found between the PPVT–3 Forms A and B. Conclusions: Comparable estimates of vocabulary ability obtained from different test forms can be created through IRT modeling. The authors have also written a freely available SAS program that uses the obtained item parameters to provide IRT ability estimates given item responses to any of the 3 forms. This scoring resource will allow others with existing PPVT data to benefit from this work as well. Key Words: item response models, Peabody Picture Vocabulary Test (PPVT), item response theory (IRT) A ccurate measurement of individual differences is critical for testing theories about cognition and its development, as well as for making critical real-world decisions about the ability of a given individual. Maintaining reliability of measurement within longitudinal studies can be especially challenging, given that test items may need to be added or removed over time to preserve sensitivity of measurement across devel- opmental stages. Such necessary modifications, as well as revision of existing instruments over time or use of alternative test forms, can threaten comparability of the resulting test scores. Without comparable measurement across occasions of study, one cannot determine whether any observed change in test scores over time is due to real growth or is simply an artifact of differing procedures of measurement. This article focuses on the changing test forms, over time, of the Peabody Picture Vocabulary Test (PPVT; Dunn & Dunn, 1981), an instrument that is widely used for assessing vocabulary knowledge in children and adults. It is well suited to the assessment of children’s vocabulary acquisition and for identification of children with lan- guage impairments (cf. Rice & Watkins, 1996). A recent study identified the PPVT as one of the diagnostic instru- ments frequently used by speech-language pathologists in clinical practice to diagnose specific language impair- ment (SLI) in children (Eickhoff, Betz, & Ristow, 2010). PPVT scores serve as estimates of vocabulary growth as a consequence of language intervention (cf. Rice & Hadley, 1995), as a description of growth in vocabulary in early childhood (cf. Rice, 2009), and as a validity comparison for growth in other indicators of language acquisition, such as the mean length of utterance (Rice, Redmond, & Hoffman, 2006). Various versions of the PPVT continue to be used by researchers and clinicians within and out- side the field of speech pathology to document children’s a University of Nebraska—Lincoln b University of Georgia, Athens c University of Kansas, Lawrence Correspondence to Lesa Hoffman: [email protected] Editor: Janna Oetting Associate Editor: Ron Gillam Received August 6, 2010 Revision received April 21, 2011 Accepted October 6, 2011 DOI: 10.1044/1092-4388(2011/10-0216) Journal of Speech, Language, and Hearing Research • Vol. 55 • 754–763 • June 2012 • D American Speech-Language-Hearing Association 754 Complimentary Author PDF: Not for Broad Dissemination
Transcript of Research Note Linking Outcomes From Peabody Picture ... · JSLHR Research Note Linking Outcomes...

JSLHR
Research Note
Linking Outcomes From Peabody PictureVocabulary Test Forms Using Item
Response ModelsLesa Hoffman,a Jonathan Templin,b and Mabel L. Ricec
Purpose: The present work describes how vocabulary ability asassessed by 3 different forms of the Peabody Picture VocabularyTest (PPVT; Dunn&Dunn, 1997) can be placed on a common latentmetric through item response theory (IRT) modeling, by which validcomparisons of ability between samples or over time can thenbe made.Method: Responses from 2,625 cases in a longitudinal study of697 persons for 459 unique PPVT items (175 items from PeabodyPicture Vocabulary Test—Revised [PPVT–R] Form M [Dunn &Dunn, 1981], 201 items from Peabody Picture VocabularyTest—3 [PPVT–3] Form A [Dunn & Dunn, 1997], and 83 itemsfrom PPVT–3 Form B [Dunn & Dunn, 1997]) were analyzed usinga 2-parameter logistic IRT model.
Results: The test forms each covered approximately ±3 SDs ofvocabulary ability with high reliability. Some differences betweenitem sets in item difficulty and discrimination were found betweenthe PPVT–3 Forms A and B.Conclusions: Comparable estimates of vocabulary ability obtainedfrom different test forms can be created through IRT modeling. Theauthors have also written a freely available SAS program thatuses the obtained item parameters to provide IRT ability estimatesgiven item responses to any of the 3 forms. This scoring resource willallow others with existing PPVT data to benefit from this work as well.
Key Words: item response models, Peabody Picture VocabularyTest (PPVT), item response theory (IRT)
A ccurate measurement of individual differencesis critical for testing theories about cognitionand its development, as well as for making
critical real-world decisions about the ability of a givenindividual.Maintaining reliability of measurementwithinlongitudinal studies can be especially challenging, giventhat test itemsmay need to be added or removed over timeto preserve sensitivity of measurement across devel-opmental stages. Such necessary modifications, as wellas revision of existing instruments over time or use ofalternative test forms, can threaten comparability of theresulting test scores. Without comparable measurement
across occasions of study, one cannot determine whetherany observed change in test scores over time is due to realgrowth or is simply an artifact of differing procedures ofmeasurement.
This article focuses on the changing test forms, overtime, of the Peabody Picture Vocabulary Test (PPVT;Dunn & Dunn, 1981), an instrument that is widely usedfor assessing vocabulary knowledge in children and adults.It iswell suited to the assessment of children’s vocabularyacquisition and for identification of children with lan-guage impairments (cf. Rice &Watkins, 1996). A recentstudy identified the PPVTas one of the diagnostic instru-ments frequently used by speech-language pathologistsin clinical practice to diagnose specific language impair-ment (SLI) in children (Eickhoff, Betz, & Ristow, 2010).PPVTscores serve as estimates of vocabulary growth as aconsequence of language intervention (cf. Rice & Hadley,1995), as a description of growth in vocabulary in earlychildhood (cf. Rice, 2009), and as a validity comparisonfor growth in other indicators of language acquisition,such as the mean length of utterance (Rice, Redmond, &Hoffman, 2006). Various versions of the PPVT continueto be used by researchers and clinicians within and out-side the field of speech pathology to document children’s
aUniversity of Nebraska—LincolnbUniversity of Georgia, AthenscUniversity of Kansas, Lawrence
Correspondence to Lesa Hoffman: [email protected]
Editor: Janna OettingAssociate Editor: Ron Gillam
Received August 6, 2010Revision received April 21, 2011Accepted October 6, 2011DOI: 10.1044/1092-4388(2011/10-0216)
Journal of Speech, Language, and Hearing Research • Vol. 55 • 754–763 • June 2012 • D American Speech-Language-Hearing Association754
Complimentary Author PDF: Not for Broad Dissemination
language acquisition (cf. Snow et al., 2007, for use of thePeabody Picture Vocabulary Test—3 [PPVT–3; Dunn &Dunn, 1997]. More recently, PPVT scores have servedas phenotypes in genetic investigations (Rice, Smith, &Gayán, 2009).
The PPVT measure of vocabulary features multiple-choice items in which four pictures are shown for eachvocabulary word (including verbs, nouns, and adjec-tives). The respondent is instructed to select the picturethat best illustrates the definition of the word (readaloud by an examiner, who then scores the response ascorrect or incorrect). The PPVTwas originally developedin 1959 (Dunn & Dunn, 1959), and a revised version in-cluding two alternate forms was developed in 1981(Peabody Picture Vocabulary Test—Revised [PPVT–R]Forms L [PPVT–Rl] andM [PPVT–Rm]; Dunn&Dunn,1981). A third version (Peabody Picture VocabularyTest—3 [PPVT–3]), also with two alternate forms, wasdeveloped in 1997 (PPVT–3 Forms A [PPVT–3a] andB [PPVT–3b]; Dunn & Dunn, 1997). A fourth version(Peabody Picture Vocabulary Test—4 [PPVT–4]; Dunn&Dunn, 2007]) with two alternate forms was developed in2007 (PPVT–4 Forms A [PPVT–4a] and B [PPVT–4b]).
Perhaps more than any other test, there has beenextensive discussion of potential differences with clinicalimplications across test versions, especially for PPVT–Rversus PPVT–3, in which higher scores on the PPVT–3have raised concern. Ukrainetz and Duncan (2000) notedthat Washington and Craig (1992, 1999) found highermean levels of performance on PPVT–3 for a sample ofchildren very similar demographically to a previoussample, although no children received both forms ofthe tests, thereby weakening the comparison. Ukrainetzand Duncan (2000) reported an analysis of publisher testdata for 193 children who received PPVT–3 and Form Lof the PPVT–R. They found test scores approximately10 standard score points higher on PPVT–3 in the 7- to10-year age range and about 4 points higher for olderchildren. Gray, Plante, Vance, and Henrichsen (1999)compared 31 children ages 4 to 5 years with SLI and31 age-matched control children and reported high va-lidity but weak sensitivity for SLI for PPVT–3. Pankratz,Morrison, and Plante (2004) administered PPVT–R andPPVT–3 to 76 adults with differing levels of languageability. They found fewer individuals identified as hav-ing low levels of vocabulary on the PPVT–3. Peña,Spaulding, and Plante (2006) suggested that the in-clusion of language-impaired persons in the normingsample could lessen sensitivity to vocabulary deficits.Although the publishers of the PPVT have offered aconversion table for thePPVT–3 tousewith thePPVT–R,a similar conversion table has not been made availablefor the current version, the PPVT–4. As a result, thePPVT–3, even with lessened sensitivity to language
impairments,may remain the better option for a numberof research studies.
One potential consequence of such continuallyevolving instruments is that the use of different PPVTforms across time may create problems in measuringgrowth in vocabulary ability in longitudinal studies.Standard scores cannot be used to assess absolutegrowth (i.e., a child of average ability who increases invocabulary at an expected rate relative to his or her agepeers will retain a PPVT standard score of 100 overtime); therefore, raw scores may be used as an alterna-tive. However, raw scores from different test forms can-not be meaningfully compared if the number of itemsdiffers across test forms. Consider an example study inwhich the PPVT–Rm (with 175 items) is used at the firstoccasion, but the PPVT–3a (with 204 items) is used atthe second occasion. Even if both forms measure thesame ability, direct comparisons of their raw scores toassess growth will be compromised by their incompat-ible ranges of possible scores. Comparison of raw scoreseven across test forms with the same number of itemscould still be problematic, in that differences across formsin the difficulty of the individual items or item sets couldlead to artifactual differences in raw scores across forms.Although we focus on the PPVTspecifically in this study,it is important to recognize the relevance of these prob-lems of comparability to any instrument in which growthis assessed using different forms over time.
Fortunately, these comparability problems can beresolved through item response theory (IRT), a family ofpsychometric models that describe how observed itemresponses are predicted by the continuous latent abilitythey measure (i.e., vocabulary ability measured by thePPVT items). The use of IRT models to create compa-rable measures of ability across test forms has a long-standing tradition in educational testing (e.g., Kim &Cohen, 1998), as well as in psychology (e.g., Curranet al., 2008). IRT models use statistical techniques thatrely on overlapping items in multiple test forms toanchor the ability scores produced by the analysis.
Accordingly, the purpose of the current longitudinalstudy is to use an IRT model to create comparable mea-sures of vocabulary ability over time as obtained fromthree different PPVT forms: PPVT–Rm, PPVT–3a, andPPVT–3b. In addition to using the common items fromthese forms to anchor the analyses, we also used personlinking data in which multiple test forms were admin-istered to the same person at the same occasion, creat-ing what is called common items (e.g., Hanson&Béguin,2002) and a common persons linking design (e.g.Masters,1985). Through IRT modeling all persons and items areplaced onto the same latent metric, providing a commonmeasurement scale with which to make valid compar-isons between persons or over time, even if their data
Hoffman et al.: PPVT Linking 755
Complimentary Author PDF: Not for Broad Dissemination
were obtained from different test forms. In contrast tothe aforementioned research, the current IRT calibra-tion sample was much larger and featured much morevariability in age and ability, which are important con-siderations in ensuring sufficient information for all testitems. Consequently, the results provided by the presentIRT modeling are likely to be more stable, robust, andreplicable than any comparisons of more restricted sam-ples. More importantly, though, the present IRTmodel-ing also provides a means through which the resultsof these form comparisons can be used directly by otherinvestigators. To that end, we have provided a freelyavailable SAS program that creates IRT scores of vocab-ulary ability for use instead of raw scores given responsesto one or more of these three PPVT forms. Through thisresource other researchers and practitioners will also beable to translate their existing PPVT data from differentforms onto a common latent metric for making validcomparisons between persons or over time.
MethodParticipants
PPVT data for this study were collected over15 years within a series of ongoing longitudinal studies(see Rice et al., 2009, 2010, for details). The sample waspart of a study of children with SLI, their parents andsiblings, and control children and families. A total of2,625 cases from 697 unique persons were analyzed,of which 51% were male. In this sample, 22.6% werechildren ascertained as having SLI, 47.8% were otherchildren, and 29.6% were adults. The race–ethnicity per-centages wereWhite, 85.8%;multiracial, 6.5%; AmericanIndian, 3.3%; Black, 1%; Asian, <1%; and not reported,3.4%. Hispanic ethnicity was reported by 5.3% of thesample. The number of occasions of measurement perperson ranged from 1 to 16 (M = 3.8, SD = 3.9). Re-spondent ages in years ranged from 2.5 to 59.6 (M =11.7, SD = 8.6). PPVT–3a data were obtained from1,992 cases from 595 persons, PPVT–Rm data were ob-tained from 2,073 cases from 537 persons, and PPVT–3bdata were obtained from 377 cases from 377 persons.The mean standard score for the full sample was 96.9(SD = 14.4).
Test Forms and Linking DataLinking data (needed for a concurrent analysis of
three test forms) were available across both persons anditems. With regard to linking across forms by commonpersons, the PPVT–3a andPPVT–Rm formswere linkedusing 1,440 cases from 432 persons who completed bothforms at approximately the same occasion (i.e., an agedifference between occasions of 0 to 0.34 years,M = 0.02,
SD = 0.04). The PPVT–Rm and PPVT–3b forms werelinked using 377 cases from 377 persons who completedboth forms at approximately the same occasion (i.e., anage difference between occasions of 0 to 0.17 years,M = 0.01,SD = 0.02).With regard to linking across formsby common items, the PPVT–3a and PPVT–3b formseach contain 204 items, none of which are shared. ThePPVT–Rm form contains 175 items, 3 of which areshared with the PPVT–3a form and 121 of which aresharedwith thePPVT–3b form.Because only thePPVT–Rm had items in common with the other forms, its itemresponses were used for any shared items. Thus, a total of459 unique items were analyzed, including 201 PPVT–3aitems, 175 PPVT–Rm items, and 83 PPVT–3b items. Thenumber of item responses from each case (i.e., for oneperson at one occasion) ranged from 11 to 218 (M = 97.0,SD = 37.1). The number of unique responses for eachitem (i.e., across cases) ranged from22 to 1,165 (M=554.8,SD = 357.8).
Test ProcedureThe PPVT–3a and PPVT–3b tests were adminis-
tered as instructed in their test manual (Dunn & Dunn,1997). The 204 items in each test are ordered in dif-ficulty and grouped into sets, such that each respond-ent only completes the items likely to be most relevantto him or her (e.g., items that would be too easy or toodifficult are not administered). The test begins with theset of 12 recommended items based on the respondent’sage. If the respondent makes one or fewer errors on thatinitial 12-item set, that item set becomes the basalitem set. Alternatively, if two or more items are missedin the initial item set, the preceding (easier) 12-itemset is administered, continuing until the criterion ofone or fewer errors is created. Once this basal itemset has been established, additional 12-item sets inascending difficulty are administered until eight ormore errors are made in an item set, which becomesthe ceiling item set, the last item of which is the ceilingitem. The PPVT–3a or PPVT–3b raw score is then cal-culated by subtracting the total number of errors madebetween the basal and ceiling item sets from the ceil-ing item.
The 175 items in the PPVT–Rm (Dunn & Dunn,1981) are also ordered in difficulty, but they are notgrouped into 12-item sets. Instead, a starting item isrecommended based on the respondent’s age, and ad-ministration continues until eight consecutive correctresponses are given. The eighth item answered correctlyis the basal item. From there, administration continueswith sequential items in ascending difficulty until sixerrors are made in eight consecutive responses. The lastitem administered is the ceiling item. The PPVT–Rmraw score is then calculated by subtracting from the
756 Journal of Speech, Language, and Hearing Research • Vol. 55 • 754–763 • June 2012
Complimentary Author PDF: Not for Broad Dissemination

ceiling item the total number of errors made betweenthe basal item and the ceiling item. The procedures forexceptions due to inconsistent responses are detailed inthe test manuals. The scoring processes assume that allitems (administered or not) below the basal item wouldhave been correct and that all items above the ceilingitem would have been incorrect.
ResultsPsychometric Model
The 459 unique PPVT items were analyzed usingIRT models, a family of psychometric models that pre-dict individual item responses from the characteristicsof each item and the latent ability of each respondent(see Embretson & Reise, 2000). IRT models are closelyrelated to confirmatory factor analysis (CFA) models, inthat a continuous latent trait (here, vocabulary ability)is thought to cause the observed item responses, suchthat the relation between item responses is due only tothe ability of the person responding (or multiple abil-ities in multidimensional models). The primary differ-ence between CFA and IRT models is that CFA modelscontinuous item responses directly, whereas IRTmodelsthe probability of categorical (i.e., binary or ordinal) itemresponses through link functions (i.e., transformationsof probability).
The basic form of the IRT model to be used for thePPVT items is shown in Equation 1:
probabilityðyip ¼ 1jAbilitypÞ
¼ exp 1:7aiðAbilityp � biÞ� �
1þ exp 1:7aiðAbilityp � biÞ� � ; ð1Þ
in which the probability of a correct response to item ifor person p (yip = 1) depends on three model param-eters: the person vocabulary ability (Abilityp), the itemdifficulty (bi), and the item discrimination (ai). Theconstant 1.7 is used to maintain comparability acrossother IRT models (e.g., normal ogive). The IRT modelin Equation 1 is known as the two-parameter logisticmodel because it has two estimated parameters peritem (ai and bi) and because it can be specified to pre-dict the log-odds (logit) of the response instead. OtherIRT models for binary responses (such as incorrect orcorrect response here) include the one-parameter logistic(or Rasch) model, in which the item discriminationparameter (a) is held constant across items, or the three-parameter logistic model, which includes an additionalparameter for each item (ci) of a lower asymptote for theprobability of a correct response (i.e., due to guessing).
The key concept in an IRT model is that there is acommon latent metric on which all persons (based on
their ability) and all items (based on their difficulty) canbe located. Because this common metric is unobserved,we must set its scale by fixing the mean and the var-iance of the latent ability variable to known values (orby fixing the ai and bi parameters for one item, similarto model identification in CFA models). For convenience,we can give the latent ability metric an M = 0 andvariance (VAR) = 1, such that the ability estimates canbe interpreted like z-scores. These ability estimates areinterpreted using the items on their common latent con-tinuum, such that a person’s ability is the item difficultylevel (bi) at which the probability of a correct responseis 50%. Likewise, item difficulty (bi) is the amount ofability needed for a probability of a correct item re-sponse of 50%. To illustrate, we substitute hypotheticalvalues for person ability, item difficulty, and item discrim-ination into Equation 1, as shown in Equation 2:
Item1 : probabilityðy1p¼1jAbilitypÞ ¼exp 1:7ð1Þð0� 1Þ½ �
1þexp 1:7ð1Þð0� 1Þ½ � ¼ :85
Item2 : probabilityðy2p¼1jAbilitypÞ ¼exp 1:7ð1Þð0� 1Þ½ �
1þexp 1:7ð1Þð0� 1Þ½ � ¼ :15;
ð2Þin which we specify the predicted probability of a correctitem response, assuming average ability (Abilityp = 0)and an item discrimination of ai = 1 (as is explainednext). In Equation 2, if ability exceeds item difficulty (asin Item 1, b1 = –1), the probability of a correct responsewill be >.50. If item difficulty exceeds ability instead (asin Item 2, b2 = 1), the probability will be <.50.
To differentiate item difficulty (bi) from item dis-crimination (ai), we can examine Figure 1, in which itemcharacteristic curves are shown for the probability of acorrect response across person ability (scaled withM = 0
Figure 1. Item characteristic curves for three Peabody PictureVocabulary Test (PPVT) items.
Hoffman et al.: PPVT Linking 757
Complimentary Author PDF: Not for Broad Dissemination
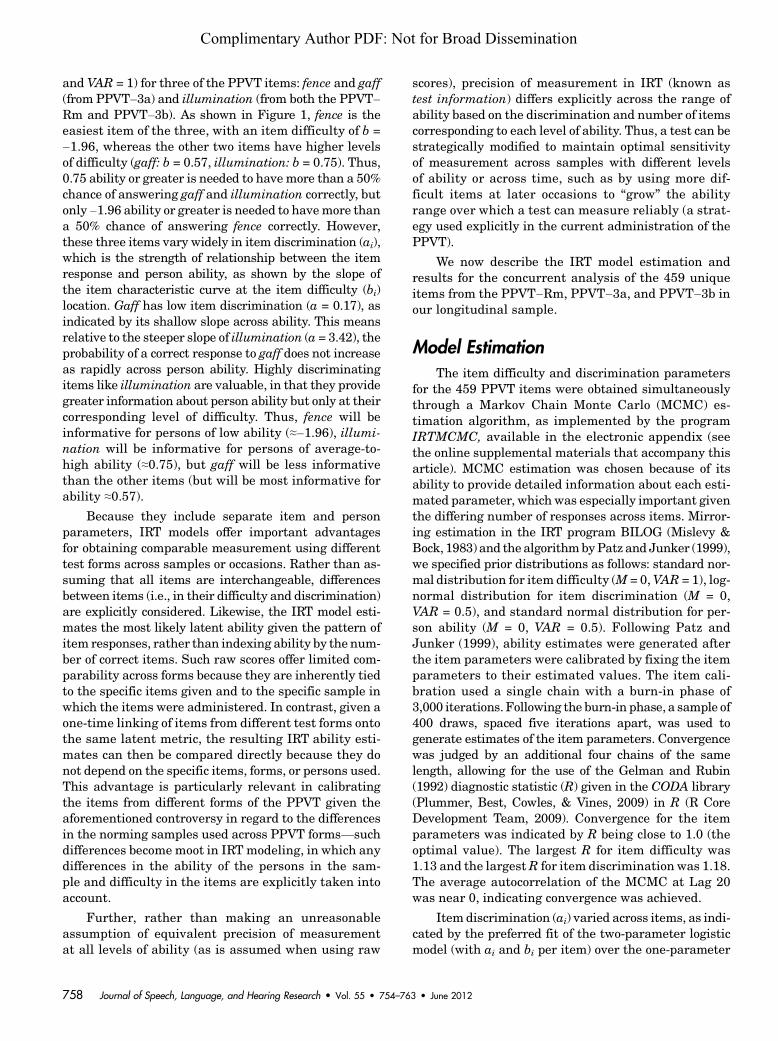
and VAR = 1) for three of the PPVT items: fence and gaff(from PPVT–3a) and illumination (from both the PPVT–Rm and PPVT–3b). As shown in Figure 1, fence is theeasiest item of the three, with an item difficulty of b =–1.96, whereas the other two items have higher levelsof difficulty (gaff: b = 0.57, illumination: b = 0.75). Thus,0.75 ability or greater is needed to havemore than a 50%chance of answering gaff and illumination correctly, butonly –1.96 ability or greater is needed to havemore thana 50% chance of answering fence correctly. However,these three items vary widely in item discrimination (ai),which is the strength of relationship between the itemresponse and person ability, as shown by the slope ofthe item characteristic curve at the item difficulty (bi)location. Gaff has low item discrimination (a = 0.17), asindicated by its shallow slope across ability. This meansrelative to the steeper slope of illumination (a = 3.42), theprobability of a correct response to gaff does not increaseas rapidly across person ability. Highly discriminatingitems like illumination are valuable, in that they providegreater information about person ability but only at theircorresponding level of difficulty. Thus, fence will beinformative for persons of low ability (,–1.96), illumi-nation will be informative for persons of average-to-high ability (,0.75), but gaff will be less informativethan the other items (but will be most informative forability ,0.57).
Because they include separate item and personparameters, IRT models offer important advantagesfor obtaining comparable measurement using differenttest forms across samples or occasions. Rather than as-suming that all items are interchangeable, differencesbetween items (i.e., in their difficulty and discrimination)are explicitly considered. Likewise, the IRT model esti-mates the most likely latent ability given the pattern ofitem responses, rather than indexing ability by the num-ber of correct items. Such raw scores offer limited com-parability across forms because they are inherently tiedto the specific items given and to the specific sample inwhich the items were administered. In contrast, given aone-time linking of items from different test forms ontothe same latent metric, the resulting IRT ability esti-mates can then be compared directly because they donot depend on the specific items, forms, or persons used.This advantage is particularly relevant in calibratingthe items from different forms of the PPVT given theaforementioned controversy in regard to the differencesin the norming samples used across PPVT forms—suchdifferences become moot in IRTmodeling, in which anydifferences in the ability of the persons in the sam-ple and difficulty in the items are explicitly taken intoaccount.
Further, rather than making an unreasonableassumption of equivalent precision of measurementat all levels of ability (as is assumed when using raw
scores), precision of measurement in IRT (known astest information) differs explicitly across the range ofability based on the discrimination and number of itemscorresponding to each level of ability. Thus, a test can bestrategically modified to maintain optimal sensitivityof measurement across samples with different levelsof ability or across time, such as by using more dif-ficult items at later occasions to “grow” the abilityrange over which a test can measure reliably (a strat-egy used explicitly in the current administration of thePPVT).
We now describe the IRT model estimation andresults for the concurrent analysis of the 459 uniqueitems from the PPVT–Rm, PPVT–3a, and PPVT–3b inour longitudinal sample.
Model EstimationThe item difficulty and discrimination parameters
for the 459 PPVT items were obtained simultaneouslythrough a Markov Chain Monte Carlo (MCMC) es-timation algorithm, as implemented by the programIRTMCMC, available in the electronic appendix (seethe online supplemental materials that accompany thisarticle). MCMC estimation was chosen because of itsability to provide detailed information about each esti-mated parameter, which was especially important giventhe differing number of responses across items. Mirror-ing estimation in the IRT program BILOG (Mislevy &Bock, 1983) and the algorithmbyPatz and Junker (1999),we specified prior distributions as follows: standard nor-mal distribution for item difficulty (M = 0,VAR = 1), log-normal distribution for item discrimination (M = 0,VAR = 0.5), and standard normal distribution for per-son ability (M = 0, VAR = 0.5). Following Patz andJunker (1999), ability estimates were generated afterthe item parameters were calibrated by fixing the itemparameters to their estimated values. The item cali-bration used a single chain with a burn-in phase of3,000 iterations. Following the burn-in phase, a sample of400 draws, spaced five iterations apart, was used togenerate estimates of the item parameters. Convergencewas judged by an additional four chains of the samelength, allowing for the use of the Gelman and Rubin(1992) diagnostic statistic (R) given in the CODA library(Plummer, Best, Cowles, & Vines, 2009) in R (R CoreDevelopment Team, 2009). Convergence for the itemparameters was indicated by R being close to 1.0 (theoptimal value). The largest R for item difficulty was1.13 and the largestR for item discrimination was 1.18.The average autocorrelation of the MCMC at Lag 20was near 0, indicating convergence was achieved.
Item discrimination (ai) varied across items, as indi-cated by the preferred fit of the two-parameter logisticmodel (with ai and bi per item) over the one-parameter
758 Journal of Speech, Language, and Hearing Research • Vol. 55 • 754–763 • June 2012
Complimentary Author PDF: Not for Broad Dissemination
(or Rasch) logistic model (with bi per item but a commona across items). Given our use of MCMC to estimatethe IRT model parameters, the comparison of the two-parameter model to the one-parameter model was con-ducted using the deviance information criterion (DIC;Spiegelhalter, Best, Carlin, & Van der Linde, 2002;DDIC =3,635,427.4), a standard index used for com-paring Bayesian models in which smaller values indi-cate a better model. Estimation of a three-parameterlogistic model (with ai, bi, and ci per item) resulted insevere convergence problems for the ci lower asymptoteparameters (that reflect the lowest possible probabilityof a correct response). This is most likely because of theadministration procedure of the PPVT. That is, becauseof the influence of person ability on which items getadministered, most items will generally not be admin-istered to persons of lower ability. Thus, for many itemsthere was little-to-no information at the lower end of theability spectrum that would be needed to determine itslower asymptote. Accordingly, the two-parameter logis-tic model was used as the final model.
Finally, although the data were longitudinal, theIRTmodel treated cases as independent. Although prob-lematic in other contexts, the dependency from sam-pling multiple occasions from the same person is notproblematic here given that dependency generally af-fects the standard errors of model estimates but not themodel estimates themselves. Thus, the longitudinal de-pendency will not impact the item parameter esti-mates needed to generate person ability estimates (cf.Mislevy & Chang, 2000). When using person abilityestimates in subsequent analyses, however, any depen-dency in estimates from the same person should bemodeled (e.g., as can be done through mixed-effectsgrowth models).
Item Parameter Estimates andTest Information
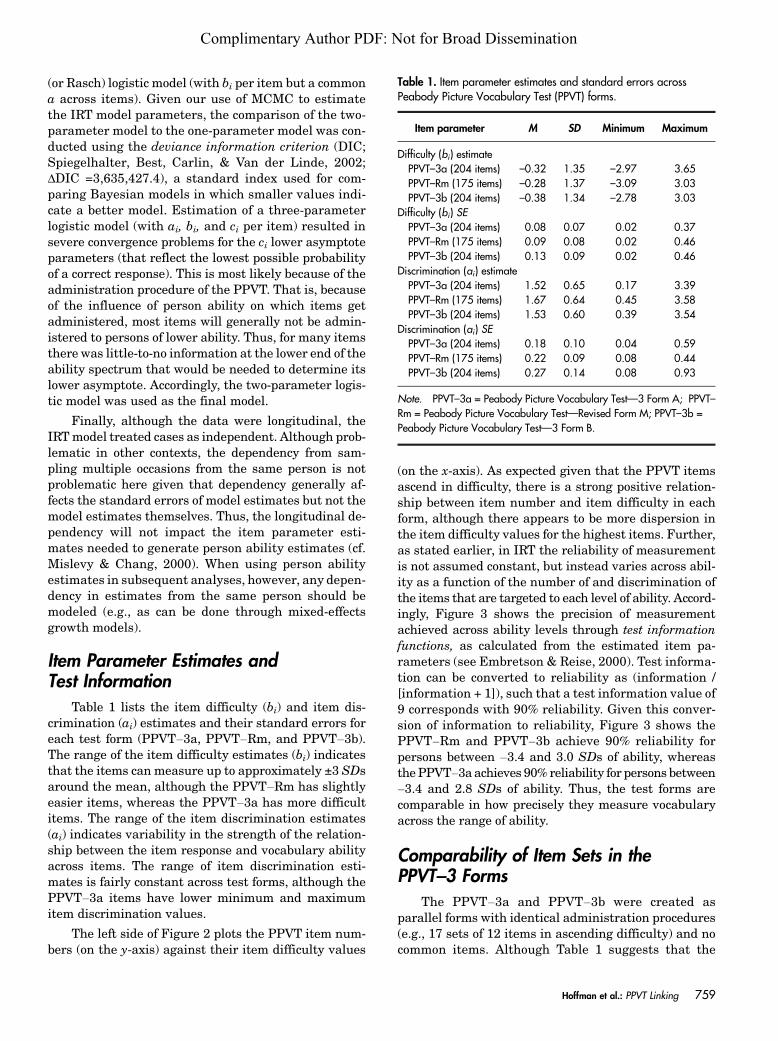
Table 1 lists the item difficulty (bi) and item dis-crimination (ai) estimates and their standard errors foreach test form (PPVT–3a, PPVT–Rm, and PPVT–3b).The range of the item difficulty estimates (bi) indicatesthat the items can measure up to approximately ±3 SDsaround the mean, although the PPVT–Rm has slightlyeasier items, whereas the PPVT–3a has more difficultitems. The range of the item discrimination estimates(ai) indicates variability in the strength of the relation-ship between the item response and vocabulary abilityacross items. The range of item discrimination esti-mates is fairly constant across test forms, although thePPVT–3a items have lower minimum and maximumitem discrimination values.
The left side of Figure 2 plots the PPVT item num-bers (on the y-axis) against their item difficulty values
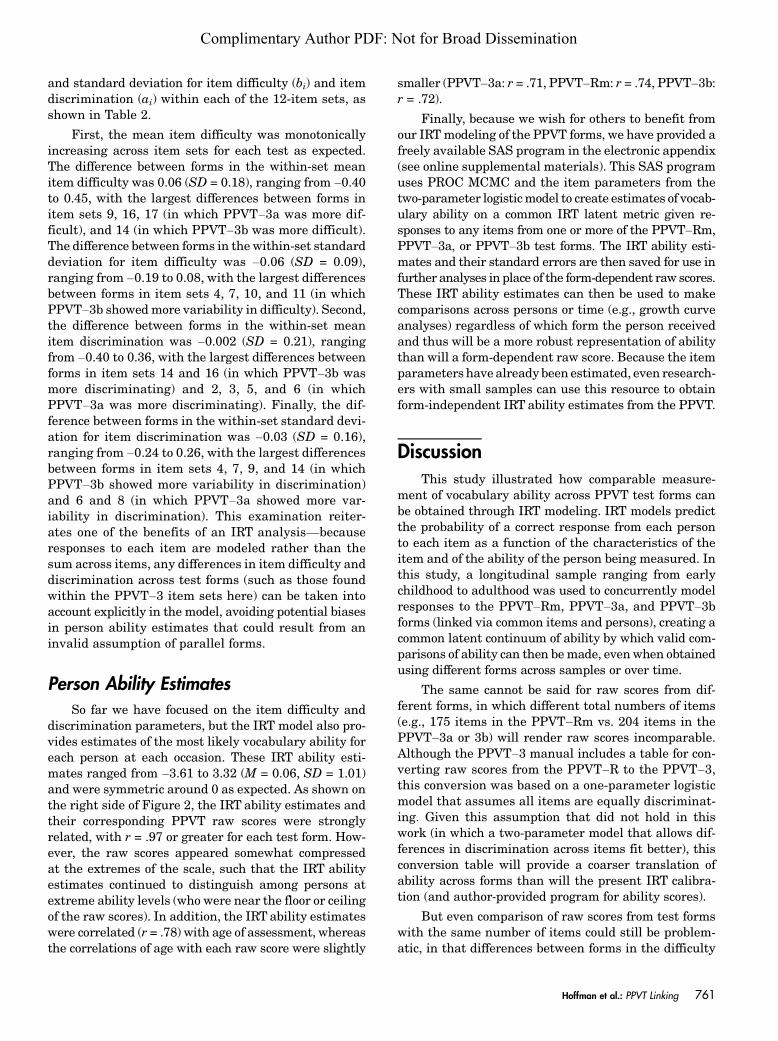
(on the x-axis). As expected given that the PPVT itemsascend in difficulty, there is a strong positive relation-ship between item number and item difficulty in eachform, although there appears to be more dispersion inthe item difficulty values for the highest items. Further,as stated earlier, in IRT the reliability of measurementis not assumed constant, but instead varies across abil-ity as a function of the number of and discrimination ofthe items that are targeted to each level of ability. Accord-ingly, Figure 3 shows the precision of measurementachieved across ability levels through test informationfunctions, as calculated from the estimated item pa-rameters (see Embretson & Reise, 2000). Test informa-tion can be converted to reliability as (information /[information + 1]), such that a test information value of9 corresponds with 90% reliability. Given this conver-sion of information to reliability, Figure 3 shows thePPVT–Rm and PPVT–3b achieve 90% reliability forpersons between –3.4 and 3.0 SDs of ability, whereasthePPVT–3a achieves 90% reliability for persons between–3.4 and 2.8 SDs of ability. Thus, the test forms arecomparable in how precisely they measure vocabularyacross the range of ability.
Comparability of Item Sets in thePPVT–3 Forms
The PPVT–3a and PPVT–3b were created asparallel forms with identical administration procedures(e.g., 17 sets of 12 items in ascending difficulty) and nocommon items. Although Table 1 suggests that the
Table 1. Item parameter estimates and standard errors acrossPeabody Picture Vocabulary Test (PPVT) forms.
Item parameter M SD Minimum Maximum
Difficulty (bi) estimatePPVT–3a (204 items) –0.32 1.35 –2.97 3.65PPVT–Rm (175 items) –0.28 1.37 –3.09 3.03PPVT–3b (204 items) –0.38 1.34 –2.78 3.03
Difficulty (bi) SEPPVT–3a (204 items) 0.08 0.07 0.02 0.37PPVT–Rm (175 items) 0.09 0.08 0.02 0.46PPVT–3b (204 items) 0.13 0.09 0.02 0.46
Discrimination (ai) estimatePPVT–3a (204 items) 1.52 0.65 0.17 3.39PPVT–Rm (175 items) 1.67 0.64 0.45 3.58PPVT–3b (204 items) 1.53 0.60 0.39 3.54
Discrimination (ai) SEPPVT–3a (204 items) 0.18 0.10 0.04 0.59PPVT–Rm (175 items) 0.22 0.09 0.08 0.44PPVT–3b (204 items) 0.27 0.14 0.08 0.93
Note. PPVT–3a = Peabody Picture Vocabulary Test—3 Form A; PPVT–Rm = Peabody Picture Vocabulary Test—Revised Form M; PPVT–3b =Peabody Picture Vocabulary Test—3 Form B.
Hoffman et al.: PPVT Linking 759
Complimentary Author PDF: Not for Broad Dissemination

forms are largely comparable in difficulty and discrim-ination overall, given that the items are administeredin 17 fixed-item sets, we also evaluated their compara-bility across these item sets by calculating the mean
Figure 2. PPVT form item numbers by item difficulty (left) and PPVT raw scores by latent ability estimates (right).
Figure 3. Test information functions across PPVT forms (in whichinformation > 9 indicates reliability > .90).
Table 2. PPVT item difficulty and discrimination by item set forPPVT–3a and PPVT–3b.
Item set
Difficulty (bi) Discrimination (ai)
M SD M SD
3a 3b 3a 3b 3a 3b 3a 3b
1 –2.35 –2.44 0.28 0.20 1.63 1.48 0.36 0.332 –1.94 –1.96 0.23 0.18 1.80 1.57 0.37 0.213 –1.75 –1.71 0.23 0.25 1.98 1.73 0.38 0.474 –1.57 –1.67 0.16 0.34 1.92 1.77 0.53 0.745 –1.25 –1.39 0.16 0.29 2.20 1.84 0.64 0.476 –1.04 –1.10 0.21 0.21 2.08 1.80 0.79 0.537 –0.88 –0.97 0.12 0.32 1.91 1.93 0.66 0.848 –0.69 –0.75 0.37 0.37 1.46 1.62 0.54 0.319 –0.34 –0.63 0.10 0.23 1.70 1.73 0.49 0.7010 –0.25 –0.37 0.22 0.39 1.58 1.70 0.52 0.6611 –0.03 –0.03 0.25 0.40 1.53 1.57 0.47 0.5912 0.21 0.21 0.31 0.38 1.33 1.37 0.41 0.4013 0.46 0.60 0.22 0.26 1.38 1.55 0.41 0.4714 0.52 0.92 0.57 0.50 0.98 1.38 0.46 0.7015 1.07 1.12 0.35 0.42 1.12 1.13 0.42 0.5616 1.67 1.45 0.48 0.60 0.68 1.00 0.31 0.3517 2.76 2.31 0.53 0.52 0.60 0.78 0.25 0.21
760 Journal of Speech, Language, and Hearing Research • Vol. 55 • 754–763 • June 2012
Complimentary Author PDF: Not for Broad Dissemination
and standard deviation for item difficulty (bi) and itemdiscrimination (ai) within each of the 12-item sets, asshown in Table 2.
First, the mean item difficulty was monotonicallyincreasing across item sets for each test as expected.The difference between forms in the within-set meanitem difficulty was 0.06 (SD = 0.18), ranging from –0.40to 0.45, with the largest differences between forms initem sets 9, 16, 17 (in which PPVT–3a was more dif-ficult), and 14 (in which PPVT–3b was more difficult).The difference between forms in the within-set standarddeviation for item difficulty was –0.06 (SD = 0.09),ranging from –0.19 to 0.08, with the largest differencesbetween forms in item sets 4, 7, 10, and 11 (in whichPPVT–3b showedmore variability in difficulty). Second,the difference between forms in the within-set meanitem discrimination was –0.002 (SD = 0.21), rangingfrom –0.40 to 0.36, with the largest differences betweenforms in item sets 14 and 16 (in which PPVT–3b wasmore discriminating) and 2, 3, 5, and 6 (in whichPPVT–3a was more discriminating). Finally, the dif-ference between forms in the within-set standard devi-ation for item discrimination was –0.03 (SD = 0.16),ranging from –0.24 to 0.26, with the largest differencesbetween forms in item sets 4, 7, 9, and 14 (in whichPPVT–3b showed more variability in discrimination)and 6 and 8 (in which PPVT–3a showed more var-iability in discrimination). This examination reiter-ates one of the benefits of an IRT analysis—becauseresponses to each item are modeled rather than thesum across items, any differences in item difficulty anddiscrimination across test forms (such as those foundwithin the PPVT–3 item sets here) can be taken intoaccount explicitly in the model, avoiding potential biasesin person ability estimates that could result from aninvalid assumption of parallel forms.
Person Ability EstimatesSo far we have focused on the item difficulty and
discrimination parameters, but the IRT model also pro-vides estimates of the most likely vocabulary ability foreach person at each occasion. These IRT ability esti-mates ranged from –3.61 to 3.32 (M = 0.06, SD = 1.01)and were symmetric around 0 as expected. As shown onthe right side of Figure 2, the IRT ability estimates andtheir corresponding PPVT raw scores were stronglyrelated, with r = .97 or greater for each test form. How-ever, the raw scores appeared somewhat compressedat the extremes of the scale, such that the IRT abilityestimates continued to distinguish among persons atextreme ability levels (who were near the floor or ceilingof the raw scores). In addition, the IRT ability estimateswere correlated (r = .78) with age of assessment, whereasthe correlations of age with each raw score were slightly
smaller (PPVT–3a: r = .71, PPVT–Rm: r = .74, PPVT–3b:r = .72).
Finally, because we wish for others to benefit fromour IRTmodeling of the PPVT forms, we have provided afreely available SAS program in the electronic appendix(see online supplemental materials). This SAS programuses PROC MCMC and the item parameters from thetwo-parameter logisticmodel to create estimates of vocab-ulary ability on a common IRT latent metric given re-sponses to any items from one or more of the PPVT–Rm,PPVT–3a, or PPVT–3b test forms. The IRT ability esti-mates and their standard errors are then saved for use infurther analyses in place of the form-dependent raw scores.These IRT ability estimates can then be used to makecomparisons across persons or time (e.g., growth curveanalyses) regardless of which form the person receivedand thus will be a more robust representation of abilitythan will a form-dependent raw score. Because the itemparameters have already been estimated, even research-ers with small samples can use this resource to obtainform-independent IRT ability estimates from the PPVT.
DiscussionThis study illustrated how comparable measure-
ment of vocabulary ability across PPVT test forms canbe obtained through IRT modeling. IRT models predictthe probability of a correct response from each personto each item as a function of the characteristics of theitem and of the ability of the person being measured. Inthis study, a longitudinal sample ranging from earlychildhood to adulthood was used to concurrently modelresponses to the PPVT–Rm, PPVT–3a, and PPVT–3bforms (linked via common items and persons), creating acommon latent continuum of ability by which valid com-parisons of ability can then bemade, evenwhen obtainedusing different forms across samples or over time.
The same cannot be said for raw scores from dif-ferent forms, in which different total numbers of items(e.g., 175 items in the PPVT–Rm vs. 204 items in thePPVT–3a or 3b) will render raw scores incomparable.Although the PPVT–3 manual includes a table for con-verting raw scores from the PPVT–R to the PPVT–3,this conversion was based on a one-parameter logisticmodel that assumes all items are equally discriminat-ing. Given this assumption that did not hold in thiswork (in which a two-parameter model that allows dif-ferences in discrimination across items fit better), thisconversion table will provide a coarser translation ofability across forms than will the present IRT calibra-tion (and author-provided program for ability scores).
But even comparison of raw scores from test formswith the same number of items could still be problem-atic, in that differences between forms in the difficulty
Hoffman et al.: PPVT Linking 761
Complimentary Author PDF: Not for Broad Dissemination

of the individual items or item sets could lead to arti-ficial differences in the raw scores between forms. Forinstance, in this study (as reported in Table 2), for twopersons of equal ability, a person who receives item set 9from the PPVT–3b (rather than the PPVT–3a) is likelyto have more correct answers (and thus a higher rawscore) because item set 9 is systematically easier (withgreater variability in easiness) in the PPVT–3b thanin the PPVT–3a. Even if comparable item difficulty isobtained overall (e.g., as shown in Table 1), differencesin difficulty at the item level or item set level are in-evitable. Such nonparallel items are problematic whenability is indexed using raw scores but not when abilityscores are obtained from psychometric models (e.g., IRTor CFA models) that explicitly account for such differ-ences between items. This is especially relevant giventhe systematic differences between the norming sam-ples for the PPVT–3 and the PPVT–R—by modeling theitem response as the unit of analysis rather than rawor standard summary scores, such norming differencesbecome moot.
An IRTability scoring approach also encourages thestrategic use of alternate forms. That is, because therespondents may remember the words administered,using the same items over time may bias ability esti-mates. Using alternate forms of comparable difficultycan be very useful in reducing such retest effects—butan IRT scoring approach allows an individual to main-tain such benefits while avoiding the detriments asso-ciated with not exactly parallel forms. Further, givenprior knowledge of the difficulty and discrimination ofeach possible item, efficiency and precision of measure-ment can be optimized by administering targeted itemswhose difficulty is most appropriate for the ability to bemeasured. This idea is already implemented in thePPVT, inwhich different starting items are recommendedbased on age. However, the calculation of PPVT rawscores assumes that all items below the starting itemwould be correct (and that all items above the ceilingitem would be incorrect), whereas these untested as-sumptions are unnecessary for obtaining ability esti-mates through IRT modeling, yet another benefit ofthis approach.
Although IRT modeling is a flexible and powerfulmeans by which valid comparisons of vocabulary abilityobtained from different PPVT test forms can be made, itis important to recognize our assumptions in doing so.First, we have assumed that a single ability underliesthe responses to all PPVT items. Although a multi-dimensional IRTmodel could have been used if multipleabilities were postulated instead, we had no reason topursue this in the present study, given considerableexisting research with the PPVT as a measure of asingle vocabulary ability. Second, although differencesin vocabulary ability are part of the IRT model, the
item characteristics (e.g., difficulty and discrimination)that relate each item response to vocabulary ability areassumed to be invariant across all persons and ages.Unfortunately, this assumption of equivalent item func-tioning is not testable given the administration of thePPVT, in which only items appropriate for a respon-dent’s age or level of ability are given (resulting in littleoverlap of item responses for persons of different ages orability). However, it is important to acknowledge thatthis assumption of invariant measurement is alwaysinvoked in any research study using PPVT raw or stan-dard scores and, thus, is not unique to our IRT modeling.
Finally, given the existence of two new PPVT–4forms, an important next step will be to pursue con-current IRT modeling of the items from the PPVT–R,PPVT–3, and PPVT–4 forms simultaneously using ad-ditional linking data from the PPVT–4. Given thatonly 25% of the 228 items on each of the two PPVT–4forms are unique (with the remaining 75% already inthe PPVT–3 forms) the items in common could be usedto link responses to the PPVT–4 to those from the otherforms. Additional linking could be achieved by admin-istering the PPVT–3 and PPVT–4 to persons at thesame occasion (i.e., as we had done with the PPVT–Rmand PPVT–3 forms in this study). In either case, though,a wide range of ages (i.e., a sample of young childrenthrough adults, as in this study) would be needed toobtain sufficient responses to all items, given that PPVTitems are administered selectively to persons based onage and ability.
In conclusion, the use of multiple test forms cancreate problems in comparing the resulting indices ofability across different samples or over time. Many ofthese problems can be resolved through the use of psy-chometric models (such as IRT) that provide a commonlatent metric by which such comparisons can be made.We hope this application of IRT modeling of existingPPVT data (and the IRT scoring program we have pro-vided) will not only be useful to others who wish toexamine differences in vocabulary ability between per-sons or over time but also that it illustrates the poten-tial of these methods for other tests with multipleforms as well.
AcknowledgmentsThis research was funded by National Institutes of
Health Grants P30DC005803, R01DC001803, and R01DC005226(awarded to Mabel L. Rice) and by University of KansasIntellectual and Developmental Disabilities Research CenterGrant P30HD002528. We thank Denise Perpich for datamanagement as well as the research assistants and studentsin Mabel L. Rice’s Language Acquisition Studies Lab at theUniversity of Kansas for data collection and data processing.Finally, we appreciate the time and effort of the children andtheir families who participated.
762 Journal of Speech, Language, and Hearing Research • Vol. 55 • 754–763 • June 2012
Complimentary Author PDF: Not for Broad Dissemination
ReferencesCurran, P. J., Hussong, A.M., Cai, L., Huang,W., Chassin,L., Sher, K. J., & Zucker, R. A. (2008). Pooling data frommultiple longitudinal studies: The role of item responsetheory in integrative data analysis. Developmental Psy-chology, 44, 365–380.
Dunn, M., & Dunn, L. M. (1959). Peabody Picture VocabularyTest. Circle Pines, MN: AGS.
Dunn, M., & Dunn, L. M. (1981). Peabody Picture VocabularyTest—Revised. Circle Pines, MN: AGS.
Dunn, M., & Dunn, L. M. (1997). Peabody Picture VocabularyTest—3. Circle Pines, MN: AGS.
Dunn, M., & Dunn, L. M. (2007). Peabody Picture VocabularyTest—4. Circle Pines, MN: AGS.
Eickhoff, J., Betz, S., & Ristow, J. (2010, June). Clinicalprocedures used by speech-language pathologists to diag-nose SLI. Poster session presented at the symposium onResearch in Child Language Disorders, Madison, WI.
Embretson, S. E., & Reise, S. P. (2000). Item response theoryfor psychologists. Mahwah, NJ: Erlbaum.
Gelman, A., & Rubin, D. B. (1992). Inference from iterativesimulation using multiple sequences. Statistical Science, 7,457–511.
Gray, S., Plante, E., Vance, R., & Henrichsen, M. (1999).The diagnostic accuracy of four vocabulary tests adminis-tered to preschool-age children. Language, Speech, andHearing Services in Schools, 30, 196–206.
Hanson, B. A., & Béguin, A. A. (2002). Obtaining a commonscale for item response theory item parameters usingseparate versus concurrent estimation in the common-itemequating design. Applied Psychological Measurement, 26,3–24.
Kim, S.-H., & Cohen, A. S. (1998). A comparison of linkingand concurrent calibration under item response theory.Applied Psychological Measurement, 22, 131–143.
Masters, G. N. (1985). Common-person equating with theRasch model. Applied Psychological Measurement, 9, 73–82.
Mislevy, R. J., & Bock, R. D. (1983). BILOG: Item analysisand test scoring with binary logistic models [Computerprogram]. Mooresville, IN: Scientific Software.
Mislevy, R. J., & Chang, H. (2000). Does adaptive testingviolate local independence? Psychometrika, 65, 149–156.
Pankratz, M., Morrison, A., & Plante, E. (2004). Differencein standard scores of adults on the Peabody Picture Vocab-ulary Test (Revised and Third Edition). Journal of Speech,Language, and Hearing Research, 47, 714–718.
Patz, R. J., & Junker, B. W. (1999). A straightforwardapproach to Markov Chain Monte Carlo methods for itemresponse models. Journal of Educational and BehavioralStatistics, 24, 146–178.
Peña, E. D., Spaulding, T. J., & Plante, E. (2006). Thecomposition of normative groups and diagnostic decisionmaking: Shooting ourselves in the foot. American Journalof Speech-Language Pathology, 15, 247–254.
Plummer, M., Best, N., Cowles, K., & Vines, K. (2009).CODA: Convergence diagnosis and output analysis forMCMC.R News, 6, 7–11.
Rice, M. L. (2009). Language acquisition lessons fromchildren with specific language impairment: Revisiting thediscovery of latent structures. In V. C. M. Gathercole (Ed.),Routes to language: Studies in honor of Melissa Bowerman(pp. 287–313). New York, NY: Taylor & Francis.
Rice,M. L., &Hadley, P. A. (1995). Language outcomes of thelanguage-focused curriculum. In M. L. Rice & K. A. Wilcox(Eds.), Building a language-focused curriculum for thepreschool classroom: Vol. I. A foundation for lifelongcommunication (pp. 155–169). Baltimore, MD: Brookes.
Rice, M. L., Redmond, S. M., & Hoffman, L. (2006). MLUin children with SLI and young control children showsconcurrent validity, stable and parallel growth trajectories.Journal of Speech, Language, and Hearing Research, 49,793–808.
Rice, M. L., Smith, S. D., & Gayán, J. (2009). Convergentgenetic linkage and associations to language, speech andreading measures in families of probands with specificlanguage impairment. Journal of NeurodevelopmentalDisorders, 1, 264–282.
Rice, M. L., Smolik, F., Perpich, D., Thompson, T.,Rytting, N., & Blossom, M. (2010). Mean length ofutterance levels in 6-month intervals for children 3 to9 years with and without language impairments. Journalof Speech, Language, and Hearing Research, 53, 1–17.
Rice,M. L., &Watkins, R. V. (1996). “ShowMe X”: New viewsof an old assessment technique. In K. N. Cole, P. S. Dale,& D. J. Thal (Eds.), Assessment of communication andlanguage (pp. 183–206). Baltimore, MD: Brookes.
R Core Development Team. (2009). R: A languageand environment for statistical computing [Computersoftware]. Vienna, Austria: R Foundation for StatisticalComputing.
Snow, K., Thalji, L., Derecho, A., Wheeless, S., Lennon,J., Kinsey, S., & Park, J. (2007). Early ChildhoodLongitudinal Study, Birth Cohort (ECLS–B), Preschool YearData File User’s Manual (2005–2006) (NCES 2008-024).Washington, DC: National Center for Education Statistics.
Spiegelhalter, D. J., Best, N. G., Carlin, B. P., & Van derLinde, A. (2002). Bayesian measures of model complexityand fit. Journal of the Royal Statistical Society, Series B, 64,583–616.
Ukrainetz, T. A., & Duncan, D. S. (2000). From old to new:Examining score increases on the Peabody Picture Vocabu-lary Test—III. Language, Speech, and Hearing Servicesin Schools, 31, 336–339.
Washington, J. A., & Craig, H. K. (1992). Performances oflow-income, African American preschool and kindergartenchildren on the Peabody Picture Vocabulary Test—Revised.Language, Speech, and Hearing Services in Schools, 23,329–333.
Washington, J. A., & Craig, H. K. (1999). Performances ofat-risk, African American preschoolers on the PeabodyPicture Vocabulary Test—III. Language, Speech, andHearing Services in Schools, 30, 75–82.
Hoffman et al.: PPVT Linking 763
Complimentary Author PDF: Not for Broad Dissemination