Research Methods Knowledge Base Facilitation July 10 th, 2013 By Federica Vegas.
101
Research Methods Knowledge Base Facilitation July 10 th , 2013 By Federica Vegas
-
Upload
thomasine-stanley -
Category
Documents
-
view
215 -
download
1
Transcript of Research Methods Knowledge Base Facilitation July 10 th, 2013 By Federica Vegas.

Research Methods Knowledge Base
Facilitation July 10th, 2013By Federica Vegas

The Research Methods Knowledge Base
Is a comprehensive web-based textbook that addresses all of the topics in a typical introductory course in social research methods.
About the Author: William M.K. Trochim is a Professor in the Department
of Policy Analysis and Management at Cornell University.
Has taught courses in applied social research methods since joining the faculty at Cornell in 1980.
Received his Ph.D. in 1980 from the program in Methodology and Evaluation Research of the Department of Psychology at Northwestern University.

Navigating though the RMKB
Yin Yan Map

Navigating though the RMKB
The Road Map
Foundations: Language of Research
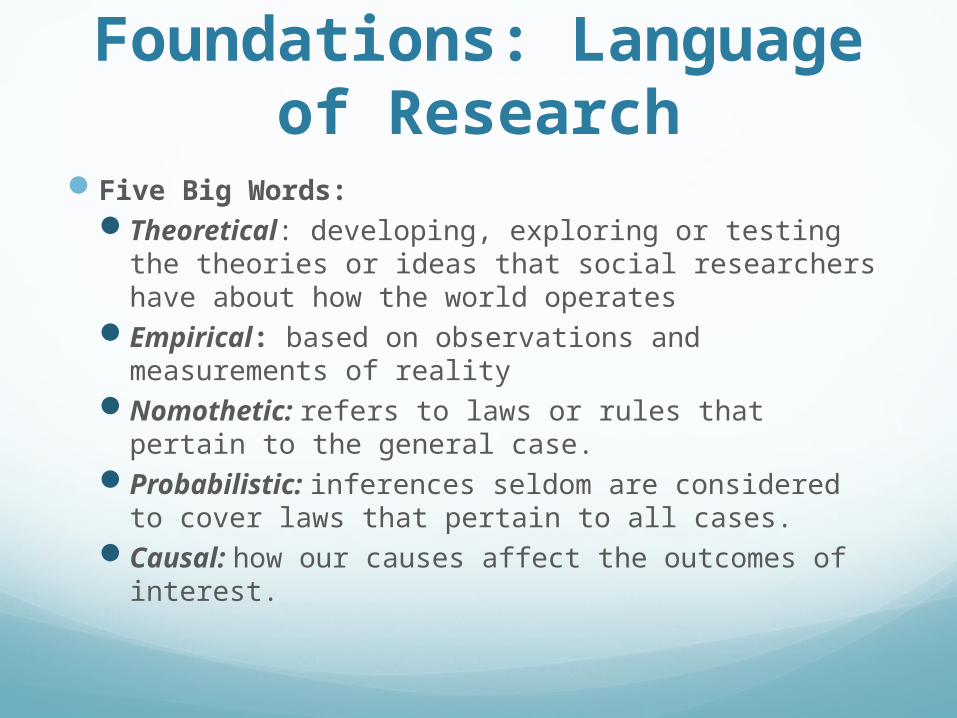
Five Big Words: Theoretical: developing, exploring or testing the
theories or ideas that social researchers have about how the world operates
Empirical: based on observations and measurements of reality
Nomothetic: refers to laws or rules that pertain to the general case.
Probabilistic: inferences seldom are considered to cover laws that pertain to all cases.
Causal: how our causes affect the outcomes of interest.
Foundations: Language of Research
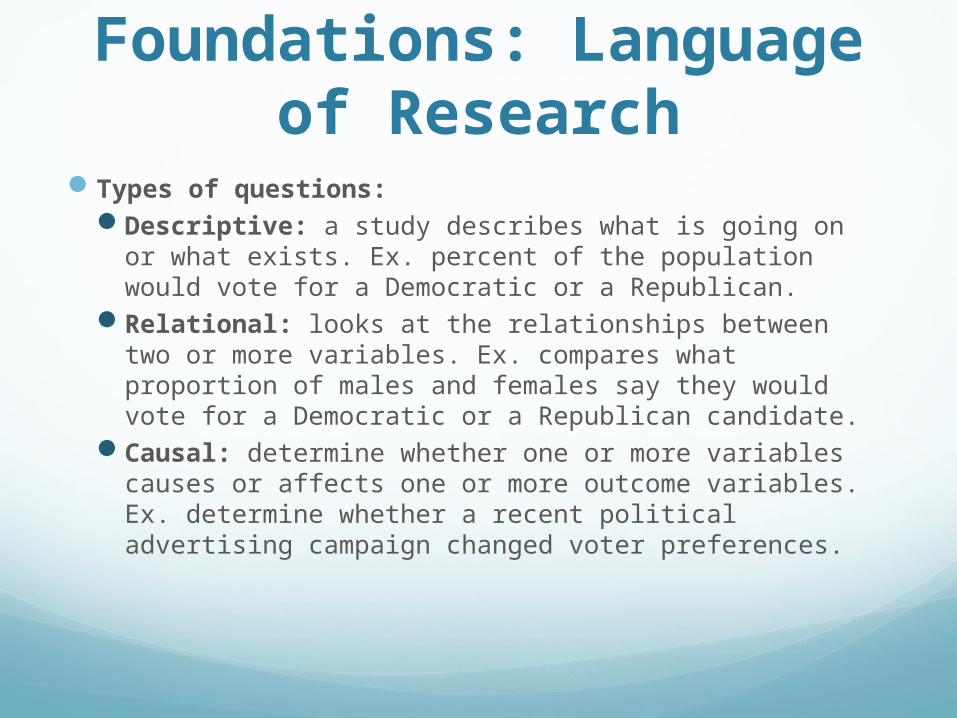
Types of questions:Descriptive: a study describes what is going on
or what exists. Ex. percent of the population would vote for a Democratic or a Republican.
Relational: looks at the relationships between two or more variables. Ex. compares what proportion of males and females say they would vote for a Democratic or a Republican candidate.
Causal: determine whether one or more variables causes or affects one or more outcome variables. Ex. determine whether a recent political advertising campaign changed voter preferences.
Foundations: Language of Research
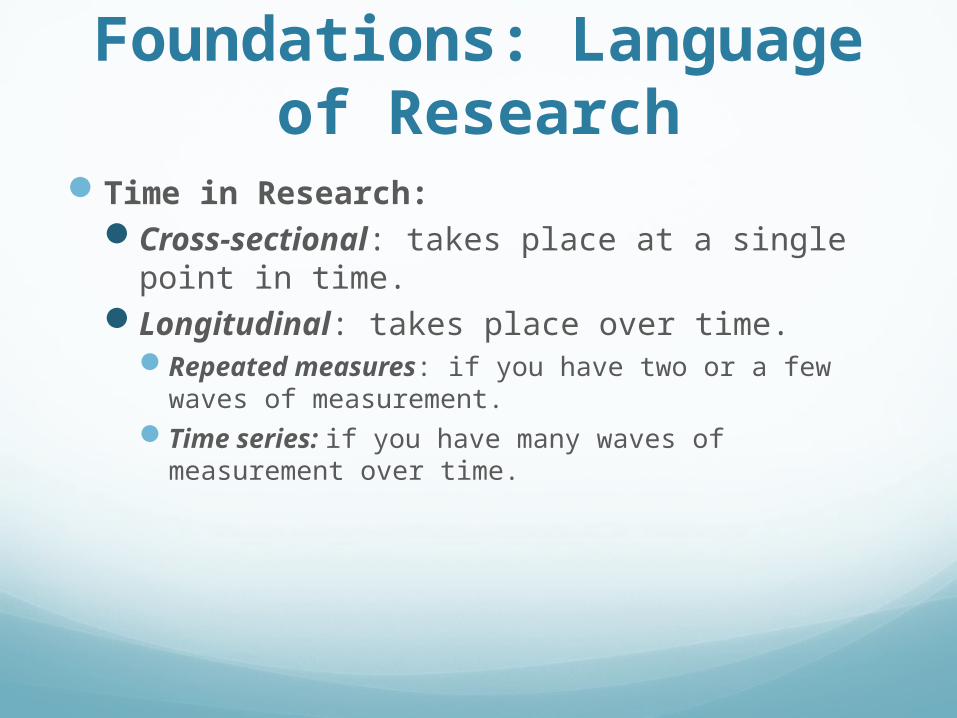
Time in Research:Cross-sectional: takes place at a single point
in time. Longitudinal: takes place over time.
Repeated measures: if you have two or a few waves of measurement.
Time series: if you have many waves of measurement over time.
Foundations: Language of Research
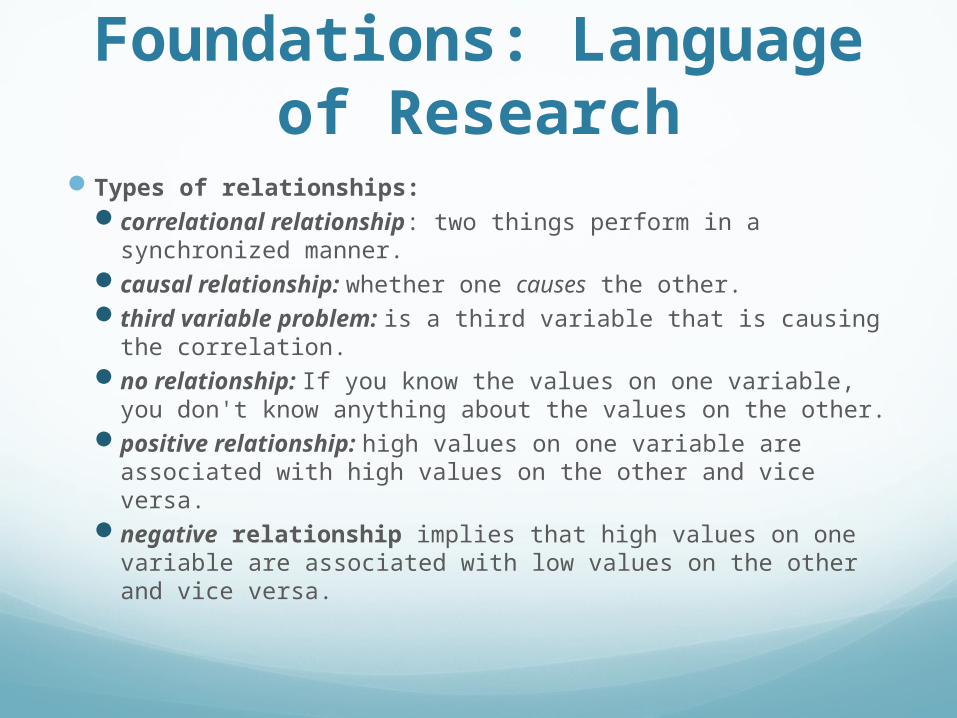
Types of relationships: correlational relationship: two things perform in a
synchronized manner. causal relationship: whether one causes the other. third variable problem: is a third variable that is
causing the correlation. no relationship: If you know the values on one variable,
you don't know anything about the values on the other. positive relationship: high values on one variable are
associated with high values on the other and vice versa. negative relationship implies that high values on one
variable are associated with low values on the other and vice versa.
Foundations: Language of Research
Variables:A variable is any entity that can take on different values.
Ex. genderAn attribute is a specific value on a variable. Ex. Male or
femaleThe independent variable is what you manipulate.The dependent variable is what is affected by the
independent variable.Each variable should be exhaustive, it should include all
possible answerable responses.The attributes of a variable should be mutually
exclusive, no respondent should be able to have two attributes simultaneously.
Foundations: Language of Research
Hypothesis:specific statement of prediction. It describes in
concrete terms what you expect will happen in your study.
we call the hypothesis that you support (your prediction) the alternative hypothesis,
we call the hypothesis that describes the remaining possible outcomes the null hypothesis.

Foundations: Language of Research
Types of data:qualitative data: not numerical. quantitative data: is in numerical form.All quantitative data is based upon
qualitative judgments; and all qualitative data can be described and manipulated numerically.
Unit of Analysis: is the major entity that you are analyzing in your study.

Foundations: Language of Research
Research fallacies: ecological fallacy occurs when you make
conclusions about individuals based only on analyses of group data.
exception fallacy occurs when you reach a group conclusion on the basis of exceptional cases.

Foundations: Philosophy of ResearchStructure of research:

Components of a study: The Research Problem: general problem or question The Research Question: when you narrow the problem
down to a more specific research question that we can hope to address.
An even more specific statement, called an hypothesis that describes in operational terms exactly what we think will happen in the study.
The Program (Cause) The Units: are directly related to the question of sampling. The Outcomes (Effect) The Design: determining how people wind up in or are
placed in various programs or treatments that we are comparing.
Foundations: Philosophy of Research

Deduction and Induction:Deductive reasoning: works from the more general
to the more specific. Inductive reasoning: moving from specific
observations to broader generalizations and theories.
Foundations: Philosophy of Research
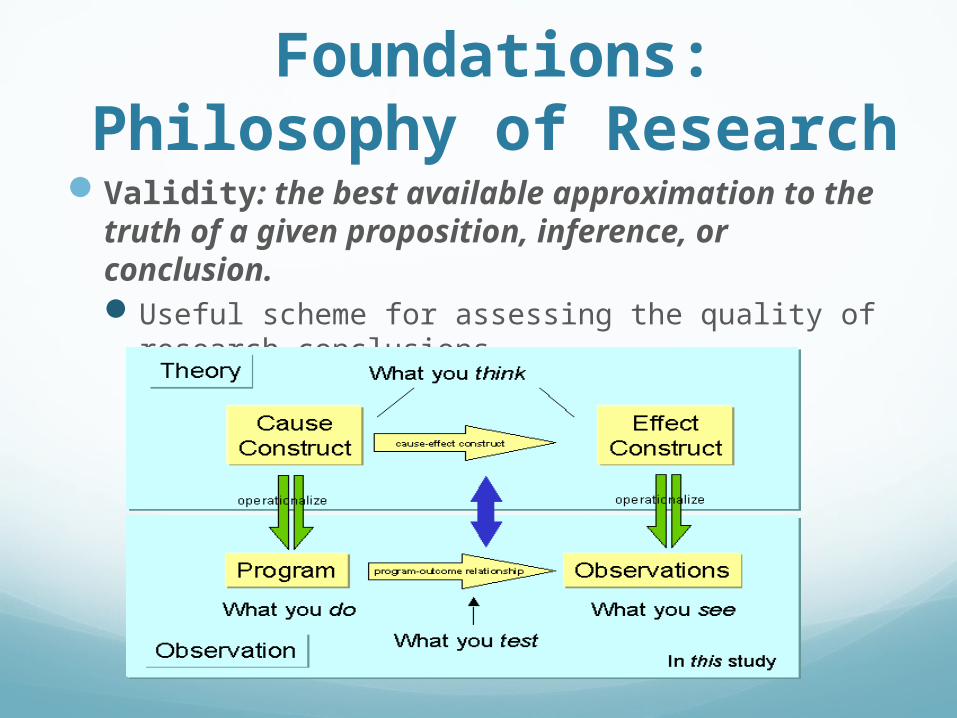
Validity: the best available approximation to the truth of a given proposition, inference, or conclusion. Useful scheme for assessing the quality of
research conclusions.
Foundations: Philosophy of Research
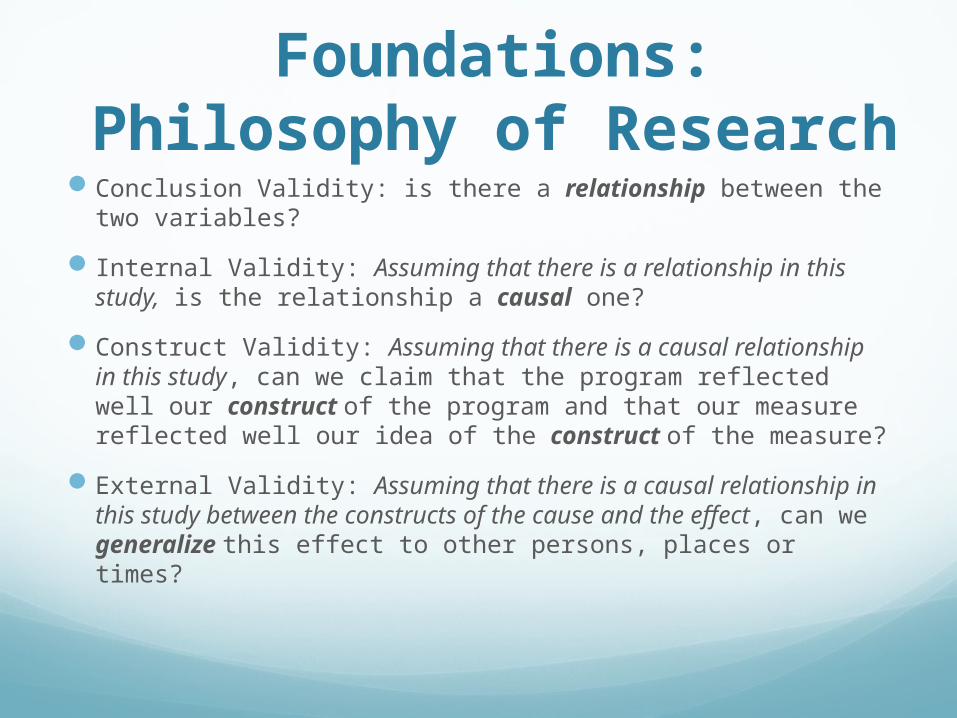
Conclusion Validity: is there a relationship between the two variables?
Internal Validity: Assuming that there is a relationship in this study, is the relationship a causal one?
Construct Validity: Assuming that there is a causal relationship in this study, can we claim that the program reflected well our construct of the program and that our measure reflected well our idea of the construct of the measure?
External Validity: Assuming that there is a causal relationship in this study between the constructs of the cause and the effect, can we generalize this effect to other persons, places or times?
Foundations: Philosophy of Research

Foundations: Philosophy of Research

Threats to validity -- reasons the conclusion or inference might be wrong:
insufficient statistical power to detect a relationship even if it exists.
sample size is too small or the measure of amount of training is unreliable.
random irrelevancies in the study setting or random heterogeneity in the respondents that increased the variability in the data and made it harder to see the relationship of interest.
Foundations: Philosophy of Research

Foundations: Ethics in Research
Voluntary participation requires that people not be coerced into participating in research.
Informed consent. prospective research participants must be fully informed about the procedures and risks involved in research and must give their consent to participate.
Ethical standards also require that researchers not put participants in a situation where they might be at risk of harm as a result of their participation.
Guarantees the participants confidentiality -- they are assured that identifying information will not be made available to anyone who is not directly involved in the study.
The stricter standard is the principle of anonymity which essentially means that the participant will remain anonymous throughout the study -- even to the researchers themselves.
Institutional Review Board (IRB), a panel of persons who reviews grant proposals with respect to ethical implications and decides whether additional actions need to be taken to assure the safety and rights of participants.

Foundations: Conceptualizing
Develop the idea for the research project in the first place.
Problem Formulation: Many researchers are directly engaged in program implementation
and come up with their ideas based on what they see happening around them.
Literature in your specific field. A source of good research ideas is the Requests For Proposals (RFPs) that are published by government agencies and some companies.
Researchers simply think up their research topic on their own. Tradeoffs between rigor and practicality. Feasibility of a research project: time, ethical constraints, needed
cooperation, costs of conducting the research. The Literature Review: identify related research, to set the current
research project within a conceptual and theoretical context.

Concept Mapping: is a structured process, focused on a topic or construct of interest, involving input from one or more participants, that produces an interpretable pictorial view (concept map) of their ideas and concepts and how these are interrelated.
Foundations: Conceptualizing

Foundations: Evaluation Research
The major goal of evaluation should be to influence decision-making or policy formulation through the provision of empirically-driven feedback.
Types: Formative evaluations strengthen or improve the object being
evaluated. Examine the delivery of the program or technology, the quality of its implementation, and the assessment of the organizational context, personnel, procedures, inputs, and so on.
Summative evaluations, in contrast, examine the effects or outcomes of some object. Describe what happens subsequent to delivery of the program or technology; assessing whether the object can be said to have caused the outcome; determining the overall impact of the causal factor beyond only the immediate target outcomes; and, estimating the relative costs associated with the object.

Foundations: Evaluation Research
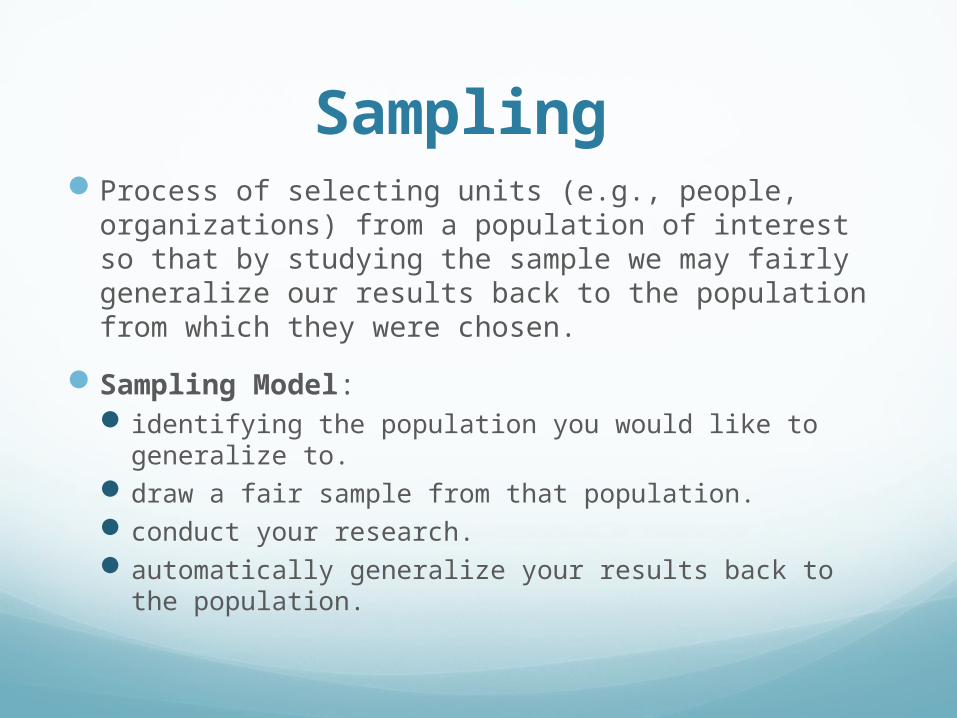
Sampling Process of selecting units (e.g., people,
organizations) from a population of interest so that by studying the sample we may fairly generalize our results back to the population from which they were chosen.
Sampling Model: identifying the population you would like to generalize
to. draw a fair sample from that population. conduct your research. automatically generalize your results back to the
population.

Sampling: External validity
Degree to which the conclusions in your study would hold for other persons in other places and at other times.

Sampling: External validity
Proximal Similarity Model: Begin by thinking about different generalizability contexts and
developing a theory about which contexts are more like our study and which are less so.
We place different contexts in terms of their relative similarities, we can call this implicit theoretical a gradient of similarity.
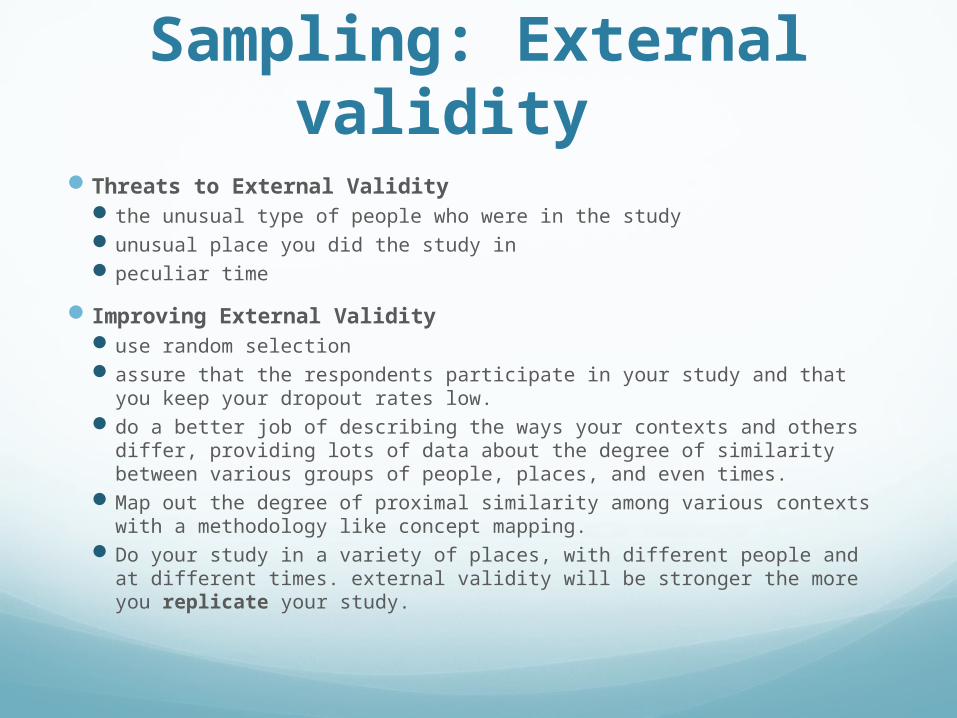
Threats to External Validity the unusual type of people who were in the study unusual place you did the study in peculiar time
Improving External Validity use random selection assure that the respondents participate in your study and that you keep
your dropout rates low. do a better job of describing the ways your contexts and others differ,
providing lots of data about the degree of similarity between various groups of people, places, and even times.
Map out the degree of proximal similarity among various contexts with a methodology like concept mapping.
Do your study in a variety of places, with different people and at different times. external validity will be stronger the more you replicate your study.
Sampling: External validity

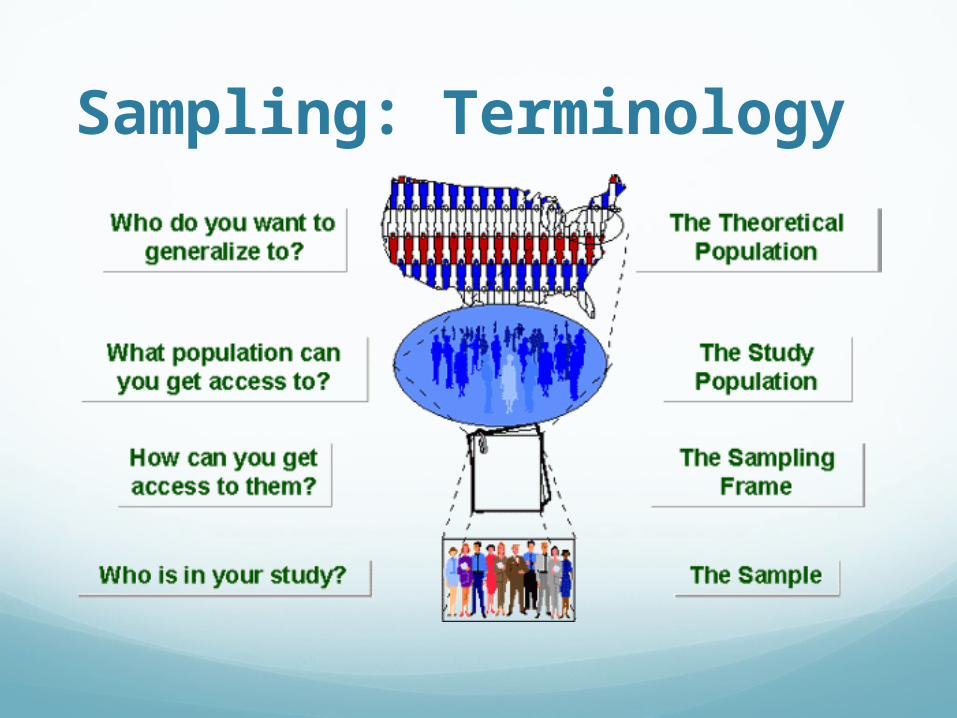
Sampling: Terminology The group you wish to generalize to is often called the population
in your study. This is the group you would like to sample from because this is the group you are interested in generalizing to.
The population you would like to generalize to is the theoretical population
The population that will be accessible to you is the accessible population.
The listing of the accessible population from which you'll draw your sample is called the sampling frame.
The sample is the group of people who you select to be in your study.
There is the possibility of introducing systematic error or bias.
Sampling: Terminology
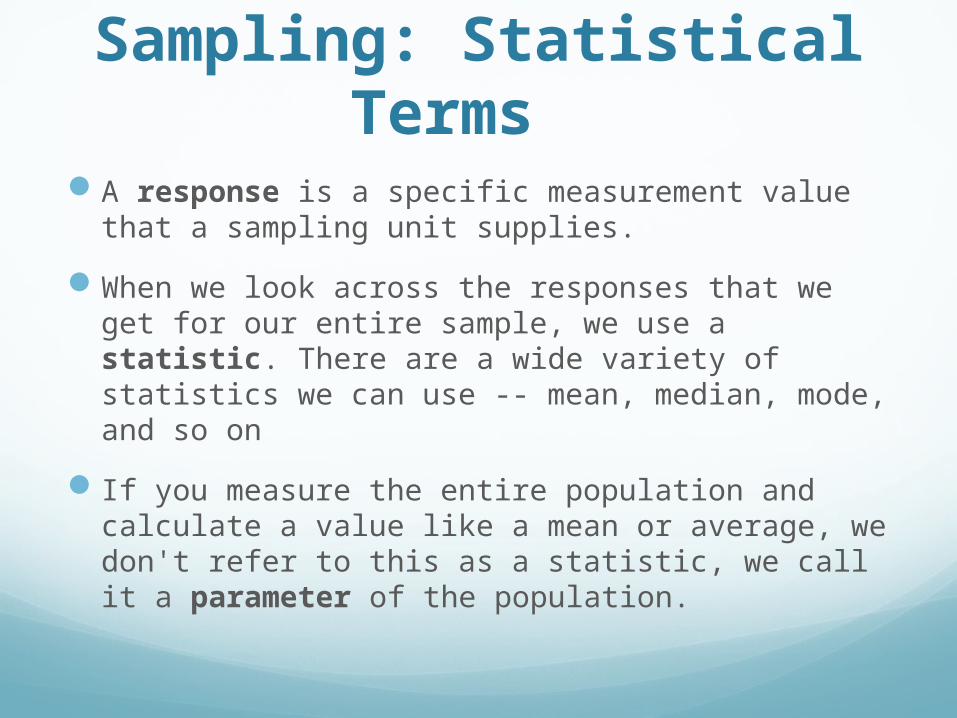
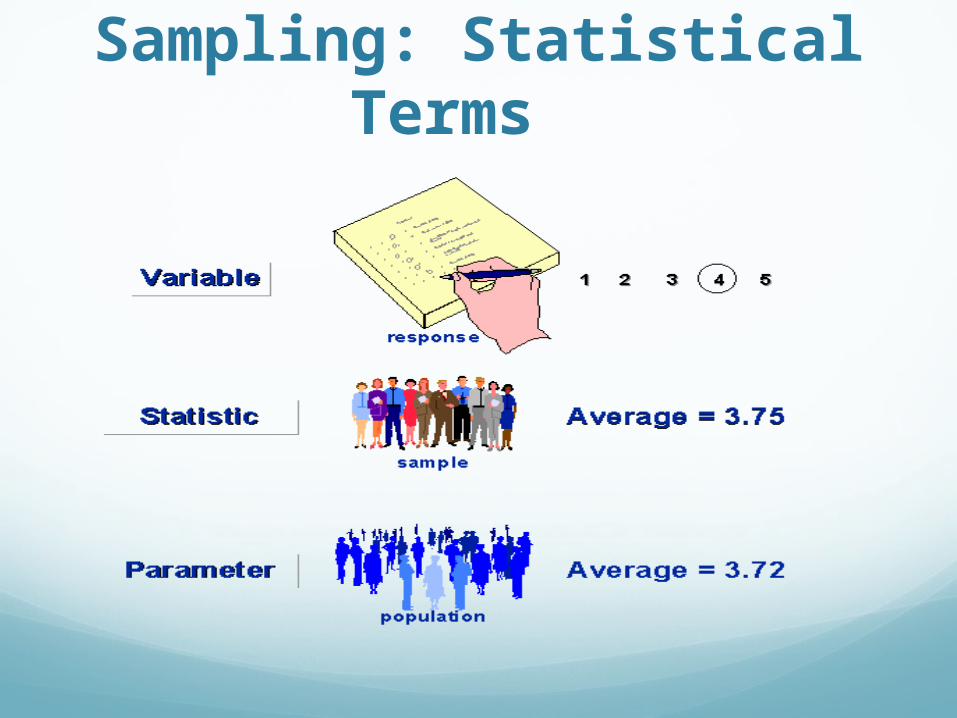
A response is a specific measurement value that a sampling unit supplies.
When we look across the responses that we get for our entire sample, we use a statistic. There are a wide variety of statistics we can use -- mean, median, mode, and so on
If you measure the entire population and calculate a value like a mean or average, we don't refer to this as a statistic, we call it a parameter of the population.
Sampling: Statistical Terms
Sampling: Statistical Terms

How do we get from our sample statistic to an estimate of the population parameter?
Sampling distribution: the distribution of an infinite number of samples of the same size as the sample in your study. We need to realize that our sample is just one of a potentially infinite number of samples that we could have taken.
Sampling: Statistical Terms

The standard deviation of the sampling distribution tells us something about how different samples would be distributed. In statistics it is referred to as the standard error
A standard deviation is the spread of the scores around the average in a single sample. The standard error is the spread of the averages around the average of averages in a sampling distribution.
In sampling contexts, the standard error is called sampling error. Sampling error gives us some idea of the precision of our statistical estimate. A low sampling error means that we had relatively less variability or range in the sampling distribution.
We base our calculation on the standard deviation of our sample. The greater the sample standard deviation, the greater the standard error (and the sampling error). The standard error is also related to the sample size. The greater your sample size, the smaller the standard error.
Sampling: Statistical Terms

Sampling: Probability Sampling
Any method of sampling that utilizes some form of random selection. Must set up some process or procedure that assures that the different units in your population have equal probabilities of being chosen.
Simple Random SamplingObjective: To select n units out of N such that
each NCn has an equal chance of being selected.
Procedure: Use a table of random numbers, a computer random number generator, or a mechanical device to select the sample.
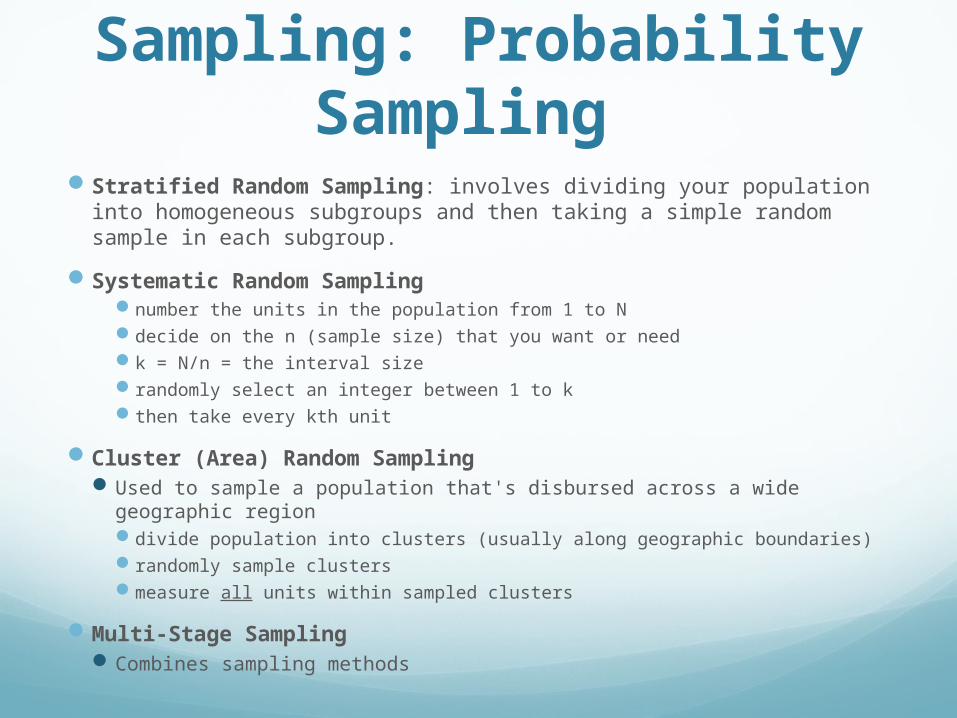
Stratified Random Sampling: involves dividing your population into homogeneous subgroups and then taking a simple random sample in each subgroup.
Systematic Random Sampling number the units in the population from 1 to N decide on the n (sample size) that you want or need k = N/n = the interval size randomly select an integer between 1 to k then take every kth unit
Cluster (Area) Random Sampling Used to sample a population that's disbursed across a wide geographic
region divide population into clusters (usually along geographic boundaries) randomly sample clusters measure all units within sampled clusters
Multi-Stage Sampling Combines sampling methods
Sampling: Probability Sampling
Sampling: Non-Probability Sampling
Does not involve random selection.
Accidental, Haphazard or Convenience Samplingtraditional "man on the street”
Purposive Sampling In purposive sampling, we sample with a purpose in
mind. We usually would have one or more specific predefined groups we are seeking.
Purposive sampling can be very useful for situations where you need to reach a targeted sample quickly and where sampling for proportionality is not the primary concern.
MeasurementMeasurement is the process observing and
recording the observations that are collected as part of a research effort.

Measurement: Construct Validity
If your operationalization accurately reflects its construct.
An assessment of how well you translated your ideas or theories into actual programs or measures.

Measurement Validity Types translation validity: degree to which you accurately translated your
construct into the operationalization, the criteria are the construct definition itself -- it is a direct comparison.
criteria-related validity, you check the performance of your operationalization against some criterion.
Setting up for a good construct validity: set the construct you want to operationalize within a semantic
net, tell us what your construct is more or less similar to in meaning.
provide direct evidence that you control the operationalization of the construct -- that your operationalizations look like what they should theoretically look like.
provide evidence that your data support your theoretical view of the relations among constructs.
Measurement: Construct Validity
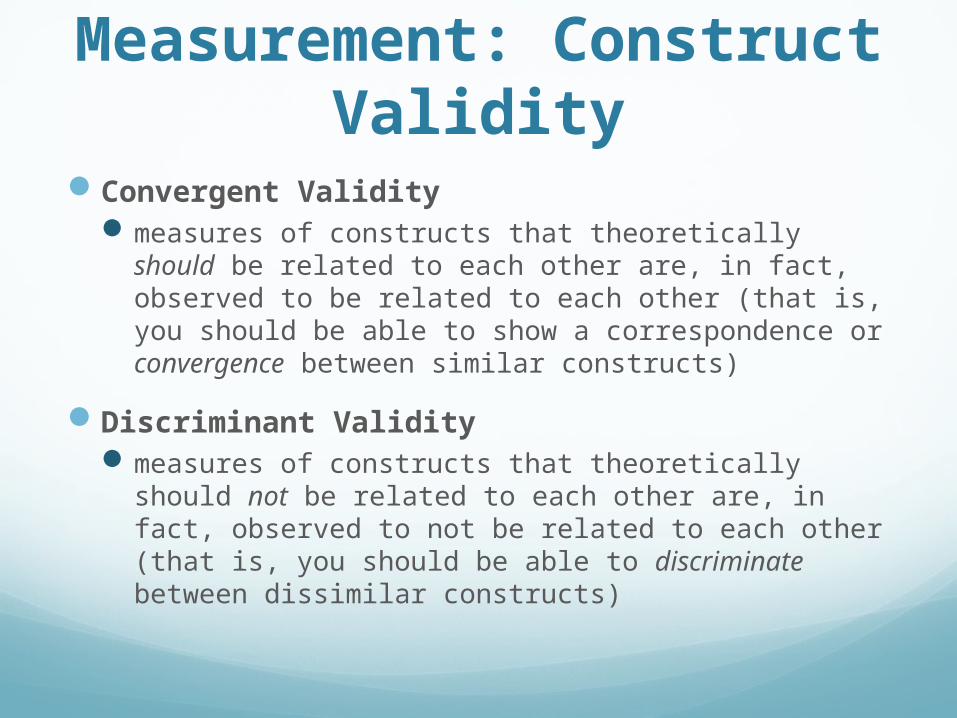
Convergent Validitymeasures of constructs that theoretically should be
related to each other are, in fact, observed to be related to each other (that is, you should be able to show a correspondence or convergence between similar constructs)
Discriminant Validitymeasures of constructs that theoretically should not
be related to each other are, in fact, observed to not be related to each other (that is, you should be able to discriminate between dissimilar constructs)
Measurement: Construct Validity

Threats to Construct Validity:
Inadequate Preoperational Explication of Constructs. Some possible solutions:
think through your concepts better use methods (e.g., concept mapping) to articulate your concepts get experts to critique your operationalizations
Mono-Operation Bias: if you only use a single version of a program in a single place at a single point in time.
Mono-Method Bias: if you provide only a single version of a measure, you can't provide much evidence that you're really measuring it. Solution: try to implement multiple measures of key constructs and
try to demonstrate that the measures you use behave as you theoretically expect them to.
Measurement: Construct Validity

Threats to Construct Validity:
Interaction of Different Treatments: the targeted at-risk treatment group in your study is also likely to be involved simultaneously in several other programs
Interaction of Testing and Treatment: testing or measurement itself make the groups more sensitive or receptive to the treatment
Restricted Generalizability Across Constructs: Treatment X does cause a reduction in symptoms, but what you failed to anticipate was the drastic negative consequences of the side effects of the treatment.
Confounding Constructs and Levels of Constructs: essentially a labeling issue -- your label is not a good description for what you implemented.
Measurement: Construct Validity

Threats to Construct Validity
Hypothesis Guessing: Most people don't just participate passively in a research project.
Evaluation Apprehension: Many people are anxious about being evaluated.
Experimenter Expectancies: The researcher can bias the results of a study in countless ways, both consciously or unconsciously.
Measurement: Construct Validity
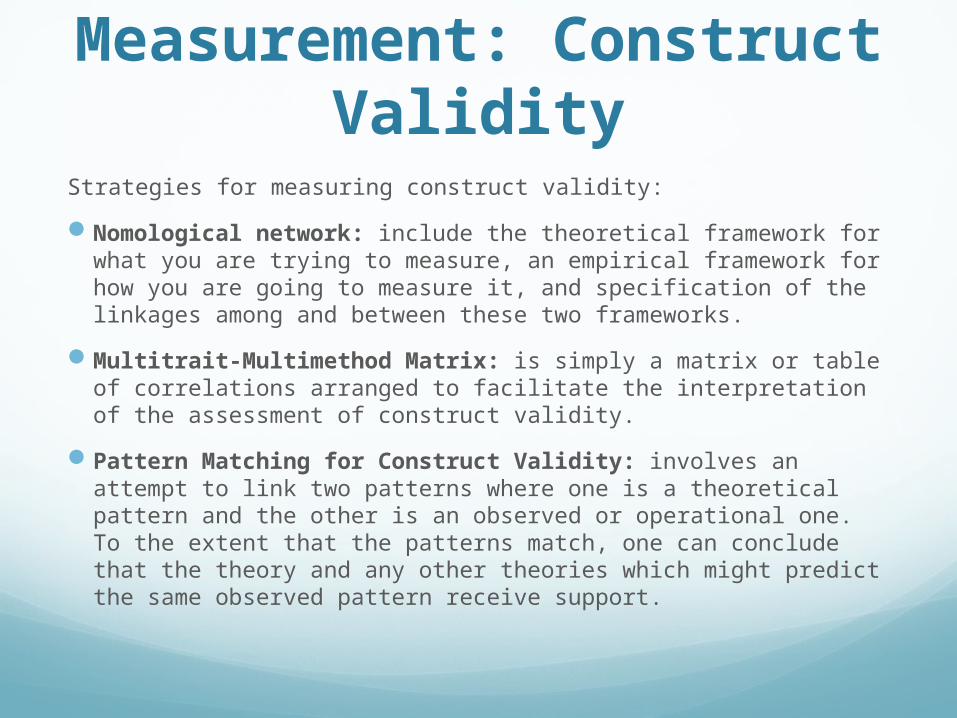
Strategies for measuring construct validity:
Nomological network: include the theoretical framework for what you are trying to measure, an empirical framework for how you are going to measure it, and specification of the linkages among and between these two frameworks.
Multitrait-Multimethod Matrix: is simply a matrix or table of correlations arranged to facilitate the interpretation of the assessment of construct validity.
Pattern Matching for Construct Validity: involves an attempt to link two patterns where one is a theoretical pattern and the other is an observed or operational one. To the extent that the patterns match, one can conclude that the theory and any other theories which might predict the same observed pattern receive support.
Measurement: Construct Validity

Has to do with the quality of measurement, the "consistency" or "repeatability" of your measures.
A measure is considered reliable if it would give us the same result over and over again.
True Score Theory: is a theory about measurement, every measurement is an additive composite of two components: true ability of the respondent on that measure; and random error. A measure that has no random error is perfectly reliable; a measure that has no true score has zero reliability.
Measurement: Reliability

Measurement Error: is divided into two subcomponents: Random error is caused by any factors that randomly affect
measurement of the variable across the sample. Does not have any consistent effects across the entire sample, does not affect average performance for the group.
Systematic error is caused by any factors that systematically affect measurement of the variable across the sample. Is considered to be bias in measurement.
Reducing Measurement Error pilot test your instruments, getting feedback from your respondents
regarding how easy or hard the measure was and information about how the testing environment affected their performance.
make sure you train those collecting data thoroughly so that they aren't inadvertently introducing error.
double-check the data thoroughly. All data entry for computer analysis should be "double-punched" and verified
use statistical procedures to adjust for measurement error. use multiple measures of the same construct.
Measurement: Reliability

Types of reliability:
Inter-Rater or Inter-Observer Reliability: Used to assess the degree to which different raters/observers give consistent estimates of the same phenomenon.
Test-Retest Reliability: Used to assess the consistency of a measure from one time to another. Administer the same test to the same sample on two different occasions.
Parallel-Forms Reliability: Used to assess the consistency of the results of two tests constructed in the same way from the same content domain. The correlation between the two parallel forms is the estimate of reliability.
Internal Consistency Reliability: Used to assess the consistency of results across items within a test. Estimating how well the items that reflect the same construct yield similar results.
Measurement: Reliability
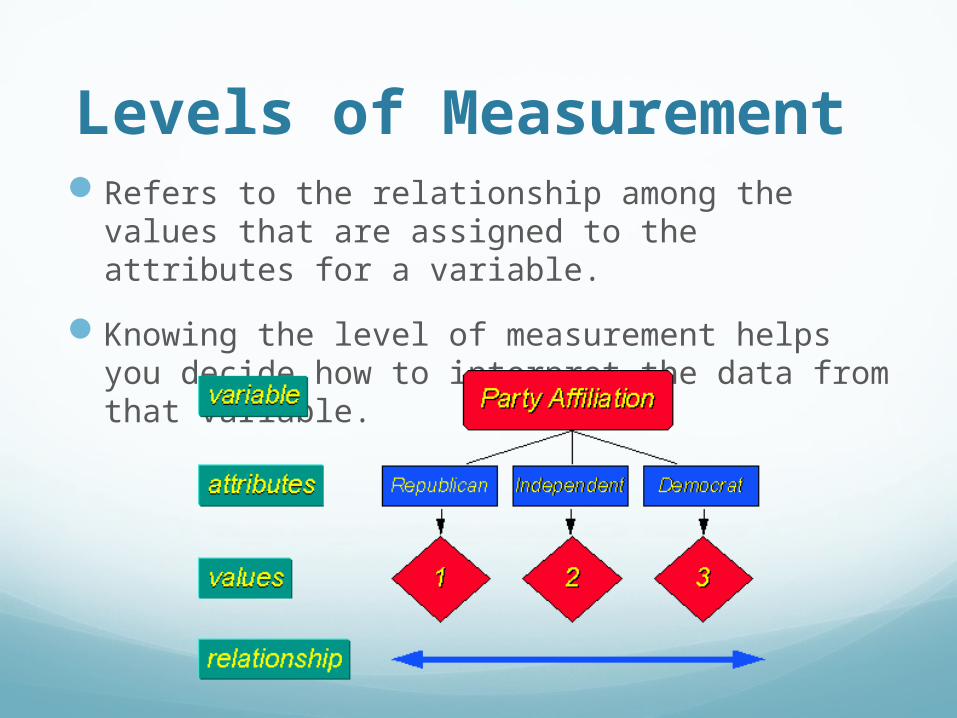
Levels of Measurement Refers to the relationship among the values that
are assigned to the attributes for a variable.
Knowing the level of measurement helps you decide how to interpret the data from that variable.

There are typically four levels of measurement that are defined: Nominal: measurement the numerical values just
"name" the attribute uniquely. No ordering of the cases is implied.
Ordinal: measurement the attributes can be rank-ordered. Here, distances between attributes do not have any meaning.
Interval: measurement the distance between attributes does have meaning.
Ratio: measurement there is always an absolute zero that is meaningful. This means that you can construct a meaningful fraction (or ratio) with a ratio variable.
Levels of Measurement
Measurement: Survey Research
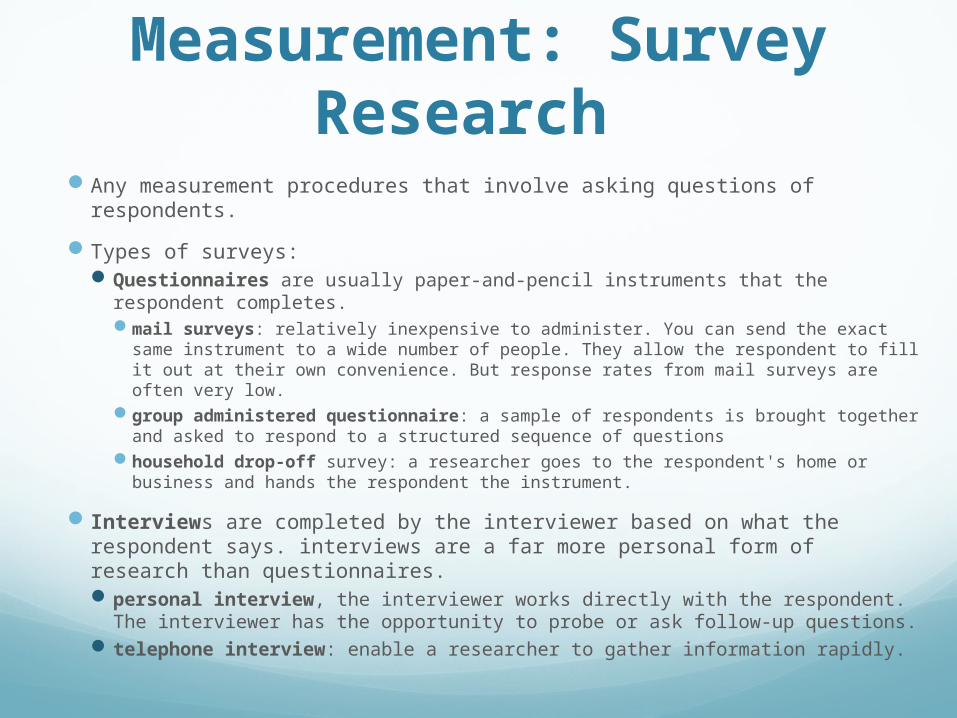
Any measurement procedures that involve asking questions of respondents.
Types of surveys: Questionnaires are usually paper-and-pencil instruments that the
respondent completes. mail surveys: relatively inexpensive to administer. You can send the exact
same instrument to a wide number of people. They allow the respondent to fill it out at their own convenience. But response rates from mail surveys are often very low.
group administered questionnaire: a sample of respondents is brought together and asked to respond to a structured sequence of questions
household drop-off survey: a researcher goes to the respondent's home or business and hands the respondent the instrument.
Interviews are completed by the interviewer based on what the respondent says. interviews are a far more personal form of research than questionnaires. personal interview, the interviewer works directly with the respondent.
The interviewer has the opportunity to probe or ask follow-up questions. telephone interview: enable a researcher to gather information rapidly.
Selecting the Survey Method:
Population Issues: has to do with the population and its accessibility. Can the population be enumerated? Is the population literate? Are there language issues? Will the population cooperate? What are the geographic restrictions?
Sampling Issues: the sample is the actual group you will have to contact in some way. What data is available? Can respondents be found? Who is the respondent? Can all members of population be sampled? Are response rates likely to be a problem?
Measurement: Survey Research

Selecting the Survey Method:
Question Issues: the nature of what you want to ask respondents can determine the type of survey. What types of questions can be asked? How complex will the questions be? Will screening questions be needed? Can question sequence be controlled? Do you need to ask lots of follow-up questions that you can't easily
anticipate? Will lengthy questions be asked? Will long response scales be used?
Content Issues: the content of your study can also pose challenges for the different survey types you might utilize. Can the respondents be expected to know about the issue? Will respondent need to consult records?
Measurement: Survey Research
Selecting the Survey Method:
Bias Issues: people come to the research endeavor with their own sets of biases and prejudices. Sometimes, these biases will be less of a problem with certain types of survey approaches. Can social desirability be avoided? Can interviewer distortion and subversion be controlled? Can false respondents be avoided?
Administrative Issues: consider the feasibility of the survey method for your study. costs facilities time personnel
Measurement: Survey Research

Constructing the Surveydetermining the question content, scope and
purposechoosing the response format that you use for
collecting information from the respondentfiguring out how to word the question to get at the
issue of interest
Measurement: Survey Research

Types Of Questions:
Dichotomous Questions: when a question has two possible responses.
Questions Based on Level Of Measurement: we might measure occupation using a nominal or ordinal questions or that attempt to measure on an interval level. Cumulative or Guttman scale: respondent checks each item with
which they agree. The items themselves are constructed so that they are cumulative -- if you agree to one, you probably agree to all of the ones above it in the list.
Semantic differential. Here, an object is assessed by the respondent on a set of bipolar adjective pairs.
Filter or Contingency Questions: ask the respondent one question in order to determine if they are qualified or experienced enough to answer a subsequent one.
Measurement: Survey Research

Question Content: you should ask yourself how well each question addresses the content you are trying to get at.
Is the Question Necessary/Useful?
Are Several Questions Needed?
Do Respondents Have the Needed Information?
Does the Question Need to be More Specific?
Is Question Sufficiently General?
Is Question Biased or Loaded?
Will Respondent Answer Truthfully?
Measurement: Survey Research

Response Format: how you collect the answer from the respondent. Structured Response Formats: helps the respondent to
respond more easily and help the researcher to accumulate and summarize responses more efficiently.
Fill-In-The-Blank. Check The Answer
multi-option variable. You have to be careful when you analyze data from a multi-option variable. Because the respondent can select any of the options, you have to treat this type of variable in your analysis as though each option is a separate variable.
Circle The Answer.single-option variable -- even though the respondent has
multiple choices, they can only select one of them. Unstructured Response Formats: it's written text.
Measurement: Survey Research
Question Wording: One of the major difficulty in writing good survey questions is getting the wording right. Can the Question be Misunderstood? What Assumptions Does the Question Make? What Assumptions Does the Question Make? How personal is the wording? Is the wording too direct? Does the question contain difficult or unclear terminology? Does the question make each alternative explicit? Is the wording objectionable? Is the wording loaded or slanted?
Measurement: Survey Research
Question Placement Is the answer influenced by prior questions? Does question come too early or too late to arouse
interest? Does the question receive sufficient attention?
A Checklist of Considerations start with easy, nonthreatening questions put more difficult, threatening questions near end never start a mail survey with an open-ended question for historical demographics, follow chronological order ask about one topic at a time when switching topics, use a transition reduce response set (the tendency of respondent to just
keep checking the same response) for filter or contingency questions, make a flowchart
Measurement: Survey Research

The Golden Rule: you should keep the following in mind: Thank the respondent at the beginning for allowing
you to conduct your study Keep your survey as short as possible -- only include
what is absolutely necessary Be sensitive to the needs of the respondent Be alert for any sign that the respondent is
uncomfortable Thank the respondent at the end for participating Assure the respondent that you will send a copy of
the final results
Measurement: Survey Research
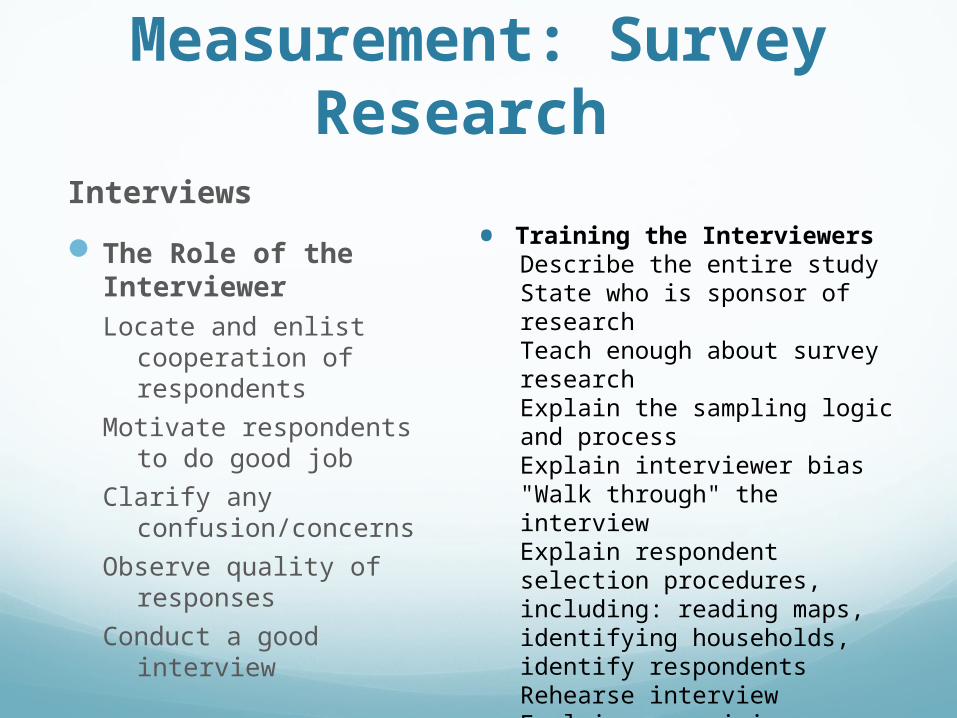
Interviews
The Role of the InterviewerLocate and enlist
cooperation of respondents
Motivate respondents to do good job
Clarify any confusion/concerns
Observe quality of responses
Conduct a good interview
Measurement: Survey Research
• Training the InterviewersDescribe the entire studyState who is sponsor of researchTeach enough about survey researchExplain the sampling logic and processExplain interviewer bias"Walk through" the interviewExplain respondent selection procedures, including: reading maps, identifying households, identify respondentsRehearse interviewExplain supervisionExplain scheduling

The Interviewer's Kita "professional-looking" 3-ring notebook (this
might even have the logo of the company or organization conducting the interviews)
maps sufficient copies of the survey instrument official identification (preferable a picture ID) a cover letter from the Principal Investigator or
Sponsor a phone number the respondent can call to verify
the interviewer's authenticity
Measurement: Survey Research

The Interview
Opening Remarks Gaining entry: initial appearance. Doorstep technique: smile and be brief. Introduction: move to introducing yourself. State your name and the name of
the organization you represent. Show your identification badge and the letter that introduces you.
Explaining the study: Keep it short; assure the respondent that you are interviewing them confidentially, and that their participation is voluntary.
Asking the Questions Use questionnaire carefully, but informally Ask questions exactly as written Follow the order given Don't finish sentences
Obtaining Adequate Responses - The Probe Silent probe Overt encouragement Elaboration Ask for clarification Repetition
Measurement: Survey Research

The Interview
Recording the Response Record responses immediately Include all probes Use abbreviations where possible
Concluding the Interview Thank the respondent Tell them when you expect to send results Don't be brusque or hasty Immediately after leaving -- write down any notes about
how the interview went
Measurement: Survey Research

Measurement: Scaling Scaling is the branch of measurement that involves the
construction of an instrument that associates qualitative constructs with quantitative metric units.
Scaling is the assignment of objects to numbers according to a rule.
Scaling methods: Defining the Focus. Generating Potential Scale Items. Rating the
Scale Items. Computing Scale Score Values for Each Item. Selecting the Items. Administering the Scale.
Thurstone Scaling Likert Scaling Guttman Scaling: a set of items or statements so that a
respondent who agrees with any specific question in the list will also agree with all previous questions
Measurement: Qualitative Measures
There are a number of important questions you should consider before undertaking qualitative research:
Do you want to generate new theories or hypotheses?
Do you need to achieve a deep understanding of the issues?
Are you willing to trade detail for generalizability? On the positive side, it enables you to describe the
phenomena of interest in great detail, in the original language of the research participants.
On the negative side, when you have that kind of detail, it's hard to determine what the generalizable themes may be.
Is funding available for this research?

Qualitative Data: It includes virtually any information that can be captured that is not numerical in nature.
Types:In-Depth Interviews: The purpose of the
interview is to probe the ideas of the interviewees about the phenomenon of interest.
Direct Observation Written Documents
Measurement: Qualitative Measures

Qualitative Approaches: general way of thinking about conducting qualitative research.
Approaches:Phenomenology: focus on people's subjective
experiences and interpretations of the world. Field Research: the researcher goes "into the
field" to observe the phenomenon in its natural state or in situ.
Grounded Theory: to develop theory about phenomena of interest. The theory needs to be grounded or rooted in observation.
Measurement: Qualitative Measures

Qualitative Methods: Participant Observation: how to enter the context,
the role of the researcher as a participant, the collection and storage of field notes, and the analysis of field data.
Direct Observation: the direct observer does strive to be as unobtrusive as possible so as not to bias the observations.
Unstructured Interviewing: direct interaction between the researcher and a respondent or group. There is no formal structured instrument or protocol.
Case Studies: intensive study of a specific individual or specific context.
Measurement: Qualitative Measures
Qualitative ValidityCredibility: establishing that the results of
qualitative research are credible or believable from the perspective of the participant in the research.
Transferability: the degree to which the results of qualitative research can be generalized or transferred to other contexts or settings.
Dependability: emphasizes the need for the researcher to account for the ever-changing context within which research occurs.
Confirmability: the degree to which the results could be confirmed or corroborated by others.
Measurement: Qualitative Measures

Measurement: Unobtrusive Measures
Measures that don't require the researcher to intrude in the research context.
Presumably reduces the biases that result from the intrusion of the researcher or measurement instrument.

Types: Indirect Measures: The researcher is able to collect the data without
introducing any formal measurement procedure. Ex. place hidden cameras and code patron interest based on videotaped evidence.
Content Analysis: is the analysis of text documents to identify patterns in text. It includes: Thematic analysis of text: The identification of themes or major ideas Indexing text documents. Ex. computer analysis of text data. Quantitative descriptive analysis: describe features of the text
quantitatively.
Secondary Analysis of Data: makes use of already existing sources of data. Among the data available for secondary analysis is: census bureau data crime records standardized testing data economic data consumer data
Measurement: Unobtrusive Measures

Design A design is used to structure the research, to
show how all of the major parts of the research project -- the samples or groups, measures, treatments or programs, and methods of assignment -- work together to try to address the central research questions.
Design: Internal Validity
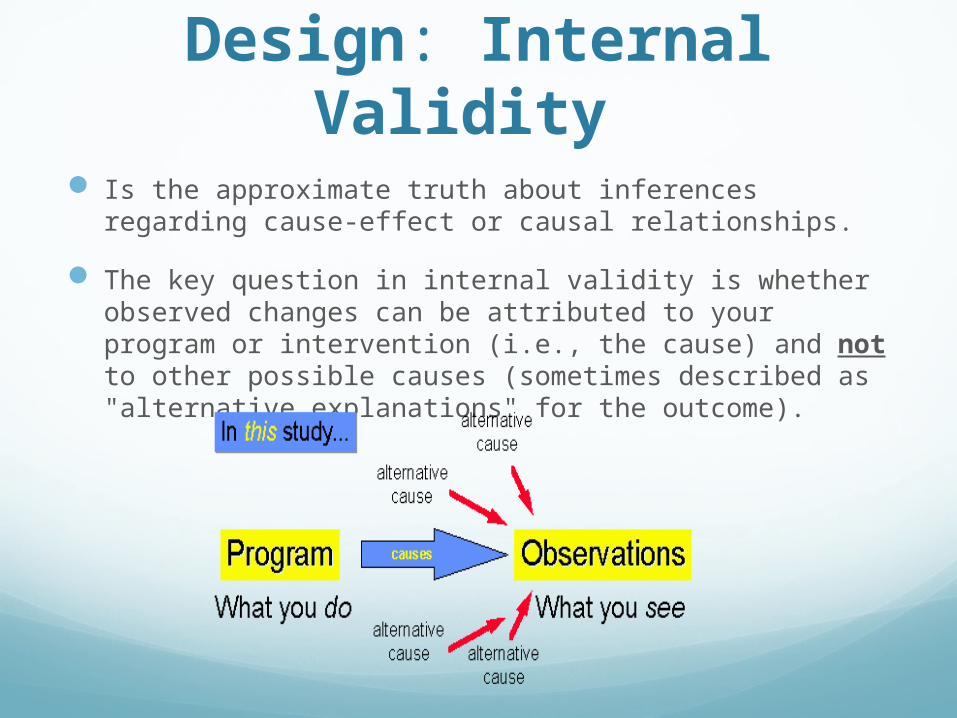
Is the approximate truth about inferences regarding cause-effect or causal relationships.
The key question in internal validity is whether observed changes can be attributed to your program or intervention (i.e., the cause) and not to other possible causes (sometimes described as "alternative explanations" for the outcome).
Establishing a Cause-Effect Relationship: there are three criteria that you must meet before you can say that you have evidence for a causal relationship:
Temporal Precedence: to show that your cause happened before your effect.
Covariation of the Cause and Effect: Before you can show that you have a causal relationship you have to show that you have some type of relationship: if program then outcome, if not program then not outcome
No Plausible Alternative Explanations.
You can solve these by incorporating the use of a control group -- a group that is comparable to your program group with the only difference being that they didn't receive the program.
Design: Internal Validity

Threats to internal validity:
Single Group Threats: History Threat: some historical event that occurred caused the
outcome. Maturation Threat: The children would have had the exact same
outcome even if they had never had been exposed to your program.
Testing Threat: taking the pretest made some of the participants more aware of what you would test after.
Instrumentation Threat: the change from pretest to posttest is due not to your program but rather to a change in the test that was used.
Mortality Threat: people are dropping out of the study. Regression Threat: is a statistical phenomenon that occurs
whenever you have a nonrandom sample from a population and two measures that are imperfectly correlated.
How to prevent them? through your research design, you could incorporate a control group.
Design: Internal Validity
Threats to internal validity:
Multiple Group ThreatsA multiple-group design typically involves at least
two groups and before-after measurement. One group receives the program or treatment while the other does not and constitutes the "control" or comparison group.
One threat is selection bias or selection threat: any factor other than the program that leads to posttest differences between groups.
This type of study also has the same threats as the single groups threats.
Design: Internal Validity

Social Interaction Threats: social pressures in the research context that can lead to posttest differences that are not directly caused by the treatment itself. Diffusion or Imitation of Treatment: a comparison group
learns about the program either directly or indirectly from program group participants.
Compensatory Rivalry: the comparison group knows what the program group is getting and develops a competitive attitude with them.
Resentful Demoralization: students in the comparison group know what the program group is getting and they get discouraged or angry and they give up.
Compensatory Equalization of Treatment: compensate one group for the perceived advantage of the other.
Design: Internal Validity
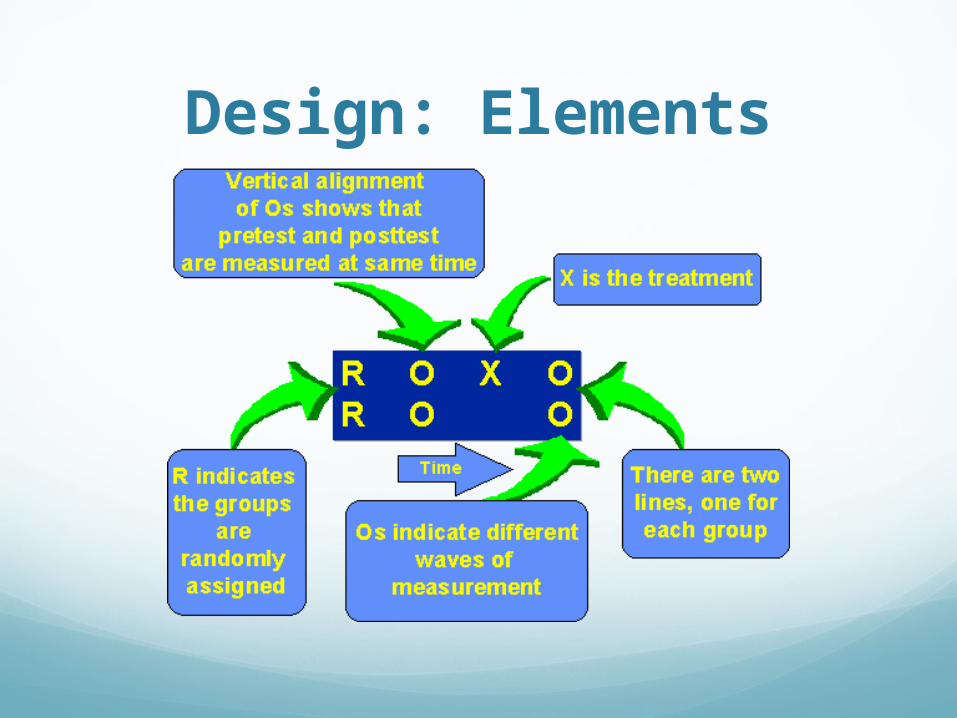
Design: ElementsElements of research design:
Observations or Measure: are symbolized by an 'O' in design notation.
Treatments or Programs: are symbolized with an 'X' in design notations.
Groups: Each group in a design is given its own line in the design structure.
Assignment to Group: designated by a letter at the beginning of each line (i.e., group) that describes how the group was assigned. The major types of assignment are:R = random assignmentN = nonequivalent groupsC = assignment by cutoff
Time: Elements that are listed on the left occur before elements that are listed on the right.
Design: Elements

Design: Types
With respect to internal validity or causal assessment, randomized experiment generally is the strongest and a non-experiment is generally the weakest.
Design: ExperimentalCreate two groups that are "equivalent" to each
other (assign people randomly from a common pool of people into the two groups).
One group gets the program and the other group does not. In all other respects, the groups are treated the same.
If we observe differences in outcomes, then the differences must be due to the only thing that differs between them -- that one got the program and the other didn't.

Random selection is how you draw the sample of people for your study from a population.
Random assignment is how you assign the sample that you draw to different groups or treatments in your study.
Design: Experimental

Types of experimental design: two-group experimental designs: two-group posttest-only
randomized experiment. Used for assessing cause-effect relationships.
signal-enhancing experimental designs (signal is the construct you're trying to measure): factorial designs. Used to examine treatment variations,
effective way to examine interaction effects and treatment variations.
noise-reducing experimental designs (noise is the random factors in the situation that make it harder to see the signal ): covariance designs: is a just pretest-posttest randomized
experimental design. It "adjusts" posttest scores for variability on the covariate (pretest).
Randomized Block Design is research design's equivalent to stratified random sampling. The experimental design you want to implement is implemented within each block or homogeneous subgroup. Each estimate of the treatment effect within a block is more efficient than estimates across the entire sample.
Design: Experimental

The Solomon Four-Group Design is designed to deal with a potential testing threat. This design has four groups, two of the groups
receive the treatment and two do not. Further, two of the groups receive a pretest and two do not.
The Switching Replications: it addresses the need to deny the program to some participants through random assignment. The design notation indicates that this is a two group
design with three waves of measurement. The two groups switch roles – so by the end of the study all participants have received the treatment.
Design: Hybrid Experimental Designs
Like an experimental design but lacks the key ingredient -- random assignment.
Types: the nonequivalent groups design: requires a pretest and
posttest for a treated and comparison group. We try to select groups that are as similar as possible so we can fairly compare the treated one with the comparison one.
the regression-discontinuity design: assignment to treatment using a cutoff score on a pretreatment variable -- allows us to assign to the program those who need or deserve it most.
other quasi-experiments: Proxy Pretest Design, Double Pretest Design, Nonequivalent Dependent Variables Design, Pattern Matching Design, and the Regression Point Displacement design.
Design: Quasi-Experimental Design

Three major types of pre-post program-comparison group designs, the designs differ in the method by which participants are assigned to the two groupsThe Randomized Experimental (RE) Design
participants are assigned randomly. The Nonequivalent Group (NEGD) Design
assignment of participants is not explicitly controlled -- they may self select into either group, or other unknown or unspecified factors may determine assignment.
The Regression-Discontinuity (RD) Design they are assigned using a cutoff score on the pretest.
Design: Pre-Post Designs

Designing Designs for Research
Basic principles of design logic:
Minimizing Threats to Validity: minimize the plausible alternative explanations for the hypothesized cause-effect relationship. By Argument: to simply argue that the threat in question is not a
reasonable one. Such an argument may be made either a priori or a posteriori,
By Measurement or Observation: rule out a threat by measuring it and demonstrating that either it does not occur at all or occurs so minimally as to not be a strong alternative explanation for the cause-effect relationship.
By Design: ruling out alternative explanations by adding treatment or control groups, waves of measurement, and the like.
By Statistical Analysis: conducting a two-way analysis of variance or using covariance analysis.
By Preventive Action: When potential threats are anticipated they can often be ruled out by some type of preventive action.

Design ConstructionTime: A causal relationship, by its very nature,
implies that some time has elapsed between the occurrence of the cause and the consequent effect.
Program(s) or Treatment(s): The presumed cause may be a program or treatment under the explicit control of the researcher or the occurrence of some natural event or program not explicitly controlled.
Observation(s) or Measure(s).Groups or Individuals who participate in various
conditions.
Designing Designs for Research

The Nature of Good Design: Theory-Grounded. reflect the theories which are being
investigated. Situational. reflect the settings of the investigation. Similarly,
intergroup rivalry, demoralization, and competition might be assessed through the use of additional comparison groups who are not in direct contact with the original group.
Feasible. Good designs can be implemented. The sequence and timing of events are carefully thought out. Potential problems in measurement, adherence to assignment, database construction and the like, are anticipated. Where needed, additional groups or measurements are included in the design to explicitly correct for such problems.
Redundant. Good research designs have some flexibility built into them. Often, this flexibility results from duplication of essential design features.
Efficient. Good designs strike a balance between redundancy and the tendency to overdesign. Where it is reasonable, other, less costly, strategies for ruling out potential threats to validity are utilized.
Designing Designs for Research

Analysis Cleaning and organizing the data for analysis:
Data Preparation involves checking or logging the data in; checking the data for accuracy; entering the data into the computer; transforming the data; and developing and documenting a database structure that integrates the various measures.
Describing the data: Descriptive Statistics are used to describe the basic features of
the data in a study. They provide simple summaries about the sample and the measures. Together with simple graphics analysis, they form the basis of virtually every quantitative analysis of data. With descriptive statistics you are simply describing what is, what the data shows.
Testing Hypotheses and Models: We use inferential statistics to make inferences from our data
to more general conditions.

Inferential statistics methods: General Linear Model: The General Linear Model
(GLM) underlies most of the statistical analyses that are used in applied and social research. It is the foundation for the t-test, Analysis of Variance
(ANOVA), Analysis of Covariance (ANCOVA), regression analysis, and many of the multivariate methods including factor analysis, cluster analysis, multidimensional scaling, discriminant function analysis, canonical correlation, and others.
One of the keys to understanding how groups are compared is embodied in the notion of the "dummy" variable, is one that uses discrete numbers, usually 0 and 1, to represent different groups in your study.
Analysis

Inferential statistics methods:
Experimental Analysis. The simple two-group posttest-only randomized
experiment is usually analyzed with the simple t-test or one-way ANOVA.
The factorial experimental designs are usually analyzed with the Analysis of Variance (ANOVA) Model.
Randomized Block Designs use a special form of ANOVA blocking model that uses dummy-coded variables to represent the blocks.
The Analysis of Covariance Experimental Design uses, not surprisingly, the Analysis of Covariance statistical model.
Analysis
Inferential statistics methods:
Quasi-Experimental Analysis. To analyze the Nonequivalent Groups Design (NEGD) we have to
adjust the pretest scores for measurement error in what is often called a Reliability-Corrected Analysis of Covariance model.
In the Regression-Discontinuity Design, we need to be especially concerned about curvilinearity and model misspecification. We tend to use a conservative analysis approach that is based on polynomial regression that starts by overfitting the likely true function and then reducing the model based on the results.
The Regression Point Displacement Design has only a single treated unit. Nevertheless, the analysis of the RPD design is based directly on the traditional ANCOVA model.
Analysis

Analysis: Conclusion Validity
Is the degree to which conclusions we reach about relationships in our data are reasonable.
Threats to Conclusion Validity: Finding no relationship when there is one (or, "missing the needle
in the haystack") low reliability of measurespoor reliability of treatment implementation. random irrelevancies in the setting random heterogeneity of respondents. low statistical power
Finding a relationship when there is not one (or "seeing things that aren't there”)fishing and the error rate problem.
Problems that can lead to either conclusion error If you are not sensitive to the assumptions behind your analysis
you are likely to draw erroneous conclusions about relationships.

Guidelines for Improving Conclusion Validity Good Statistical Power. The rule of thumb in social research is
that you want statistical power to be greater than 0.8 in value. That is, you want to have at least 80 chances out of 100 of finding a relationship when there is one.
Good Reliability. Reliability is related to the idea of noise or "error" that obscures your ability to see a relationship. In general, you can improve reliability by doing a better job of constructing measurement instruments, by increasing the number of questions on an scale or by reducing situational distractions in the measurement context.
Good Implementation. When you are studying the effects of interventions, treatments or programs, you can improve conclusion validity by assuring good implementation. This can be accomplished by training program operators and standardizing the protocols for administering the program.
Analysis: Conclusion Validity

Write-UpGeneral considerations to keep in mind when
generating a report:The Audience: Reports will differ considerably
depending on whether the audience will want or require technical detail, whether they are looking for a summary of results, or whether they are about to examine your research in a Ph.D. exam.
The Story: When you write your report, you should attempt to tell the "story" to your reader.
Formatting Considerations depending on where you plan to publish it.
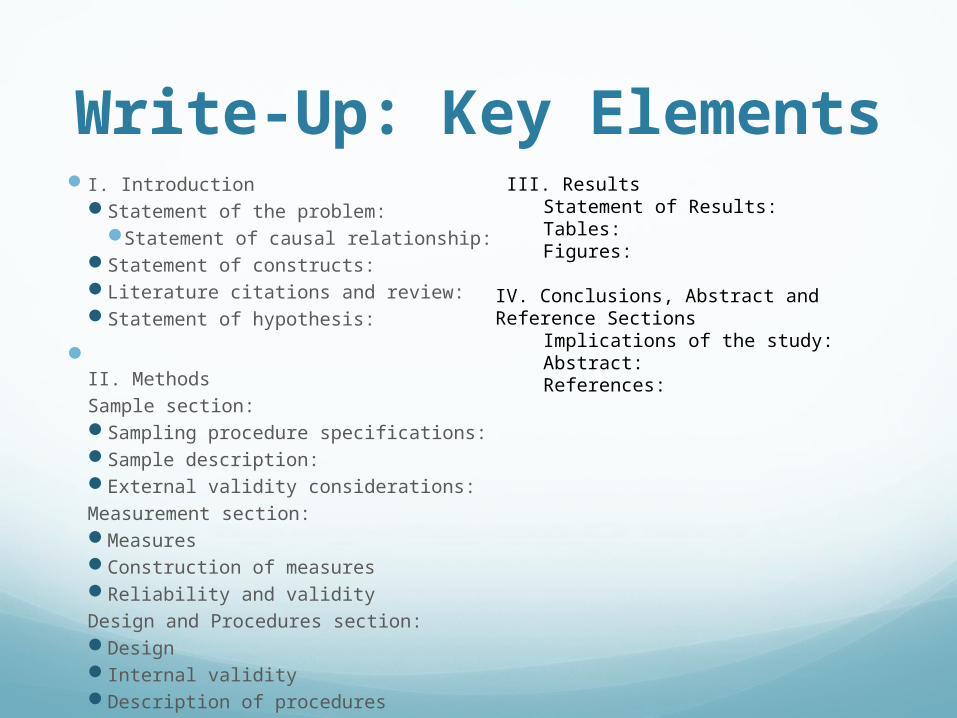
I. Introduction Statement of the problem:
Statement of causal relationship: Statement of constructs: Literature citations and review: Statement of hypothesis:
II. MethodsSample section: Sampling procedure specifications: Sample description: External validity considerations: Measurement section: Measures Construction of measures Reliability and validityDesign and Procedures section: Design Internal validity Description of procedures
Write-Up: Key Elements III. Results
Statement of Results: Tables: Figures:
IV. Conclusions, Abstract and Reference Sections
Implications of the study: Abstract: References:
I. Professional Writing: Material is presented in an unbiased and unemotional.
II. Parallel Construction: Tense is kept parallel within and between sentences.
III. Sentence Structure: Sentence structure and punctuation are correct. Incomplete and run-on sentences are avoided.
IV. Spelling and Word Usage: Spelling and use of words are appropriate. Words are capitalized and abbreviated correctly.
V. General Style: The document is neatly produced and reads well. The format for the document has been correctly followed.
Write-Up: Stylistic Elements

Guidelines follow the formatting guidelines of the American Psychological Association documented in Publication Manual of the American Psychological Association Title Page Abstract (on a separate single page) The Body (no page breaks between sections in the body)
Introduction (2-3 pages) Methods (7-10 pages)
Sample (1 page) Measures (2-3 pages) Design (2-3 pages) Procedures (2-3 pages)
Results (2-3 pages) Conclusions (1-2 pages)
References Tables (one to a page) Figures (one to a page) Appendices
Write-Up: Formatting