RESEARCH MEMORANDUM - Digital Library/67531/metadc57586/m... · · 2018-05-06Cd section pressure...
35
Author;? 'T " . " RESEARCH MEMORANDUM By Charles W. Frfck and John W. Boyd Ames Aeronautical Laboratory . Moffett Field, Calif. NATIONAL ADVISORY COMMITTEE FOR AERONAUTICS WASHINGTON June 10, 1948 UrmASS1FLEU . - I
Transcript of RESEARCH MEMORANDUM - Digital Library/67531/metadc57586/m... · · 2018-05-06Cd section pressure...
Author;?
'T " . "
RESEARCH MEMORANDUM
By Charles W. Frfck and John W. Boyd
Ames Aeronautical Laboratory . Moffett Field, Calif.
NATIONAL ADVISORY COMMITTEE FOR AERONAUTICS
WASHINGTON June 10, 1948 UrmASS1FLEU . - I
XACA RM No. -22
BICO?XVXX SFL!TCOl!T AT ZERO LIFT
By Charles W. Wick and J o h W. Boyd
The resul ts of an investigation at sugersontc speed of the distri- bution of pressure at zero lift over the surface of a swept a f r f o i l of biconvex section are presented. The a l r fo i l used for the experiment IQS conposed of sectlons 7 percent thick in streamwise planes and was swepl- back 63O. The aspect ratio was 1.66 and the taper ratio 1. The tests were made a t a Mach n-er of 1.53 over a Reynolds nuiber range of 0.481 x 10" t o 3.25 x los.
The measured pressures have been compared with theoretical values calculated from thin-airfoil theory. In general, good agreement i s found except whsre the limitations of the linear theory may be expected t o manifest themselves: namely,
1. The region of influence of the subaonfc t ra f l ing edge on the pressure distributfon, which determines the location of the pressure minimum, does not extena up to the Mach line from the root trail ing edge as theory predicts, since the loca l Mach nun&ers oa the a i r f o i l are appreciably greater than tha t of the stream. The position of the pressure. minfmum is therefore moved rea3ward.
2. '1Ihe pressure recovery behind the pressure minimum is greater than predicted by theory and, although the data axe not CcmclusTve, appears t o take place, in part, through a shock wave.
These deviations from the llnear theory result in an appreciable increase in the pressure drag over that calculated by theory.

L- W A €34 no. -22
The adaptation of the theory of sound wave^^ of a n d l amplitude t o the a e r o d p m i o s of bodfes moving at eu)?eraonic 8peed8 has been f m d t o be very f r u i t f u l in producing method8 of calculating pressure dlstributfons for .thin wln@;~ at zero lift (references 1, 2, and 3 ) . Zkeee methods a r e limited, however, t o win@ which are thin in both longitudinal and transverse sections, go that
1. The axial perturbation velocities are amall w i t h respect t o the absolute value of the difference between the stream velocity and the velocity of e m d in the f lu id .
2. The l a t e r a l perturbation velocities are amall both w i t h r e m c t t o the atream velocity and the velocity of sound in the f h i d .
The theory, of course, a 8 m e s that t h e f l u i d is inviscid. This aestnaption has been found to give satisfactory results in the theoret- ical calculatione of pressure distributions at subcriticaL 8peeds for flm not involving sep&atim, the effect of viscosfty being cmfined primarily t o a thin layer of f l u i d next t o the airSofL surface. !Rm range of applicabili ty of the perfect f l u i d theory at eupersonfc Bpeede must be determined by careful expriment. Xqeriment must ale0 be r e l i ed on t o show how well the linearized .theory predicts the
cannot be m i d t o be thin. pressure-di8kibutim a h a ; r a C k Y ' i S t i C E O f WinPJthe 8 0 C t i O I l S O f which
Agreement between theory and experiment has been found tc be good for unswept airfoils, at leesrt for the portion af the pan unaffected by flow near the t ips . The results of an investigation f o r a swept+ back a i r f o i l a t zero lift, which may be treated theoretically by references 2 and-3, are discussed In the present report. The material for this report wa8 obtained as a part of an investig5tion of the pressureil istr ibution characterfetics of awept airfoils at Bupereonic speed8 both at zero lift and at angles of attack.
SYMBOLS
M local Mach number on a i r f o l l surface
R e Reynolda number baaed on tple streamwise chord of 6 inohes
. "

NACA RM No. A&22 .
Po-w stream static pressure coefficient 90
PO stream s t a t i c pressure
PW
P pressure coefficient
P l oca l s t a t i c pressure on airfoil
reference static pressure
(F)
C d section pressure drag coefficient
.
The ezperimental investigation discuseed herein w a s made in the he38 1- by 3 4 0 0 t supersonic wind tunnel Bo. 1. This w i n d tunnel is of the c losed-eta variable--pressure type operated a t present w i t h a nozzle of fixed dimensions which gives a Mach number of 1.53 in 9 1- by 2”1/24oot t e s t section. It is fully described in reference 4.
Model and Model Support
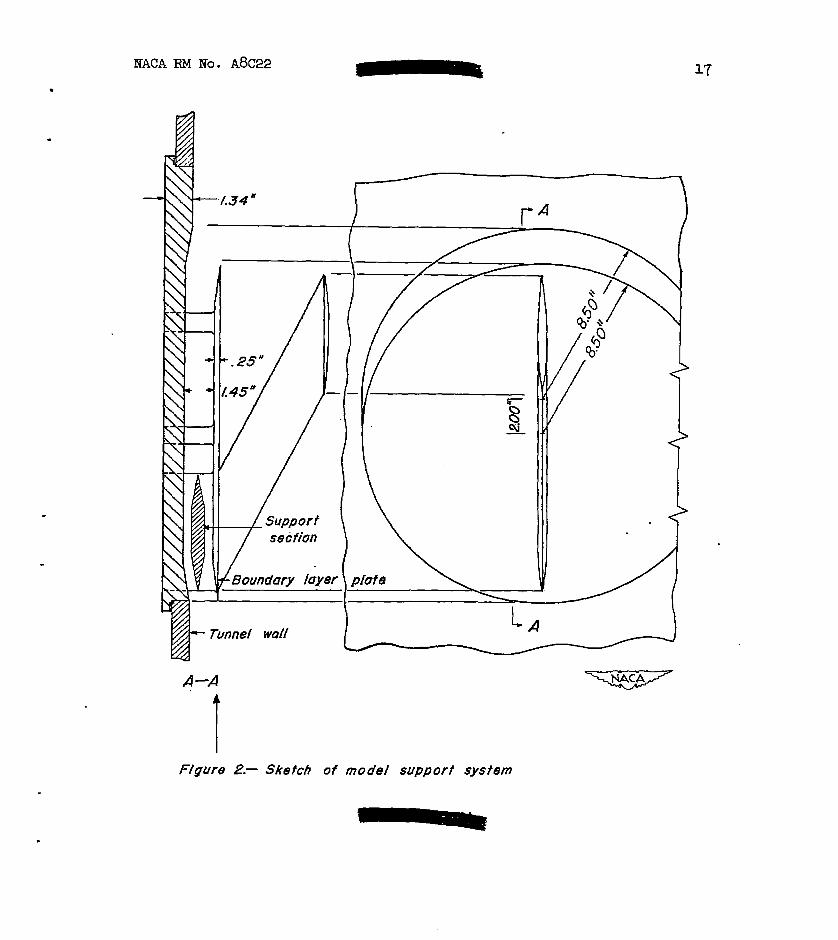
Because of cansiderations of desirable t ea t Reynolds numbers and model s t ructural design and since it was not neceeeary to ma~12re forces or moments with a balance ayetam, a semispan model waa selected, mounted as sho7m in figures 1 and 2. In order to avoid. the undesirable effects of t h e tmel-wal l boundary layer, the model was supported CQ
a thin circular plate positioned in the stream in a. ver t ica l plane 1-1/4 inches from the tunnel side ao ae to b y p a s the tmnel+mJ-l boundary layer (fig. 2). Thie p h t e vas, in turn, m u t e d on a s t ee l plate placed in the frame of t h e window in the tunnel w a l l ordinazily used f o r v i e w i n g the flow around models with the schlieren appratus.
In order t o avoid. choking af the flow in the boundary-layer bypss channel, the -1 was expad& in the &wtream direction by
“F

4 NACA RM Bo. A8C22
- machining the steel plate which replaced t h e window as shown in figure 2.
Disturbances in the tunnel air stream due t o the model-aupport system may originate from the following sources:
1. B e outer surface of t h e model-upport plats
- 3 . '?%.e boundary-layer bypass channel around the sub- sonic edges of the model-rrupport plate
1. 'Ike surface of the model-mpport plate was machined f l a t t o a tolerance of f0.002 inch.
2. The edge of the model-support p la te was beveled t o a s h a q knife edge, the bevel l ocabd on the side of the plate next t o the tunnel wall. k this way, the side of t he plate on which the model was mounted was f l a t and parallel t o the stream, r e d t i n g in a mfnirimm disf.m?bance, and the shock wave due t o the finite thicknese of the pla te was diverted behind the plate into the bqrdary-hyer bypass channel.
3. lple model w&8 s o located on the support plate that the entfre span, except f o r a miU port ion of the t ip , was outside the zone of influence of disturbances propagated fram the bypass chamnel around the subsonic edge of the eupport plate.
Tbe model eeleoted for the investigation was cnmposed of constant- chord biconvex circular-arc sections in plmes perpendicular t o the lea- edge which was mept 6 3 O 45' . Circ-rc eections were chosen for two reaeons : Fi r s t , because the theoretical method of' reference 2 for calculating preseure distributians is restrfcted a t preeent t o a i r f o i l s with sharp leading edges; and, seomd, because the conatrriction of the model is much simplified. The airfoi l sect ions in planes parallel to the stream, therefore, comiated. of e l l i p t ioa l
waer chosed as 7 percent of the chord primarily f r o m coneiderations of mdel strength. A eketoh of the model giving pertinent dimension8 is shown i n figure 3.
arcs. The thiohess of the 8 0 C t i O l l S in p-08 pZ'aUe1 t o the st??-
I

W A RM No. -22 - 5
A chord of 6 inches, consbat across the span, was selected to obtain desirable test Reynolds numbers and t o provide sufficient s ize f o r the d i f f i cu l t task of placing pressure orifices without undue sacriffce in model span and aspect r a t i o . A maximum span of 5 inches for the a i r f o i l was dictated by consideration of the reflec- tion from the opposite tunnel w a l l of the shmk wave originating a t t he apex of the airfoil. A t the test Mach nuniber of 1.53, the tzai l ing edge of the t i p lies about 1 inch ahead of this reflected m ~ e . The r e s u l t i n g aspect r a t l o was 1.66. The t i p of the a i r f o i l , cut off parallel t o the skearn, was formed by simply rotat ing the t2p section about its chord line.
The model was f i t t e d with 74 pressure orifices 0.013 of an inch in diameter arranged to measure the chordwise d ise ibut ion of pressure fur sections parallel to the afr stream at f ive spanwtse positions as s h m in figure 3. Stainless-ateel tubee were connected to these or i f ices and conducted spmwlse throua a channel in the airfoil to .the r o o t and art of the tunnel throu@ the model support. !Be orif'ice pressures w-ere measured on a multiple-tube mascaneter using as a l iqu id an organic compound, tetrabramethane, wbich has a specific gravity of 2.96 at a temperature of TO0 F. A l l pressures, including the test- section reference pressure and the total head of the afr stream, -re recorded photographicallg.
A W t r e a m Characteristics
Prior to actual teste of the airfoil, an inveatigatian of the wind-tunnel air stream was made t o determine the character of the flow a s influenced by the model support system. Surveys of the s t a t i c pressure of the stream w-ere made parallel to the axis of the tunnel at three positions a m o m the e k e a m In the horizontal plane in wkich the model m a placed.
.
These surveys were made with a s t a t i c pressure probe consisting of a 100-caliber o g i d needle, 0.10 inch in diameter. Preseure orlf ices -re placed in the needle at a position f o r which an analyeis using linear theory indicated that the local pressure was equal t o that of the stream.
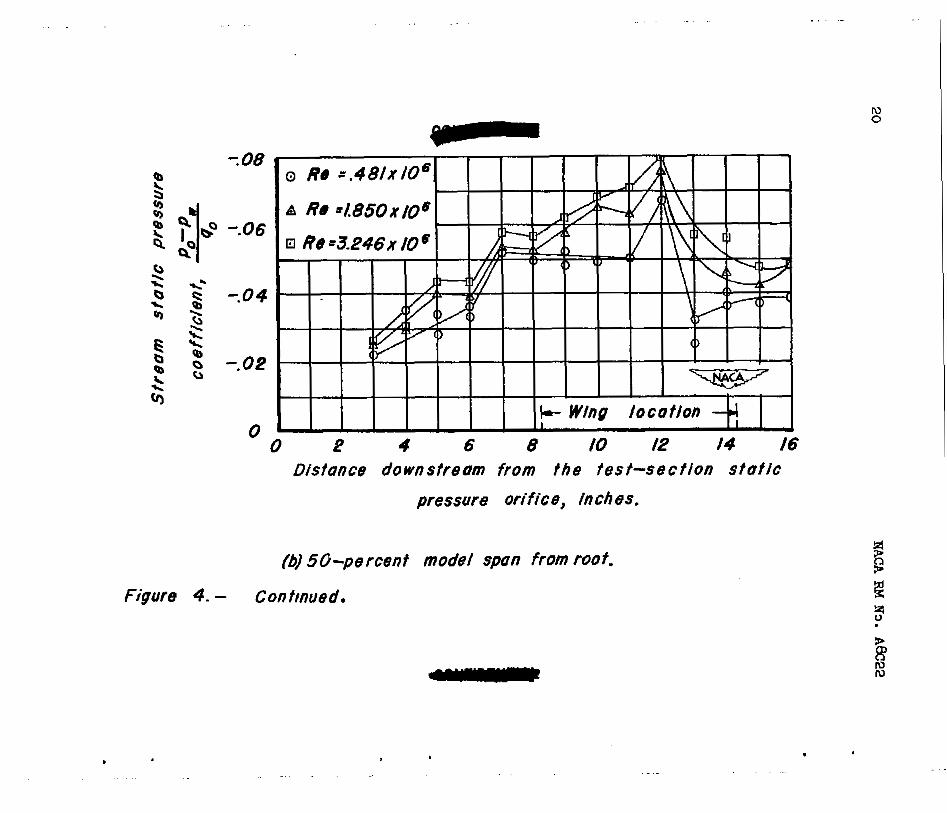
The results of the survey8 are given fn figwe 4, The Reynolds nuuibers indicated in these figures are based on the c i n c h chord of the wing a t tunnel total pressures of 3, 12, and 24 pounds per square inch;respectively. 5 d a t a are given as the difference between the
6 NACA IIM No. A&22
pressure measured with the needle and the pressure measured by the tes-ection reference static-pressure orif ice in terma of the dpamic pressure of the stream. This reference pressure orlfice is located on the side w a l l of the tunnel 3.06 inches ahead of the apex of the leading edge of the model airfoil. The pressure coefficients obtained are plotted as a function of the distance downstream f r o m t h e location of the test-section static-pressure orifice. The location of the wing section at the survey station is sham in each figure.
Ekamination of these data and commrison with previow surveys of the stream along the oenter l ine without the boundary-layer p l a t e show that prautically the only effeot of the model-upport system waa the PopEtgation of a weak compressfan wave in the stream which can be traced to t he leading edge of the model-support plate. This wave, which appears on the pressure s m e y of figure 4(a) 4 inches downstrean of the position of t h e test-aection reference--pressure orifice, becomes of negligible magnitude at appreciable distances outboard of the support plate. (See figs. 4(b) and 4(c). )
At first, the compression wave was believed to be due to the fact that the f l a t outer side of the support plate was not dined with the stream, but further tests, w i t h t h e incidme of the m t e varied, showed merely a change in t h e general pressure level. It seema probable that t h i s disturbance results because it is impossible to produce a leading -e sharp enough in tern of moleoular dlmeneione to prevent the formation of a detached wave whioh is propagated out into the stream, even though t h e flat side of the plate is dined with t he stream. Also, the formation of a boundary layer on the plate probably makes the edge of the a t e effeotively blunt.
The existence of this disturbance had little effect on the pressures in the stream over the region in which t he w i n g wa6 placed. The pressure variation over this region is w i t h i n e 1 4 2 percent of the average dynamic pressure of' the stream. The exact correction for the static- pressure variation in the stream ie exceedingly complex, requiring a knowledge of the source of the preesure dieturbanues and the m m e r in which they are reflected by t he model. For the present report, corrections to the measured pressure data were made by subtracting from the readlng of each orifice the difference in static-pressure coeffi- cient between the value at the position of the oriffce and t he average value over the region of the wing. This amounts to an approrlmate correction, the precision of which will be discussed later.
NACA RM No. a8c22
Reduction of Ihta
7
As mentioned previously, the pressures were recorded by phot- graphing the manometer board. The data were then plot ted direct ly in pressure-coeff ic ien t f o m through the us-e of a film reader. This device, in essence, consists of a ground-&.;Casa screen on mich is projected an lmage of the photographic negative. Tbe magnification of the image can be controlled t o such an extent that the height of a. l iquid column 011 the negative representing the m i c preseure may be adjusted t o equal the dimension on transparent crose”section plott ing paper equfvalent t o a uni t of dynamic pressure. The readings of all the preseure or i f i ce s may then be plotted directly as pressure coefficients. The correction f o r t he static-ressure variation fn the stream, discussed previously, was rush eubeequent t o plotting.
Prec ision
Since the flow in the wind tunnel l e free of st rong ehock waves, there are f ive items in which inaccuracies may occur in determining experimentally the preSSW~8t r ibUt ion cha rac t e r i e t i c s of an air- f o i l :
1. Possible error of the preeeure probe
2. The e r r o r involved in uaing a euperpoeition process to account for the varlation Fn the s h a m e ta t ic pressure over the region of the wlng
3. The error involved in reducing the data w i t h a film reader
5. The errors introduced by variatione in stream angle
No means f o r detemninfng the inaccuracy of the preeeure probe is available at present. It is estimated, however, fram calculation of the pressure distribution m e r the probe and frmm a t is hown about
8 W A RM No. a 2 2
the inaccuracies of pressure orifices, that the pressure probe measures the loca l stream static pressure -thin 4 2 of 1 percent. %is is tihe accuracy of the dynamic pressure used in obtaining pressure coef'fi- c ients . I
The correction made for the pressure variation in the stream over the region of the wing discussed previously is an approximate correction. The t r u e correction, which is very ccanplex, may be a0 much &a twice &a large under certain conditions. In general, the supenpoeitions used & o d d be about 75 percent correct. Since the s t a t i c pressure variation in the stream over the wing i e between EL- and 2 percent of the stream dynamic ~YWEBIU~, the accuracy of the correcticm ehould give t r u e pressure coefficients witk;.ln *1/2 of 1 percent of the dpamic pressure.
me me of a film reader in plot t ing preesure coefficiente involves an e r r o r of about KL/3 of 1 percent at the highest wind- tunnel pressures where most of the pressure mesauraments =re made.
-1/2
Examination of the data, obtained fram test of the a i r f o i l ahowe that orif ices a t the same chordwise and spanwise positions on t he upper and lower surface8 of the wing read the 8- pressure w i t h i n S / 2 of 1 percent of the stream dynardc prepleu&, which is remarlcable in view 09 the difference in contour that may reglult Pram the machining process . As a conservative meam, this e r r o r ma,y be taken as the orif ice error.
-
Surveys of the wind-tunnel stream show small stream angles exist" ing over the region in whioh t h e w i n g was placed. It is evident front a study of the pressure data obtained for the a i r f o i l , however, that their -fnfluenoe w a s negligible, s h o e the lift due to *e' induced caniber effect that should a p p m does not exist.
L
The find accuracy of the pressure"di~tr1bution data C&II be obtained by taking the square root of the sum of the squares of the various inaccuracies. . The final pressure coefficients m e found to be. true values w i t h a fl percent -ok the dpmmic pzysure Or xithin 5 percent of the maxirmtm perturbation pXW88Ur8.
I 3 > > , , ' . " . - TBEQRY >- , , .- i
In reference 2, R. T. Jones has & o w that through the w e of -
\
oblique tramformations it is possible t o arrive at solution6 for the pressure-dis.trfbution chmacterietics of m p t a i r f o i l 8 cat zero lift. While the mthod presented is applicable t o a i r f o i l s of more

blAcA RM No. A8C22 9
or lese azbitnwy section, provided the le- edge is shs;rp, calctl- l a t ion of . q y but wedge, diamand, or parabolic .arc airfoils i e cmglex. Ih general, the anro-tim involved in aasudng the solution f o r a i r f o i l s comgoeed of e l l i p t i c a l o r circular arc8 t o be t he aane a8 f o r a parabolic-erc atrfoil is very good if the thiclmese of the a f r f o i l is mall. Bor the airfoil af the preaent inveati&ption, which i e composed of ell iptic+a-c eectiona in 'the etsleancwfse dfreotim, how- ever, the -thickmas is Buff ic ient ly large ae t o r e q u h a samex%at closer approximation made by increasing the strength of the line sou~ces at the leading and t r a i l i ng edge to give the true wedge angles. The theoretfcal preeeure dietributiona computed in this manner a m ccrmpared wfth the ewrimental resulte in the following section.
P r ~ 6 s " d i f f ~ i b U t i ~ m measummente were made for a of Reynolds nmber of 0.481 x 10⁸ t o 3.25 x lo6 by v m the total. pressure of the wind tunnel from 3 pounds pep square inch t o 24 pounds per square inch abeolute. The results of these tests are given in figure 5 f o r the m i o u e epanwiee etatione a t which the chordwiee variation of the pressure wae obtained.
The agpement between tbe linear theory of reference 2 and experiment, a8 indicated by the data of thfe f igure, ie 8een t o be reasonably good ath the following exceptions:
1. A t the lowest Reynolds number 0.481 X lo6, the ~ ~ U l t s indicate that laminar eepra t ion OCCUTE, eince the experimental .pressure distributions ahow no recovery of pressure over the mar portion of the a l r f o l l .
2. At the hi@r Reynolds nmbers, lam- separa- t ion does n o t o ~ c u r and the agreement between theory and exgeriment i e good except within the z m e of action of the subeonic trailing edge.
The occurrence of hmimx sepazaticm a t the lomet Reynold8 rider is in agreement with the resul ts of previous investi@tisne in thie Reynold8 number range. Visual observations of t h e pressure-measuring mmameters during the tests ahared that laminar eepmation existed an the a i r f o i l at ~ e y n o l d s numbere of 1 x lo6 o r lees. ~e this v d u e was exceeded, the character of the flm over the rear portion of the air- foil changed abrtrptly, showing a marked increaee in preesure and

10 NACA RM No. A8C22
Indicating that the boundary-layer flow had become turbulent, enabling the flow t o c l ing to t h e surface.
A t the higher Reynolds numbers, where laminar separation does not occur, the agreement betneen theoretical and eqerlmental preesure distribution8 is poor over the portion of the a i r f o i l which lies w i t h i n the Mach cone of t he t r a i l i ng edge. The region influenced by the subsonic t r a i l i ng edge is found, from the experimental pressure distributions, to be smaller than given by the l i n e a theory. This difference results from t he fac t tha t , in the linear theory, pressure dfsturbances a r e propagated dong Mach Iices. In actuality, since the loca l Mach numbers over the airfoil are appreciably different from that of the stream, weak pressure dietwbances are propagated along curved lines, which may be defined as having such curvature that the velocity normal t o the tangent t o the l fne a t any point ie sonic. Since the linear theory permits the calculation of the local Mach numbers on the surface of the a i r foi l , the l i ne which denotes .Ule influence of the t r a i l i ng e- may be calculated as
. . "
"
where M l e the local Mach nlzniber from'linear theory. (.The origin is placed at the t r a i l i ng edge of the root with the positive XfLxi~ extendin@; downstream. ) Figure 6 shows the agreement between t h e line denoting the foremost Influence of t h e trailing edge so computed and the region of influence detemnined frm the experimental pressure distribution and the liquid-film photographs diecussed later. A compwison between the linear theory, revised cmputationa, and expqi- ment shows that the extension of the camputatlone account for the discregamy between the linear theory and experiment. The results a9 the extended computations are shown as dotted lines In figure 5.
I "
It is in-t;eresting t o no te that equation (1) may be applied to the estimation of the supersonic Mach number f o r which the outboard. sections of a swept w i n g of high aspect ratio may experience . the aarm cmpressibi l i ty shock phenamena which, in $he paet, have been associ- ated w f t h the c r i t i c a l subsonic Mach number of unawept- wings. In this regard, the c r i t i c a l supersonic Mch number f o r a swept wing is that Mach number for which equation (1) gives a line which lies along any comtant percent chord line of the wlng. For this Mach number, the component of the flow.velocity peqendicular to the constant percent chord line I s sonic. Mach numbers in excess of this value
r e su l t in significant changes in flow C m C t e r i s t i C s .

RACA BM No. A&= 11
Emmination of the data of f igure 5 s h m Wt the grrtaual pressure recovery predicted b;g the Unem theory f o r the region bfluenced by the trailing edge does not occur, but, instead, a lare portion of the presaure increase cakes place through wbt seem t o be a shock wave. 5 existence of a f bite shock wave is t o be expected here f o r the same mas0118 ae those dfscuesed by Riemann (reference 6 ) in cannection with one-dimenaicmal 130x8, namely, that the change of the loo& speed of sound in a ccmpressim wa-ve permits the portion of the mve subject to cmpression t o t rave l at a faster rate t2mn the portion subject t o expmion, thereby steepen- the mve into a compression hock. No method is available wbich will permit the steepening of the cmpreasim regions to be calculated for this air- f o i l .
The failure of the linear theory to predict the location of the pressure minimum and the character of the cmpression behind tihe pressure minimum is significant lnsofar as the pressure drag af the a i r f o i l is concerned. Figure 7 aplms the spanwise vaxiation of section-wave drag coefficient detemtned by integrating the preseuree over the a i r fo i l . Good agreement with theory le found on the inboard portion of the a i r f o i l span but apprecfably greater section drag coefficients OCCUT at the outkoard aectfms. These data fndicate that the t a w wave drag of t he a i r fo i l is 36 percent greater than predicted by lfnear theory. Ths percentage will be scanawhat greater
w h a t less for lower aspect ratios. The increase in drag over that predFcted by l k e a r theory will be less f o r smaller thickneea ratios.
r for airfoils of hieJler aspect ra t io with the same section and same-
-
Use w a s =de of the liquid-film technique, which haa been diSCUS8ed fdu in rekerence 5 , to invest igate the character of the 10-y- layer flow. This method of visualizing the bomdarplayer flow makes use of the fact that the rate of m a p r a t i o n of a vola t i le liqu3d from the surface of the a l r f o i l i~ a function of the surface shearing stress. Since the shear i n the region of the turbulent boundary lager is, in general, much higher than for the lamkmr boundary layer, the surface of the airfoil behind the point of t r a m i t i o n from laminar to turbulent flow i n the boundary layer will becoma dry before the region ahead of the transition point, the ueas subject to lami- and turbulent f l o w thereby being defined.

12 NACA I34 No. A&22
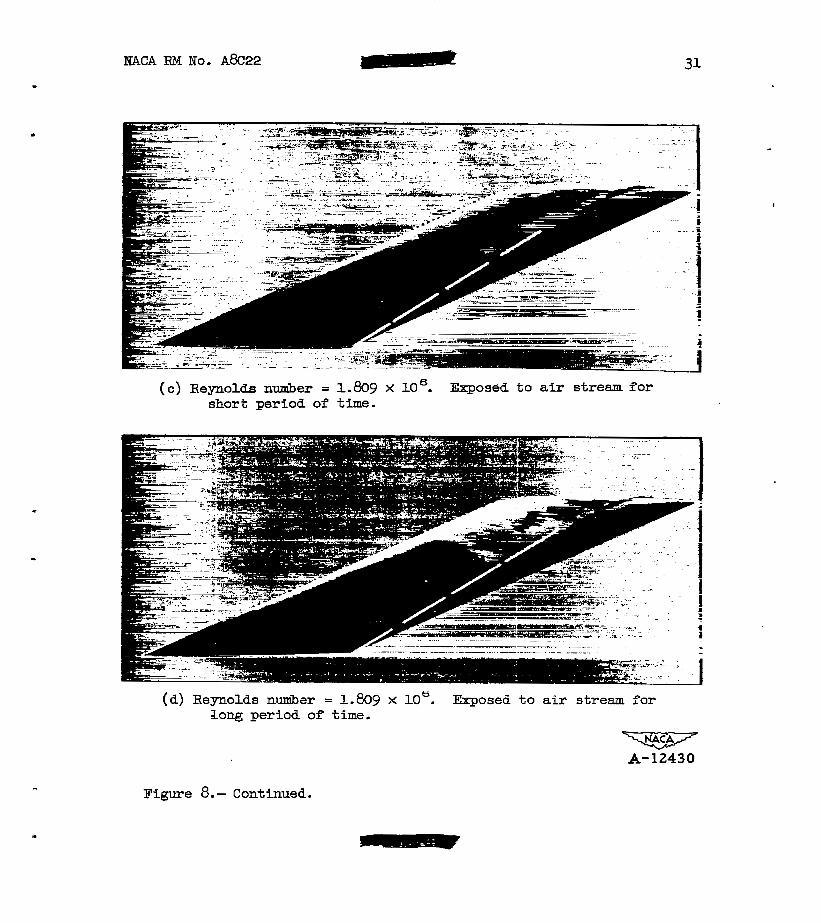
Figure 8 -shows photogra@a of the Liquid film at three t e e t Reynolde numbers. dur;ing tunnel opemt1on.l The a i r f o i l shown on the top aotograph has been axposed t o the air stream a shorter time than t h e one at the bottom. The results of theee studies show that, at the lowest Reynolds number, t h e surface shear l a relatively 6 n d X over the airfoil surface except near the leading edge where high
previously showed tha t laminar sep ra t ion occurred a t th i s Reynolds number 80 that f t is t o be expected that the surface shear would be small. Usually, the occurrence of laminar separation reeults in t h e formation of a ridge of f lu id a t the eeparatlon point. The present t e s t s do not show this fienomenon, possibly becawe the aurface tension of the l iquid film is great enough, In comprieon w i t h the viscous forces of the a i r stream (at the necessary low test pressure), t o prevent the ridge from being f o m & .
, laminar shear exiets. The pressire-dlstributim t e s t diecmsed
At the higher Reynolds nunibera, the liquid film has c a p l e t e l y evaporated i n the region just ahead of the trailing edge after a short period of'exposure of the airfoi l surface t o the stream. The liquid-f ilm studies of f igure 8 show that transrltion - t o turbulent flow i a occurring on the a i r f o i l ahead of the location of the axperl- mental minimum pE'easuFe p i n t shdm By the dashed line.2 In thie see, the boundary layer has sufficient- energy to enable it t-o flow some distance against t31e adverse pressure gradient over the rear of the a i r f o i l s o that the sepra t ion , nox turbulent, is confined.to the region near the t r a i l i ng edge indtcatea by the extreme cross flow.
t
"
The liquid-film photographs a t %he highest Reynolds numbers show * that the l o c a t i o n of the transition point move! ferward rapidly with increasing Reynolds number in spi te of the f a c t that the pressure gradient I s favorable t o lam- flow, much more ra$ldly, in fact , than f o r a corresponding Reynolds number range at subeonic Mach numbers. Whether thia fs due t o the turbulence of the wind-tunnel air stream or other outside cau8e8, o r uhether this fer an emential character- i s t i c o f . the boundary layer a t supersonic speed, $8 not *known. T¶Ie surface of the model was very smoot€i and free fr? waves s o that no surf'ace roughness effects w e r e ' present. Fmther research directed toward investi@tion .of these boundary-layer characterist ics is indicated, including the e f fec t o f ' curvature of the surface.
'The photographs shown .have been retouched t o pre8erve t h e definition of t h e liquid-f ilm pattern .u s" ly lost in the -reproduction proceae .
%e dashed l fne was determined frm faire'd prcsssure-d~stributian d a - t ; a . and agrees well w i t h the loca t fon of the pressure minFmum shown by the sudden bexding of liquid-film streamers.

1. The region of fnfluence of t h e sub60nio traUing -0- i g shmed rearward. This ef fec t can be calculated from considemtion of the local W h rimer on the a i r f o i l surface.
2. The peasure recoverg behind the preseure rd2dm-m l a greater than pedic ted by theory and, although the data are not conclwive, amears to t&e.place, in part, through a ahock wave. +
The net result of them effects. ts an increase Fn the pressure coefffcient over that given-by linear theory.
Arms8 Aeronautical Uboratorg, National Adv-lsory Committee far Aeronautics,
Wff6tt Field, Calif.
1. Ackeret, 3.; A f r Forces onBf r fo i l a kving Faster Than Sound. NclCA TM No. 317, 1925.
2. Jones, Robert T. : Thin Oblique Air fo i l6 at Supersonic Speed. iQlCA TET No. U O 7 , 1946.
3 . Puckett, Allen E. : Stqersonic Wave D m of Thin Airfoils. Jour. Aero. Sci . , vol. 13, m . 9, Sept . &, pp. 4'#!&.
,

14 W A RM No. A8C22
4. V m Dyke, Milton D. : Aerodynamic Chasacteristics Including Bcde Effect of Several Wings and Bodies Alone and in Combination at a Mach Humber of 1.53. nACA RM mo. A6IC22, 1946.
5 . Vincenti, Walter G . , Bieleen, Jack N., and Matteeon, Frederick H.: Inves t ie t ion of Wing Charactariatics at a Mach Number of 1.53. I - IIl.hn@;ular Wings of Aspect Rat io 2. mACA Rh5 Bo. A7R.0, 1947

HACA RM No. A8C22 - .
Figure 1.- Siretch of airfoil mounted for t es t . v A- 12342 - c

NACA RM No. ~ 8 ~ 2 2
A-A
i Figure 2.- Sketch of mode/ support system

18
r 0 2 - 6 5 4 i
S€CT/ON A - A
- NACA RPI No. A8C22
J 3"- 1 s
4 0 0 0 Q .420
- .320"
lP8/"
"""_ Pressure survey stations
Figure 3. - Dimensiond sketch of mode/ showing pressure
survey sfations

. . . . . . .
I
-.08
0
Distance downstream fmm fhe test section stotic
. pressure orifice, inches
(a) 25 - percent of mode/ span from root.
Figure 4.- Axial static pressure variation in wind-tunnel stream.
0 G
0 0 2 4 6 8 IO 12 14 I6
Distance downsfteam from the test-secf lon static
pressure orifice, inches.
(b) 50-percent model span from roof.
Figure 4. - Confmued.
. . . .- . .
N 0
. . . .. . . .. . . .

. . . . . . .
Distance downstream from the test-section static
pressure orlflce, inches
(c) 75- percent model span from root ,
Figure 4.- Concluded.
. .
b

. .
0 10 20 30 40 50 60 70 80 90 IO0
Percent of chord
(0,) . Sfofion 6.4-percent semispan. Figure 5.- .Chordwise pressure distribuflon over swept-back atrfo/l at
zero lift. - . . .
.

. .. . - P o Re =.48IxlO6 Linear theory - , - E A R e 4 8 5 0 x I O 6 Revised theory ----- 3
I. 1 I I I I I F
(4 Station 25.6-percent semispan.
Figure 5.- Contlnued.
'0
. . .
I
G
. . .. .

(c) 51.24 -percent sem1span.
Figure 5,- continued.
. .

. . ..
I , .. . .
"
Q Re =.48tx106
A Re = /.85OxtO6 0
Re r3.246~ to6 \
- \
1 1 1 1 1 1 1 Lfnear theory.- Revised theory ----- Flog symbols denote tower surface -
"""-
1 I l 0 20 30 40 50 60 70 80 90 IO0
PerceM of chwd
(dl 76.86-percenf samispan.
Figurn 5.- Conflnued.
- 1
" . . . . . -

Percmt of chord
(el 9 7.5-percent semispan.
Figure 5.- Conduded. - .

c
Roof Mach h e Foremost effect of frui'/ing edgs
/ /
/ /
T Linear tbeory ----- Revised ca/culafion - - - A p p r o x m o f 8 experhento / o
/mat ion o f pressure minimum.
Figure 6- Comparison o f region o f influence o f fraiiing
edge and tip from experlinen f, linear theory, and revised linear theory -

. .
1 I
0 / O 20 30 40 50 60 70 80 90 !OO
Fipura T-Spanwise wriation o f section pressure drag coefficient for t h e
swept-bock airfoil. - .
. . . .

NACA RM No. A m 2
c
( 8 ) Remolds nrnnber = 0.905 X lo8. Exposed t o alr stream for short period of time.
( b ) Reynolds nuniber = 0.905 x loe. Exposed to air stream for lonq period of tims.
-E27 A- 12429
Figure 8.- Photographs of l iquid fllm. M = 1-33.

NACA m No. A8c22
.
I
( c ) Reynolds nuniber = 1.809 x I O 6 . Exposed to air stream for short period of time.
(a) Reynolds nmibsr = 1.809 x loe. Exposed to air stream for l ong period of t i m e .
-E7 A-12430
Ffgure 8.- Continued.


M C A RM No. A&22 33
L
(e ) . Reynolds nmiber = 3.166 x I O 6 . ‘Exposed t o a t r stream for short period of time.
(f) Reynolds number = 3.166 X los. Exposed to alr stream for long period of time.
-5-57 A-1243 1
Ffgure 8.- Concluded.

C