
RESEARCH EXCELLENCE FRAMEWORK 2014: … · 3 Allied health professions, Dentistry, Nursing and...
40
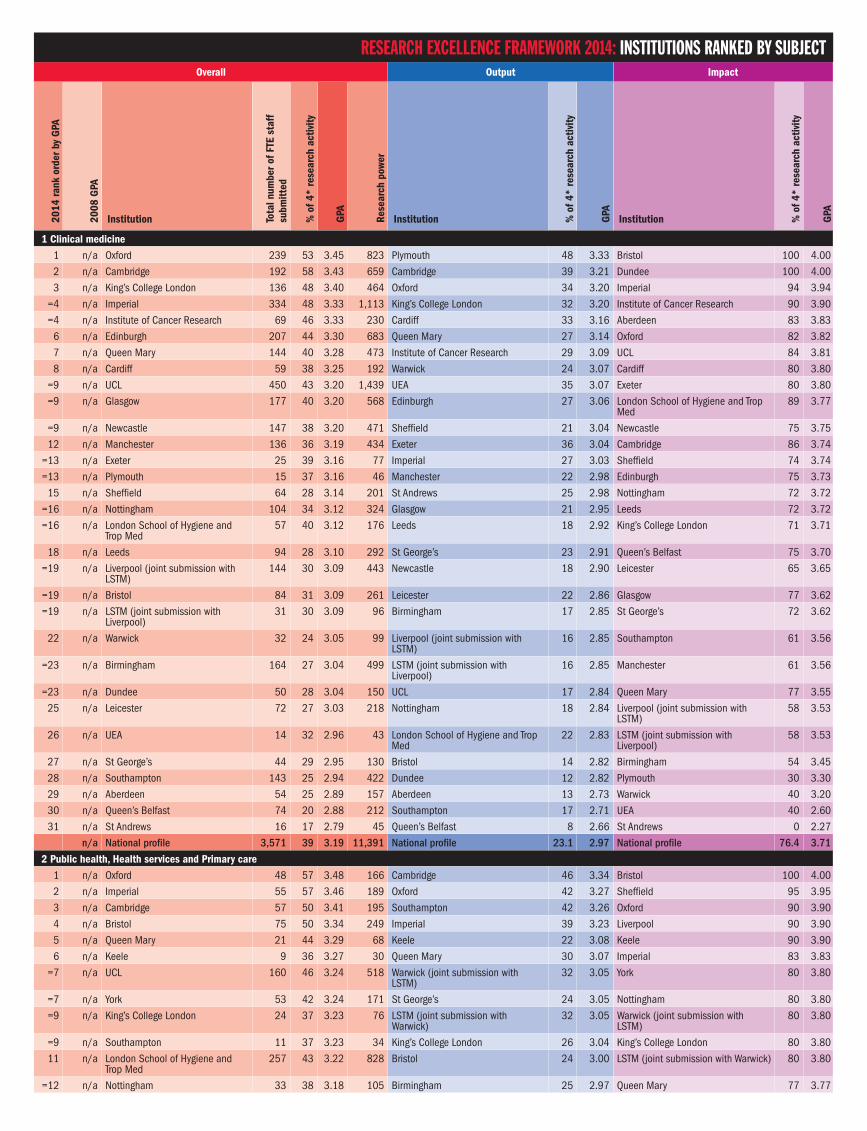
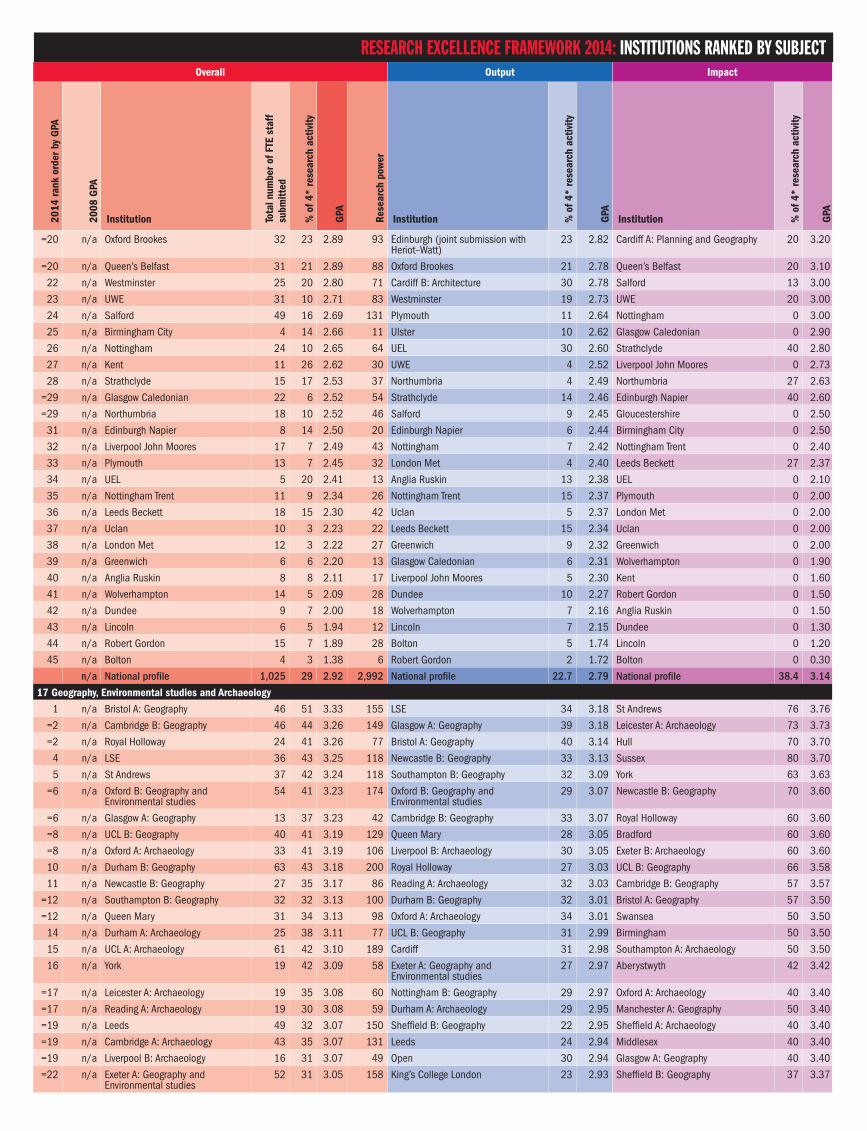
Overall Output Impact 2014 rank order by GPA 2008 GPA Institution Total number of FTE staff submitted % of 4* research activity GPA Research power Institution % of 4* research activity GPA Institution % of 4* research activity GPA 1 Clinical medicine 1 n/a Oxford 239 53 3.45 823 Plymouth 48 3.33 Bristol 100 4.00 2 n/a Cambridge 192 58 3.43 659 Cambridge 39 3.21 Dundee 100 4.00 3 n/a King’s College London 136 48 3.40 464 Oxford 34 3.20 Imperial 94 3.94 =4 n/a Imperial 334 48 3.33 1,113 King’s College London 32 3.20 Institute of Cancer Research 90 3.90 =4 n/a Institute of Cancer Research 69 46 3.33 230 Cardiff 33 3.16 Aberdeen 83 3.83 6 n/a Edinburgh 207 44 3.30 683 Queen Mary 27 3.14 Oxford 82 3.82 7 n/a Queen Mary 144 40 3.28 473 Institute of Cancer Research 29 3.09 UCL 84 3.81 8 n/a Cardiff 59 38 3.25 192 Warwick 24 3.07 Cardiff 80 3.80 =9 n/a UCL 450 43 3.20 1,439 UEA 35 3.07 Exeter 80 3.80 =9 n/a Glasgow 177 40 3.20 568 Edinburgh 27 3.06 London School of Hygiene and Trop Med 89 3.77 =9 n/a Newcastle 147 38 3.20 471 Sheffield 21 3.04 Newcastle 75 3.75 12 n/a Manchester 136 36 3.19 434 Exeter 36 3.04 Cambridge 86 3.74 =13 n/a Exeter 25 39 3.16 77 Imperial 27 3.03 Sheffield 74 3.74 =13 n/a Plymouth 15 37 3.16 46 Manchester 22 2.98 Edinburgh 75 3.73 15 n/a Sheffield 64 28 3.14 201 St Andrews 25 2.98 Nottingham 72 3.72 =16 n/a Nottingham 104 34 3.12 324 Glasgow 21 2.95 Leeds 72 3.72 =16 n/a London School of Hygiene and Trop Med 57 40 3.12 176 Leeds 18 2.92 King’s College London 71 3.71 18 n/a Leeds 94 28 3.10 292 St George’s 23 2.91 Queen’s Belfast 75 3.70 =19 n/a Liverpool (joint submission with LSTM) 144 30 3.09 443 Newcastle 18 2.90 Leicester 65 3.65 =19 n/a Bristol 84 31 3.09 261 Leicester 22 2.86 Glasgow 77 3.62 =19 n/a LSTM (joint submission with Liverpool) 31 30 3.09 96 Birmingham 17 2.85 St George’s 72 3.62 22 n/a Warwick 32 24 3.05 99 Liverpool (joint submission with LSTM) 16 2.85 Southampton 61 3.56 =23 n/a Birmingham 164 27 3.04 499 LSTM (joint submission with Liverpool) 16 2.85 Manchester 61 3.56 =23 n/a Dundee 50 28 3.04 150 UCL 17 2.84 Queen Mary 77 3.55 25 n/a Leicester 72 27 3.03 218 Nottingham 18 2.84 Liverpool (joint submission with LSTM) 58 3.53 26 n/a UEA 14 32 2.96 43 London School of Hygiene and Trop Med 22 2.83 LSTM (joint submission with Liverpool) 58 3.53 27 n/a St George’s 44 29 2.95 130 Bristol 14 2.82 Birmingham 54 3.45 28 n/a Southampton 143 25 2.94 422 Dundee 12 2.82 Plymouth 30 3.30 29 n/a Aberdeen 54 25 2.89 157 Aberdeen 13 2.73 Warwick 40 3.20 30 n/a Queen’s Belfast 74 20 2.88 212 Southampton 17 2.71 UEA 40 2.60 31 n/a St Andrews 16 17 2.79 45 Queen’s Belfast 8 2.66 St Andrews 0 2.27 n/a National profile 3,571 39 3.19 11,391 National profile 23.1 2.97 National profile 76.4 3.71 2 Public health, Health services and Primary care 1 n/a Oxford 48 57 3.48 166 Cambridge 46 3.34 Bristol 100 4.00 2 n/a Imperial 55 57 3.46 189 Oxford 42 3.27 Sheffield 95 3.95 3 n/a Cambridge 57 50 3.41 195 Southampton 42 3.26 Oxford 90 3.90 4 n/a Bristol 75 50 3.34 249 Imperial 39 3.23 Liverpool 90 3.90 5 n/a Queen Mary 21 44 3.29 68 Keele 22 3.08 Keele 90 3.90 6 n/a Keele 9 36 3.27 30 Queen Mary 30 3.07 Imperial 83 3.83 =7 n/a UCL 160 46 3.24 518 Warwick (joint submission with LSTM) 32 3.05 York 80 3.80 =7 n/a York 53 42 3.24 171 St George’s 24 3.05 Nottingham 80 3.80 =9 n/a King’s College London 24 37 3.23 76 LSTM (joint submission with Warwick) 32 3.05 Warwick (joint submission with LSTM) 80 3.80 =9 n/a Southampton 11 37 3.23 34 King’s College London 26 3.04 King’s College London 80 3.80 11 n/a London School of Hygiene and Trop Med 257 43 3.22 828 Bristol 24 3.00 LSTM (joint submission with Warwick) 80 3.80 =12 n/a Nottingham 33 38 3.18 105 Birmingham 25 2.97 Queen Mary 77 3.77 RESEARCH EXCELLENCE FRAMEWORK 2014: INSTITUTIONS RANKED BY SUBJECT
Transcript of RESEARCH EXCELLENCE FRAMEWORK 2014: … · 3 Allied health professions, Dentistry, Nursing and...
Overall Output Impact
2014
rank
ord
er b
y G
PA
2008
GPA
Institution Tota
l num
ber o
f FTE
sta
ff
subm
itted
% o
f 4*
rese
arch
act
ivity
GPA
Rese
arch
pow
er
Institution % o
f 4*
rese
arch
act
ivity
GPA
Institution % o
f 4*
rese
arch
act
ivity
GPA
1 Clinical medicine1 n/a Oxford 239 53 3.45 823 Plymouth 48 3.33 Bristol 100 4.00
2 n/a Cambridge 192 58 3.43 659 Cambridge 39 3.21 Dundee 100 4.00
3 n/a King’s College London 136 48 3.40 464 Oxford 34 3.20 Imperial 94 3.94
=4 n/a Imperial 334 48 3.33 1,113 King’s College London 32 3.20 Institute of Cancer Research 90 3.90
=4 n/a Institute of Cancer Research 69 46 3.33 230 Cardiff 33 3.16 Aberdeen 83 3.83
6 n/a Edinburgh 207 44 3.30 683 Queen Mary 27 3.14 Oxford 82 3.82
7 n/a Queen Mary 144 40 3.28 473 Institute of Cancer Research 29 3.09 UCL 84 3.81
8 n/a Cardiff 59 38 3.25 192 Warwick 24 3.07 Cardiff 80 3.80
=9 n/a UCL 450 43 3.20 1,439 UEA 35 3.07 Exeter 80 3.80
=9 n/a Glasgow 177 40 3.20 568 Edinburgh 27 3.06 London School of Hygiene and Trop Med
89 3.77
=9 n/a Newcastle 147 38 3.20 471 Sheffield 21 3.04 Newcastle 75 3.75
12 n/a Manchester 136 36 3.19 434 Exeter 36 3.04 Cambridge 86 3.74
=13 n/a Exeter 25 39 3.16 77 Imperial 27 3.03 Sheffield 74 3.74
=13 n/a Plymouth 15 37 3.16 46 Manchester 22 2.98 Edinburgh 75 3.73
15 n/a Sheffield 64 28 3.14 201 St Andrews 25 2.98 Nottingham 72 3.72
=16 n/a Nottingham 104 34 3.12 324 Glasgow 21 2.95 Leeds 72 3.72
=16 n/a London School of Hygiene and Trop Med
57 40 3.12 176 Leeds 18 2.92 King’s College London 71 3.71
18 n/a Leeds 94 28 3.10 292 St George’s 23 2.91 Queen’s Belfast 75 3.70
=19 n/a Liverpool (joint submission with LSTM)
144 30 3.09 443 Newcastle 18 2.90 Leicester 65 3.65
=19 n/a Bristol 84 31 3.09 261 Leicester 22 2.86 Glasgow 77 3.62
=19 n/a LSTM (joint submission with Liverpool)
31 30 3.09 96 Birmingham 17 2.85 St George’s 72 3.62
22 n/a Warwick 32 24 3.05 99 Liverpool (joint submission with LSTM)
16 2.85 Southampton 61 3.56
=23 n/a Birmingham 164 27 3.04 499 LSTM (joint submission with Liverpool)
16 2.85 Manchester 61 3.56
=23 n/a Dundee 50 28 3.04 150 UCL 17 2.84 Queen Mary 77 3.55
25 n/a Leicester 72 27 3.03 218 Nottingham 18 2.84 Liverpool (joint submission with LSTM)
58 3.53
26 n/a UEA 14 32 2.96 43 London School of Hygiene and Trop Med
22 2.83 LSTM (joint submission with Liverpool)
58 3.53
27 n/a St George’s 44 29 2.95 130 Bristol 14 2.82 Birmingham 54 3.45
28 n/a Southampton 143 25 2.94 422 Dundee 12 2.82 Plymouth 30 3.30
29 n/a Aberdeen 54 25 2.89 157 Aberdeen 13 2.73 Warwick 40 3.20
30 n/a Queen’s Belfast 74 20 2.88 212 Southampton 17 2.71 UEA 40 2.60
31 n/a St Andrews 16 17 2.79 45 Queen’s Belfast 8 2.66 St Andrews 0 2.27
n/a National profile 3,571 39 3.19 11,391 National profile 23.1 2.97 National profile 76.4 3.71 2 Public health, Health services and Primary care
1 n/a Oxford 48 57 3.48 166 Cambridge 46 3.34 Bristol 100 4.00
2 n/a Imperial 55 57 3.46 189 Oxford 42 3.27 Sheffield 95 3.95
3 n/a Cambridge 57 50 3.41 195 Southampton 42 3.26 Oxford 90 3.90
4 n/a Bristol 75 50 3.34 249 Imperial 39 3.23 Liverpool 90 3.90
5 n/a Queen Mary 21 44 3.29 68 Keele 22 3.08 Keele 90 3.90
6 n/a Keele 9 36 3.27 30 Queen Mary 30 3.07 Imperial 83 3.83
=7 n/a UCL 160 46 3.24 518 Warwick (joint submission with LSTM)
32 3.05 York 80 3.80
=7 n/a York 53 42 3.24 171 St George’s 24 3.05 Nottingham 80 3.80
=9 n/a King’s College London 24 37 3.23 76 LSTM (joint submission with Warwick)
32 3.05 Warwick (joint submission with LSTM)
80 3.80
=9 n/a Southampton 11 37 3.23 34 King’s College London 26 3.04 King’s College London 80 3.80
11 n/a London School of Hygiene and Trop Med
257 43 3.22 828 Bristol 24 3.00 LSTM (joint submission with Warwick) 80 3.80
=12 n/a Nottingham 33 38 3.18 105 Birmingham 25 2.97 Queen Mary 77 3.77
RESEARCH EXCELLENCE FRAMEWORK 2014: INSTITUTIONS RANKED BY SUBJECT
RESEARCH EXCELLENCE FRAMEWORK 2014: INSTITUTIONS RANKED BY SUBJECTOverall Output Impact
2014
rank
ord
er b
y G
PA
2008
GPA
Institution Tota
l num
ber o
f FTE
sta
ff
subm
itted
% o
f 4*
rese
arch
act
ivity
GPA
Rese
arch
pow
er
Institution % o
f 4*
rese
arch
act
ivity
GPA
Institution % o
f 4*
rese
arch
act
ivity
GPA
=12 n/a Warwick (joint submission with LSTM)
31 39 3.18 98 Leeds 23 2.95 UCL 79 3.74
=12 n/a LSTM (joint submission with Warwick)
4 39 3.18 13 UEA 18 2.95 London School of Hygiene and Trop Med
76 3.73
=15 n/a Aberdeen 48 34 3.15 150 Aberdeen 20 2.94 St George’s 80 3.70 =15 n/a St George’s 12 32 3.15 36 Cardiff 25 2.93 Leicester 67 3.67
17 n/a Leicester 24 36 3.14 76 UCL 23 2.91 Brunel 60 3.60 =18 n/a Birmingham 45 30 3.12 139 Exeter 17 2.91 Birmingham 58 3.58 =18 n/a Leeds 26 32 3.12 82 Nottingham 22 2.90 Aberdeen 67 3.53
20 n/a Cardiff 24 37 3.11 76 York 17 2.89 Dundee 53 3.53 21 n/a Exeter 25 25 3.09 77 Leicester 23 2.89 UEA 50 3.50 22 n/a UEA 14 22 3.07 43 London School of Hygiene and Trop
Med 19 2.86 Southampton 50 3.50
23 n/a Liverpool 31 38 3.04 95 Glasgow 14 2.80 Newcastle 40 3.40 24 n/a Glasgow 48 25 3.03 147 Dundee 21 2.74 Leeds 50 3.40 25 n/a Sheffield 74 38 3.02 224 Queen’s Belfast 15 2.73 Exeter 40 3.40 26 n/a Newcastle 27 25 2.97 81 Newcastle 14 2.72 Cardiff 63 3.37 27 n/a Queen’s Belfast 30 23 2.89 86 Liverpool 19 2.67 Glasgow 33 3.33 28 n/a Dundee 16 24 2.87 46 Manchester 14 2.66 Cambridge 29 3.23 29 n/a Manchester 33 17 2.78 93 Sheffield 12 2.56 Queen’s Belfast 20 2.90 30 n/a Brunel 10 20 2.77 29 Brunel 10 2.45 Portsmouth 10 2.90 31 n/a Portsmouth 8 2 2.33 19 Portsmouth 0 2.19 Manchester 10 2.70 32 n/a Leeds Beckett 23 1 1.76 40 Leeds Beckett 1 1.65 Leeds Beckett 0 2.50
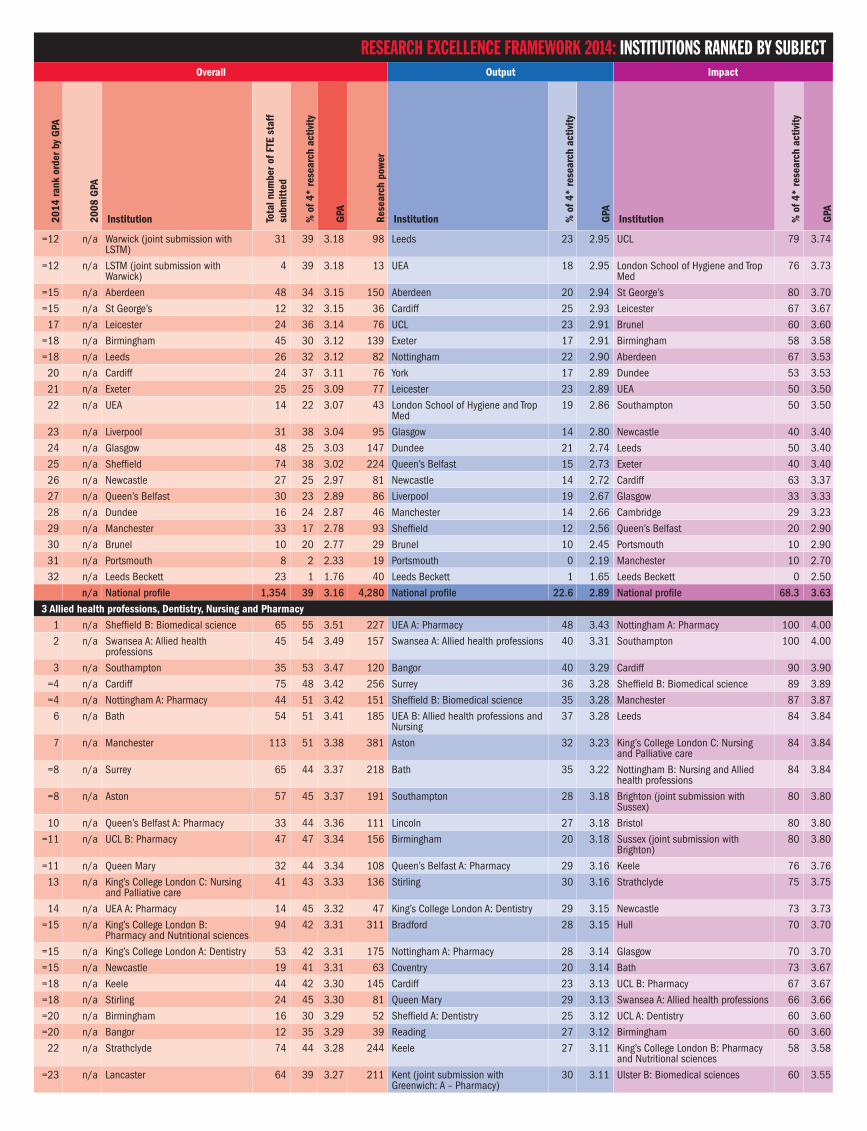
n/a National profile 1,354 39 3.16 4,280 National profile 22.6 2.89 National profile 68.3 3.63 3 Allied health professions, Dentistry, Nursing and Pharmacy
1 n/a Sheffield B: Biomedical science 65 55 3.51 227 UEA A: Pharmacy 48 3.43 Nottingham A: Pharmacy 100 4.00 2 n/a Swansea A: Allied health
professions 45 54 3.49 157 Swansea A: Allied health professions 40 3.31 Southampton 100 4.00
3 n/a Southampton 35 53 3.47 120 Bangor 40 3.29 Cardiff 90 3.90 =4 n/a Cardiff 75 48 3.42 256 Surrey 36 3.28 Sheffield B: Biomedical science 89 3.89 =4 n/a Nottingham A: Pharmacy 44 51 3.42 151 Sheffield B: Biomedical science 35 3.28 Manchester 87 3.87
6 n/a Bath 54 51 3.41 185 UEA B: Allied health professions and Nursing
37 3.28 Leeds 84 3.84
7 n/a Manchester 113 51 3.38 381 Aston 32 3.23 King’s College London C: Nursing and Palliative care
84 3.84
=8 n/a Surrey 65 44 3.37 218 Bath 35 3.22 Nottingham B: Nursing and Allied health professions
84 3.84
=8 n/a Aston 57 45 3.37 191 Southampton 28 3.18 Brighton (joint submission with Sussex)
80 3.80
10 n/a Queen’s Belfast A: Pharmacy 33 44 3.36 111 Lincoln 27 3.18 Bristol 80 3.80 =11 n/a UCL B: Pharmacy 47 47 3.34 156 Birmingham 20 3.18 Sussex (joint submission with
Brighton)80 3.80
=11 n/a Queen Mary 32 44 3.34 108 Queen’s Belfast A: Pharmacy 29 3.16 Keele 76 3.76 13 n/a King’s College London C: Nursing
and Palliative care 41 43 3.33 136 Stirling 30 3.16 Strathclyde 75 3.75
14 n/a UEA A: Pharmacy 14 45 3.32 47 King’s College London A: Dentistry 29 3.15 Newcastle 73 3.73 =15 n/a King’s College London B:
Pharmacy and Nutritional sciences 94 42 3.31 311 Bradford 28 3.15 Hull 70 3.70
=15 n/a King’s College London A: Dentistry 53 42 3.31 175 Nottingham A: Pharmacy 28 3.14 Glasgow 70 3.70 =15 n/a Newcastle 19 41 3.31 63 Coventry 20 3.14 Bath 73 3.67 =18 n/a Keele 44 42 3.30 145 Cardiff 23 3.13 UCL B: Pharmacy 67 3.67 =18 n/a Stirling 24 45 3.30 81 Queen Mary 29 3.13 Swansea A: Allied health professions 66 3.66 =20 n/a Birmingham 16 30 3.29 52 Sheffield A: Dentistry 25 3.12 UCL A: Dentistry 60 3.60 =20 n/a Bangor 12 35 3.29 39 Reading 27 3.12 Birmingham 60 3.60
22 n/a Strathclyde 74 44 3.28 244 Keele 27 3.11 King’s College London B: Pharmacy and Nutritional sciences
58 3.58
=23 n/a Lancaster 64 39 3.27 211 Kent (joint submission with Greenwich: A – Pharmacy)
30 3.11 Ulster B: Biomedical sciences 60 3.55
Overall Output Impact
2014
rank
ord
er b
y G
PA
2008
GPA
Institution Tota
l num
ber o
f FTE
sta
ff
subm
itted
% o
f 4*
rese
arch
act
ivity
GPA
Rese
arch
pow
er
Institution % o
f 4*
rese
arch
act
ivity
GPA
Institution % o
f 4*
rese
arch
act
ivity
GPA
=23 n/a Leeds 44 37 3.27 145 Greenwich A: Pharmacy (joint submission with Kent)
30 3.11 City 55 3.55
25 n/a UEA B: Allied health professions and Nursing
14 34 3.26 46 King’s College London B: Pharmacy and Nutritional sciences
26 3.09 Surrey 66 3.54
26 n/a Ulster B: Biomedical sciences 74 39 3.24 240 Lancaster 26 3.09 Bedfordshire 53 3.53
=27 n/a Bradford 44 30 3.22 142 King’s College London C: Nursing and Palliative care
26 3.09 Nottingham Trent 53 3.53
=27 n/a Nottingham B: Nursing and Allied health professions
38 38 3.22 122 Glasgow 24 3.09 Northumbria 60 3.52
=29 n/a Sheffield A: Dentistry 33 30 3.21 107 Manchester 29 3.08 Aston 56 3.50
=29 n/a Glasgow 14 30 3.21 44 UCL B: Pharmacy 29 3.08 Queen’s Belfast A: Pharmacy 50 3.50
31 n/a Bristol 16 43 3.20 52 Leeds 23 3.07 Queen Mary 50 3.50
=32 n/a Brighton (joint submission with Sussex)
23 38 3.17 71 Nottingham Trent 26 3.07 Hertfordshire B: Allied health professions and Nursing
50 3.50
=32 n/a Sussex (joint submission with Brighton)
5 38 3.17 16 Roehampton 22 3.06 Glasgow Caledonian 48 3.48
=34 n/a Hull 34 31 3.16 108 UEL 24 3.05 UWE 53 3.47
=34 n/a Nottingham Trent 24 30 3.16 75 Newcastle 18 3.03 Portsmouth 47 3.47
36 n/a Coventry 18 20 3.14 55 Portsmouth 20 3.02 Manchester Met 46 3.46
37 n/a UCL A: Dentistry 34 29 3.13 107 Glasgow Caledonian 20 3.00 King’s College London A: Dentistry 50 3.43
=38 n/a Northumbria 44 31 3.12 138 Strathclyde 22 2.97 Dundee 40 3.40
=38 n/a Portsmouth 24 24 3.12 74 Ulster B: Biomedical sciences 19 2.97 UEA B: Allied health professions and Nursing
40 3.40
=40 n/a Glasgow Caledonian 44 24 3.11 138 Open 22 2.97 Bradford 32 3.32
=40 n/a Lincoln 19 25 3.11 60 Hull 18 2.96 Oxford Brookes 40 3.30
42 n/a Dundee 22 24 3.07 69 Bristol 30 2.94 Lancaster 34 3.29
=43 n/a City 68 28 3.06 207 Oxford Brookes 15 2.94 Stirling 53 3.27
=43 n/a UWE 45 28 3.06 139 UCL A: Dentistry 17 2.93 Teesside 27 3.27
45 n/a UEL 15 19 3.05 45 Northumbria 18 2.91 Robert Gordon (joint submission with UHI)
27 3.27
46 n/a Ulster A: Nursing and Health science
32 23 3.04 98 Nottingham B: Nursing and Allied health professions
15 2.89 UHI (joint submission with Robert Gordon)
27 3.27
47 n/a Hertfordshire B: Allied health professions and Nursing
14 24 2.99 42 Ulster A: Nursing and Health science 17 2.89 Sheffield A: Dentistry 20 3.20
48 n/a Reading 23 17 2.98 69 Kingston 15 2.89 Ulster A: Nursing and Health science 20 3.20
49 n/a Oxford Brookes 10 18 2.96 30 Cardiff Met 11 2.89 UEL 20 3.20
=50 n/a Bedfordshire 25 24 2.92 73 Dundee 13 2.88 Swansea B: Nursing 20 3.20
=50 n/a Open 17 16 2.92 50 South Wales 25 2.88 Birmingham City 20 3.20
=50 n/a Anglia Ruskin 11 10 2.92 33 Queen’s Belfast B: Nursing and Midwifery
18 2.87 Bangor 20 3.20
53 n/a Queen’s Belfast B: Nursing and Midwifery
19 13 2.91 55 Bedfordshire 21 2.85 Anglia Ruskin 20 3.20
=54 n/a Kent (joint submission with Greenwich A: Pharmacy)
16 23 2.90 47 Swansea B: Nursing 8 2.83 Huddersfield 20 3.20
=54 n/a Greenwich A: Pharmacy (joint submission with Kent)
2 23 2.90 6 UWE 13 2.82 Lincoln 40 3.17
56 n/a Manchester Met 61 19 2.88 177 Wolverhampton 17 2.82 Westminster 13 3.13
=57 n/a Robert Gordon (joint submission with UHI)
14 17 2.85 38 Sheffield Hallam 17 2.82 De Montfort 40 3.10
=57 n/a Huddersfield 10 8 2.85 29 Edinburgh Napier 14 2.82 Open 10 3.10 =57 n/a Roehampton 10 14 2.85 29 Brighton (joint submission with
Sussex)13 2.81 Coventry 13 3.03
=57 n/a UHI (joint submission with Robert Gordon)
5 17 2.85 15 Hertfordshire A: Pharmacy and Pharmacology
16 2.81 Queen’s Belfast B: Nursing and Midwifery
0 3.00
61 n/a Swansea B: Nursing 14 9 2.84 40 Hertfordshire B: Allied health professions and Nursing
19 2.81 London South Bank 20 3.00
62 n/a Kingston 17 10 2.82 49 Anglia Ruskin 6 2.81 Edge Hill 20 3.00 63 n/a Sheffield Hallam 23 11 2.81 64 Sussex (joint submission with
Brighton)13 2.81 Uclan 23 2.90
RESEARCH EXCELLENCE FRAMEWORK 2014: INSTITUTIONS RANKED BY SUBJECT
Overall Output Impact
2014
rank
ord
er b
y G
PA
2008
GPA
Institution Tota
l num
ber o
f FTE
sta
ff
subm
itted
% o
f 4*
rese
arch
act
ivity
GPA
Rese
arch
pow
er
Institution % o
f 4*
rese
arch
act
ivity
GPA
Institution % o
f 4*
rese
arch
act
ivity
GPA
=64 n/a Hertfordshire A: Pharmacy and Pharmacology
18 10 2.79 51 City 15 2.80 Hertfordshire A: Pharmacy and Pharmacology
0 2.90
=64 n/a Cardiff Met 12 9 2.79 33 Greenwich B: Allied health professions and Nursing
8 2.80 Middlesex 20 2.90
66 n/a Teesside 16 12 2.77 44 Plymouth 18 2.77 UEA A: Pharmacy 40 2.90
=67 n/a Liverpool John Moores 35 10 2.75 95 Westminster 20 2.76 Canterbury Christ Church 0 2.90
=67 n/a Westminster 25 15 2.75 68 London Met 15 2.73 London Met 0 2.90
=67 n/a Middlesex 15 11 2.75 41 Huddersfield 5 2.73 Sheffield Hallam 0 2.87
70 n/a South Wales 7 16 2.68 20 London South Bank 8 2.72 Liverpool John Moores 10 2.80
=71 n/a London South Bank 15 9 2.67 39 Liverpool John Moores 13 2.70 Kingston 0 2.77
=71 n/a UWS 13 12 2.67 35 Middlesex 11 2.70 Salford 8 2.74
73 n/a Edinburgh Napier 22 9 2.65 59 Brunel 17 2.68 Bournemouth 0 2.63
=74 n/a Brunel 51 13 2.63 133 UWS 16 2.68 Brunel 13 2.60
=74 n/a Uclan 50 11 2.63 130 Robert Gordon (joint submission with UHI)
12 2.67 Roehampton 0 2.60
=74 n/a Salford 42 7 2.63 111 UHI (joint submission with Robert Gordon)
12 2.67 York St John 0 2.60
77 n/a Greenwich B: Allied health professions and Nursing
10 5 2.62 25 Manchester Met 9 2.65 Chester 13 2.57
=78 n/a Plymouth 35 14 2.58 90 Teesside 8 2.60 Sunderland 0 2.50
=78 n/a De Montfort 31 13 2.58 81 Uclan 10 2.57 Reading 0 2.50
80 n/a London Met 11 9 2.57 28 Salford 8 2.53 Greenwich B: Allied health professions and Nursing
0 2.50
=81 n/a Bournemouth 21 10 2.56 55 Bournemouth 16 2.53 West London 0 2.40
=81 n/a Canterbury Christ Church 14 6 2.56 36 Canterbury Christ Church 9 2.53 UWS 0 2.40
83 n/a Birmingham City 12 5 2.55 31 Sunderland 10 2.52 South Wales 0 2.40
=84 n/a Wolverhampton 31 11 2.54 80 De Montfort 8 2.48 Cardiff Met 0 2.30
=84 n/a Sunderland 25 7 2.54 62 Edge Hill 4 2.45 Queen Margaret 0 2.30
86 n/a Edge Hill 11 7 2.53 28 Queen Margaret 7 2.45 Edinburgh Napier 0 2.27
87 n/a Cumbria 3 7 2.50 8 Birmingham City 2 2.37 Bucks New 0 2.20
88 n/a Queen Margaret 8 4 2.41 20 Northampton 7 2.30 Kent (joint submission with Greenwich A: Pharmacy)
0 2.07
89 n/a Chester 23 3 2.29 53 West London 8 2.24 Greenwich A: Pharmacy (joint submission with Kent)
0 2.07
90 n/a West London 15 5 2.16 32 Chester 1 2.23 Plymouth 0 1.80
91 n/a Northampton 13 5 2.14 29 Worcester 3 2.21 Wolverhampton 0 1.70
92 n/a York St John 6 3 2.13 12 York St John 5 2.10 Northampton 0 1.60
93 n/a Worcester 11 2 2.00 22 Bucks New 3 2.03 Worcester 0 1.50
94 n/a Bucks New 7 2 1.96 14 Cumbria – – Cumbria – –
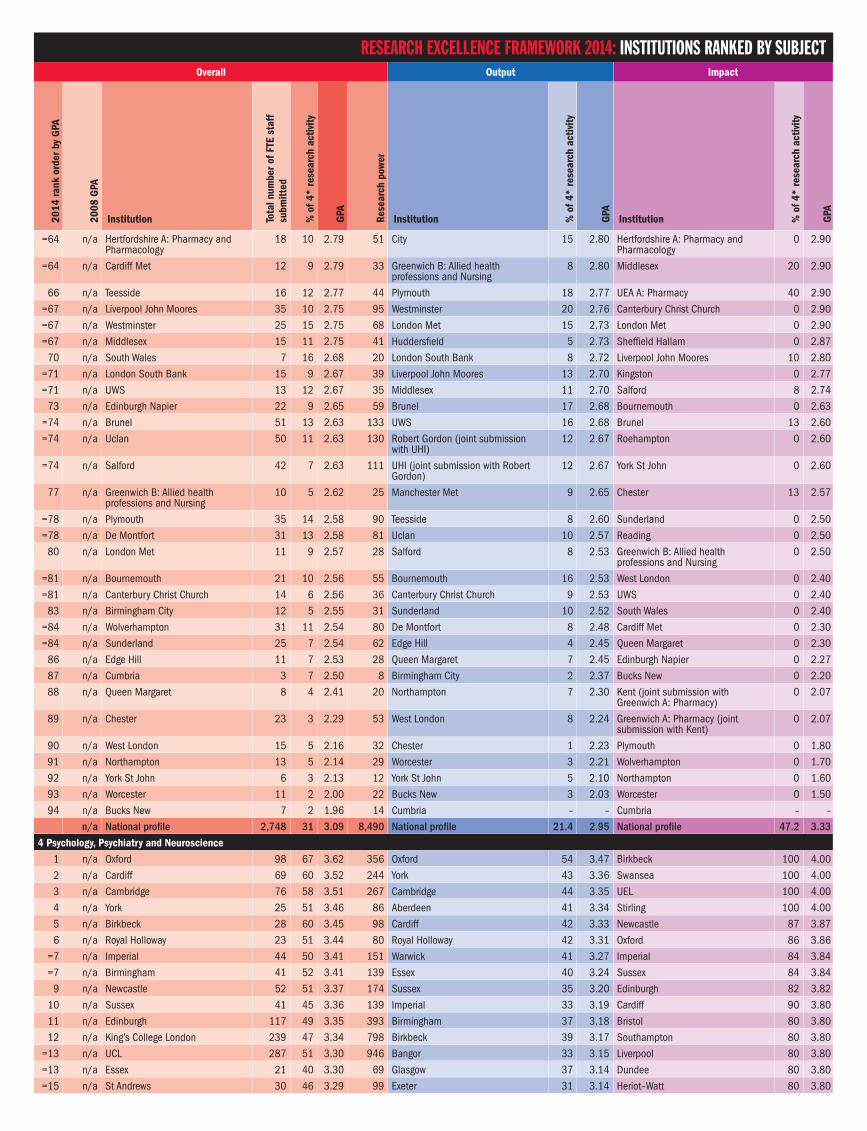
n/a National profile 2,748 31 3.09 8,490 National profile 21.4 2.95 National profile 47.2 3.33 4 Psychology, Psychiatry and Neuroscience
1 n/a Oxford 98 67 3.62 356 Oxford 54 3.47 Birkbeck 100 4.00
2 n/a Cardiff 69 60 3.52 244 York 43 3.36 Swansea 100 4.00
3 n/a Cambridge 76 58 3.51 267 Cambridge 44 3.35 UEL 100 4.00
4 n/a York 25 51 3.46 86 Aberdeen 41 3.34 Stirling 100 4.00
5 n/a Birkbeck 28 60 3.45 98 Cardiff 42 3.33 Newcastle 87 3.87
6 n/a Royal Holloway 23 51 3.44 80 Royal Holloway 42 3.31 Oxford 86 3.86
=7 n/a Imperial 44 50 3.41 151 Warwick 41 3.27 Imperial 84 3.84
=7 n/a Birmingham 41 52 3.41 139 Essex 40 3.24 Sussex 84 3.84
9 n/a Newcastle 52 51 3.37 174 Sussex 35 3.20 Edinburgh 82 3.82
10 n/a Sussex 41 45 3.36 139 Imperial 33 3.19 Cardiff 90 3.80
11 n/a Edinburgh 117 49 3.35 393 Birmingham 37 3.18 Bristol 80 3.80
12 n/a King’s College London 239 47 3.34 798 Birkbeck 39 3.17 Southampton 80 3.80
=13 n/a UCL 287 51 3.30 946 Bangor 33 3.15 Liverpool 80 3.80
=13 n/a Essex 21 40 3.30 69 Glasgow 37 3.14 Dundee 80 3.80
=15 n/a St Andrews 30 46 3.29 99 Exeter 31 3.14 Heriot–Watt 80 3.80
RESEARCH EXCELLENCE FRAMEWORK 2014: INSTITUTIONS RANKED BY SUBJECT

Overall Output Impact
2014
rank
ord
er b
y G
PA
2008
GPA
Institution Tota
l num
ber o
f FTE
sta
ff
subm
itted
% o
f 4*
rese
arch
act
ivity
GPA
Rese
arch
pow
er
Institution % o
f 4*
rese
arch
act
ivity
GPA
Institution % o
f 4*
rese
arch
act
ivity
GPA
=15 n/a Warwick 21 38 3.29 69 Stirling 32 3.14 Strathclyde 80 3.80 17 n/a Bangor 22 40 3.28 71 St Andrews 35 3.08 King’s College London 78 3.78 18 n/a Stirling 14 43 3.27 46 Newcastle 28 3.07 Queen’s Belfast 73 3.73
=19 n/a Manchester 68 42 3.23 219 Leicester 31 3.07 Royal Holloway 73 3.73 =19 n/a Aberdeen 21 29 3.23 67 Edinburgh 28 3.06 Nottingham Trent 73 3.73
21 n/a Exeter 32 38 3.22 104 King’s College London 25 3.04 Bangor 73 3.73 =22 n/a Glasgow 34 44 3.21 110 Dundee 24 3.03 Northumbria 73 3.73 =22 n/a Southampton 33 42 3.21 107 UCL 33 3.02 UCL 73 3.71
24 n/a Bristol 69 43 3.20 220 Nottingham 23 3.01 Birmingham 68 3.68 =25 n/a Nottingham 53 38 3.19 170 Plymouth 19 3.00 Reading 68 3.68 =25 n/a Sheffield 34 39 3.19 110 UEA 26 2.97 Cambridge 73 3.64 =27 n/a Dundee 15 31 3.18 47 Southampton 28 2.96 Manchester 60 3.60 =27 n/a Swansea 15 44 3.18 47 Manchester 24 2.94 Sheffield 60 3.60
29 n/a Liverpool 33 37 3.15 104 Lancaster 28 2.94 Goldsmiths 60 3.60 30 n/a UEA 14 29 3.10 42 Sheffield 22 2.92 Coventry 60 3.60 31 n/a Leeds 44 27 3.07 135 Swansea 28 2.91 UEA 60 3.60 32 n/a Leicester 34 22 3.06 105 Liverpool 23 2.88 Essex 53 3.53 33 n/a Reading 40 31 3.05 122 Bristol 24 2.87 Portsmouth 53 3.53
=34 n/a Plymouth 31 21 3.04 94 Durham 16 2.86 York 47 3.47 =34 n/a Durham 25 29 3.04 75 Surrey 21 2.86 Brunel 73 3.47
36 n/a Lancaster 22 29 3.02 66 Leeds 16 2.85 Warwick 47 3.47 37 n/a Queen’s Belfast 25 26 2.99 74 Goldsmiths 18 2.84 Uclan 47 3.47 38 n/a Goldsmiths 33 24 2.98 99 Bournemouth 11 2.84 Kent 40 3.40 39 n/a Kent 33 23 2.96 98 Anglia Ruskin 10 2.80 St Andrews 40 3.40 40 n/a UEL 15 25 2.93 43 Kent 20 2.79 Roehampton 40 3.40 41 n/a Nottingham Trent 22 25 2.89 63 Reading 19 2.77 Staffordshire 40 3.40 42 n/a Surrey 20 19 2.86 57 Queen’s Belfast 17 2.76 Abertay 40 3.40 43 n/a Hull 22 13 2.81 61 Nottingham Trent 16 2.73 York St John 40 3.40
=44 n/a Portsmouth 20 21 2.80 56 City 14 2.70 Leeds 36 3.36 =44 n/a Strathclyde 12 17 2.80 34 Hull 11 2.68 Nottingham 60 3.33
46 n/a Roehampton 14 17 2.79 40 UEL 8 2.67 Durham 53 3.27 =47 n/a City 28 13 2.73 76 Edge Hill 23 2.64 Hull 27 3.27 =47 n/a Abertay 8 12 2.73 21 Portsmouth 16 2.61 Lancaster 53 3.27
49 n/a Brunel 23 20 2.72 61 Westminster 10 2.61 Glasgow 60 3.20 50 n/a Heriot–Watt 13 20 2.71 34 Roehampton 10 2.60 Exeter 40 3.20
=51 n/a Northumbria 19 22 2.69 52 Ulster 12 2.59 Plymouth 40 3.20 =51 n/a Coventry 14 18 2.69 38 Liverpool John Moores 16 2.58 Derby 40 3.20
53 n/a Westminster 13 7 2.68 34 Middlesex 7 2.57 Chester 40 3.20 54 n/a Uclan 18 13 2.64 46 Abertay 6 2.54 Leicester 0 3.00 55 n/a Liverpool John Moores 10 10 2.61 25 York St John 7 2.50 Aberdeen 0 3.00 56 n/a Ulster 22 13 2.58 57 Oxford Brookes 12 2.49 Keele 40 3.00
=57 n/a Oxford Brookes 15 8 2.57 38 Kingston 6 2.49 Middlesex 0 3.00 =57 n/a Middlesex 13 4 2.57 34 Strathclyde 2 2.48 Lincoln 40 3.00
59 n/a Hertfordshire 12 5 2.56 31 Brunel 8 2.43 Westminster 0 3.00 60 n/a Bournemouth 13 7 2.54 33 Uclan 6 2.42 Leeds Beckett 0 3.00 61 n/a Edge Hill 12 15 2.49 30 Chichester 0 2.42 City 20 2.80 62 n/a Keele 15 12 2.47 36 Greenwich 12 2.40 Hertfordshire 20 2.80 63 n/a York St John 5 13 2.46 12 Keele 6 2.39 Queen Margaret 40 2.80 64 n/a Anglia Ruskin 14 7 2.41 33 Coventry 10 2.39 Ulster 27 2.73 65 n/a Kingston 10 4 2.37 24 Hertfordshire 2 2.39 Surrey 27 2.73 66 n/a Lincoln 13 13 2.36 30 Northumbria 11 2.38 Oxford Brookes 0 2.60 67 n/a Derby 14 10 2.35 34 Heriot–Watt 6 2.36 London South Bank 0 2.60 68 n/a Staffordshire 14 10 2.29 32 Lincoln 7 2.29 Liverpool John Moores 0 2.60 69 n/a Greenwich 12 8 2.28 26 Liverpool Hope 2 2.26 Edge Hill 0 2.40
RESEARCH EXCELLENCE FRAMEWORK 2014: INSTITUTIONS RANKED BY SUBJECT
Overall Output Impact
2014
rank
ord
er b
y G
PA
2008
GPA
Institution Tota
l num
ber o
f FTE
sta
ff
subm
itted
% o
f 4*
rese
arch
act
ivity
GPA
Rese
arch
pow
er
Institution % o
f 4*
rese
arch
act
ivity
GPA
Institution % o
f 4*
rese
arch
act
ivity
GPA
=70 n/a Chester 13 9 2.26 30 London South Bank 6 2.26 Worcester 0 2.40
=70 n/a Queen Margaret 6 8 2.26 14 Bolton 4 2.25 Kingston 0 2.40
72 n/a London South Bank 10 4 2.25 22 Derby 4 2.23 Bolton 0 2.40
73 n/a Leeds Beckett 12 2 2.22 27 Winchester 3 2.17 Greenwich 0 2.20
74 n/a Chichester 6 0 2.12 13 Queen Margaret 0 2.17 Liverpool Hope 0 2.00
75 n/a Liverpool Hope 11 2 2.10 23 Chester 2 2.12 Bournemouth 0 1.80
76 n/a Bolton 5 3 2.09 11 Leeds Beckett 2 2.12 Glyndwr 0 1.40
77 n/a Worcester 10 2 2.01 21 Staffordshire 2 1.98 Winchester 0 1.40
78 n/a Winchester 9 2 1.86 16 South Wales 3 1.97 Chichester 0 1.40
79 n/a Glyndwr 9 1 1.78 17 Worcester 4 1.85 Anglia Ruskin 0 1.20
80 n/a South Wales 9 2 1.75 16 Glyndwr 2 1.85 South Wales 0 1.20
81 n/a Newman 3 0 1.51 5 Northampton 0 1.07 Northampton 0 1.00
82 n/a Northampton 8 0 1.18 9 Newman – – Newman – –
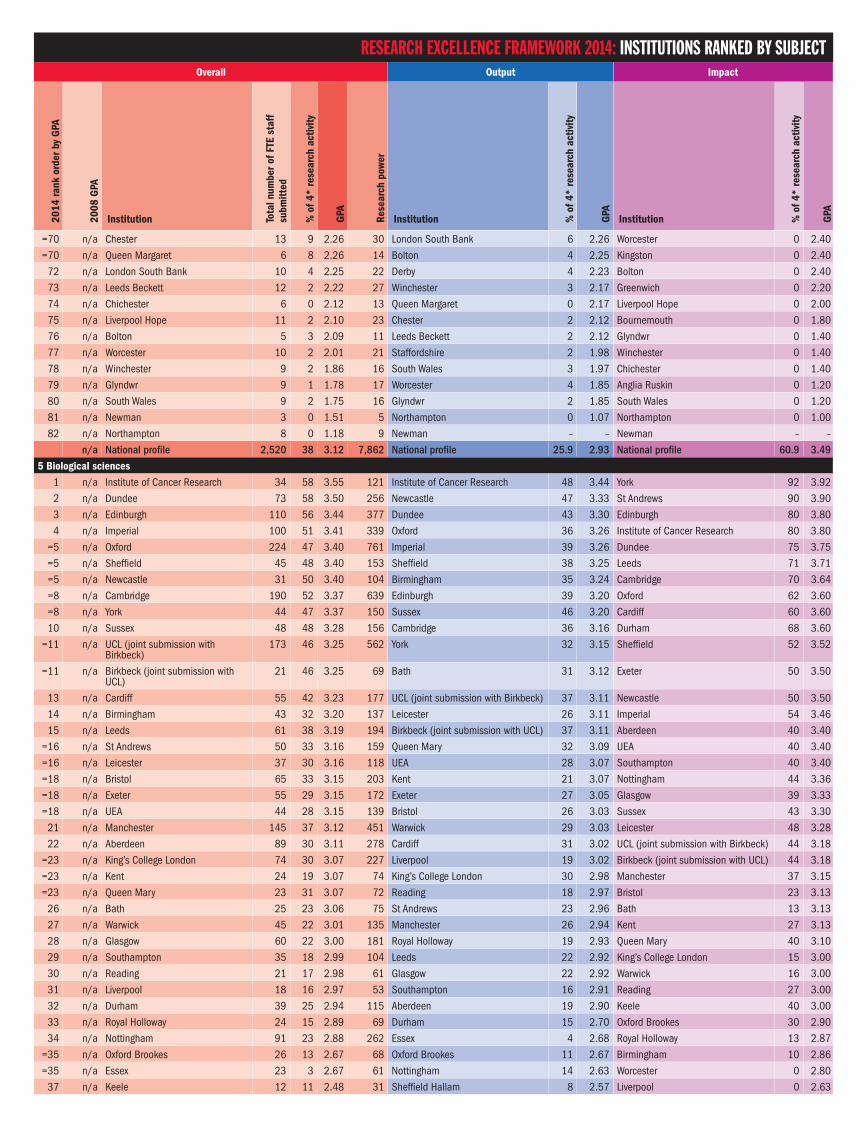
n/a National profile 2,520 38 3.12 7,862 National profile 25.9 2.93 National profile 60.9 3.49 5 Biological sciences
1 n/a Institute of Cancer Research 34 58 3.55 121 Institute of Cancer Research 48 3.44 York 92 3.92
2 n/a Dundee 73 58 3.50 256 Newcastle 47 3.33 St Andrews 90 3.90
3 n/a Edinburgh 110 56 3.44 377 Dundee 43 3.30 Edinburgh 80 3.80
4 n/a Imperial 100 51 3.41 339 Oxford 36 3.26 Institute of Cancer Research 80 3.80
=5 n/a Oxford 224 47 3.40 761 Imperial 39 3.26 Dundee 75 3.75
=5 n/a Sheffield 45 48 3.40 153 Sheffield 38 3.25 Leeds 71 3.71
=5 n/a Newcastle 31 50 3.40 104 Birmingham 35 3.24 Cambridge 70 3.64
=8 n/a Cambridge 190 52 3.37 639 Edinburgh 39 3.20 Oxford 62 3.60
=8 n/a York 44 47 3.37 150 Sussex 46 3.20 Cardiff 60 3.60
10 n/a Sussex 48 48 3.28 156 Cambridge 36 3.16 Durham 68 3.60
=11 n/a UCL (joint submission with Birkbeck)
173 46 3.25 562 York 32 3.15 Sheffield 52 3.52
=11 n/a Birkbeck (joint submission with UCL)
21 46 3.25 69 Bath 31 3.12 Exeter 50 3.50
13 n/a Cardiff 55 42 3.23 177 UCL (joint submission with Birkbeck) 37 3.11 Newcastle 50 3.50
14 n/a Birmingham 43 32 3.20 137 Leicester 26 3.11 Imperial 54 3.46
15 n/a Leeds 61 38 3.19 194 Birkbeck (joint submission with UCL) 37 3.11 Aberdeen 40 3.40
=16 n/a St Andrews 50 33 3.16 159 Queen Mary 32 3.09 UEA 40 3.40
=16 n/a Leicester 37 30 3.16 118 UEA 28 3.07 Southampton 40 3.40
=18 n/a Bristol 65 33 3.15 203 Kent 21 3.07 Nottingham 44 3.36
=18 n/a Exeter 55 29 3.15 172 Exeter 27 3.05 Glasgow 39 3.33
=18 n/a UEA 44 28 3.15 139 Bristol 26 3.03 Sussex 43 3.30
21 n/a Manchester 145 37 3.12 451 Warwick 29 3.03 Leicester 48 3.28
22 n/a Aberdeen 89 30 3.11 278 Cardiff 31 3.02 UCL (joint submission with Birkbeck) 44 3.18
=23 n/a King’s College London 74 30 3.07 227 Liverpool 19 3.02 Birkbeck (joint submission with UCL) 44 3.18
=23 n/a Kent 24 19 3.07 74 King’s College London 30 2.98 Manchester 37 3.15
=23 n/a Queen Mary 23 31 3.07 72 Reading 18 2.97 Bristol 23 3.13
26 n/a Bath 25 23 3.06 75 St Andrews 23 2.96 Bath 13 3.13
27 n/a Warwick 45 22 3.01 135 Manchester 26 2.94 Kent 27 3.13
28 n/a Glasgow 60 22 3.00 181 Royal Holloway 19 2.93 Queen Mary 40 3.10
29 n/a Southampton 35 18 2.99 104 Leeds 22 2.92 King’s College London 15 3.00
30 n/a Reading 21 17 2.98 61 Glasgow 22 2.92 Warwick 16 3.00
31 n/a Liverpool 18 16 2.97 53 Southampton 16 2.91 Reading 27 3.00
32 n/a Durham 39 25 2.94 115 Aberdeen 19 2.90 Keele 40 3.00
33 n/a Royal Holloway 24 15 2.89 69 Durham 15 2.70 Oxford Brookes 30 2.90
34 n/a Nottingham 91 23 2.88 262 Essex 4 2.68 Royal Holloway 13 2.87
=35 n/a Oxford Brookes 26 13 2.67 68 Oxford Brookes 11 2.67 Birmingham 10 2.86
=35 n/a Essex 23 3 2.67 61 Nottingham 14 2.63 Worcester 0 2.80
37 n/a Keele 12 11 2.48 31 Sheffield Hallam 8 2.57 Liverpool 0 2.63
RESEARCH EXCELLENCE FRAMEWORK 2014: INSTITUTIONS RANKED BY SUBJECT

Overall Output Impact
2014
rank
ord
er b
y G
PA
2008
GPA
Institution Tota
l num
ber o
f FTE
sta
ff
subm
itted
% o
f 4*
rese
arch
act
ivity
GPA
Rese
arch
pow
er
Institution % o
f 4*
rese
arch
act
ivity
GPA
Institution % o
f 4*
rese
arch
act
ivity
GPA
38 n/a Sheffield Hallam 16 5 2.45 40 Salford 7 2.45 Essex 0 2.60
39 n/a Salford 24 5 2.43 59 Keele 4 2.44 Salford 0 2.53
40 n/a Worcester 13 6 2.24 29 Huddersfield 15 2.29 Sheffield Hallam 0 2.47
41 n/a Huddersfield 13 9 2.09 27 Worcester 9 2.24 Anglia Ruskin 0 1.90
42 n/a Anglia Ruskin 7 0 1.73 13 Anglia Ruskin 0 1.87 Huddersfield 0 1.20
43 n/a Abertay 14 2 1.60 22 Abertay 4 1.82 Derby 0 1.20
44 n/a Derby 12 0 1.57 19 Derby 0 1.73 Abertay 0 0.90
n/a National profile 2,373 37 3.17 7,523 National profile 29.3 3.03 National profile 47.8 3.34
6 Agriculture, Veterinary and Food science
1 2.70 Aberdeen 20 56 3.48 71 Warwick 37 3.28 Aberdeen 100 4.00
2 2.75 Warwick 13 46 3.38 43 Lincoln 35 3.26 Warwick 100 4.00
3 2.50 Glasgow 39 46 3.37 131 Aberdeen 35 3.22 Stirling 90 3.90
4 2.45 Stirling 28 40 3.27 92 Glasgow 25 3.10 Greenwich 90 3.90
5 2.20 Queen’s Belfast 33 44 3.26 109 Bristol 24 3.04 Reading 85 3.85
6 2.60 Reading 73 45 3.24 237 UEA 20 3.02 Glasgow 82 3.82
7 2.40 Liverpool 55 42 3.23 176 Queen’s Belfast 26 2.99 Bristol 80 3.80
=8 2.25 Bristol 34 35 3.21 109 Liverpool 23 2.97 Aberystwyth (joint submission with Bangor)
76 3.72
=8 n/a UEA 11 32 3.21 35 Cambridge 26 2.96 Bangor (joint submission with Aberystwyth)
76 3.72
10 2.40 Cambridge 40 40 3.18 126 Stirling 16 2.96 Queen’s Belfast 70 3.70
=11 2.45 Edinburgh (joint submission with SRUC)
123 42 3.13 384 Nottingham 20 2.90 Cranfield 60 3.60
=11 n/a SRUC (joint submission with Edinburgh)
57 42 3.13 180 Reading 20 2.88 Leeds 60 3.60
13 2.70 Nottingham 111 37 3.12 348 Royal Veterinary College 17 2.87 Heriot–Watt 60 3.60
14 2.50 Royal Veterinary College 103 35 3.11 322 Edinburgh (joint submission with SRUC)
18 2.80 Edinburgh (joint submission with SRUC)
77 3.56
15 1.65 Lincoln 14 31 3.07 43 SRUC (joint submission with Edinburgh)
18 2.80 SRUC (joint submission with Edinburgh)
77 3.56
16 2.60 Leeds 14 30 3.06 44 Heriot–Watt 16 2.75 Liverpool 60 3.53
=17 2.50 Aberystwyth (joint submission with Bangor)
70 32 3.05 214 Newcastle 18 2.74 Royal Veterinary College 64 3.46
=17 2.40 Bangor (joint submission with Aberystwyth)
18 32 3.05 56 Aberystwyth (joint submission with Bangor)
14 2.73 Cambridge 58 3.42
19 2.25 Cranfield 26 23 2.94 77 Bangor (joint submission with Aberystwyth)
14 2.73 UEA 40 3.40
20 2.20 Heriot–Watt 10 23 2.87 27 Leeds 11 2.73 UWE 40 3.30
21 2.40 Newcastle 25 19 2.84 72 Hertfordshire 15 2.72 Nottingham 47 3.17
22 2.40 UWE 14 14 2.75 38 UWE 9 2.66 Plymouth 40 3.03
23 2.15 Greenwich 24 21 2.70 63 Harper Adams 7 2.61 Newcastle 30 3.00
24 1.95 Harper Adams 17 10 2.66 45 Cranfield 5 2.60 Lincoln 40 2.90
25 1.70 Plymouth 24 13 2.60 64 Canterbury Christ Church 3 2.50 Harper Adams 27 2.77
26 n/a Hertfordshire 12 10 2.41 28 Plymouth 8 2.49 Canterbury Christ Church 0 1.70
27 n/a Canterbury Christ Church 13 2 2.14 27 Greenwich 5 2.38 Hertfordshire 0 1.60
28 n/a Writtle 9 0 1.46 13 Writtle 0 2.00 Royal Agricultural University 0 0.80
29 1.50 Royal Agricultural University 12 3 1.40 17 Royal Agricultural University 4 1.55 Writtle 0 0.40
2.41 National profile 1,042 35 3.06 3,189 National profile 18.2 2.83 National profile 64.3 3.43
7 Earth systems and Environmental sciences
1 3.20 Oxford 36 43 3.36 122 Oxford 40 3.35 UEA 77 3.77
=2 2.95 Bristol 44 36 3.34 148 Swansea 41 3.34 Newcastle 73 3.73
=2 3.30 Cambridge 43 40 3.34 142 Bristol 31 3.28 Lancaster 68 3.68
4 2.85 Southampton 69 41 3.29 226 Cardiff 34 3.26 Brunel 67 3.67
5 2.80 Leeds 79 36 3.26 258 Cambridge 31 3.22 Institute of Zoology 63 3.63
=6 3.05 UCL (joint submission with Birkbeck)
34 34 3.25 111 Southampton 31 3.21 Cambridge 52 3.52
RESEARCH EXCELLENCE FRAMEWORK 2014: INSTITUTIONS RANKED BY SUBJECT

Overall Output Impact
2014
rank
ord
er b
y G
PA
2008
GPA
Institution Tota
l num
ber o
f FTE
sta
ff
subm
itted
% o
f 4*
rese
arch
act
ivity
GPA
Rese
arch
pow
er
Institution % o
f 4*
rese
arch
act
ivity
GPA
Institution % o
f 4*
rese
arch
act
ivity
GPA
=6 3.05 Birkbeck (joint submission with UCL)
9 34 3.25 29 UCL (joint submission with Birkbeck) 23 3.11 UCL (joint submission with Birkbeck) 60 3.52
8 n/a Swansea 11 34 3.21 36 Birkbeck (joint submission with UCL) 23 3.11 Birkbeck (joint submission with UCL) 60 3.52
9 2.90 Royal Holloway 25 26 3.20 80 Royal Holloway 19 3.10 Reading 51 3.51
10 2.90 UEA 63 35 3.19 201 Leeds 24 3.09 Durham 60 3.50
11 2.85 Manchester 42 29 3.18 134 Birmingham 17 3.07 Royal Holloway 47 3.47
12 2.80 Durham 35 27 3.15 110 Liverpool 23 3.07 Manchester 44 3.44
13 n/a Institute of Zoology 21 22 3.12 65 Leicester 19 3.07 Leeds 47 3.42
=14 3.00 Reading 76 27 3.11 235 Exeter 23 3.04 Aberdeen 50 3.40
=14 n/a Exeter 35 24 3.11 108 Manchester 20 3.03 Southampton 65 3.35
=16 2.60 Bangor (joint submission with Aberystwyth)
35 21 3.10 110 Bangor (joint submission with Aberystwyth)
17 3.03 Bristol 32 3.32
=16 n/a Aberystwyth (joint submission with Bangor)
4 21 3.10 12 Aberystwyth (joint submission with Bangor)
17 3.03 Bangor (joint submission with Aberystwyth)
40 3.30
18 2.75 Newcastle 25 25 3.09 76 Durham 17 3.02 Aberystwyth (joint submission with Bangor)
40 3.30
19 2.80 Lancaster 45 32 3.08 138 Glasgow 16 2.98 Exeter 20 3.20
20 2.80 Cardiff 15 24 3.07 46 Aberdeen 12 2.97 Queen’s Belfast 20 3.20
=21 2.65 Aberdeen 28 18 3.06 87 Institute of Zoology 12 2.97 Swansea 40 3.20
=21 2.75 Birmingham 28 13 3.06 86 UEA 19 2.95 Edinburgh Napier 20 3.20
=21 2.70 Leicester 22 16 3.06 67 Sheffield 21 2.93 Edinburgh 32 3.14
=24 2.50 Glasgow 35 21 3.04 106 Plymouth 15 2.92 York 40 3.13
=24 2.85 Liverpool 25 17 3.04 75 Newcastle 15 2.91 Sheffield 27 3.13
=26 2.50 Plymouth 45 14 2.98 134 Queen’s Belfast 10 2.90 Leicester 13 3.13
=26 2.75 Sheffield 24 19 2.98 71 Reading 13 2.88 Heriot–Watt 13 3.13
28 2.80 Edinburgh 105 21 2.94 309 UHI 15 2.86 Glasgow 30 3.10
29 n/a Queen’s Belfast 24 10 2.92 71 Open 12 2.83 UHI 10 3.10
30 2.30 UHI 32 14 2.91 94 Lancaster 17 2.81 Birmingham 10 3.10
31 2.40 Brunel 16 19 2.88 47 Portsmouth 9 2.81 Portsmouth 10 3.10
32 2.80 Open 58 11 2.87 166 Edinburgh 15 2.79 Plymouth 16 3.08
33 2.05 Heriot–Watt 18 6 2.81 49 York 10 2.66 Oxford 18 3.02
34 2.65 York 24 14 2.80 67 Heriot–Watt 5 2.66 Stirling 20 3.00
35 2.40 Portsmouth 26 8 2.78 72 Stirling 16 2.66 Brighton 20 3.00
36 2.35 Stirling 15 14 2.72 40 Ulster 14 2.63 Liverpool 0 2.87
37 1.80 Edinburgh Napier 6 7 2.60 16 Coventry 12 2.61 Open 6 2.83
=38 2.35 Ulster 18 9 2.59 48 Manchester Met 8 2.58 Keele 0 2.80
=38 2.30 Brighton 14 4 2.59 37 Brunel 3 2.58 Cardiff 10 2.70
40 2.35 Manchester Met 24 5 2.58 62 Keele 3 2.55 Coventry 0 2.70
41 n/a Keele 10 2 2.57 26 Abertay 3 2.53 Ulster 0 2.63
42 n/a Coventry 10 8 2.55 27 Edinburgh Napier 4 2.52 Manchester Met 0 2.60
43 2.40 Abertay 14 2 2.51 36 Brighton 0 2.42 Abertay 0 2.60
44 1.90 Bedfordshire 5 0 1.97 9 Derby 0 2.21 Bedfordshire 0 2.10
45 n/a Derby 7 0 1.90 14 Bedfordshire 0 1.95 Derby 0 1.30
2.73 National profile 1,380 24 3.05 4,209 National profile 18.2 2.95 National profile 36.2 3.25
8 Chemistry
1 3.20 Cambridge 63 57 3.54 222 Liverpool 45 3.44 Durham 76 3.76
2 2.85 Liverpool 34 51 3.50 119 Cambridge 47 3.42 Cambridge 66 3.66
3 3.05 Oxford 84 49 3.43 288 Oxford 38 3.32 Liverpool 60 3.60
4 3.00 Bristol 59 39 3.35 196 UEA 32 3.29 Manchester 50 3.50
5 2.80 Durham 41 35 3.31 135 Bristol 28 3.26 Leeds 50 3.50
=6 2.80 UCL 62 37 3.30 205 Warwick 29 3.25 Bath 50 3.50
=6 2.95 Imperial 55 34 3.30 181 Queen Mary 31 3.24 Cardiff 50 3.50
=6 2.90 Warwick 35 32 3.30 115 Sheffield 23 3.21 UCL 66 3.49
9 2.70 Cardiff 23 32 3.29 76 Southampton 26 3.20 Oxford 56 3.47
RESEARCH EXCELLENCE FRAMEWORK 2014: INSTITUTIONS RANKED BY SUBJECT
Overall Output Impact
2014
rank
ord
er b
y G
PA
2008
GPA
Institution Tota
l num
ber o
f FTE
sta
ff
subm
itted
% o
f 4*
rese
arch
act
ivity
GPA
Rese
arch
pow
er
Institution % o
f 4*
rese
arch
act
ivity
GPA
Institution % o
f 4*
rese
arch
act
ivity
GPA
10 2.60 UEA 20 29 3.27 64 Lancaster 25 3.19 Imperial 47 3.47
11 2.85 Manchester 52 33 3.24 170 UCL 22 3.17 Bristol 54 3.43
=12 2.65 Southampton 45 29 3.23 145 Edinburgh (joint submission with St Andrews)
23 3.17 Southampton 50 3.42
=12 3.00 Edinburgh (joint submission with St Andrews)
43 28 3.23 140 Durham 23 3.17 York 40 3.40
=12 3.00 St Andrews (joint submission with Edinburgh)
37 28 3.23 120 St Andrews (joint submission with Edinburgh)
23 3.17 Queen’s Belfast 40 3.40
=12 2.65 Bath 33 25 3.23 107 Cardiff 22 3.17 Aberdeen 40 3.40
16 3.15 Nottingham 42 27 3.22 135 Bath 19 3.16 UEA 40 3.40
17 2.90 York 47 27 3.21 151 Imperial 21 3.15 Strathclyde (joint submission with Glasgow)
35 3.35
18 2.85 Sheffield 29 21 3.19 93 York 24 3.13 Glasgow (joint submission with Strathclyde)
35 3.35
19 2.90 Leeds 34 23 3.18 109 Nottingham 18 3.12 Warwick 30 3.30
=20 2.75 Strathclyde (joint submission with Glasgow)
35 21 3.15 112 Heriot–Watt 15 3.10 Newcastle 27 3.27
=20 2.75 Glasgow (joint submission with Strathclyde)
31 21 3.15 97 Strathclyde (joint submission with Glasgow)
17 3.09 Leicester 37 3.23
22 n/a Queen Mary 14 20 3.07 43 Glasgow (joint submission with Strathclyde)
17 3.09 Sheffield 20 3.20
=23 2.60 Heriot–Watt 30 12 3.01 90 Birmingham 14 3.09 Lancaster 20 3.20
=23 2.65 Birmingham 28 11 3.01 84 Manchester 21 3.08 Edinburgh (joint submission with St Andrews)
28 3.19
25 n/a Lancaster 12 20 2.98 36 Leeds 14 3.06 St Andrews (joint submission with Edinburgh)
28 3.19
=26 2.40 Leicester 21 12 2.94 63 Reading 13 3.06 Nottingham 26 3.18
=26 2.40 Aberdeen 20 14 2.94 59 Kent 14 2.98 Hull 27 3.03
28 2.45 Queen’s Belfast 34 11 2.93 101 Hull 10 2.96 Kent 13 3.03
=29 2.45 Newcastle 24 8 2.91 70 Leicester 6 2.89 Heriot–Watt 10 3.00
=29 2.50 Hull 24 12 2.91 70 Sussex 16 2.88 Loughborough 27 3.00
31 n/a Kent 17 12 2.88 49 Aberdeen 9 2.87 Queen Mary 0 3.00
32 2.15 Reading 22 8 2.85 63 Queen’s Belfast 5 2.84 Birmingham 0 2.80
=33 2.20 Loughborough 23 6 2.70 61 Newcastle 4 2.84 Greenwich 0 2.80
=33 2.45 Bangor 9 3 2.70 25 Huddersfield 5 2.76 Huddersfield 0 2.70
35 2.00 Huddersfield 15 3 2.67 39 Bangor 5 2.73 Bangor 0 2.70
36 2.55 Sussex 17 11 2.66 45 Loughborough 1 2.70 Reading 0 2.50
37 n/a Greenwich 14 2 2.46 35 Greenwich 3 2.53 Sussex 0 2.13
2.79 National profile 1,229 28 3.19 3,921 National profile 22.1 3.13 National profile 39.6 3.32
9 Physics
1 2.35 Strathclyde 27 40 3.35 90 Oxford 33 3.24 Manchester 83 3.83
2 2.65 Oxford 125 43 3.34 416 Edinburgh (joint submission with St Andrews)
27 3.22 Strathclyde 80 3.80
=3 2.80 Edinburgh (joint submission with St Andrews)
66 37 3.33 220 St Andrews (joint submission with Edinburgh)
27 3.22 Nottingham 73 3.73
=3 2.85 Nottingham 55 37 3.33 182 Strathclyde 27 3.20 Leeds 67 3.67
=3 2.85 St Andrews (joint submission with Edinburgh)
37 37 3.33 123 Cardiff 22 3.20 Bath 67 3.67
6 2.35 Cardiff 20 31 3.30 64 Warwick 24 3.19 Cardiff 63 3.63
=7 2.85 Cambridge 153 38 3.29 504 Southampton 25 3.19 Southampton 60 3.60
=7 2.60 Manchester 65 38 3.29 214 Portsmouth 22 3.18 Kent 60 3.60
9 2.75 Durham 75 31 3.27 244 Durham 22 3.16 Glasgow 42 3.42
10 2.75 Imperial 117 35 3.26 383 Sheffield 24 3.16 Durham 40 3.40
11 2.65 Southampton 35 31 3.25 113 Heriot–Watt 22 3.16 Imperial 48 3.39
12 2.60 Warwick 55 29 3.23 176 Nottingham 21 3.14 Edinburgh (joint submission with St Andrews)
46 3.39
=13 2.55 Leeds 24 25 3.16 76 Imperial 24 3.13 St Andrews (joint submission with Edinburgh)
46 3.39
RESEARCH EXCELLENCE FRAMEWORK 2014: INSTITUTIONS RANKED BY SUBJECT

Overall Output Impact
2014
rank
ord
er b
y G
PA
2008
GPA
Institution Tota
l num
ber o
f FTE
sta
ff
subm
itted
% o
f 4*
rese
arch
act
ivity
GPA
Rese
arch
pow
er
Institution % o
f 4*
rese
arch
act
ivity
GPA
Institution % o
f 4*
rese
arch
act
ivity
GPA
=13 2.85 Bath 23 25 3.16 73 Queen’s Belfast 25 3.13 Cambridge 48 3.38
15 2.65 Heriot–Watt 21 25 3.15 66 Birmingham 23 3.13 Heriot–Watt 50 3.37
=16 2.75 UCL 111 23 3.12 345 Queen Mary 23 3.13 Leicester 43 3.30
=16 2.70 Exeter 40 23 3.12 125 Cambridge 24 3.12 Surrey 40 3.30
=16 2.75 Sheffield 30 23 3.12 94 King’s College London 23 3.10 Liverpool John Moores 40 3.27
19 2.50 Queen’s Belfast 45 23 3.11 139 Sussex 20 3.10 Oxford 42 3.26
20 2.75 Glasgow 45 22 3.10 139 Keele 23 3.09 UCL 30 3.20
21 2.55 Surrey 28 25 3.09 85 Exeter 22 3.08 Exeter 24 3.16
22 2.65 Bristol 44 23 3.08 136 Liverpool John Moores 22 3.07 Warwick 30 3.10
23 2.50 Queen Mary 24 17 3.07 74 Liverpool 17 3.06 Bristol 26 3.10
=24 2.65 Liverpool 34 17 3.06 105 Bath 16 3.06 Royal Holloway 13 3.00
=24 n/a Portsmouth 16 17 3.06 50 UCL 19 3.05 Queen’s Belfast 8 2.92
26 2.70 Birmingham 39 23 3.05 119 Lancaster 28 3.05 Lancaster 10 2.90
27 2.90 Lancaster 35 24 3.04 106 Manchester 18 3.03 Liverpool 10 2.90
28 2.40 Liverpool John Moores 23 23 3.03 69 Leeds 14 3.03 Queen Mary 0 2.90
29 2.20 Kent 5 27 3.02 15 Royal Holloway 18 3.02 York 40 2.80
=30 2.55 Leicester 49 21 3.01 148 Bristol 19 3.00 Sheffield 10 2.80
=30 2.55 King’s College London 27 18 3.01 80 York 18 2.99 King’s College London 10 2.80
32 2.55 Royal Holloway 25 14 3.00 75 Swansea 13 2.98 Portsmouth 13 2.77
33 2.60 York 34 21 2.93 101 Glasgow 14 2.96 Birmingham 24 2.66
34 2.70 Sussex 25 17 2.92 72 Surrey 16 2.95 Swansea 0 2.63
35 2.55 Swansea 21 10 2.89 61 Kent 24 2.94 Hertfordshire 0 2.40
36 2.60 Hertfordshire 33 7 2.70 89 Leicester 9 2.82 Sussex 13 2.40
37 2.25 Keele 11 15 2.67 28 Hertfordshire 9 2.76 Uclan 0 2.37
38 2.30 Uclan 21 6 2.59 54 Uclan 10 2.76 Loughborough 0 2.27
39 2.45 Loughborough 20 4 2.52 50 Loughborough 7 2.65 Aberystwyth 0 2.10
40 n/a Huddersfield 12 6 2.43 29 Huddersfield 10 2.64 Huddersfield 0 1.80
41 1.95 Aberystwyth 12 1 2.42 29 Aberystwyth 2 2.55 Keele 0 1.50
2.65 National profile 1,704 28 3.15 5,366 National profile 21.3 3.08 National profile 37 3.19
10 Mathematical sciences
1 n/a Oxford 149 59 3.55 528 Oxford 41 3.35 Oxford 88 3.88
2 n/a Cambridge 144 45 3.36 483 Cambridge 35 3.26 Royal Holloway 80 3.80
3 n/a Warwick 104 44 3.35 349 Warwick 31 3.17 Lancaster 77 3.77
4 n/a Imperial 100 44 3.34 335 King’s College London 31 3.17 Bristol 69 3.65
=5 n/a Bristol 84 43 3.29 275 Dundee 24 3.15 Dundee 60 3.60
=5 n/a Lancaster 25 40 3.29 82 Imperial 28 3.14 Durham 57 3.57
7 n/a Manchester 54 38 3.27 178 Lancaster 30 3.14 Imperial 56 3.53
=8 n/a Leeds 53 36 3.21 170 Newcastle 26 3.09 Manchester 53 3.53
=8 n/a Dundee 13 27 3.21 41 UCL 26 3.08 Warwick 43 3.43
10 n/a Nottingham 55 32 3.19 175 Bristol 28 3.07 Leeds 57 3.43
=11 n/a St Andrews 31 26 3.16 97 Manchester 24 3.07 Newcastle 53 3.43
=11 n/a Newcastle 20 29 3.16 64 Bath 21 3.07 Sheffield 40 3.40
=13 n/a Edinburgh (joint submission with Heriot–Watt)
57 29 3.14 178 Birmingham 21 3.07 Cambridge 45 3.34
=13 n/a Heriot–Watt (joint submission with Edinburgh)
36 29 3.14 114 Cardiff 20 3.05 Glasgow 32 3.32
=13 n/a Royal Holloway 14 23 3.14 44 Edinburgh (joint submission with Heriot–Watt)
22 3.04 Southampton 30 3.30
16 n/a Bath 44 26 3.12 139 Heriot–Watt (joint submission with Edinburgh)
22 3.04 St Andrews 40 3.30
17 n/a Southampton 55 23 3.10 170 Queen Mary 18 3.04 Cardiff 27 3.27
18 n/a Sheffield 34 20 3.09 105 LSE 20 3.04 Nottingham 30 3.23
=19 n/a UCL 63 27 3.08 194 Nottingham 22 3.03 City 40 3.20
=19 n/a Glasgow 43 19 3.08 132 St Andrews 15 3.03 Bath 42 3.18
RESEARCH EXCELLENCE FRAMEWORK 2014: INSTITUTIONS RANKED BY SUBJECT
Overall Output Impact
2014
rank
ord
er b
y G
PA
2008
GPA
Institution Tota
l num
ber o
f FTE
sta
ff
subm
itted
% o
f 4*
rese
arch
act
ivity
GPA
Rese
arch
pow
er
Institution % o
f 4*
rese
arch
act
ivity
GPA
Institution % o
f 4*
rese
arch
act
ivity
GPA
=19 n/a Cardiff 24 18 3.08 74 Leeds 21 3.02 Edinburgh (joint submission with Heriot–Watt)
30 3.14
22 n/a Durham 54 24 3.06 165 UEA 15 3.02 Heriot–Watt (joint submission with Edinburgh)
30 3.14
=23 n/a Queen Mary 35 14 3.01 105 Sheffield 18 3.01 Liverpool 18 3.10
=23 n/a Exeter 35 18 3.01 104 Surrey 21 3.01 Exeter 30 3.10
25 n/a Reading 27 15 3.00 80 Glasgow 17 3.00 Reading 10 3.10
26 n/a York 31 17 2.97 91 Royal Holloway 11 3.00 York 20 3.00
27 n/a LSE 31 13 2.95 92 Aberdeen 22 2.99 Queen Mary 10 2.90
28 n/a King’s College London 43 22 2.94 127 Southampton 17 2.98 Kent 20 2.90
=29 n/a Liverpool 40 13 2.93 116 Coventry 10 2.97 Strathclyde 30 2.90
=29 n/a City 16 19 2.93 47 Keele 19 2.97 Queen’s Belfast 0 2.80
31 n/a UEA 22 9 2.92 64 York 17 2.96 Portsmouth 0 2.80
32 n/a Aberdeen 23 14 2.90 67 City 17 2.96 Coventry 0 2.80
33 n/a Surrey 28 14 2.89 82 Exeter 16 2.95 UCL 11 2.77
34 n/a Coventry 9 7 2.88 26 Loughborough 16 2.95 Aberdeen 0 2.73
35 n/a Birmingham 40 15 2.87 115 Reading 17 2.95 UEA 0 2.73
=36 n/a Loughborough 34 10 2.86 97 Sussex 17 2.94 LSE 0 2.70
=36 n/a Strathclyde 33 15 2.86 94 Open 14 2.89 Leicester 13 2.63
38 n/a Kent 33 10 2.82 93 Durham 13 2.87 Brunel 27 2.60
39 n/a Sussex 20 11 2.80 56 Liverpool 14 2.85 Sussex 0 2.60
40 n/a Keele 8 12 2.79 22 Kent 7 2.79 Loughborough 0 2.50
41 n/a Brunel 24 11 2.71 65 Strathclyde 11 2.79 Surrey 0 2.40
42 n/a Queen’s Belfast 12 5 2.70 32 Plymouth 11 2.77 London Met 0 2.40
43 n/a Leicester 24 6 2.69 63 Queen’s Belfast 7 2.76 Birmingham 10 2.30
44 n/a Portsmouth 11 6 2.68 29 Aberystwyth 12 2.73 Keele 0 2.30
45 n/a Open 19 9 2.61 49 Brunel 8 2.72 South Wales 0 2.20
46 n/a Aberystwyth 11 8 2.57 28 Portsmouth 10 2.71 Swansea 20 2.10
47 n/a Northumbria 14 5 2.50 35 Leicester 5 2.70 Northumbria 0 2.10
48 n/a Swansea 15 12 2.49 37 Swansea 12 2.67 Aberystwyth 0 2.10
49 n/a London Met 4 4 2.46 10 Northumbria 7 2.67 King’s College London 0 2.02
50 n/a Plymouth 14 7 2.42 35 London Met 6 2.61 Open 0 1.73
51 n/a South Wales 9 0 2.30 21 Greenwich 12 2.53 Plymouth 0 1.50
52 n/a Greenwich 5 8 2.08 10 South Wales 0 2.45 Chester 0 1.50
53 n/a Chester 7 2 2.04 14 Chester 4 2.29 Greenwich 0 0.90
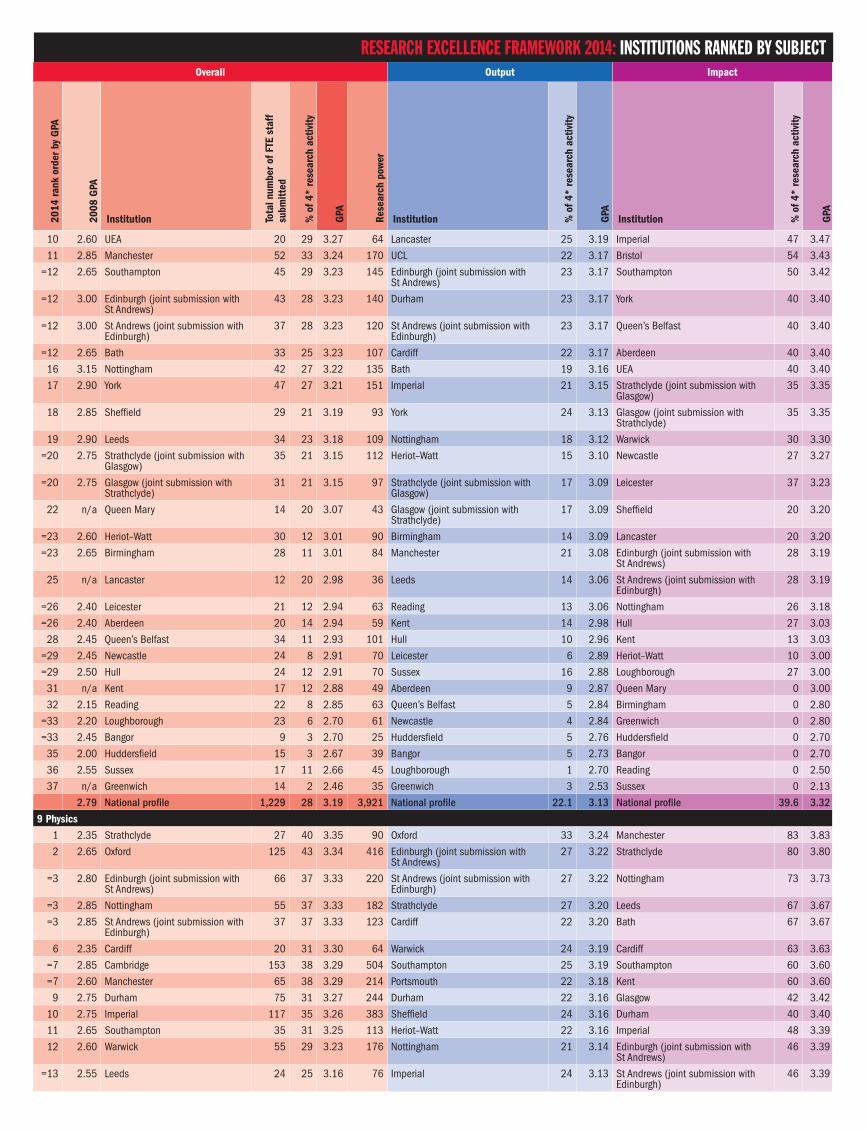
n/a National profile 1,930 29 3.12 6,022 National profile 22.7 3.04 National profile 35.9 3.14 11 Computer science and Informatics
1 3.15 UCL 71 61 3.57 252 Warwick 52 3.46 Newcastle 90 3.90
2 2.75 Warwick 24 56 3.53 86 UCL 49 3.43 Cambridge 87 3.87
3 3.20 Imperial 49 56 3.50 173 Liverpool 39 3.35 Warwick 87 3.87
4 3.15 Manchester 45 48 3.42 153 Imperial 43 3.34 Southampton 84 3.84
5 2.75 Sheffield 31 47 3.39 103 Oxford 48 3.31 UCL 80 3.80
6 3.35 Cambridge 55 48 3.36 183 King’s College London 34 3.26 York 80 3.80
=7 3.15 Oxford 74 53 3.34 245 Cambridge 37 3.19 Hull 80 3.80
=7 2.95 York 35 44 3.34 116 Manchester 29 3.19 Manchester 76 3.76 9 2.90 Newcastle 28 46 3.33 92 Sheffield 32 3.19 Imperial 73 3.73
10 3.05 Liverpool 24 35 3.32 80 Queen Mary 33 3.18 Leeds 73 3.73 11 3.00 Queen Mary 31 39 3.29 100 Royal Holloway 32 3.17 Sheffield 70 3.70 12 3.05 Lancaster 33 36 3.26 108 Lancaster 30 3.16 Glasgow 68 3.68 13 3.10 Nottingham 43 37 3.24 139 Edinburgh 33 3.15 Bristol 60 3.60 14 2.70 King’s College London 46 32 3.20 147 St Andrews 30 3.14 Birmingham 52 3.52 15 3.20 Edinburgh 95 40 3.19 303 Swansea 33 3.11 Lancaster 50 3.50
=16 3.20 Southampton 44 44 3.18 141 Exeter 32 3.11 Queen Mary 50 3.50 =16 3.10 Glasgow 42 36 3.18 132 York 26 3.09 Cardiff 60 3.50
RESEARCH EXCELLENCE FRAMEWORK 2014: INSTITUTIONS RANKED BY SUBJECT
Overall Output Impact
2014
rank
ord
er b
y G
PA
2008
GPA
Institution Tota
l num
ber o
f FTE
sta
ff
subm
itted
% o
f 4*
rese
arch
act
ivity
GPA
Rese
arch
pow
er
Institution % o
f 4*
rese
arch
act
ivity
GPA
Institution % o
f 4*
rese
arch
act
ivity
GPA
=18 2.95 Bristol 42 31 3.17 132 UEA 31 3.07 Dundee 50 3.50 =18 3.05 Leeds 25 32 3.17 79 Newcastle 25 3.05 Nottingham 48 3.48 =18 2.90 Swansea 20 40 3.17 62 Birmingham 29 3.04 Heriot–Watt 40 3.40
21 3.00 Birmingham 41 29 3.13 127 Birkbeck 32 3.03 Liverpool 40 3.40 22 2.75 Dundee 12 32 3.11 36 Nottingham 22 3.02 Aston 40 3.40 23 2.75 UEA 18 28 3.08 56 Bristol 23 3.02 Portsmouth 40 3.40 24 2.80 Royal Holloway 24 30 3.06 75 Cardiff 21 3.02 King’s College London 40 3.33 25 2.85 Cardiff 14 26 3.04 42 Leicester 23 3.00 City 40 3.30 26 2.80 Durham 14 19 3.02 43 Durham 20 3.00 Kent 30 3.30 27 2.70 St Andrews 24 22 2.99 72 Aberystwyth 25 2.98 Goldsmiths 27 3.27
=28 2.75 Kent 29 18 2.97 86 Oxford Brookes 19 2.98 Aberystwyth 23 3.23 =28 2.65 Heriot–Watt 28 23 2.97 82 Plymouth 23 2.98 Oxford 60 3.20 =28 2.65 Exeter 10 23 2.97 30 Glasgow 23 2.96 Swansea 60 3.20
31 2.90 Aberdeen 19 22 2.96 56 Leeds 20 2.96 Brighton 20 3.20 32 3.00 Plymouth 12 15 2.95 37 Aberdeen 23 2.93 Queen’s Belfast 13 3.13 33 2.95 Aberystwyth 25 21 2.93 73 Sussex 23 2.93 Nottingham Trent 30 3.10
=34 2.95 Bath 24 11 2.92 70 Southampton 31 2.91 Durham 30 3.10 =34 2.85 Sussex 15 19 2.92 43 Essex 23 2.90 Coventry 10 3.10
36 2.75 Essex 35 22 2.89 101 Dundee 22 2.90 Edinburgh 48 3.04 37 2.95 Open 31 13 2.87 89 Open 14 2.89 UEA 27 3.03 38 2.65 Queen’s Belfast 21 12 2.82 60 Bath 15 2.86 Bath 0 3.00 39 1.90 Portsmouth 13 20 2.81 37 Kent 18 2.85 St Andrews 13 3.00 40 2.70 Goldsmiths 19 15 2.79 54 Brunel 23 2.84 Aberdeen 27 3.00
=41 2.75 Birkbeck 19 21 2.77 52 Queen’s Belfast 13 2.78 Plymouth 0 3.00 =41 n/a Aston 18 16 2.77 50 Lincoln 16 2.76 UWE 20 2.90 =43 2.60 City 32 15 2.75 88 Teesside 5 2.75 Salford 0 2.90 =43 2.80 Leicester 20 15 2.75 55 Portsmouth 19 2.74 Edinburgh Napier 0 2.90 =43 2.40 UWE 15 13 2.75 41 Heriot–Watt 12 2.71 Exeter 10 2.90
46 n/a Brunel 31 17 2.74 84 UWE 15 2.71 Loughborough 13 2.87 47 n/a Hull 15 23 2.71 40 Stirling 9 2.69 Greenwich 20 2.80 48 2.55 Ulster 40 9 2.68 106 Bangor 13 2.68 Kingston 20 2.80 49 2.35 Surrey 19 11 2.67 52 Ulster 5 2.65 Royal Holloway 40 2.73 50 2.40 De Montfort 25 9 2.63 65 City 11 2.65 Sussex 10 2.70 51 2.20 Kingston 10 9 2.61 27 Aston 12 2.65 Stirling 10 2.70 52 2.40 Stirling 14 8 2.58 37 Northumbria 10 2.65 Liverpool John Moores 0 2.70 53 2.55 Strathclyde 20 11 2.57 52 Surrey 12 2.64 De Montfort 0 2.67 54 2.50 Oxford Brookes 13 20 2.55 33 Keele 4 2.63 Surrey 20 2.67
=55 2.60 Brighton 14 6 2.52 35 Strathclyde 13 2.62 Essex 20 2.60 =55 2.00 Edinburgh Napier 11 3 2.52 27 Manchester Met 0 2.62 South Wales 20 2.60
57 2.60 Loughborough 17 6 2.51 43 De Montfort 14 2.61 Ulster 18 2.54 58 2.50 Teesside 13 3 2.48 31 Kingston 8 2.60 Open 0 2.50
=59 2.05 Coventry 13 5 2.44 32 Goldsmiths 12 2.59 Bedfordshire 0 2.40 =59 2.15 Manchester Met 12 4 2.44 28 UEL 6 2.56 Hertfordshire 10 2.40
61 2.60 Hertfordshire 27 8 2.43 67 Hull 10 2.52 Strathclyde 13 2.40 62 2.50 Liverpool John Moores 10 0 2.40 23 Huddersfield 13 2.52 Huddersfield 0 2.40 63 n/a Keele 5 3 2.39 12 Glasgow Caledonian 4 2.51 Birkbeck 0 2.37 64 n/a Northumbria 13 6 2.36 31 Hertfordshire 9 2.49 Brunel 10 2.30 65 2.05 Huddersfield 14 8 2.34 34 Middlesex 9 2.46 Leicester 0 2.27
=66 2.10 Bedfordshire 35 5 2.33 81 Loughborough 6 2.46 Leeds Beckett 0 2.20 =66 n/a Salford 13 1 2.33 30 Liverpool Hope 0 2.46 Staffordshire 0 2.20
68 1.80 Glasgow Caledonian 13 3 2.32 30 Bedfordshire 8 2.44 Birmingham City 40 2.20 69 2.50 Bangor 10 8 2.30 23 Brighton 3 2.41 Keele 0 2.20 70 2.25 Middlesex 53 6 2.29 122 UWS 7 2.41 Westminster 0 2.00 71 2.25 South Wales 14 4 2.21 30 Edinburgh Napier 4 2.41 Oxford Brookes 40 2.00
RESEARCH EXCELLENCE FRAMEWORK 2014: INSTITUTIONS RANKED BY SUBJECT
Overall Output Impact
2014
rank
ord
er b
y G
PA
2008
GPA
Institution Tota
l num
ber o
f FTE
sta
ff
subm
itted
% o
f 4*
rese
arch
act
ivity
GPA
Rese
arch
pow
er
Institution % o
f 4*
rese
arch
act
ivity
GPA
Institution % o
f 4*
rese
arch
act
ivity
GPA
72 1.90 Greenwich 14 9 2.19 31 Derby 5 2.35 Sunderland 0 2.00 73 2.50 Lincoln 15 10 2.17 31 Liverpool John Moores 0 2.34 Teesside 0 2.00
=74 2.15 Nottingham Trent 14 6 2.16 31 Glyndwr 7 2.32 Manchester Met 20 2.00 =74 2.00 UWS 14 4 2.16 30 Coventry 5 2.30 Glasgow Caledonian 0 1.90
76 n/a UEL 4 4 2.11 8 Westminster 0 2.19 Northumbria 0 1.80 77 1.75 Liverpool Hope 7 0 2.10 15 Robert Gordon 0 2.17 Robert Gordon 0 1.70 78 2.35 Robert Gordon 19 0 2.05 38 Greenwich 8 2.14 Middlesex 0 1.63
=79 n/a Birmingham City 7 8 2.04 15 Salford 2 2.14 UWS 0 1.50 =79 2.35 Glyndwr 6 5 2.04 13 Birmingham City 0 2.13 Liverpool Hope 0 1.50
81 2.05 Westminster 20 0 2.03 40 South Wales 0 2.09 Bangor 0 1.40 82 n/a Derby 12 4 1.91 23 London Met 0 2.04 Edge Hill 0 1.30 83 2.05 Staffordshire 8 0 1.74 14 Nottingham Trent 0 1.87 Glyndwr 0 1.20 84 1.90 Sunderland 13 0 1.70 22 Chester 0 1.79 West London 0 1.10 85 1.50 London Met 5 0 1.64 9 West London 0 1.77 UEL 0 1.10 86 n/a Leeds Beckett 9 0 1.52 14 Staffordshire 0 1.65 Derby 0 1.00 87 1.65 West London 10 0 1.51 15 Sunderland 0 1.64 Lincoln 0 0.70 88 n/a Chester 4 0 1.30 5 Leeds Beckett 0 1.39 London Met 0 0.70 89 n/a Edge Hill 5 0 1.29 6 Edge Hill 0 1.27 Chester 0 0.20
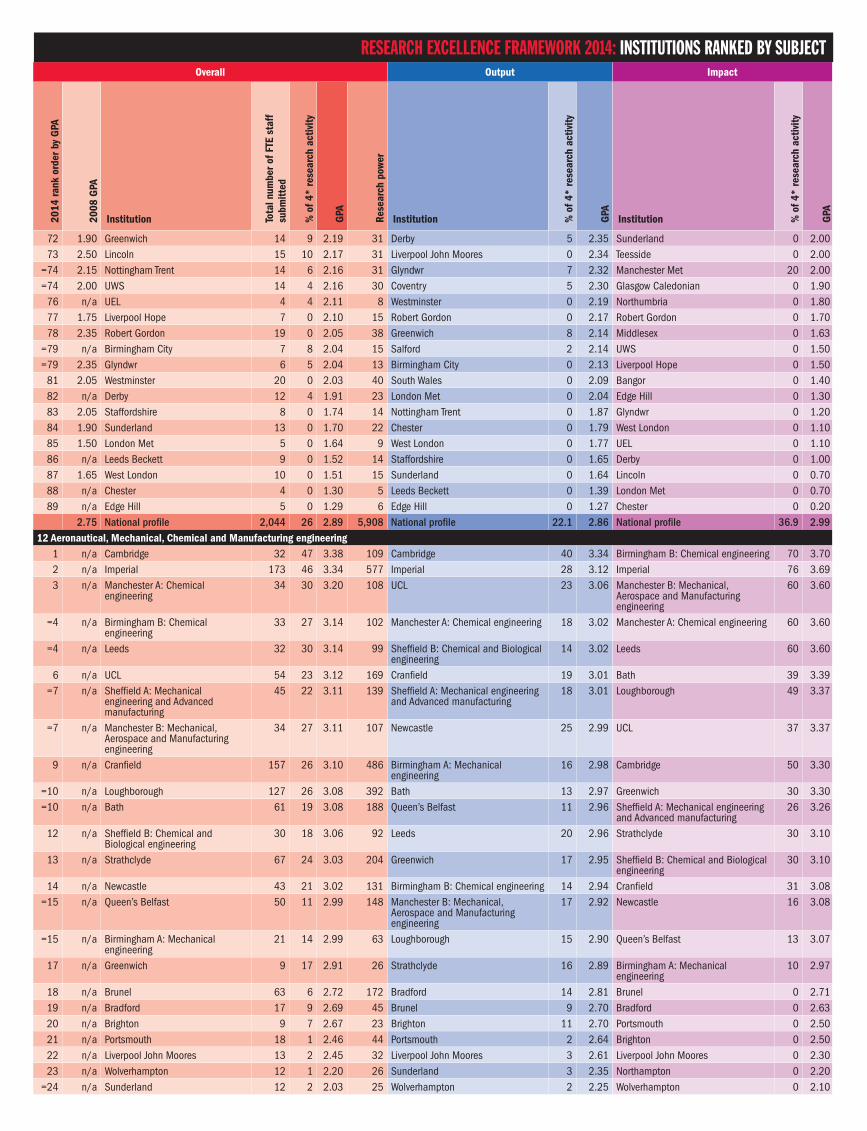
2.75 National profile 2,044 26 2.89 5,908 National profile 22.1 2.86 National profile 36.9 2.99 12 Aeronautical, Mechanical, Chemical and Manufacturing engineering
1 n/a Cambridge 32 47 3.38 109 Cambridge 40 3.34 Birmingham B: Chemical engineering 70 3.70 2 n/a Imperial 173 46 3.34 577 Imperial 28 3.12 Imperial 76 3.69 3 n/a Manchester A: Chemical
engineering 34 30 3.20 108 UCL 23 3.06 Manchester B: Mechanical,
Aerospace and Manufacturing engineering
60 3.60
=4 n/a Birmingham B: Chemical engineering
33 27 3.14 102 Manchester A: Chemical engineering 18 3.02 Manchester A: Chemical engineering 60 3.60
=4 n/a Leeds 32 30 3.14 99 Sheffield B: Chemical and Biological engineering
14 3.02 Leeds 60 3.60
6 n/a UCL 54 23 3.12 169 Cranfield 19 3.01 Bath 39 3.39 =7 n/a Sheffield A: Mechanical
engineering and Advanced manufacturing
45 22 3.11 139 Sheffield A: Mechanical engineering and Advanced manufacturing
18 3.01 Loughborough 49 3.37
=7 n/a Manchester B: Mechanical, Aerospace and Manufacturing engineering
34 27 3.11 107 Newcastle 25 2.99 UCL 37 3.37
9 n/a Cranfield 157 26 3.10 486 Birmingham A: Mechanical engineering
16 2.98 Cambridge 50 3.30
=10 n/a Loughborough 127 26 3.08 392 Bath 13 2.97 Greenwich 30 3.30 =10 n/a Bath 61 19 3.08 188 Queen’s Belfast 11 2.96 Sheffield A: Mechanical engineering
and Advanced manufacturing 26 3.26
12 n/a Sheffield B: Chemical and Biological engineering
30 18 3.06 92 Leeds 20 2.96 Strathclyde 30 3.10
13 n/a Strathclyde 67 24 3.03 204 Greenwich 17 2.95 Sheffield B: Chemical and Biological engineering
30 3.10
14 n/a Newcastle 43 21 3.02 131 Birmingham B: Chemical engineering 14 2.94 Cranfield 31 3.08 =15 n/a Queen’s Belfast 50 11 2.99 148 Manchester B: Mechanical,
Aerospace and Manufacturing engineering
17 2.92 Newcastle 16 3.08
=15 n/a Birmingham A: Mechanical engineering
21 14 2.99 63 Loughborough 15 2.90 Queen’s Belfast 13 3.07
17 n/a Greenwich 9 17 2.91 26 Strathclyde 16 2.89 Birmingham A: Mechanical engineering
10 2.97
18 n/a Brunel 63 6 2.72 172 Bradford 14 2.81 Brunel 0 2.71 19 n/a Bradford 17 9 2.69 45 Brunel 9 2.70 Bradford 0 2.63 20 n/a Brighton 9 7 2.67 23 Brighton 11 2.70 Portsmouth 0 2.50 21 n/a Portsmouth 18 1 2.46 44 Portsmouth 2 2.64 Brighton 0 2.50 22 n/a Liverpool John Moores 13 2 2.45 32 Liverpool John Moores 3 2.61 Liverpool John Moores 0 2.30 23 n/a Wolverhampton 12 1 2.20 26 Sunderland 3 2.35 Northampton 0 2.20
=24 n/a Sunderland 12 2 2.03 25 Wolverhampton 2 2.25 Wolverhampton 0 2.10
RESEARCH EXCELLENCE FRAMEWORK 2014: INSTITUTIONS RANKED BY SUBJECT
Overall Output Impact
2014
rank
ord
er b
y G
PA
2008
GPA
Institution Tota
l num
ber o
f FTE
sta
ff
subm
itted
% o
f 4*
rese
arch
act
ivity
GPA
Rese
arch
pow
er
Institution % o
f 4*
rese
arch
act
ivity
GPA
Institution % o
f 4*
rese
arch
act
ivity
GPA
=24 n/a Northampton 7 0 2.03 14 Northampton 0 2.07 Sunderland 0 1.80
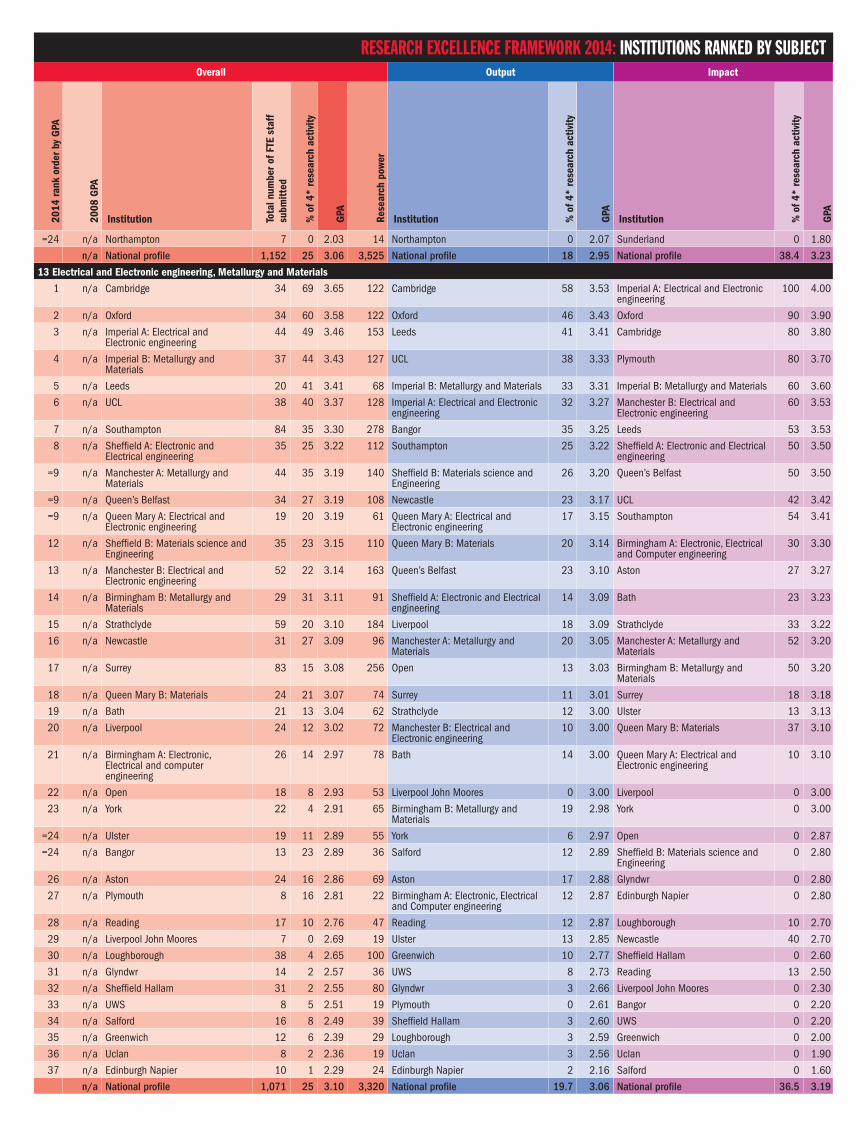
n/a National profile 1,152 25 3.06 3,525 National profile 18 2.95 National profile 38.4 3.23
13 Electrical and Electronic engineering, Metallurgy and Materials
1 n/a Cambridge 34 69 3.65 122 Cambridge 58 3.53 Imperial A: Electrical and Electronic engineering
100 4.00
2 n/a Oxford 34 60 3.58 122 Oxford 46 3.43 Oxford 90 3.90
3 n/a Imperial A: Electrical and Electronic engineering
44 49 3.46 153 Leeds 41 3.41 Cambridge 80 3.80
4 n/a Imperial B: Metallurgy and Materials
37 44 3.43 127 UCL 38 3.33 Plymouth 80 3.70
5 n/a Leeds 20 41 3.41 68 Imperial B: Metallurgy and Materials 33 3.31 Imperial B: Metallurgy and Materials 60 3.60
6 n/a UCL 38 40 3.37 128 Imperial A: Electrical and Electronic engineering
32 3.27 Manchester B: Electrical and Electronic engineering
60 3.53
7 n/a Southampton 84 35 3.30 278 Bangor 35 3.25 Leeds 53 3.53
8 n/a Sheffield A: Electronic and Electrical engineering
35 25 3.22 112 Southampton 25 3.22 Sheffield A: Electronic and Electrical engineering
50 3.50
=9 n/a Manchester A: Metallurgy and Materials
44 35 3.19 140 Sheffield B: Materials science and Engineering
26 3.20 Queen’s Belfast 50 3.50
=9 n/a Queen’s Belfast 34 27 3.19 108 Newcastle 23 3.17 UCL 42 3.42
=9 n/a Queen Mary A: Electrical and Electronic engineering
19 20 3.19 61 Queen Mary A: Electrical and Electronic engineering
17 3.15 Southampton 54 3.41
12 n/a Sheffield B: Materials science and Engineering
35 23 3.15 110 Queen Mary B: Materials 20 3.14 Birmingham A: Electronic, Electrical and Computer engineering
30 3.30
13 n/a Manchester B: Electrical and Electronic engineering
52 22 3.14 163 Queen’s Belfast 23 3.10 Aston 27 3.27
14 n/a Birmingham B: Metallurgy and Materials
29 31 3.11 91 Sheffield A: Electronic and Electrical engineering
14 3.09 Bath 23 3.23
15 n/a Strathclyde 59 20 3.10 184 Liverpool 18 3.09 Strathclyde 33 3.22
16 n/a Newcastle 31 27 3.09 96 Manchester A: Metallurgy and Materials
20 3.05 Manchester A: Metallurgy and Materials
52 3.20
17 n/a Surrey 83 15 3.08 256 Open 13 3.03 Birmingham B: Metallurgy and Materials
50 3.20
18 n/a Queen Mary B: Materials 24 21 3.07 74 Surrey 11 3.01 Surrey 18 3.18
19 n/a Bath 21 13 3.04 62 Strathclyde 12 3.00 Ulster 13 3.13
20 n/a Liverpool 24 12 3.02 72 Manchester B: Electrical and Electronic engineering
10 3.00 Queen Mary B: Materials 37 3.10
21 n/a Birmingham A: Electronic, Electrical and computer engineering
26 14 2.97 78 Bath 14 3.00 Queen Mary A: Electrical and Electronic engineering
10 3.10
22 n/a Open 18 8 2.93 53 Liverpool John Moores 0 3.00 Liverpool 0 3.00
23 n/a York 22 4 2.91 65 Birmingham B: Metallurgy and Materials
19 2.98 York 0 3.00
=24 n/a Ulster 19 11 2.89 55 York 6 2.97 Open 0 2.87
=24 n/a Bangor 13 23 2.89 36 Salford 12 2.89 Sheffield B: Materials science and Engineering
0 2.80
26 n/a Aston 24 16 2.86 69 Aston 17 2.88 Glyndwr 0 2.80
27 n/a Plymouth 8 16 2.81 22 Birmingham A: Electronic, Electrical and Computer engineering
12 2.87 Edinburgh Napier 0 2.80
28 n/a Reading 17 10 2.76 47 Reading 12 2.87 Loughborough 10 2.70
29 n/a Liverpool John Moores 7 0 2.69 19 Ulster 13 2.85 Newcastle 40 2.70
30 n/a Loughborough 38 4 2.65 100 Greenwich 10 2.77 Sheffield Hallam 0 2.60
31 n/a Glyndwr 14 2 2.57 36 UWS 8 2.73 Reading 13 2.50
32 n/a Sheffield Hallam 31 2 2.55 80 Glyndwr 3 2.66 Liverpool John Moores 0 2.30
33 n/a UWS 8 5 2.51 19 Plymouth 0 2.61 Bangor 0 2.20
34 n/a Salford 16 8 2.49 39 Sheffield Hallam 3 2.60 UWS 0 2.20
35 n/a Greenwich 12 6 2.39 29 Loughborough 3 2.59 Greenwich 0 2.00
36 n/a Uclan 8 2 2.36 19 Uclan 3 2.56 Uclan 0 1.90
37 n/a Edinburgh Napier 10 1 2.29 24 Edinburgh Napier 2 2.16 Salford 0 1.60
n/a National profile 1,071 25 3.10 3,320 National profile 19.7 3.06 National profile 36.5 3.19
RESEARCH EXCELLENCE FRAMEWORK 2014: INSTITUTIONS RANKED BY SUBJECT
Overall Output Impact
2014
rank
ord
er b
y G
PA
2008
GPA
Institution Tota
l num
ber o
f FTE
sta
ff
subm
itted
% o
f 4*
rese
arch
act
ivity
GPA
Rese
arch
pow
er
Institution % o
f 4*
rese
arch
act
ivity
GPA
Institution % o
f 4*
rese
arch
act
ivity
GPA
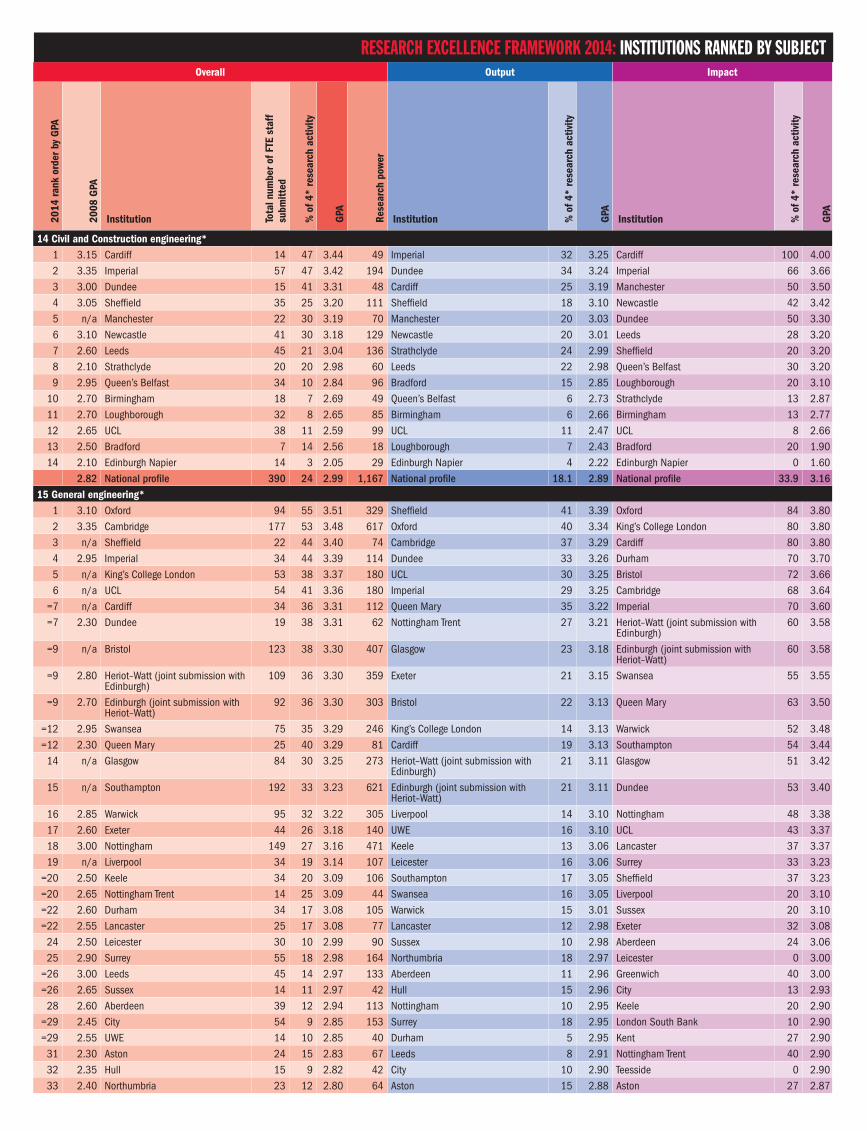
14 Civil and Construction engineering*1 3.15 Cardiff 14 47 3.44 49 Imperial 32 3.25 Cardiff 100 4.00 2 3.35 Imperial 57 47 3.42 194 Dundee 34 3.24 Imperial 66 3.66 3 3.00 Dundee 15 41 3.31 48 Cardiff 25 3.19 Manchester 50 3.50 4 3.05 Sheffield 35 25 3.20 111 Sheffield 18 3.10 Newcastle 42 3.42 5 n/a Manchester 22 30 3.19 70 Manchester 20 3.03 Dundee 50 3.30 6 3.10 Newcastle 41 30 3.18 129 Newcastle 20 3.01 Leeds 28 3.20 7 2.60 Leeds 45 21 3.04 136 Strathclyde 24 2.99 Sheffield 20 3.20 8 2.10 Strathclyde 20 20 2.98 60 Leeds 22 2.98 Queen’s Belfast 30 3.20 9 2.95 Queen’s Belfast 34 10 2.84 96 Bradford 15 2.85 Loughborough 20 3.10
10 2.70 Birmingham 18 7 2.69 49 Queen’s Belfast 6 2.73 Strathclyde 13 2.87 11 2.70 Loughborough 32 8 2.65 85 Birmingham 6 2.66 Birmingham 13 2.77 12 2.65 UCL 38 11 2.59 99 UCL 11 2.47 UCL 8 2.66 13 2.50 Bradford 7 14 2.56 18 Loughborough 7 2.43 Bradford 20 1.90 14 2.10 Edinburgh Napier 14 3 2.05 29 Edinburgh Napier 4 2.22 Edinburgh Napier 0 1.60
2.82 National profile 390 24 2.99 1,167 National profile 18.1 2.89 National profile 33.9 3.16 15 General engineering*
1 3.10 Oxford 94 55 3.51 329 Sheffield 41 3.39 Oxford 84 3.80 2 3.35 Cambridge 177 53 3.48 617 Oxford 40 3.34 King’s College London 80 3.80 3 n/a Sheffield 22 44 3.40 74 Cambridge 37 3.29 Cardiff 80 3.80 4 2.95 Imperial 34 44 3.39 114 Dundee 33 3.26 Durham 70 3.70 5 n/a King’s College London 53 38 3.37 180 UCL 30 3.25 Bristol 72 3.66 6 n/a UCL 54 41 3.36 180 Imperial 29 3.25 Cambridge 68 3.64
=7 n/a Cardiff 34 36 3.31 112 Queen Mary 35 3.22 Imperial 70 3.60 =7 2.30 Dundee 19 38 3.31 62 Nottingham Trent 27 3.21 Heriot–Watt (joint submission with
Edinburgh)60 3.58
=9 n/a Bristol 123 38 3.30 407 Glasgow 23 3.18 Edinburgh (joint submission with Heriot–Watt)
60 3.58
=9 2.80 Heriot–Watt (joint submission with Edinburgh)
109 36 3.30 359 Exeter 21 3.15 Swansea 55 3.55
=9 2.70 Edinburgh (joint submission with Heriot–Watt)
92 36 3.30 303 Bristol 22 3.13 Queen Mary 63 3.50
=12 2.95 Swansea 75 35 3.29 246 King’s College London 14 3.13 Warwick 52 3.48 =12 2.30 Queen Mary 25 40 3.29 81 Cardiff 19 3.13 Southampton 54 3.44
14 n/a Glasgow 84 30 3.25 273 Heriot–Watt (joint submission with Edinburgh)
21 3.11 Glasgow 51 3.42
15 n/a Southampton 192 33 3.23 621 Edinburgh (joint submission with Heriot–Watt)
21 3.11 Dundee 53 3.40
16 2.85 Warwick 95 32 3.22 305 Liverpool 14 3.10 Nottingham 48 3.38 17 2.60 Exeter 44 26 3.18 140 UWE 16 3.10 UCL 43 3.37 18 3.00 Nottingham 149 27 3.16 471 Keele 13 3.06 Lancaster 37 3.37 19 n/a Liverpool 34 19 3.14 107 Leicester 16 3.06 Surrey 33 3.23
=20 2.50 Keele 34 20 3.09 106 Southampton 17 3.05 Sheffield 37 3.23 =20 2.65 Nottingham Trent 14 25 3.09 44 Swansea 16 3.05 Liverpool 20 3.10 =22 2.60 Durham 34 17 3.08 105 Warwick 15 3.01 Sussex 20 3.10 =22 2.55 Lancaster 25 17 3.08 77 Lancaster 12 2.98 Exeter 32 3.08
24 2.50 Leicester 30 10 2.99 90 Sussex 10 2.98 Aberdeen 24 3.06 25 2.90 Surrey 55 18 2.98 164 Northumbria 18 2.97 Leicester 0 3.00
=26 3.00 Leeds 45 14 2.97 133 Aberdeen 11 2.96 Greenwich 40 3.00 =26 2.65 Sussex 14 11 2.97 42 Hull 15 2.96 City 13 2.93
28 2.60 Aberdeen 39 12 2.94 113 Nottingham 10 2.95 Keele 20 2.90 =29 2.45 City 54 9 2.85 153 Surrey 18 2.95 London South Bank 10 2.90 =29 2.55 UWE 14 10 2.85 40 Durham 5 2.95 Kent 27 2.90
31 2.30 Aston 24 15 2.83 67 Leeds 8 2.91 Nottingham Trent 40 2.90 32 2.35 Hull 15 9 2.82 42 City 10 2.90 Teesside 0 2.90 33 2.40 Northumbria 23 12 2.80 64 Aston 15 2.88 Aston 27 2.87
RESEARCH EXCELLENCE FRAMEWORK 2014: INSTITUTIONS RANKED BY SUBJECT
Overall Output Impact
2014
rank
ord
er b
y G
PA
2008
GPA
Institution Tota
l num
ber o
f FTE
sta
ff
subm
itted
% o
f 4*
rese
arch
act
ivity
GPA
Rese
arch
pow
er
Institution % o
f 4*
rese
arch
act
ivity
GPA
Institution % o
f 4*
rese
arch
act
ivity
GPA
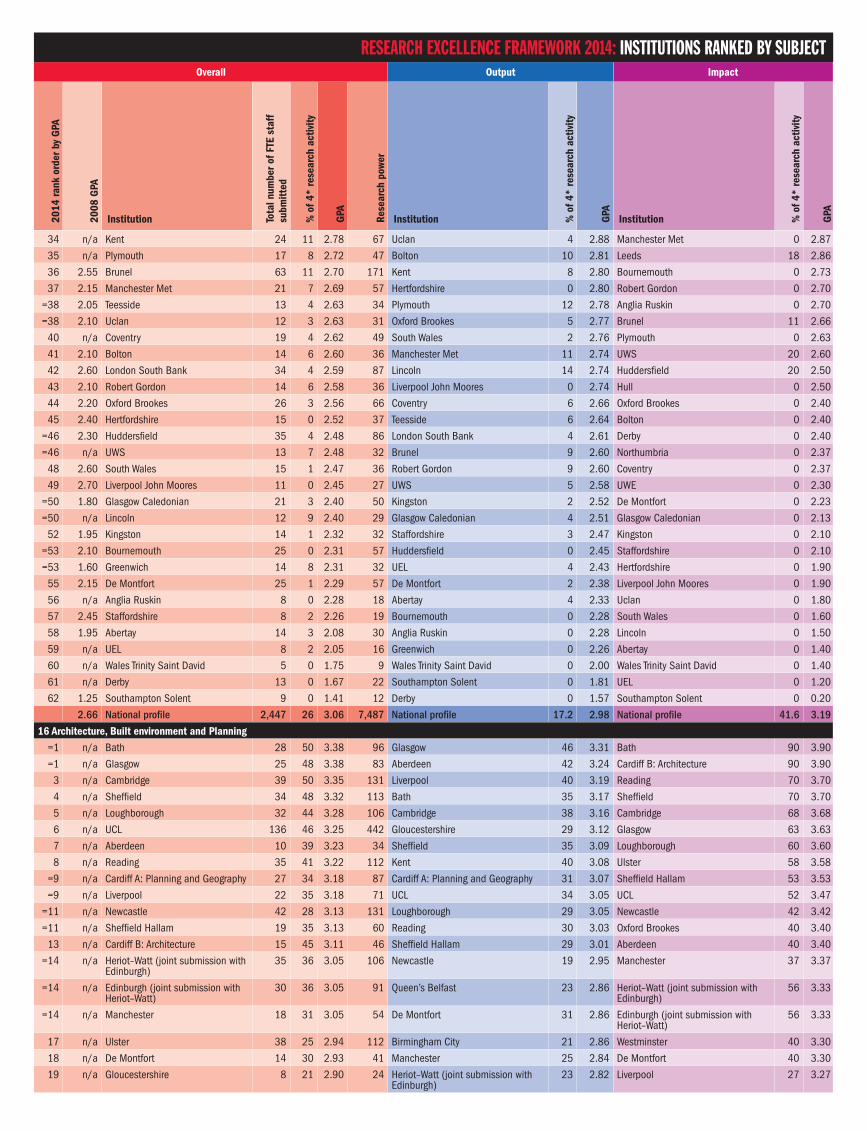
34 n/a Kent 24 11 2.78 67 Uclan 4 2.88 Manchester Met 0 2.87
35 n/a Plymouth 17 8 2.72 47 Bolton 10 2.81 Leeds 18 2.86
36 2.55 Brunel 63 11 2.70 171 Kent 8 2.80 Bournemouth 0 2.73
37 2.15 Manchester Met 21 7 2.69 57 Hertfordshire 0 2.80 Robert Gordon 0 2.70
=38 2.05 Teesside 13 4 2.63 34 Plymouth 12 2.78 Anglia Ruskin 0 2.70
=38 2.10 Uclan 12 3 2.63 31 Oxford Brookes 5 2.77 Brunel 11 2.66
40 n/a Coventry 19 4 2.62 49 South Wales 2 2.76 Plymouth 0 2.63
41 2.10 Bolton 14 6 2.60 36 Manchester Met 11 2.74 UWS 20 2.60
42 2.60 London South Bank 34 4 2.59 87 Lincoln 14 2.74 Huddersfield 20 2.50
43 2.10 Robert Gordon 14 6 2.58 36 Liverpool John Moores 0 2.74 Hull 0 2.50
44 2.20 Oxford Brookes 26 3 2.56 66 Coventry 6 2.66 Oxford Brookes 0 2.40
45 2.40 Hertfordshire 15 0 2.52 37 Teesside 6 2.64 Bolton 0 2.40
=46 2.30 Huddersfield 35 4 2.48 86 London South Bank 4 2.61 Derby 0 2.40
=46 n/a UWS 13 7 2.48 32 Brunel 9 2.60 Northumbria 0 2.37
48 2.60 South Wales 15 1 2.47 36 Robert Gordon 9 2.60 Coventry 0 2.37
49 2.70 Liverpool John Moores 11 0 2.45 27 UWS 5 2.58 UWE 0 2.30
=50 1.80 Glasgow Caledonian 21 3 2.40 50 Kingston 2 2.52 De Montfort 0 2.23
=50 n/a Lincoln 12 9 2.40 29 Glasgow Caledonian 4 2.51 Glasgow Caledonian 0 2.13
52 1.95 Kingston 14 1 2.32 32 Staffordshire 3 2.47 Kingston 0 2.10
=53 2.10 Bournemouth 25 0 2.31 57 Huddersfield 0 2.45 Staffordshire 0 2.10
=53 1.60 Greenwich 14 8 2.31 32 UEL 4 2.43 Hertfordshire 0 1.90
55 2.15 De Montfort 25 1 2.29 57 De Montfort 2 2.38 Liverpool John Moores 0 1.90
56 n/a Anglia Ruskin 8 0 2.28 18 Abertay 4 2.33 Uclan 0 1.80
57 2.45 Staffordshire 8 2 2.26 19 Bournemouth 0 2.28 South Wales 0 1.60
58 1.95 Abertay 14 3 2.08 30 Anglia Ruskin 0 2.28 Lincoln 0 1.50
59 n/a UEL 8 2 2.05 16 Greenwich 0 2.26 Abertay 0 1.40
60 n/a Wales Trinity Saint David 5 0 1.75 9 Wales Trinity Saint David 0 2.00 Wales Trinity Saint David 0 1.40
61 n/a Derby 13 0 1.67 22 Southampton Solent 0 1.81 UEL 0 1.20
62 1.25 Southampton Solent 9 0 1.41 12 Derby 0 1.57 Southampton Solent 0 0.20
2.66 National profile 2,447 26 3.06 7,487 National profile 17.2 2.98 National profile 41.6 3.19
16 Architecture, Built environment and Planning
=1 n/a Bath 28 50 3.38 96 Glasgow 46 3.31 Bath 90 3.90
=1 n/a Glasgow 25 48 3.38 83 Aberdeen 42 3.24 Cardiff B: Architecture 90 3.90
3 n/a Cambridge 39 50 3.35 131 Liverpool 40 3.19 Reading 70 3.70
4 n/a Sheffield 34 48 3.32 113 Bath 35 3.17 Sheffield 70 3.70
5 n/a Loughborough 32 44 3.28 106 Cambridge 38 3.16 Cambridge 68 3.68
6 n/a UCL 136 46 3.25 442 Gloucestershire 29 3.12 Glasgow 63 3.63
7 n/a Aberdeen 10 39 3.23 34 Sheffield 35 3.09 Loughborough 60 3.60
8 n/a Reading 35 41 3.22 112 Kent 40 3.08 Ulster 58 3.58
=9 n/a Cardiff A: Planning and Geography 27 34 3.18 87 Cardiff A: Planning and Geography 31 3.07 Sheffield Hallam 53 3.53
=9 n/a Liverpool 22 35 3.18 71 UCL 34 3.05 UCL 52 3.47
=11 n/a Newcastle 42 28 3.13 131 Loughborough 29 3.05 Newcastle 42 3.42
=11 n/a Sheffield Hallam 19 35 3.13 60 Reading 30 3.03 Oxford Brookes 40 3.40
13 n/a Cardiff B: Architecture 15 45 3.11 46 Sheffield Hallam 29 3.01 Aberdeen 40 3.40
=14 n/a Heriot–Watt (joint submission with Edinburgh)
35 36 3.05 106 Newcastle 19 2.95 Manchester 37 3.37
=14 n/a Edinburgh (joint submission with Heriot–Watt)
30 36 3.05 91 Queen’s Belfast 23 2.86 Heriot–Watt (joint submission with Edinburgh)
56 3.33
=14 n/a Manchester 18 31 3.05 54 De Montfort 31 2.86 Edinburgh (joint submission with Heriot–Watt)
56 3.33
17 n/a Ulster 38 25 2.94 112 Birmingham City 21 2.86 Westminster 40 3.30
18 n/a De Montfort 14 30 2.93 41 Manchester 25 2.84 De Montfort 40 3.30
19 n/a Gloucestershire 8 21 2.90 24 Heriot–Watt (joint submission with Edinburgh)
23 2.82 Liverpool 27 3.27
RESEARCH EXCELLENCE FRAMEWORK 2014: INSTITUTIONS RANKED BY SUBJECT
Overall Output Impact
2014
rank
ord
er b
y G
PA
2008
GPA
Institution Tota
l num
ber o
f FTE
sta
ff
subm
itted
% o
f 4*
rese
arch
act
ivity
GPA
Rese
arch
pow
er
Institution % o
f 4*
rese
arch
act
ivity
GPA
Institution % o
f 4*
rese
arch
act
ivity
GPA
=20 n/a Oxford Brookes 32 23 2.89 93 Edinburgh (joint submission with Heriot–Watt)
23 2.82 Cardiff A: Planning and Geography 20 3.20
=20 n/a Queen’s Belfast 31 21 2.89 88 Oxford Brookes 21 2.78 Queen’s Belfast 20 3.10
22 n/a Westminster 25 20 2.80 71 Cardiff B: Architecture 30 2.78 Salford 13 3.00
23 n/a UWE 31 10 2.71 83 Westminster 19 2.73 UWE 20 3.00
24 n/a Salford 49 16 2.69 131 Plymouth 11 2.64 Nottingham 0 3.00
25 n/a Birmingham City 4 14 2.66 11 Ulster 10 2.62 Glasgow Caledonian 0 2.90
26 n/a Nottingham 24 10 2.65 64 UEL 30 2.60 Strathclyde 40 2.80
27 n/a Kent 11 26 2.62 30 UWE 4 2.52 Liverpool John Moores 0 2.73
28 n/a Strathclyde 15 17 2.53 37 Northumbria 4 2.49 Northumbria 27 2.63
=29 n/a Glasgow Caledonian 22 6 2.52 54 Strathclyde 14 2.46 Edinburgh Napier 40 2.60
=29 n/a Northumbria 18 10 2.52 46 Salford 9 2.45 Gloucestershire 0 2.50
31 n/a Edinburgh Napier 8 14 2.50 20 Edinburgh Napier 6 2.44 Birmingham City 0 2.50
32 n/a Liverpool John Moores 17 7 2.49 43 Nottingham 7 2.42 Nottingham Trent 0 2.40
33 n/a Plymouth 13 7 2.45 32 London Met 4 2.40 Leeds Beckett 27 2.37
34 n/a UEL 5 20 2.41 13 Anglia Ruskin 13 2.38 UEL 0 2.10
35 n/a Nottingham Trent 11 9 2.34 26 Nottingham Trent 15 2.37 Plymouth 0 2.00
36 n/a Leeds Beckett 18 15 2.30 42 Uclan 5 2.37 London Met 0 2.00
37 n/a Uclan 10 3 2.23 22 Leeds Beckett 15 2.34 Uclan 0 2.00
38 n/a London Met 12 3 2.22 27 Greenwich 9 2.32 Greenwich 0 2.00
39 n/a Greenwich 6 6 2.20 13 Glasgow Caledonian 6 2.31 Wolverhampton 0 1.90
40 n/a Anglia Ruskin 8 8 2.11 17 Liverpool John Moores 5 2.30 Kent 0 1.60
41 n/a Wolverhampton 14 5 2.09 28 Dundee 10 2.27 Robert Gordon 0 1.50
42 n/a Dundee 9 7 2.00 18 Wolverhampton 7 2.16 Anglia Ruskin 0 1.50
43 n/a Lincoln 6 5 1.94 12 Lincoln 7 2.15 Dundee 0 1.30
44 n/a Robert Gordon 15 7 1.89 28 Bolton 5 1.74 Lincoln 0 1.20
45 n/a Bolton 4 3 1.38 6 Robert Gordon 2 1.72 Bolton 0 0.30
n/a National profile 1,025 29 2.92 2,992 National profile 22.7 2.79 National profile 38.4 3.14
17 Geography, Environmental studies and Archaeology
1 n/a Bristol A: Geography 46 51 3.33 155 LSE 34 3.18 St Andrews 76 3.76
=2 n/a Cambridge B: Geography 46 44 3.26 149 Glasgow A: Geography 39 3.18 Leicester A: Archaeology 73 3.73
=2 n/a Royal Holloway 24 41 3.26 77 Bristol A: Geography 40 3.14 Hull 70 3.70
4 n/a LSE 36 43 3.25 118 Newcastle B: Geography 33 3.13 Sussex 80 3.70
5 n/a St Andrews 37 42 3.24 118 Southampton B: Geography 32 3.09 York 63 3.63
=6 n/a Oxford B: Geography and Environmental studies
54 41 3.23 174 Oxford B: Geography and Environmental studies
29 3.07 Newcastle B: Geography 70 3.60
=6 n/a Glasgow A: Geography 13 37 3.23 42 Cambridge B: Geography 33 3.07 Royal Holloway 60 3.60
=8 n/a UCL B: Geography 40 41 3.19 129 Queen Mary 28 3.05 Bradford 60 3.60
=8 n/a Oxford A: Archaeology 33 41 3.19 106 Liverpool B: Archaeology 30 3.05 Exeter B: Archaeology 60 3.60
10 n/a Durham B: Geography 63 43 3.18 200 Royal Holloway 27 3.03 UCL B: Geography 66 3.58
11 n/a Newcastle B: Geography 27 35 3.17 86 Reading A: Archaeology 32 3.03 Cambridge B: Geography 57 3.57
=12 n/a Southampton B: Geography 32 32 3.13 100 Durham B: Geography 32 3.01 Bristol A: Geography 57 3.50
=12 n/a Queen Mary 31 34 3.13 98 Oxford A: Archaeology 34 3.01 Swansea 50 3.50
14 n/a Durham A: Archaeology 25 38 3.11 77 UCL B: Geography 31 2.99 Birmingham 50 3.50
15 n/a UCL A: Archaeology 61 42 3.10 189 Cardiff 31 2.98 Southampton A: Archaeology 50 3.50
16 n/a York 19 42 3.09 58 Exeter A: Geography and Environmental studies
27 2.97 Aberystwyth 42 3.42
=17 n/a Leicester A: Archaeology 19 35 3.08 60 Nottingham B: Geography 29 2.97 Oxford A: Archaeology 40 3.40
=17 n/a Reading A: Archaeology 19 30 3.08 59 Durham A: Archaeology 29 2.95 Manchester A: Geography 50 3.40
=19 n/a Leeds 49 32 3.07 150 Sheffield B: Geography 22 2.95 Sheffield A: Archaeology 40 3.40
=19 n/a Cambridge A: Archaeology 43 35 3.07 131 Leeds 24 2.94 Middlesex 40 3.40
=19 n/a Liverpool B: Archaeology 16 31 3.07 49 Open 30 2.94 Glasgow A: Geography 40 3.40
=22 n/a Exeter A: Geography and Environmental studies
52 31 3.05 158 King’s College London 23 2.93 Sheffield B: Geography 37 3.37
RESEARCH EXCELLENCE FRAMEWORK 2014: INSTITUTIONS RANKED BY SUBJECT
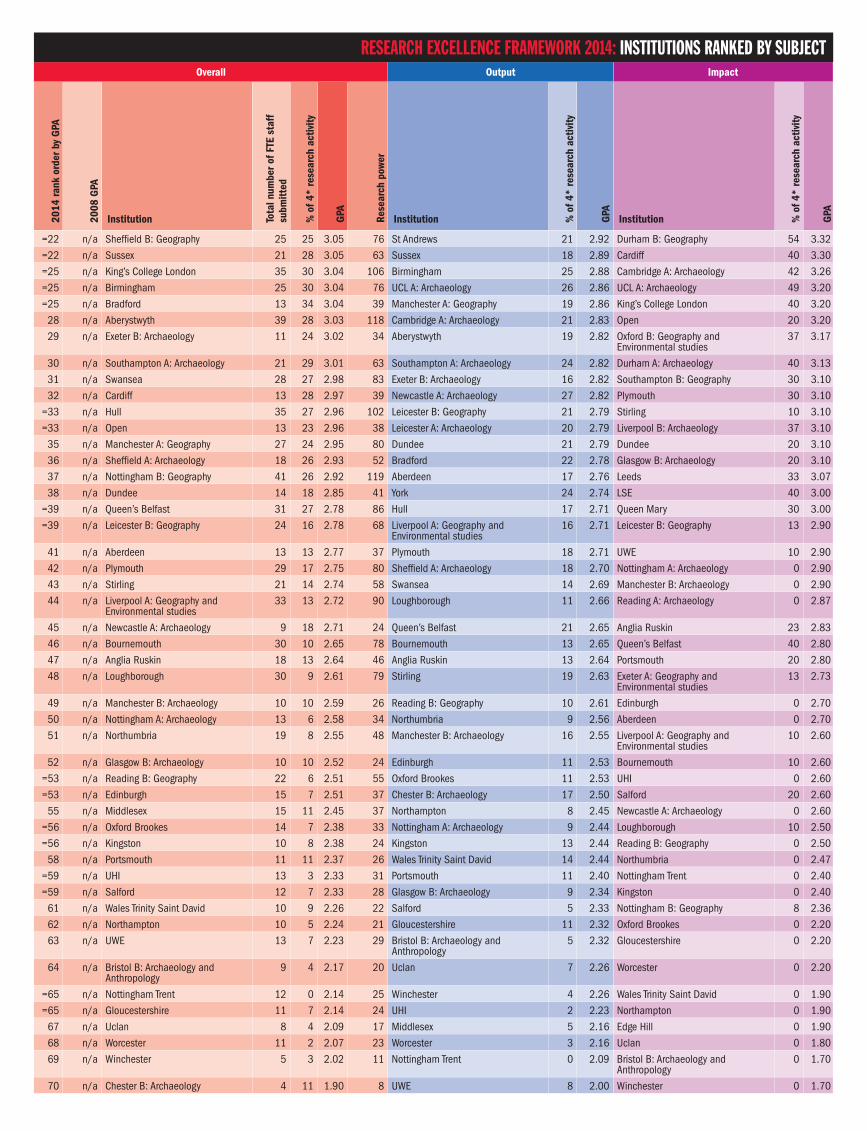
Overall Output Impact
2014
rank
ord
er b
y G
PA
2008
GPA
Institution Tota
l num
ber o
f FTE
sta
ff
subm
itted
% o
f 4*
rese
arch
act
ivity
GPA
Rese
arch
pow
er
Institution % o
f 4*
rese
arch
act
ivity
GPA
Institution % o
f 4*
rese
arch
act
ivity
GPA
=22 n/a Sheffield B: Geography 25 25 3.05 76 St Andrews 21 2.92 Durham B: Geography 54 3.32
=22 n/a Sussex 21 28 3.05 63 Sussex 18 2.89 Cardiff 40 3.30
=25 n/a King’s College London 35 30 3.04 106 Birmingham 25 2.88 Cambridge A: Archaeology 42 3.26
=25 n/a Birmingham 25 30 3.04 76 UCL A: Archaeology 26 2.86 UCL A: Archaeology 49 3.20
=25 n/a Bradford 13 34 3.04 39 Manchester A: Geography 19 2.86 King’s College London 40 3.20
28 n/a Aberystwyth 39 28 3.03 118 Cambridge A: Archaeology 21 2.83 Open 20 3.20
29 n/a Exeter B: Archaeology 11 24 3.02 34 Aberystwyth 19 2.82 Oxford B: Geography and Environmental studies
37 3.17
30 n/a Southampton A: Archaeology 21 29 3.01 63 Southampton A: Archaeology 24 2.82 Durham A: Archaeology 40 3.13
31 n/a Swansea 28 27 2.98 83 Exeter B: Archaeology 16 2.82 Southampton B: Geography 30 3.10
32 n/a Cardiff 13 28 2.97 39 Newcastle A: Archaeology 27 2.82 Plymouth 30 3.10
=33 n/a Hull 35 27 2.96 102 Leicester B: Geography 21 2.79 Stirling 10 3.10
=33 n/a Open 13 23 2.96 38 Leicester A: Archaeology 20 2.79 Liverpool B: Archaeology 37 3.10
35 n/a Manchester A: Geography 27 24 2.95 80 Dundee 21 2.79 Dundee 20 3.10
36 n/a Sheffield A: Archaeology 18 26 2.93 52 Bradford 22 2.78 Glasgow B: Archaeology 20 3.10
37 n/a Nottingham B: Geography 41 26 2.92 119 Aberdeen 17 2.76 Leeds 33 3.07
38 n/a Dundee 14 18 2.85 41 York 24 2.74 LSE 40 3.00
=39 n/a Queen’s Belfast 31 27 2.78 86 Hull 17 2.71 Queen Mary 30 3.00
=39 n/a Leicester B: Geography 24 16 2.78 68 Liverpool A: Geography and Environmental studies
16 2.71 Leicester B: Geography 13 2.90
41 n/a Aberdeen 13 13 2.77 37 Plymouth 18 2.71 UWE 10 2.90
42 n/a Plymouth 29 17 2.75 80 Sheffield A: Archaeology 18 2.70 Nottingham A: Archaeology 0 2.90
43 n/a Stirling 21 14 2.74 58 Swansea 14 2.69 Manchester B: Archaeology 0 2.90
44 n/a Liverpool A: Geography and Environmental studies
33 13 2.72 90 Loughborough 11 2.66 Reading A: Archaeology 0 2.87
45 n/a Newcastle A: Archaeology 9 18 2.71 24 Queen’s Belfast 21 2.65 Anglia Ruskin 23 2.83
46 n/a Bournemouth 30 10 2.65 78 Bournemouth 13 2.65 Queen’s Belfast 40 2.80
47 n/a Anglia Ruskin 18 13 2.64 46 Anglia Ruskin 13 2.64 Portsmouth 20 2.80
48 n/a Loughborough 30 9 2.61 79 Stirling 19 2.63 Exeter A: Geography and Environmental studies
13 2.73
49 n/a Manchester B: Archaeology 10 10 2.59 26 Reading B: Geography 10 2.61 Edinburgh 0 2.70
50 n/a Nottingham A: Archaeology 13 6 2.58 34 Northumbria 9 2.56 Aberdeen 0 2.70
51 n/a Northumbria 19 8 2.55 48 Manchester B: Archaeology 16 2.55 Liverpool A: Geography and Environmental studies
10 2.60
52 n/a Glasgow B: Archaeology 10 10 2.52 24 Edinburgh 11 2.53 Bournemouth 10 2.60
=53 n/a Reading B: Geography 22 6 2.51 55 Oxford Brookes 11 2.53 UHI 0 2.60
=53 n/a Edinburgh 15 7 2.51 37 Chester B: Archaeology 17 2.50 Salford 20 2.60
55 n/a Middlesex 15 11 2.45 37 Northampton 8 2.45 Newcastle A: Archaeology 0 2.60
=56 n/a Oxford Brookes 14 7 2.38 33 Nottingham A: Archaeology 9 2.44 Loughborough 10 2.50
=56 n/a Kingston 10 8 2.38 24 Kingston 13 2.44 Reading B: Geography 0 2.50
58 n/a Portsmouth 11 11 2.37 26 Wales Trinity Saint David 14 2.44 Northumbria 0 2.47
=59 n/a UHI 13 3 2.33 31 Portsmouth 11 2.40 Nottingham Trent 0 2.40
=59 n/a Salford 12 7 2.33 28 Glasgow B: Archaeology 9 2.34 Kingston 0 2.40
61 n/a Wales Trinity Saint David 10 9 2.26 22 Salford 5 2.33 Nottingham B: Geography 8 2.36
62 n/a Northampton 10 5 2.24 21 Gloucestershire 11 2.32 Oxford Brookes 0 2.20
63 n/a UWE 13 7 2.23 29 Bristol B: Archaeology and Anthropology
5 2.32 Gloucestershire 0 2.20
64 n/a Bristol B: Archaeology and Anthropology
9 4 2.17 20 Uclan 7 2.26 Worcester 0 2.20
=65 n/a Nottingham Trent 12 0 2.14 25 Winchester 4 2.26 Wales Trinity Saint David 0 1.90
=65 n/a Gloucestershire 11 7 2.14 24 UHI 2 2.23 Northampton 0 1.90
67 n/a Uclan 8 4 2.09 17 Middlesex 5 2.16 Edge Hill 0 1.90
68 n/a Worcester 11 2 2.07 23 Worcester 3 2.16 Uclan 0 1.80
69 n/a Winchester 5 3 2.02 11 Nottingham Trent 0 2.09 Bristol B: Archaeology and Anthropology
0 1.70
70 n/a Chester B: Archaeology 4 11 1.90 8 UWE 8 2.00 Winchester 0 1.70
RESEARCH EXCELLENCE FRAMEWORK 2014: INSTITUTIONS RANKED BY SUBJECT

Overall Output Impact
2014
rank
ord
er b
y G
PA
2008
GPA
Institution Tota
l num
ber o
f FTE
sta
ff
subm
itted
% o
f 4*
rese
arch
act
ivity
GPA
Rese
arch
pow
er
Institution % o
f 4*
rese
arch
act
ivity
GPA
Institution % o
f 4*
rese
arch
act
ivity
GPA
71 n/a Edge Hill 9 3 1.83 16 Edge Hill 4 1.96 Cumbria 0 1.60
72 n/a Cumbria 6 0 1.78 11 Chester A: Geography and Development studies
11 1.95 Chester B: Archaeology 0 0.90
73 n/a Chester A: Geography and Development studies
10 7 1.58 15 Cumbria 0 1.91 Liverpool Hope 0 0.80
74 n/a Liverpool Hope 4 0 1.39 6 Liverpool Hope 0 1.80 Chester A: Geography and Development studies
0 0.70
n/a National profile 1,686 27 2.91 4,905 National profile 22.1 2.81 National profile 34.3 3.06
18 Economics and Econometrics1 3.50 UCL 37 79 3.78 139 UCL 70 3.68 Bristol 100 4.00
2 3.55 LSE 51 69 3.55 182 Cambridge 55 3.47 UCL 92 3.92
3 3.35 Oxford 84 56 3.44 289 LSE 56 3.36 LSE 87 3.87
4 3.05 Cambridge 27 47 3.42 92 Warwick 43 3.36 Warwick 60 3.60
5 3.35 Warwick 42 45 3.41 142 Oxford 43 3.27 Oxford 64 3.51
6 3.15 Bristol 19 44 3.32 62 Essex 29 3.19 Cambridge 50 3.50
7 3.35 Essex 33 32 3.25 108 Edinburgh 31 3.15 Royal Holloway 60 3.40
8 2.95 Edinburgh 18 30 3.14 55 UEA 20 3.12 Manchester 40 3.30
9 3.00 Royal Holloway 14 35 3.11 45 Royal Holloway 35 3.10 York 40 3.30
10 3.15 Nottingham 35 18 3.05 107 Surrey 27 3.06 Sussex 37 3.23
11 2.75 UEA 14 17 3.04 43 St Andrews 24 3.06 Essex 20 3.20
12 2.80 Surrey 21 19 3.01 62 Nottingham 20 3.03 Queen Mary 13 3.13
13 3.15 Queen Mary 24 18 2.98 73 Bristol 22 3.03 Nottingham 18 3.10
14 2.75 York 28 17 2.93 82 Queen Mary 20 3.02 Birmingham 27 3.00
15 2.70 St Andrews 21 15 2.92 60 Glasgow 18 2.95 UEA 20 3.00
16 3.05 Manchester 33 17 2.89 96 York 14 2.87 Surrey 0 2.87
17 3.00 Glasgow 24 12 2.86 68 Leicester 19 2.83 Edinburgh 13 2.87
18 2.70 Sussex 17 17 2.84 49 Southampton 22 2.76 Exeter 13 2.73
=19 2.95 Exeter 25 15 2.78 68 Exeter 13 2.75 Southampton 10 2.70
=19 2.75 Birmingham 24 10 2.78 67 Manchester 11 2.72 Glasgow 0 2.63
21 3.00 Southampton 22 16 2.70 59 Birmingham 8 2.72 Aberdeen 0 2.63
22 2.85 Birkbeck 25 7 2.60 65 Sheffield 8 2.72 Birkbeck 0 2.60
23 2.90 Leicester 22 12 2.59 58 Sussex 15 2.70 Kent 13 2.50
24 2.80 Sheffield 15 13 2.58 38 Birkbeck 10 2.62 St Andrews 0 2.50
25 2.85 Aberdeen 19 3 2.48 48 City 17 2.54 Brunel 0 2.20
26 2.65 City 14 15 2.44 33 Aberdeen 5 2.46 Sheffield 40 2.20
27 2.90 Kent 22 4 2.32 51 Kent 3 2.32 City 20 1.90
28 2.65 Brunel 26 1 2.20 58 Brunel 2 2.15 Leicester 0 1.87
3.01 National profile 756 30 3.04 2,297 National profile 27.7 3.00 National profile 36.3 3.11
19 Business and Management studies1 n/a LSE 81 59 3.46 279 Imperial 49 3.35 Cambridge 84 3.84
2 n/a Cambridge 39 60 3.44 134 LSE 48 3.29 Aberdeen 80 3.80
3 n/a Imperial 58 49 3.40 197 London Business School 55 3.28 Strathclyde 80 3.75
4 n/a Oxford 42 51 3.36 141 Oxford 44 3.24 St Andrews 73 3.73
5 n/a London Business School 99 56 3.29 325 Warwick 38 3.20 Brighton 73 3.73
6 n/a Cardiff 73 43 3.28 238 Cambridge 44 3.19 Bristol 70 3.70
7 n/a City 78 41 3.23 253 City 37 3.15 Ulster 67 3.67
8 n/a Bath 65 41 3.20 208 UCL 55 3.08 LSE 64 3.64
9 n/a Leeds 73 38 3.18 233 UEA 31 3.04 Bournemouth 63 3.63
10 n/a Strathclyde 73 43 3.17 233 Cardiff 27 3.03 Reading 60 3.60
11 n/a Lancaster 122 41 3.16 387 Bath 28 3.03 Sheffield 60 3.60
12 n/a Warwick 104 35 3.15 329 King’s College London 25 3.00 Portsmouth 58 3.58
13 n/a St Andrews 22 38 3.14 70 Durham 26 2.99 Liverpool 57 3.57
=14 n/a King’s College London 36 32 3.12 113 Royal Holloway 24 2.95 Leeds 60 3.55
=14 n/a Sheffield 35 33 3.12 108 Lancaster 25 2.93 Stirling 60 3.52
RESEARCH EXCELLENCE FRAMEWORK 2014: INSTITUTIONS RANKED BY SUBJECT
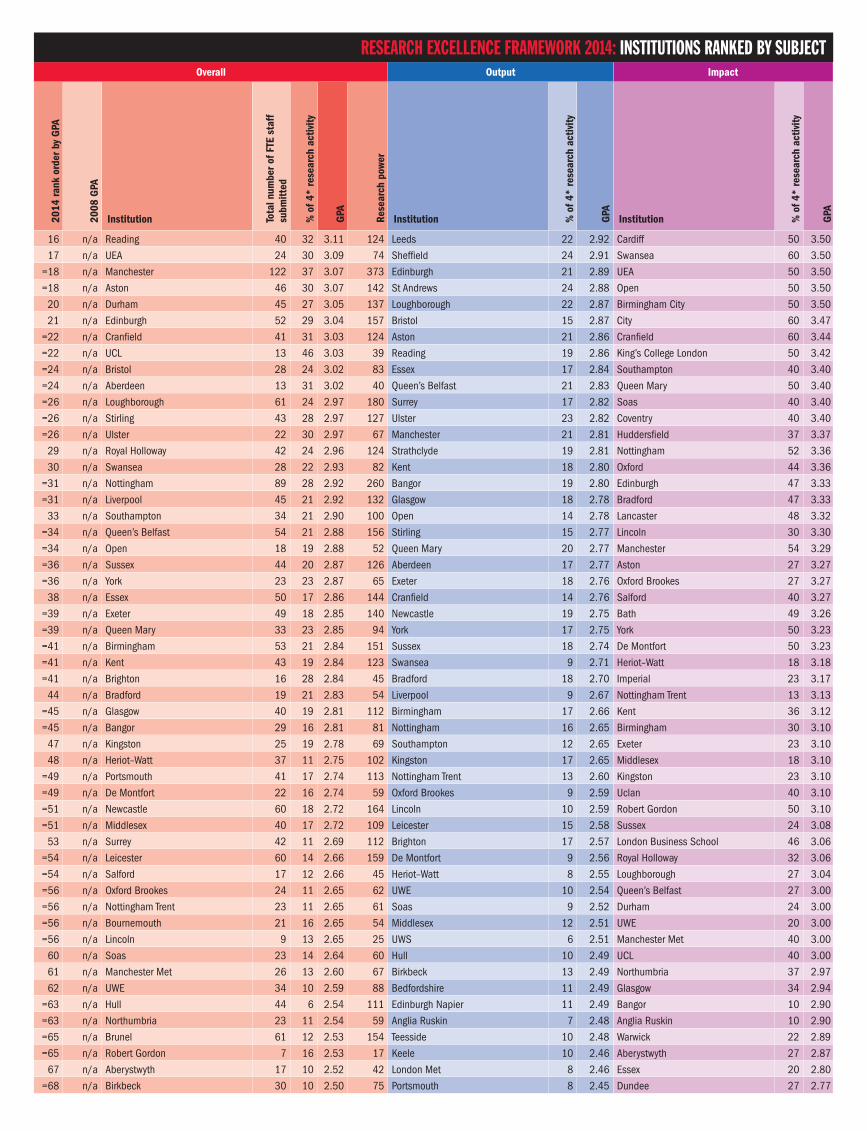
Overall Output Impact
2014
rank
ord
er b
y G
PA
2008
GPA
Institution Tota
l num
ber o
f FTE
sta
ff
subm
itted
% o
f 4*
rese
arch
act
ivity
GPA
Rese
arch
pow
er
Institution % o
f 4*
rese
arch
act
ivity
GPA
Institution % o
f 4*
rese
arch
act
ivity
GPA
16 n/a Reading 40 32 3.11 124 Leeds 22 2.92 Cardiff 50 3.50
17 n/a UEA 24 30 3.09 74 Sheffield 24 2.91 Swansea 60 3.50
=18 n/a Manchester 122 37 3.07 373 Edinburgh 21 2.89 UEA 50 3.50
=18 n/a Aston 46 30 3.07 142 St Andrews 24 2.88 Open 50 3.50
20 n/a Durham 45 27 3.05 137 Loughborough 22 2.87 Birmingham City 50 3.50
21 n/a Edinburgh 52 29 3.04 157 Bristol 15 2.87 City 60 3.47
=22 n/a Cranfield 41 31 3.03 124 Aston 21 2.86 Cranfield 60 3.44
=22 n/a UCL 13 46 3.03 39 Reading 19 2.86 King’s College London 50 3.42
=24 n/a Bristol 28 24 3.02 83 Essex 17 2.84 Southampton 40 3.40
=24 n/a Aberdeen 13 31 3.02 40 Queen’s Belfast 21 2.83 Queen Mary 50 3.40
=26 n/a Loughborough 61 24 2.97 180 Surrey 17 2.82 Soas 40 3.40
=26 n/a Stirling 43 28 2.97 127 Ulster 23 2.82 Coventry 40 3.40
=26 n/a Ulster 22 30 2.97 67 Manchester 21 2.81 Huddersfield 37 3.37
29 n/a Royal Holloway 42 24 2.96 124 Strathclyde 19 2.81 Nottingham 52 3.36
30 n/a Swansea 28 22 2.93 82 Kent 18 2.80 Oxford 44 3.36
=31 n/a Nottingham 89 28 2.92 260 Bangor 19 2.80 Edinburgh 47 3.33
=31 n/a Liverpool 45 21 2.92 132 Glasgow 18 2.78 Bradford 47 3.33
33 n/a Southampton 34 21 2.90 100 Open 14 2.78 Lancaster 48 3.32
=34 n/a Queen’s Belfast 54 21 2.88 156 Stirling 15 2.77 Lincoln 30 3.30
=34 n/a Open 18 19 2.88 52 Queen Mary 20 2.77 Manchester 54 3.29
=36 n/a Sussex 44 20 2.87 126 Aberdeen 17 2.77 Aston 27 3.27
=36 n/a York 23 23 2.87 65 Exeter 18 2.76 Oxford Brookes 27 3.27
38 n/a Essex 50 17 2.86 144 Cranfield 14 2.76 Salford 40 3.27
=39 n/a Exeter 49 18 2.85 140 Newcastle 19 2.75 Bath 49 3.26
=39 n/a Queen Mary 33 23 2.85 94 York 17 2.75 York 50 3.23
=41 n/a Birmingham 53 21 2.84 151 Sussex 18 2.74 De Montfort 50 3.23
=41 n/a Kent 43 19 2.84 123 Swansea 9 2.71 Heriot–Watt 18 3.18
=41 n/a Brighton 16 28 2.84 45 Bradford 18 2.70 Imperial 23 3.17
44 n/a Bradford 19 21 2.83 54 Liverpool 9 2.67 Nottingham Trent 13 3.13
=45 n/a Glasgow 40 19 2.81 112 Birmingham 17 2.66 Kent 36 3.12
=45 n/a Bangor 29 16 2.81 81 Nottingham 16 2.65 Birmingham 30 3.10
47 n/a Kingston 25 19 2.78 69 Southampton 12 2.65 Exeter 23 3.10
48 n/a Heriot–Watt 37 11 2.75 102 Kingston 17 2.65 Middlesex 18 3.10
=49 n/a Portsmouth 41 17 2.74 113 Nottingham Trent 13 2.60 Kingston 23 3.10
=49 n/a De Montfort 22 16 2.74 59 Oxford Brookes 9 2.59 Uclan 40 3.10
=51 n/a Newcastle 60 18 2.72 164 Lincoln 10 2.59 Robert Gordon 50 3.10
=51 n/a Middlesex 40 17 2.72 109 Leicester 15 2.58 Sussex 24 3.08
53 n/a Surrey 42 11 2.69 112 Brighton 17 2.57 London Business School 46 3.06
=54 n/a Leicester 60 14 2.66 159 De Montfort 9 2.56 Royal Holloway 32 3.06
=54 n/a Salford 17 12 2.66 45 Heriot–Watt 8 2.55 Loughborough 27 3.04
=56 n/a Oxford Brookes 24 11 2.65 62 UWE 10 2.54 Queen’s Belfast 27 3.00
=56 n/a Nottingham Trent 23 11 2.65 61 Soas 9 2.52 Durham 24 3.00
=56 n/a Bournemouth 21 16 2.65 54 Middlesex 12 2.51 UWE 20 3.00
=56 n/a Lincoln 9 13 2.65 25 UWS 6 2.51 Manchester Met 40 3.00
60 n/a Soas 23 14 2.64 60 Hull 10 2.49 UCL 40 3.00
61 n/a Manchester Met 26 13 2.60 67 Birkbeck 13 2.49 Northumbria 37 2.97
62 n/a UWE 34 10 2.59 88 Bedfordshire 11 2.49 Glasgow 34 2.94
=63 n/a Hull 44 6 2.54 111 Edinburgh Napier 11 2.49 Bangor 10 2.90
=63 n/a Northumbria 23 11 2.54 59 Anglia Ruskin 7 2.48 Anglia Ruskin 10 2.90
=65 n/a Brunel 61 12 2.53 154 Teesside 10 2.48 Warwick 22 2.89
=65 n/a Robert Gordon 7 16 2.53 17 Keele 10 2.46 Aberystwyth 27 2.87
67 n/a Aberystwyth 17 10 2.52 42 London Met 8 2.46 Essex 20 2.80
=68 n/a Birkbeck 30 10 2.50 75 Portsmouth 8 2.45 Dundee 27 2.77
RESEARCH EXCELLENCE FRAMEWORK 2014: INSTITUTIONS RANKED BY SUBJECT
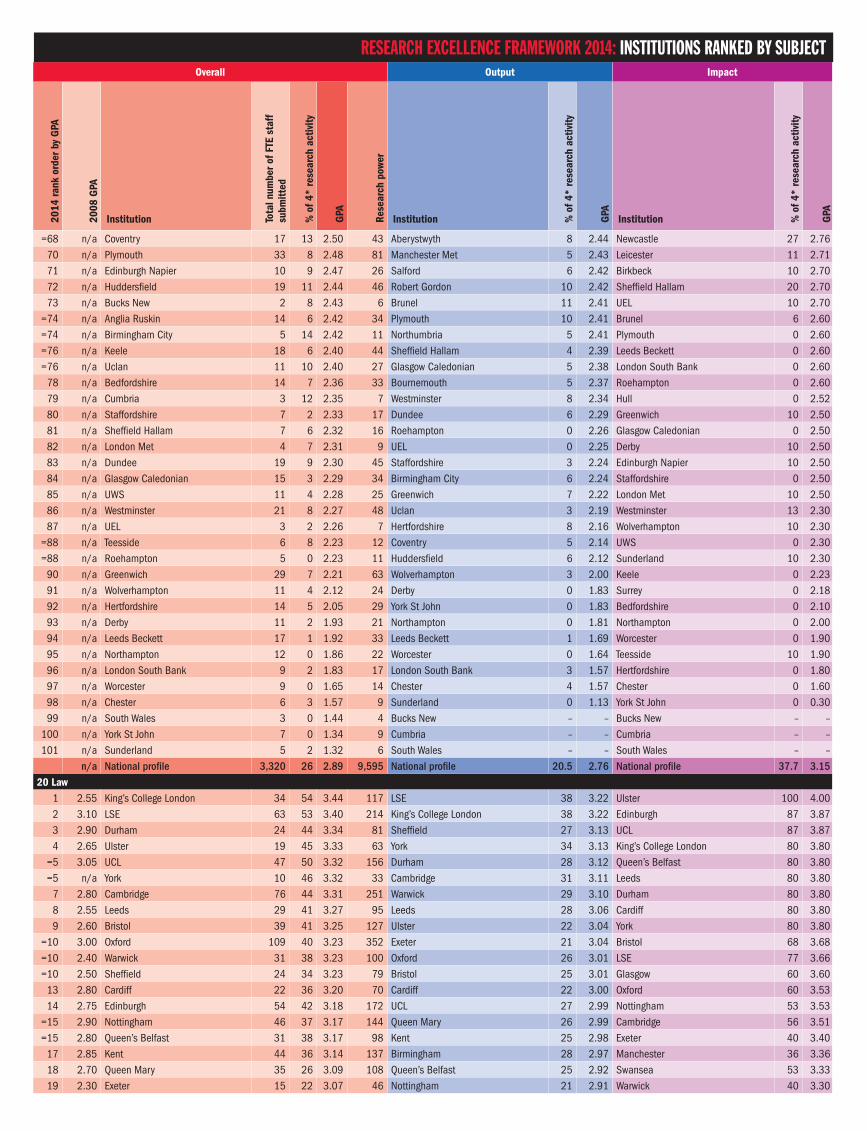
Overall Output Impact
2014
rank
ord
er b
y G
PA
2008
GPA
Institution Tota
l num
ber o
f FTE
sta
ff
subm
itted
% o
f 4*
rese
arch
act
ivity
GPA
Rese
arch
pow
er
Institution % o
f 4*
rese
arch
act
ivity
GPA
Institution % o
f 4*
rese
arch
act
ivity
GPA
=68 n/a Coventry 17 13 2.50 43 Aberystwyth 8 2.44 Newcastle 27 2.76 70 n/a Plymouth 33 8 2.48 81 Manchester Met 5 2.43 Leicester 11 2.71 71 n/a Edinburgh Napier 10 9 2.47 26 Salford 6 2.42 Birkbeck 10 2.70 72 n/a Huddersfield 19 11 2.44 46 Robert Gordon 10 2.42 Sheffield Hallam 20 2.70 73 n/a Bucks New 2 8 2.43 6 Brunel 11 2.41 UEL 10 2.70
=74 n/a Anglia Ruskin 14 6 2.42 34 Plymouth 10 2.41 Brunel 6 2.60 =74 n/a Birmingham City 5 14 2.42 11 Northumbria 5 2.41 Plymouth 0 2.60 =76 n/a Keele 18 6 2.40 44 Sheffield Hallam 4 2.39 Leeds Beckett 0 2.60 =76 n/a Uclan 11 10 2.40 27 Glasgow Caledonian 5 2.38 London South Bank 0 2.60
78 n/a Bedfordshire 14 7 2.36 33 Bournemouth 5 2.37 Roehampton 0 2.60 79 n/a Cumbria 3 12 2.35 7 Westminster 8 2.34 Hull 0 2.52 80 n/a Staffordshire 7 2 2.33 17 Dundee 6 2.29 Greenwich 10 2.50 81 n/a Sheffield Hallam 7 6 2.32 16 Roehampton 0 2.26 Glasgow Caledonian 0 2.50 82 n/a London Met 4 7 2.31 9 UEL 0 2.25 Derby 10 2.50 83 n/a Dundee 19 9 2.30 45 Staffordshire 3 2.24 Edinburgh Napier 10 2.50 84 n/a Glasgow Caledonian 15 3 2.29 34 Birmingham City 6 2.24 Staffordshire 0 2.50 85 n/a UWS 11 4 2.28 25 Greenwich 7 2.22 London Met 10 2.50 86 n/a Westminster 21 8 2.27 48 Uclan 3 2.19 Westminster 13 2.30 87 n/a UEL 3 2 2.26 7 Hertfordshire 8 2.16 Wolverhampton 10 2.30
=88 n/a Teesside 6 8 2.23 12 Coventry 5 2.14 UWS 0 2.30 =88 n/a Roehampton 5 0 2.23 11 Huddersfield 6 2.12 Sunderland 10 2.30
90 n/a Greenwich 29 7 2.21 63 Wolverhampton 3 2.00 Keele 0 2.23 91 n/a Wolverhampton 11 4 2.12 24 Derby 0 1.83 Surrey 0 2.18 92 n/a Hertfordshire 14 5 2.05 29 York St John 0 1.83 Bedfordshire 0 2.10 93 n/a Derby 11 2 1.93 21 Northampton 0 1.81 Northampton 0 2.00 94 n/a Leeds Beckett 17 1 1.92 33 Leeds Beckett 1 1.69 Worcester 0 1.90 95 n/a Northampton 12 0 1.86 22 Worcester 0 1.64 Teesside 10 1.90 96 n/a London South Bank 9 2 1.83 17 London South Bank 3 1.57 Hertfordshire 0 1.80 97 n/a Worcester 9 0 1.65 14 Chester 4 1.57 Chester 0 1.60 98 n/a Chester 6 3 1.57 9 Sunderland 0 1.13 York St John 0 0.30 99 n/a South Wales 3 0 1.44 4 Bucks New – – Bucks New – –
100 n/a York St John 7 0 1.34 9 Cumbria – – Cumbria – – 101 n/a Sunderland 5 2 1.32 6 South Wales – – South Wales – –
n/a National profile 3,320 26 2.89 9,595 National profile 20.5 2.76 National profile 37.7 3.15 20 Law
1 2.55 King’s College London 34 54 3.44 117 LSE 38 3.22 Ulster 100 4.00 2 3.10 LSE 63 53 3.40 214 King’s College London 38 3.22 Edinburgh 87 3.87 3 2.90 Durham 24 44 3.34 81 Sheffield 27 3.13 UCL 87 3.87 4 2.65 Ulster 19 45 3.33 63 York 34 3.13 King’s College London 80 3.80
=5 3.05 UCL 47 50 3.32 156 Durham 28 3.12 Queen’s Belfast 80 3.80 =5 n/a York 10 46 3.32 33 Cambridge 31 3.11 Leeds 80 3.80
7 2.80 Cambridge 76 44 3.31 251 Warwick 29 3.10 Durham 80 3.80 8 2.55 Leeds 29 41 3.27 95 Leeds 28 3.06 Cardiff 80 3.80 9 2.60 Bristol 39 41 3.25 127 Ulster 22 3.04 York 80 3.80
=10 3.00 Oxford 109 40 3.23 352 Exeter 21 3.04 Bristol 68 3.68 =10 2.40 Warwick 31 38 3.23 100 Oxford 26 3.01 LSE 77 3.66 =10 2.50 Sheffield 24 34 3.23 79 Bristol 25 3.01 Glasgow 60 3.60
13 2.80 Cardiff 22 36 3.20 70 Cardiff 22 3.00 Oxford 60 3.53 14 2.75 Edinburgh 54 42 3.18 172 UCL 27 2.99 Nottingham 53 3.53
=15 2.90 Nottingham 46 37 3.17 144 Queen Mary 26 2.99 Cambridge 56 3.51 =15 2.80 Queen’s Belfast 31 38 3.17 98 Kent 25 2.98 Exeter 40 3.40
17 2.85 Kent 44 36 3.14 137 Birmingham 28 2.97 Manchester 36 3.36 18 2.70 Queen Mary 35 26 3.09 108 Queen’s Belfast 25 2.92 Swansea 53 3.33 19 2.30 Exeter 15 22 3.07 46 Nottingham 21 2.91 Warwick 40 3.30
RESEARCH EXCELLENCE FRAMEWORK 2014: INSTITUTIONS RANKED BY SUBJECT
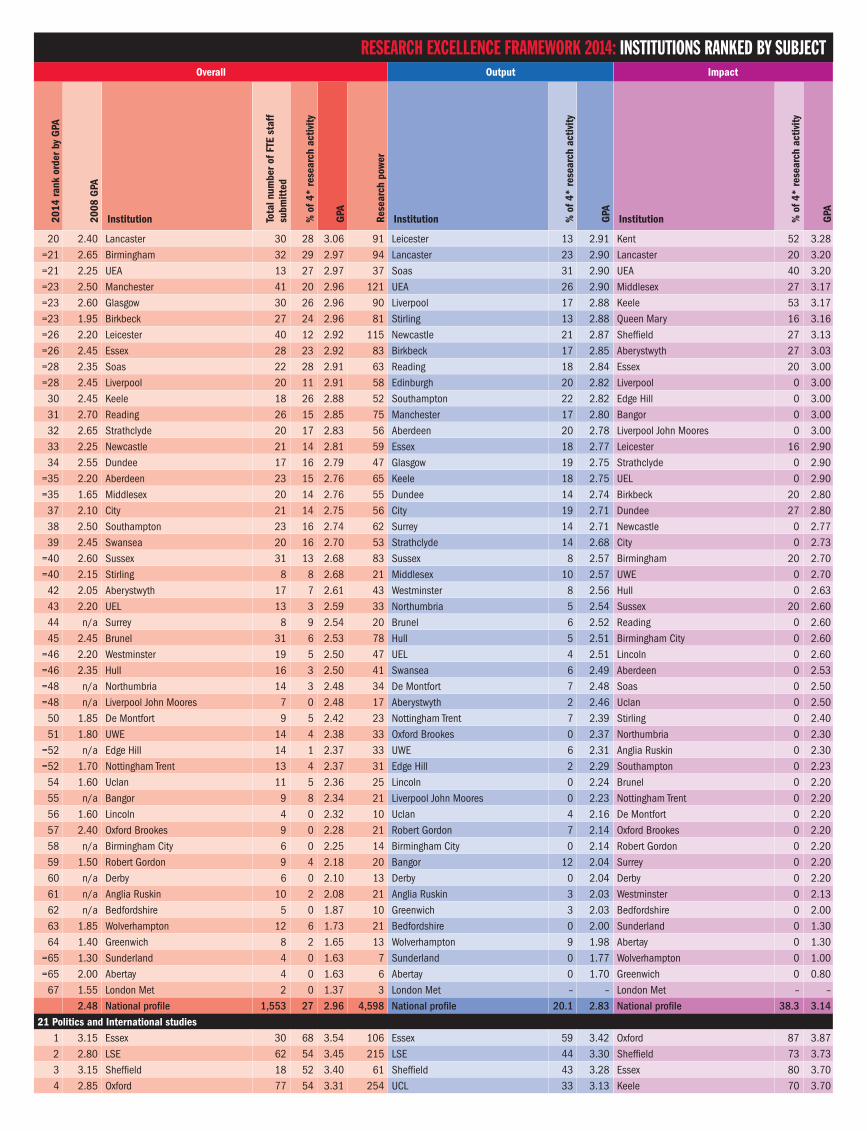
Overall Output Impact
2014
rank
ord
er b
y G
PA
2008
GPA
Institution Tota
l num
ber o
f FTE
sta
ff
subm
itted
% o
f 4*
rese
arch
act
ivity
GPA
Rese
arch
pow
er
Institution % o
f 4*
rese
arch
act
ivity
GPA
Institution % o
f 4*
rese
arch
act
ivity
GPA
20 2.40 Lancaster 30 28 3.06 91 Leicester 13 2.91 Kent 52 3.28 =21 2.65 Birmingham 32 29 2.97 94 Lancaster 23 2.90 Lancaster 20 3.20 =21 2.25 UEA 13 27 2.97 37 Soas 31 2.90 UEA 40 3.20 =23 2.50 Manchester 41 20 2.96 121 UEA 26 2.90 Middlesex 27 3.17 =23 2.60 Glasgow 30 26 2.96 90 Liverpool 17 2.88 Keele 53 3.17 =23 1.95 Birkbeck 27 24 2.96 81 Stirling 13 2.88 Queen Mary 16 3.16 =26 2.20 Leicester 40 12 2.92 115 Newcastle 21 2.87 Sheffield 27 3.13 =26 2.45 Essex 28 23 2.92 83 Birkbeck 17 2.85 Aberystwyth 27 3.03 =28 2.35 Soas 22 28 2.91 63 Reading 18 2.84 Essex 20 3.00 =28 2.45 Liverpool 20 11 2.91 58 Edinburgh 20 2.82 Liverpool 0 3.00
30 2.45 Keele 18 26 2.88 52 Southampton 22 2.82 Edge Hill 0 3.00 31 2.70 Reading 26 15 2.85 75 Manchester 17 2.80 Bangor 0 3.00 32 2.65 Strathclyde 20 17 2.83 56 Aberdeen 20 2.78 Liverpool John Moores 0 3.00 33 2.25 Newcastle 21 14 2.81 59 Essex 18 2.77 Leicester 16 2.90 34 2.55 Dundee 17 16 2.79 47 Glasgow 19 2.75 Strathclyde 0 2.90
=35 2.20 Aberdeen 23 15 2.76 65 Keele 18 2.75 UEL 0 2.90 =35 1.65 Middlesex 20 14 2.76 55 Dundee 14 2.74 Birkbeck 20 2.80
37 2.10 City 21 14 2.75 56 City 19 2.71 Dundee 27 2.80 38 2.50 Southampton 23 16 2.74 62 Surrey 14 2.71 Newcastle 0 2.77 39 2.45 Swansea 20 16 2.70 53 Strathclyde 14 2.68 City 0 2.73
=40 2.60 Sussex 31 13 2.68 83 Sussex 8 2.57 Birmingham 20 2.70 =40 2.15 Stirling 8 8 2.68 21 Middlesex 10 2.57 UWE 0 2.70
42 2.05 Aberystwyth 17 7 2.61 43 Westminster 8 2.56 Hull 0 2.63 43 2.20 UEL 13 3 2.59 33 Northumbria 5 2.54 Sussex 20 2.60 44 n/a Surrey 8 9 2.54 20 Brunel 6 2.52 Reading 0 2.60 45 2.45 Brunel 31 6 2.53 78 Hull 5 2.51 Birmingham City 0 2.60
=46 2.20 Westminster 19 5 2.50 47 UEL 4 2.51 Lincoln 0 2.60 =46 2.35 Hull 16 3 2.50 41 Swansea 6 2.49 Aberdeen 0 2.53 =48 n/a Northumbria 14 3 2.48 34 De Montfort 7 2.48 Soas 0 2.50 =48 n/a Liverpool John Moores 7 0 2.48 17 Aberystwyth 2 2.46 Uclan 0 2.50
50 1.85 De Montfort 9 5 2.42 23 Nottingham Trent 7 2.39 Stirling 0 2.40 51 1.80 UWE 14 4 2.38 33 Oxford Brookes 0 2.37 Northumbria 0 2.30
=52 n/a Edge Hill 14 1 2.37 33 UWE 6 2.31 Anglia Ruskin 0 2.30 =52 1.70 Nottingham Trent 13 4 2.37 31 Edge Hill 2 2.29 Southampton 0 2.23
54 1.60 Uclan 11 5 2.36 25 Lincoln 0 2.24 Brunel 0 2.20 55 n/a Bangor 9 8 2.34 21 Liverpool John Moores 0 2.23 Nottingham Trent 0 2.20 56 1.60 Lincoln 4 0 2.32 10 Uclan 4 2.16 De Montfort 0 2.20 57 2.40 Oxford Brookes 9 0 2.28 21 Robert Gordon 7 2.14 Oxford Brookes 0 2.20 58 n/a Birmingham City 6 0 2.25 14 Birmingham City 0 2.14 Robert Gordon 0 2.20 59 1.50 Robert Gordon 9 4 2.18 20 Bangor 12 2.04 Surrey 0 2.20 60 n/a Derby 6 0 2.10 13 Derby 0 2.04 Derby 0 2.20 61 n/a Anglia Ruskin 10 2 2.08 21 Anglia Ruskin 3 2.03 Westminster 0 2.13 62 n/a Bedfordshire 5 0 1.87 10 Greenwich 3 2.03 Bedfordshire 0 2.00 63 1.85 Wolverhampton 12 6 1.73 21 Bedfordshire 0 2.00 Sunderland 0 1.30 64 1.40 Greenwich 8 2 1.65 13 Wolverhampton 9 1.98 Abertay 0 1.30
=65 1.30 Sunderland 4 0 1.63 7 Sunderland 0 1.77 Wolverhampton 0 1.00 =65 2.00 Abertay 4 0 1.63 6 Abertay 0 1.70 Greenwich 0 0.80
67 1.55 London Met 2 0 1.37 3 London Met – – London Met – – 2.48 National profile 1,553 27 2.96 4,598 National profile 20.1 2.83 National profile 38.3 3.14
21 Politics and International studies1 3.15 Essex 30 68 3.54 106 Essex 59 3.42 Oxford 87 3.87 2 2.80 LSE 62 54 3.45 215 LSE 44 3.30 Sheffield 73 3.73 3 3.15 Sheffield 18 52 3.40 61 Sheffield 43 3.28 Essex 80 3.70 4 2.85 Oxford 77 54 3.31 254 UCL 33 3.13 Keele 70 3.70
RESEARCH EXCELLENCE FRAMEWORK 2014: INSTITUTIONS RANKED BY SUBJECT
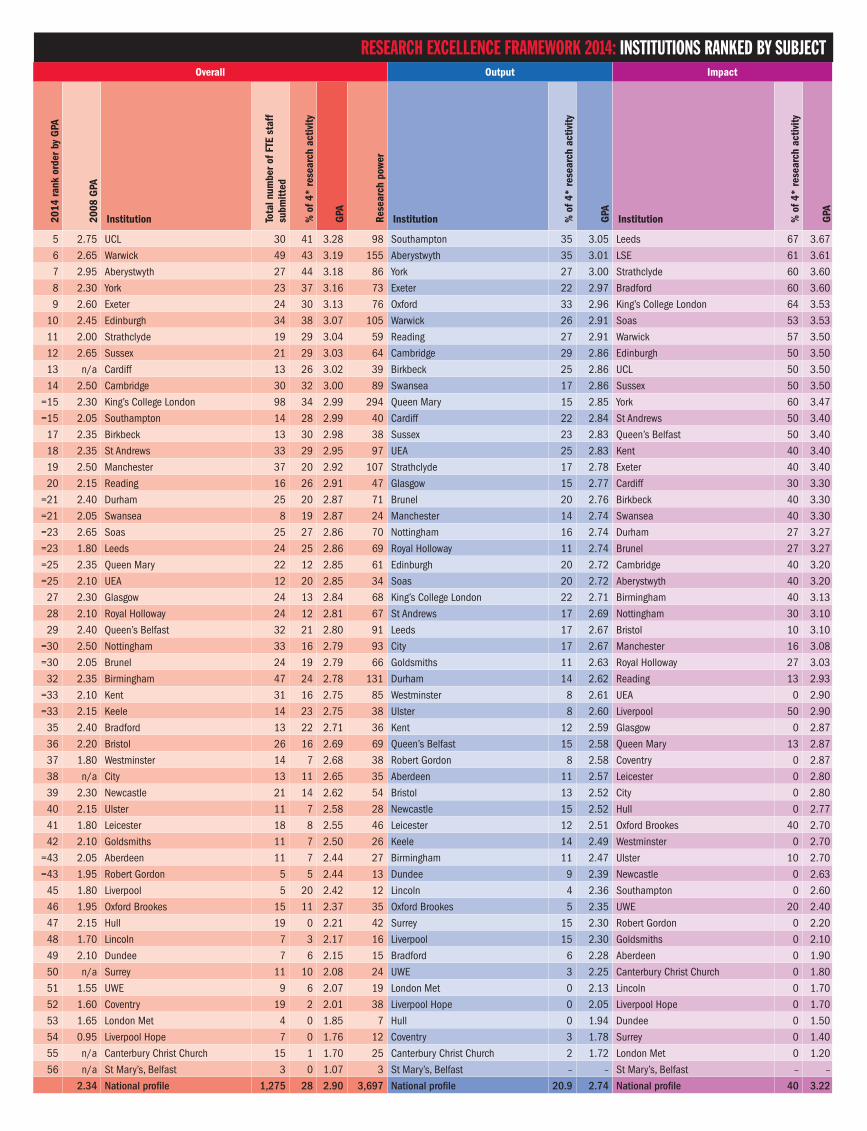
Overall Output Impact
2014
rank
ord
er b
y G
PA
2008
GPA
Institution Tota
l num
ber o
f FTE
sta
ff
subm
itted
% o
f 4*
rese
arch
act
ivity
GPA
Rese
arch
pow
er
Institution % o
f 4*
rese
arch
act
ivity
GPA
Institution % o
f 4*
rese
arch
act
ivity
GPA
5 2.75 UCL 30 41 3.28 98 Southampton 35 3.05 Leeds 67 3.67
6 2.65 Warwick 49 43 3.19 155 Aberystwyth 35 3.01 LSE 61 3.61
7 2.95 Aberystwyth 27 44 3.18 86 York 27 3.00 Strathclyde 60 3.60
8 2.30 York 23 37 3.16 73 Exeter 22 2.97 Bradford 60 3.60
9 2.60 Exeter 24 30 3.13 76 Oxford 33 2.96 King’s College London 64 3.53
10 2.45 Edinburgh 34 38 3.07 105 Warwick 26 2.91 Soas 53 3.53
11 2.00 Strathclyde 19 29 3.04 59 Reading 27 2.91 Warwick 57 3.50
12 2.65 Sussex 21 29 3.03 64 Cambridge 29 2.86 Edinburgh 50 3.50
13 n/a Cardiff 13 26 3.02 39 Birkbeck 25 2.86 UCL 50 3.50
14 2.50 Cambridge 30 32 3.00 89 Swansea 17 2.86 Sussex 50 3.50
=15 2.30 King’s College London 98 34 2.99 294 Queen Mary 15 2.85 York 60 3.47
=15 2.05 Southampton 14 28 2.99 40 Cardiff 22 2.84 St Andrews 50 3.40
17 2.35 Birkbeck 13 30 2.98 38 Sussex 23 2.83 Queen’s Belfast 50 3.40
18 2.35 St Andrews 33 29 2.95 97 UEA 25 2.83 Kent 40 3.40
19 2.50 Manchester 37 20 2.92 107 Strathclyde 17 2.78 Exeter 40 3.40
20 2.15 Reading 16 26 2.91 47 Glasgow 15 2.77 Cardiff 30 3.30
=21 2.40 Durham 25 20 2.87 71 Brunel 20 2.76 Birkbeck 40 3.30
=21 2.05 Swansea 8 19 2.87 24 Manchester 14 2.74 Swansea 40 3.30
=23 2.65 Soas 25 27 2.86 70 Nottingham 16 2.74 Durham 27 3.27
=23 1.80 Leeds 24 25 2.86 69 Royal Holloway 11 2.74 Brunel 27 3.27
=25 2.35 Queen Mary 22 12 2.85 61 Edinburgh 20 2.72 Cambridge 40 3.20
=25 2.10 UEA 12 20 2.85 34 Soas 20 2.72 Aberystwyth 40 3.20
27 2.30 Glasgow 24 13 2.84 68 King’s College London 22 2.71 Birmingham 40 3.13
28 2.10 Royal Holloway 24 12 2.81 67 St Andrews 17 2.69 Nottingham 30 3.10
29 2.40 Queen’s Belfast 32 21 2.80 91 Leeds 17 2.67 Bristol 10 3.10
=30 2.50 Nottingham 33 16 2.79 93 City 17 2.67 Manchester 16 3.08
=30 2.05 Brunel 24 19 2.79 66 Goldsmiths 11 2.63 Royal Holloway 27 3.03
32 2.35 Birmingham 47 24 2.78 131 Durham 14 2.62 Reading 13 2.93
=33 2.10 Kent 31 16 2.75 85 Westminster 8 2.61 UEA 0 2.90
=33 2.15 Keele 14 23 2.75 38 Ulster 8 2.60 Liverpool 50 2.90
35 2.40 Bradford 13 22 2.71 36 Kent 12 2.59 Glasgow 0 2.87
36 2.20 Bristol 26 16 2.69 69 Queen’s Belfast 15 2.58 Queen Mary 13 2.87
37 1.80 Westminster 14 7 2.68 38 Robert Gordon 8 2.58 Coventry 0 2.87
38 n/a City 13 11 2.65 35 Aberdeen 11 2.57 Leicester 0 2.80
39 2.30 Newcastle 21 14 2.62 54 Bristol 13 2.52 City 0 2.80
40 2.15 Ulster 11 7 2.58 28 Newcastle 15 2.52 Hull 0 2.77
41 1.80 Leicester 18 8 2.55 46 Leicester 12 2.51 Oxford Brookes 40 2.70
42 2.10 Goldsmiths 11 7 2.50 26 Keele 14 2.49 Westminster 0 2.70
=43 2.05 Aberdeen 11 7 2.44 27 Birmingham 11 2.47 Ulster 10 2.70
=43 1.95 Robert Gordon 5 5 2.44 13 Dundee 9 2.39 Newcastle 0 2.63
45 1.80 Liverpool 5 20 2.42 12 Lincoln 4 2.36 Southampton 0 2.60
46 1.95 Oxford Brookes 15 11 2.37 35 Oxford Brookes 5 2.35 UWE 20 2.40
47 2.15 Hull 19 0 2.21 42 Surrey 15 2.30 Robert Gordon 0 2.20
48 1.70 Lincoln 7 3 2.17 16 Liverpool 15 2.30 Goldsmiths 0 2.10
49 2.10 Dundee 7 6 2.15 15 Bradford 6 2.28 Aberdeen 0 1.90
50 n/a Surrey 11 10 2.08 24 UWE 3 2.25 Canterbury Christ Church 0 1.80
51 1.55 UWE 9 6 2.07 19 London Met 0 2.13 Lincoln 0 1.70
52 1.60 Coventry 19 2 2.01 38 Liverpool Hope 0 2.05 Liverpool Hope 0 1.70
53 1.65 London Met 4 0 1.85 7 Hull 0 1.94 Dundee 0 1.50
54 0.95 Liverpool Hope 7 0 1.76 12 Coventry 3 1.78 Surrey 0 1.40
55 n/a Canterbury Christ Church 15 1 1.70 25 Canterbury Christ Church 2 1.72 London Met 0 1.20
56 n/a St Mary’s, Belfast 3 0 1.07 3 St Mary’s, Belfast – – St Mary’s, Belfast – –
2.34 National profile 1,275 28 2.90 3,697 National profile 20.9 2.74 National profile 40 3.22
RESEARCH EXCELLENCE FRAMEWORK 2014: INSTITUTIONS RANKED BY SUBJECT

Overall Output Impact
2014
rank
ord
er b
y G
PA
2008
GPA
Institution Tota
l num
ber o
f FTE
sta
ff
subm
itted
% o
f 4*
rese
arch
act
ivity
GPA
Rese
arch
pow
er
Institution % o
f 4*
rese
arch
act
ivity
GPA
Institution % o
f 4*
rese
arch
act
ivity
GPA
22 Social work and Social policy*1 2.80 Oxford 27 79 3.72 102 Oxford 68 3.58 LSE 100 4.00 2 3.30 LSE 47 71 3.67 173 LSE 56 3.49 York 100 4.00 3 2.85 York 34 54 3.39 114 UEA 49 3.36 Oxford 100 4.00 4 2.55 UEA 10 48 3.38 32 Swansea 39 3.24 UCL 100 4.00 5 2.95 Kent 55 50 3.37 184 Southampton 30 3.15 Kent 93 3.93
=6 3.00 Southampton 41 41 3.23 132 Kent 26 3.06 Loughborough 90 3.90 =6 3.10 Bath 36 46 3.23 115 York 29 3.05 Bath 84 3.84
8 2.30 Glasgow 29 38 3.20 93 Glasgow 26 3.02 Dundee 80 3.80 9 2.85 Edinburgh 59 40 3.19 187 Bristol 29 2.96 UEA 80 3.80
10 2.70 Bristol 36 38 3.16 113 Bradford 26 2.95 Glasgow Caledonian 80 3.70 11 2.90 UCL 13 31 3.15 40 UCL 17 2.93 South Wales 80 3.70 12 2.50 Nottingham 33 40 3.13 103 Edinburgh 22 2.92 Ulster 67 3.67 13 2.95 Leeds 33 35 3.12 102 Teesside 10 2.90 Strathclyde 63 3.63 14 2.60 Swansea 8 35 3.07 26 Nottingham 29 2.89 Nottingham 60 3.60 15 2.50 Bedfordshire 14 30 3.05 43 Bath 22 2.88 Leeds 60 3.60 16 2.80 Sheffield 18 26 3.04 54 Sheffield 22 2.88 Bedfordshire 60 3.60 17 2.60 Stirling 33 24 3.01 99 Bedfordshire 25 2.88 Edinburgh 56 3.50 18 n/a Teesside 11 15 2.99 32 Leicester 6 2.88 Glasgow 60 3.50
=19 2.65 Queen’s Belfast 27 24 2.96 79 Stirling 19 2.83 Salford 50 3.50 =19 n/a Loughborough 10 30 2.96 31 Birmingham 21 2.82 Huddersfield 48 3.40
21 2.70 Birmingham 35 23 2.95 102 Liverpool 13 2.82 Bristol 40 3.40 =22 2.65 Ulster 21 26 2.94 62 Durham 22 2.81 Stirling 40 3.40 =22 2.30 Strathclyde 16 31 2.94 46 Leeds 15 2.80 Sussex 40 3.40
24 2.65 Durham 24 22 2.90 70 Keele 16 2.79 Teesside 40 3.40 25 n/a Liverpool 18 14 2.88 52 Open 14 2.78 London Met 40 3.40
=26 2.75 Keele 30 14 2.86 86 Ulster 20 2.77 Queen’s Belfast 30 3.30 =26 2.45 South Wales 14 30 2.86 41 Loughborough 19 2.76 De Montfort 53 3.27 =26 2.35 Leicester 12 4 2.86 34 South Wales 22 2.75 Liverpool 27 3.27 =26 2.55 Bradford 10 25 2.86 30 Plymouth 13 2.74 Bradford 40 3.20
30 2.40 Huddersfield 42 24 2.83 118 Liverpool Hope 5 2.74 Liverpool John Moores 20 3.20 =31 2.65 Open 19 15 2.82 52 London Met 17 2.73 Durham 27 3.13 =31 2.15 Brunel 16 26 2.82 45 Liverpool John Moores 8 2.72 Birmingham 20 3.10 =31 2.70 Sussex 12 22 2.82 35 Strathclyde 26 2.71 Uclan 10 3.10 =31 2.40 London Met 10 19 2.82 27 London South Bank 15 2.71 Brighton 40 3.10
35 n/a Glasgow Caledonian 14 20 2.78 40 Queen’s Belfast 13 2.70 Sheffield 10 3.10 36 2.55 Plymouth 22 17 2.77 61 Manchester Met 13 2.70 UEL 20 3.10 37 2.25 Dundee 10 28 2.75 28 Goldsmiths 17 2.70 Brunel 47 3.07 38 n/a Liverpool John Moores 8 9 2.70 22 Lincoln 7 2.69 Keele 20 3.00 39 2.70 London South Bank 15 9 2.67 40 Brunel 23 2.68 Open 27 3.00 40 2.45 Salford 10 13 2.65 25 Hull 10 2.63 Leicester 0 3.00
=41 1.90 Manchester Met 14 8 2.64 38 Sussex 10 2.55 Southampton 34 2.94 =41 2.10 UEL 9 10 2.64 23 Dundee 18 2.55 Nottingham Trent 30 2.90
43 2.25 Brighton 27 15 2.60 70 Portsmouth 9 2.54 Birmingham City 0 2.90 =44 2.45 Middlesex 51 12 2.58 133 Glasgow Caledonian 5 2.54 Plymouth 37 2.83 =44 2.30 Uclan 27 7 2.58 70 UEL 9 2.54 Middlesex 40 2.80 =44 2.35 Hull 25 12 2.58 63 Huddersfield 14 2.53 Hull 27 2.67
47 2.15 De Montfort 20 18 2.55 51 Northumbria 7 2.52 London South Bank 0 2.50 48 2.25 Goldsmiths 7 11 2.54 18 Salford 5 2.49 Manchester Met 0 2.50
=49 2.20 Northumbria 31 5 2.49 76 Brighton 10 2.46 UWE 0 2.47 =49 n/a Portsmouth 23 8 2.49 58 Uclan 8 2.45 Portsmouth 13 2.40
51 2.30 Lincoln 11 5 2.45 27 De Montfort 11 2.45 Goldsmiths 0 2.40 52 2.05 UWE 20 5 2.36 47 Middlesex 7 2.42 Northumbria 0 2.20 53 2.70 Nottingham Trent 10 11 2.34 22 UWS 7 2.35 Swansea 0 2.10
RESEARCH EXCELLENCE FRAMEWORK 2014: INSTITUTIONS RANKED BY SUBJECT
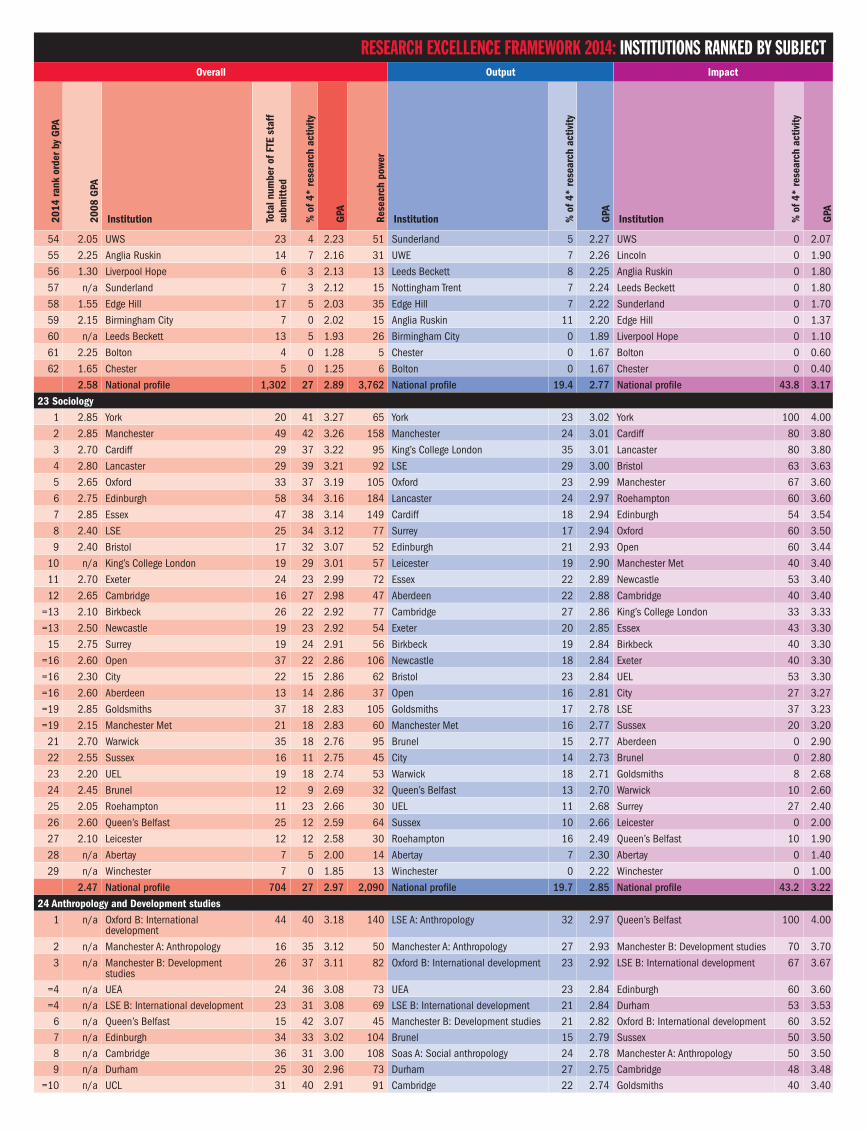
RESEARCH EXCELLENCE FRAMEWORK 2014: INSTITUTIONS RANKED BY SUBJECTOverall Output Impact
2014
rank
ord
er b
y G
PA
2008
GPA
Institution Tota
l num
ber o
f FTE
sta
ff
subm
itted
% o
f 4*
rese
arch
act
ivity
GPA
Rese
arch
pow
er
Institution % o
f 4*
rese
arch
act
ivity
GPA
Institution % o
f 4*
rese
arch
act
ivity
GPA
54 2.05 UWS 23 4 2.23 51 Sunderland 5 2.27 UWS 0 2.07
55 2.25 Anglia Ruskin 14 7 2.16 31 UWE 7 2.26 Lincoln 0 1.90
56 1.30 Liverpool Hope 6 3 2.13 13 Leeds Beckett 8 2.25 Anglia Ruskin 0 1.80
57 n/a Sunderland 7 3 2.12 15 Nottingham Trent 7 2.24 Leeds Beckett 0 1.80
58 1.55 Edge Hill 17 5 2.03 35 Edge Hill 7 2.22 Sunderland 0 1.70
59 2.15 Birmingham City 7 0 2.02 15 Anglia Ruskin 11 2.20 Edge Hill 0 1.37
60 n/a Leeds Beckett 13 5 1.93 26 Birmingham City 0 1.89 Liverpool Hope 0 1.10
61 2.25 Bolton 4 0 1.28 5 Chester 0 1.67 Bolton 0 0.60
62 1.65 Chester 5 0 1.25 6 Bolton 0 1.67 Chester 0 0.40
2.58 National profile 1,302 27 2.89 3,762 National profile 19.4 2.77 National profile 43.8 3.17 23 Sociology
1 2.85 York 20 41 3.27 65 York 23 3.02 York 100 4.00
2 2.85 Manchester 49 42 3.26 158 Manchester 24 3.01 Cardiff 80 3.80
3 2.70 Cardiff 29 37 3.22 95 King’s College London 35 3.01 Lancaster 80 3.80
4 2.80 Lancaster 29 39 3.21 92 LSE 29 3.00 Bristol 63 3.63
5 2.65 Oxford 33 37 3.19 105 Oxford 23 2.99 Manchester 67 3.60
6 2.75 Edinburgh 58 34 3.16 184 Lancaster 24 2.97 Roehampton 60 3.60
7 2.85 Essex 47 38 3.14 149 Cardiff 18 2.94 Edinburgh 54 3.54
8 2.40 LSE 25 34 3.12 77 Surrey 17 2.94 Oxford 60 3.50
9 2.40 Bristol 17 32 3.07 52 Edinburgh 21 2.93 Open 60 3.44
10 n/a King’s College London 19 29 3.01 57 Leicester 19 2.90 Manchester Met 40 3.40
11 2.70 Exeter 24 23 2.99 72 Essex 22 2.89 Newcastle 53 3.40
12 2.65 Cambridge 16 27 2.98 47 Aberdeen 22 2.88 Cambridge 40 3.40
=13 2.10 Birkbeck 26 22 2.92 77 Cambridge 27 2.86 King’s College London 33 3.33
=13 2.50 Newcastle 19 23 2.92 54 Exeter 20 2.85 Essex 43 3.30
15 2.75 Surrey 19 24 2.91 56 Birkbeck 19 2.84 Birkbeck 40 3.30
=16 2.60 Open 37 22 2.86 106 Newcastle 18 2.84 Exeter 40 3.30
=16 2.30 City 22 15 2.86 62 Bristol 23 2.84 UEL 53 3.30
=16 2.60 Aberdeen 13 14 2.86 37 Open 16 2.81 City 27 3.27
=19 2.85 Goldsmiths 37 18 2.83 105 Goldsmiths 17 2.78 LSE 37 3.23
=19 2.15 Manchester Met 21 18 2.83 60 Manchester Met 16 2.77 Sussex 20 3.20
21 2.70 Warwick 35 18 2.76 95 Brunel 15 2.77 Aberdeen 0 2.90
22 2.55 Sussex 16 11 2.75 45 City 14 2.73 Brunel 0 2.80
23 2.20 UEL 19 18 2.74 53 Warwick 18 2.71 Goldsmiths 8 2.68
24 2.45 Brunel 12 9 2.69 32 Queen’s Belfast 13 2.70 Warwick 10 2.60
25 2.05 Roehampton 11 23 2.66 30 UEL 11 2.68 Surrey 27 2.40
26 2.60 Queen’s Belfast 25 12 2.59 64 Sussex 10 2.66 Leicester 0 2.00
27 2.10 Leicester 12 12 2.58 30 Roehampton 16 2.49 Queen’s Belfast 10 1.90
28 n/a Abertay 7 5 2.00 14 Abertay 7 2.30 Abertay 0 1.40
29 n/a Winchester 7 0 1.85 13 Winchester 0 2.22 Winchester 0 1.00
2.47 National profile 704 27 2.97 2,090 National profile 19.7 2.85 National profile 43.2 3.22 24 Anthropology and Development studies
1 n/a Oxford B: International development
44 40 3.18 140 LSE A: Anthropology 32 2.97 Queen’s Belfast 100 4.00
2 n/a Manchester A: Anthropology 16 35 3.12 50 Manchester A: Anthropology 27 2.93 Manchester B: Development studies 70 3.70
3 n/a Manchester B: Development studies
26 37 3.11 82 Oxford B: International development 23 2.92 LSE B: International development 67 3.67
=4 n/a UEA 24 36 3.08 73 UEA 23 2.84 Edinburgh 60 3.60 =4 n/a LSE B: International development 23 31 3.08 69 LSE B: International development 21 2.84 Durham 53 3.53
6 n/a Queen’s Belfast 15 42 3.07 45 Manchester B: Development studies 21 2.82 Oxford B: International development 60 3.52 7 n/a Edinburgh 34 33 3.02 104 Brunel 15 2.79 Sussex 50 3.50 8 n/a Cambridge 36 31 3.00 108 Soas A: Social anthropology 24 2.78 Manchester A: Anthropology 50 3.50 9 n/a Durham 25 30 2.96 73 Durham 27 2.75 Cambridge 48 3.48
=10 n/a UCL 31 40 2.91 91 Cambridge 22 2.74 Goldsmiths 40 3.40
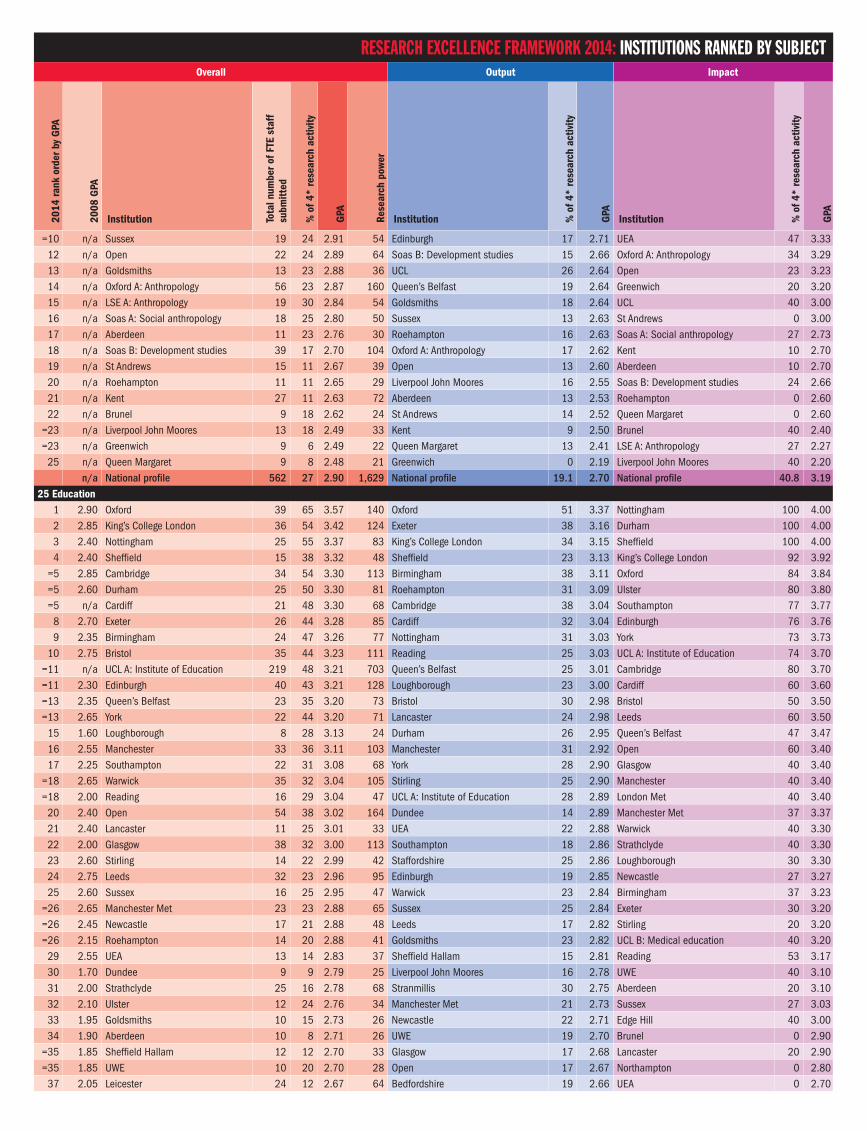
RESEARCH EXCELLENCE FRAMEWORK 2014: INSTITUTIONS RANKED BY SUBJECTOverall Output Impact
2014
rank
ord
er b
y G
PA
2008
GPA
Institution Tota
l num
ber o
f FTE
sta
ff
subm
itted
% o
f 4*
rese
arch
act
ivity
GPA
Rese
arch
pow
er
Institution % o
f 4*
rese
arch
act
ivity
GPA
Institution % o
f 4*
rese
arch
act
ivity
GPA
=10 n/a Sussex 19 24 2.91 54 Edinburgh 17 2.71 UEA 47 3.33 12 n/a Open 22 24 2.89 64 Soas B: Development studies 15 2.66 Oxford A: Anthropology 34 3.29 13 n/a Goldsmiths 13 23 2.88 36 UCL 26 2.64 Open 23 3.23 14 n/a Oxford A: Anthropology 56 23 2.87 160 Queen’s Belfast 19 2.64 Greenwich 20 3.20 15 n/a LSE A: Anthropology 19 30 2.84 54 Goldsmiths 18 2.64 UCL 40 3.00 16 n/a Soas A: Social anthropology 18 25 2.80 50 Sussex 13 2.63 St Andrews 0 3.00 17 n/a Aberdeen 11 23 2.76 30 Roehampton 16 2.63 Soas A: Social anthropology 27 2.73 18 n/a Soas B: Development studies 39 17 2.70 104 Oxford A: Anthropology 17 2.62 Kent 10 2.70 19 n/a St Andrews 15 11 2.67 39 Open 13 2.60 Aberdeen 10 2.70 20 n/a Roehampton 11 11 2.65 29 Liverpool John Moores 16 2.55 Soas B: Development studies 24 2.66 21 n/a Kent 27 11 2.63 72 Aberdeen 13 2.53 Roehampton 0 2.60 22 n/a Brunel 9 18 2.62 24 St Andrews 14 2.52 Queen Margaret 0 2.60
=23 n/a Liverpool John Moores 13 18 2.49 33 Kent 9 2.50 Brunel 40 2.40 =23 n/a Greenwich 9 6 2.49 22 Queen Margaret 13 2.41 LSE A: Anthropology 27 2.27
25 n/a Queen Margaret 9 8 2.48 21 Greenwich 0 2.19 Liverpool John Moores 40 2.20 n/a National profile 562 27 2.90 1,629 National profile 19.1 2.70 National profile 40.8 3.19
25 Education1 2.90 Oxford 39 65 3.57 140 Oxford 51 3.37 Nottingham 100 4.00 2 2.85 King’s College London 36 54 3.42 124 Exeter 38 3.16 Durham 100 4.00 3 2.40 Nottingham 25 55 3.37 83 King’s College London 34 3.15 Sheffield 100 4.00 4 2.40 Sheffield 15 38 3.32 48 Sheffield 23 3.13 King’s College London 92 3.92
=5 2.85 Cambridge 34 54 3.30 113 Birmingham 38 3.11 Oxford 84 3.84 =5 2.60 Durham 25 50 3.30 81 Roehampton 31 3.09 Ulster 80 3.80 =5 n/a Cardiff 21 48 3.30 68 Cambridge 38 3.04 Southampton 77 3.77
8 2.70 Exeter 26 44 3.28 85 Cardiff 32 3.04 Edinburgh 76 3.76 9 2.35 Birmingham 24 47 3.26 77 Nottingham 31 3.03 York 73 3.73
10 2.75 Bristol 35 44 3.23 111 Reading 25 3.03 UCL A: Institute of Education 74 3.70 =11 n/a UCL A: Institute of Education 219 48 3.21 703 Queen’s Belfast 25 3.01 Cambridge 80 3.70 =11 2.30 Edinburgh 40 43 3.21 128 Loughborough 23 3.00 Cardiff 60 3.60 =13 2.35 Queen’s Belfast 23 35 3.20 73 Bristol 30 2.98 Bristol 50 3.50 =13 2.65 York 22 44 3.20 71 Lancaster 24 2.98 Leeds 60 3.50
15 1.60 Loughborough 8 28 3.13 24 Durham 26 2.95 Queen’s Belfast 47 3.47 16 2.55 Manchester 33 36 3.11 103 Manchester 31 2.92 Open 60 3.40 17 2.25 Southampton 22 31 3.08 68 York 28 2.90 Glasgow 40 3.40
=18 2.65 Warwick 35 32 3.04 105 Stirling 25 2.90 Manchester 40 3.40 =18 2.00 Reading 16 29 3.04 47 UCL A: Institute of Education 28 2.89 London Met 40 3.40
20 2.40 Open 54 38 3.02 164 Dundee 14 2.89 Manchester Met 37 3.37 21 2.40 Lancaster 11 25 3.01 33 UEA 22 2.88 Warwick 40 3.30 22 2.00 Glasgow 38 32 3.00 113 Southampton 18 2.86 Strathclyde 40 3.30 23 2.60 Stirling 14 22 2.99 42 Staffordshire 25 2.86 Loughborough 30 3.30 24 2.75 Leeds 32 23 2.96 95 Edinburgh 19 2.85 Newcastle 27 3.27 25 2.60 Sussex 16 25 2.95 47 Warwick 23 2.84 Birmingham 37 3.23
=26 2.65 Manchester Met 23 23 2.88 65 Sussex 25 2.84 Exeter 30 3.20 =26 2.45 Newcastle 17 21 2.88 48 Leeds 17 2.82 Stirling 20 3.20 =26 2.15 Roehampton 14 20 2.88 41 Goldsmiths 23 2.82 UCL B: Medical education 40 3.20
29 2.55 UEA 13 14 2.83 37 Sheffield Hallam 15 2.81 Reading 53 3.17 30 1.70 Dundee 9 9 2.79 25 Liverpool John Moores 16 2.78 UWE 40 3.10 31 2.00 Strathclyde 25 16 2.78 68 Stranmillis 30 2.75 Aberdeen 20 3.10 32 2.10 Ulster 12 24 2.76 34 Manchester Met 21 2.73 Sussex 27 3.03 33 1.95 Goldsmiths 10 15 2.73 26 Newcastle 22 2.71 Edge Hill 40 3.00 34 1.90 Aberdeen 10 8 2.71 26 UWE 19 2.70 Brunel 0 2.90
=35 1.85 Sheffield Hallam 12 12 2.70 33 Glasgow 17 2.68 Lancaster 20 2.90 =35 1.85 UWE 10 20 2.70 28 Open 17 2.67 Northampton 0 2.80
37 2.05 Leicester 24 12 2.67 64 Bedfordshire 19 2.66 UEA 0 2.70
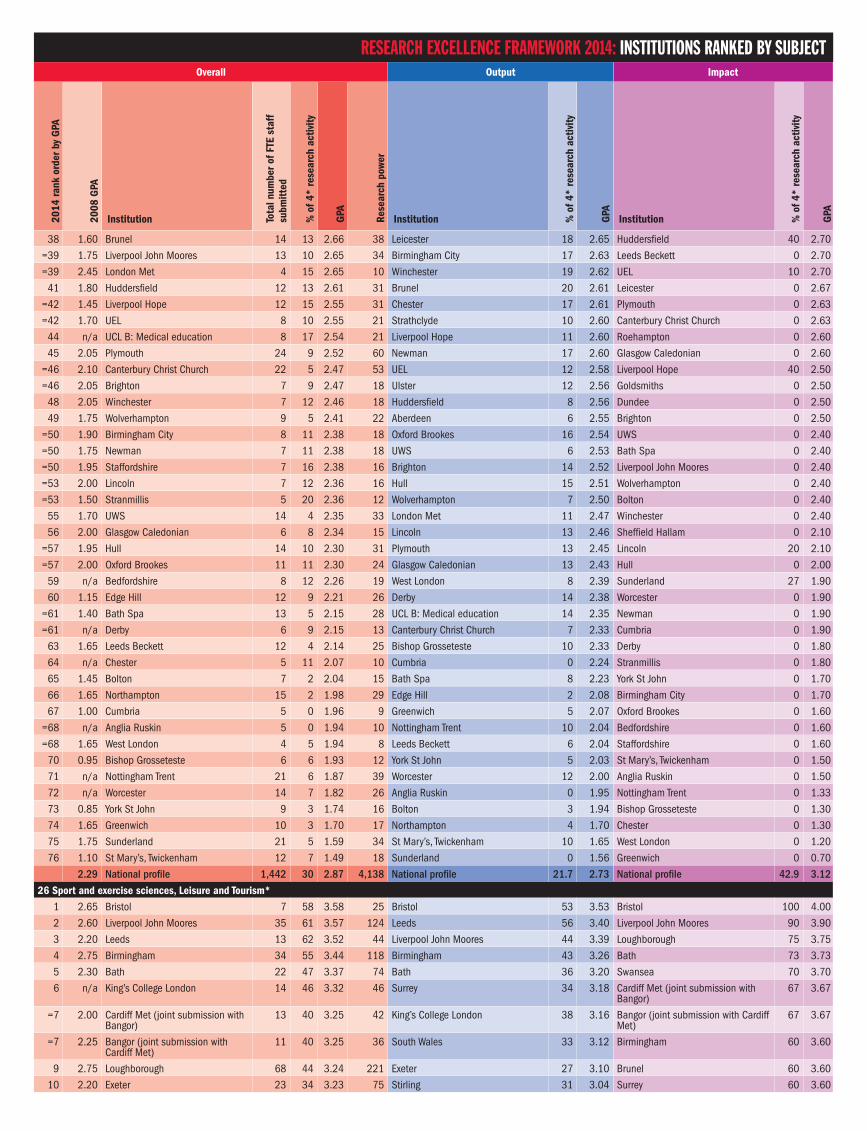
RESEARCH EXCELLENCE FRAMEWORK 2014: INSTITUTIONS RANKED BY SUBJECTOverall Output Impact
2014
rank
ord
er b
y G
PA
2008
GPA
Institution Tota
l num
ber o
f FTE
sta
ff
subm
itted
% o
f 4*
rese
arch
act
ivity
GPA
Rese
arch
pow
er
Institution % o
f 4*
rese
arch
act
ivity
GPA
Institution % o
f 4*
rese
arch
act
ivity
GPA
38 1.60 Brunel 14 13 2.66 38 Leicester 18 2.65 Huddersfield 40 2.70
=39 1.75 Liverpool John Moores 13 10 2.65 34 Birmingham City 17 2.63 Leeds Beckett 0 2.70
=39 2.45 London Met 4 15 2.65 10 Winchester 19 2.62 UEL 10 2.70
41 1.80 Huddersfield 12 13 2.61 31 Brunel 20 2.61 Leicester 0 2.67
=42 1.45 Liverpool Hope 12 15 2.55 31 Chester 17 2.61 Plymouth 0 2.63
=42 1.70 UEL 8 10 2.55 21 Strathclyde 10 2.60 Canterbury Christ Church 0 2.63
44 n/a UCL B: Medical education 8 17 2.54 21 Liverpool Hope 11 2.60 Roehampton 0 2.60
45 2.05 Plymouth 24 9 2.52 60 Newman 17 2.60 Glasgow Caledonian 0 2.60
=46 2.10 Canterbury Christ Church 22 5 2.47 53 UEL 12 2.58 Liverpool Hope 40 2.50
=46 2.05 Brighton 7 9 2.47 18 Ulster 12 2.56 Goldsmiths 0 2.50
48 2.05 Winchester 7 12 2.46 18 Huddersfield 8 2.56 Dundee 0 2.50
49 1.75 Wolverhampton 9 5 2.41 22 Aberdeen 6 2.55 Brighton 0 2.50
=50 1.90 Birmingham City 8 11 2.38 18 Oxford Brookes 16 2.54 UWS 0 2.40
=50 1.75 Newman 7 11 2.38 18 UWS 6 2.53 Bath Spa 0 2.40
=50 1.95 Staffordshire 7 16 2.38 16 Brighton 14 2.52 Liverpool John Moores 0 2.40
=53 2.00 Lincoln 7 12 2.36 16 Hull 15 2.51 Wolverhampton 0 2.40
=53 1.50 Stranmillis 5 20 2.36 12 Wolverhampton 7 2.50 Bolton 0 2.40
55 1.70 UWS 14 4 2.35 33 London Met 11 2.47 Winchester 0 2.40
56 2.00 Glasgow Caledonian 6 8 2.34 15 Lincoln 13 2.46 Sheffield Hallam 0 2.10
=57 1.95 Hull 14 10 2.30 31 Plymouth 13 2.45 Lincoln 20 2.10
=57 2.00 Oxford Brookes 11 11 2.30 24 Glasgow Caledonian 13 2.43 Hull 0 2.00
59 n/a Bedfordshire 8 12 2.26 19 West London 8 2.39 Sunderland 27 1.90
60 1.15 Edge Hill 12 9 2.21 26 Derby 14 2.38 Worcester 0 1.90
=61 1.40 Bath Spa 13 5 2.15 28 UCL B: Medical education 14 2.35 Newman 0 1.90
=61 n/a Derby 6 9 2.15 13 Canterbury Christ Church 7 2.33 Cumbria 0 1.90
63 1.65 Leeds Beckett 12 4 2.14 25 Bishop Grosseteste 10 2.33 Derby 0 1.80
64 n/a Chester 5 11 2.07 10 Cumbria 0 2.24 Stranmillis 0 1.80
65 1.45 Bolton 7 2 2.04 15 Bath Spa 8 2.23 York St John 0 1.70
66 1.65 Northampton 15 2 1.98 29 Edge Hill 2 2.08 Birmingham City 0 1.70
67 1.00 Cumbria 5 0 1.96 9 Greenwich 5 2.07 Oxford Brookes 0 1.60
=68 n/a Anglia Ruskin 5 0 1.94 10 Nottingham Trent 10 2.04 Bedfordshire 0 1.60
=68 1.65 West London 4 5 1.94 8 Leeds Beckett 6 2.04 Staffordshire 0 1.60
70 0.95 Bishop Grosseteste 6 6 1.93 12 York St John 5 2.03 St Mary’s, Twickenham 0 1.50
71 n/a Nottingham Trent 21 6 1.87 39 Worcester 12 2.00 Anglia Ruskin 0 1.50
72 n/a Worcester 14 7 1.82 26 Anglia Ruskin 0 1.95 Nottingham Trent 0 1.33
73 0.85 York St John 9 3 1.74 16 Bolton 3 1.94 Bishop Grosseteste 0 1.30
74 1.65 Greenwich 10 3 1.70 17 Northampton 4 1.70 Chester 0 1.30
75 1.75 Sunderland 21 5 1.59 34 St Mary’s, Twickenham 10 1.65 West London 0 1.20
76 1.10 St Mary’s, Twickenham 12 7 1.49 18 Sunderland 0 1.56 Greenwich 0 0.70
2.29 National profile 1,442 30 2.87 4,138 National profile 21.7 2.73 National profile 42.9 3.12
26 Sport and exercise sciences, Leisure and Tourism*1 2.65 Bristol 7 58 3.58 25 Bristol 53 3.53 Bristol 100 4.00
2 2.60 Liverpool John Moores 35 61 3.57 124 Leeds 56 3.40 Liverpool John Moores 90 3.90
3 2.20 Leeds 13 62 3.52 44 Liverpool John Moores 44 3.39 Loughborough 75 3.75
4 2.75 Birmingham 34 55 3.44 118 Birmingham 43 3.26 Bath 73 3.73
5 2.30 Bath 22 47 3.37 74 Bath 36 3.20 Swansea 70 3.70
6 n/a King’s College London 14 46 3.32 46 Surrey 34 3.18 Cardiff Met (joint submission with Bangor)
67 3.67
=7 2.00 Cardiff Met (joint submission with Bangor)
13 40 3.25 42 King’s College London 38 3.16 Bangor (joint submission with Cardiff Met)
67 3.67
=7 2.25 Bangor (joint submission with Cardiff Met)
11 40 3.25 36 South Wales 33 3.12 Birmingham 60 3.60
9 2.75 Loughborough 68 44 3.24 221 Exeter 27 3.10 Brunel 60 3.60
10 2.20 Exeter 23 34 3.23 75 Stirling 31 3.04 Surrey 60 3.60

RESEARCH EXCELLENCE FRAMEWORK 2014: INSTITUTIONS RANKED BY SUBJECTOverall Output Impact
2014
rank
ord
er b
y G
PA
2008
GPA
Institution Tota
l num
ber o
f FTE
sta
ff
subm
itted
% o
f 4*
rese
arch
act
ivity
GPA
Rese
arch
pow
er
Institution % o
f 4*
rese
arch
act
ivity
GPA
Institution % o
f 4*
rese
arch
act
ivity
GPA
11 n/a Surrey 14 36 3.18 46 Cardiff Met (joint submission with Bangor)
24 3.01 Leeds 60 3.60
12 2.25 Brunel 29 38 3.16 91 Bangor (joint submission with Cardiff Met)
24 3.01 Exeter 53 3.53
13 n/a Bournemouth 14 29 3.13 44 Bournemouth 18 3.00 King’s College London 50 3.50
14 2.10 Brighton 21 23 3.00 64 Brunel 26 2.93 Portsmouth 50 3.50
15 1.25 Swansea 10 28 2.91 29 Loughborough 21 2.90 Chichester 53 3.43
16 n/a Edinburgh 24 22 2.88 69 Abertay 29 2.88 Gloucestershire 40 3.40
17 1.95 London South Bank 9 16 2.87 27 Brighton 22 2.87 Canterbury Christ Church 40 3.40
18 1.65 South Wales 7 25 2.83 20 London South Bank 13 2.77 Edinburgh 40 3.30
19 2.40 Stirling 22 20 2.81 63 Lincoln 19 2.67 London South Bank 40 3.30
=20 2.15 Sheffield Hallam 32 17 2.75 88 Ulster 9 2.66 Brighton 27 3.27
=20 1.75 Canterbury Christ Church 15 17 2.75 41 Edinburgh 13 2.64 Bournemouth 40 3.20
22 1.70 Staffordshire 13 13 2.74 37 Aberystwyth 13 2.59 Staffordshire 40 3.20
23 2.30 Leeds Beckett 49 21 2.72 132 Bedfordshire 15 2.57 Essex 40 3.20
24 2.10 Ulster 13 14 2.71 36 Swansea 13 2.57 Sheffield Hallam 30 3.00
25 1.85 Chichester 19 18 2.67 51 Sheffield Hallam 11 2.56 Edge Hill 40 3.00
26 1.80 Aberystwyth 10 8 2.66 27 Canterbury Christ Church 14 2.55 Leeds Beckett 37 2.97
27 n/a Essex 9 13 2.64 23 UWS 24 2.55 Hull 0 2.90
28 1.40 Gloucestershire 18 12 2.61 46 York St John 9 2.55 Aberystwyth 0 2.90
29 n/a Kent 11 14 2.60 29 Leeds Beckett 16 2.54 Wolverhampton 10 2.90
30 n/a Portsmouth 8 10 2.54 19 Staffordshire 8 2.53 Ulster 40 2.80
31 n/a Abertay 6 19 2.53 15 Gloucestershire 6 2.50 Kent 40 2.80
32 n/a Lincoln 7 12 2.49 17 Kent 9 2.50 Worcester 20 2.60
33 n/a Edge Hill 14 13 2.48 35 St Mary’s, Twickenham 23 2.50 Lincoln 0 2.50
34 1.80 Bedfordshire 19 9 2.41 47 Chichester 11 2.49 Chester 0 2.40
35 n/a Wolverhampton 9 4 2.37 21 Nottingham Trent 0 2.44 Stirling 0 2.10
36 1.55 Hull 11 5 2.36 26 Essex 8 2.40 Uclan 0 2.10
37 n/a Uclan 21 5 2.34 50 Liverpool Hope 7 2.37 Northumbria 0 2.00
38 1.45 Nottingham Trent 13 0 2.30 29 Uclan 8 2.33 Nottingham Trent 0 2.00
39 1.80 Northumbria 14 2 2.28 31 Cumbria 22 2.33 Sunderland 0 2.00
40 1.90 Chester 12 1 2.26 28 Edge Hill 8 2.31 Abertay 0 2.00
=41 n/a Worcester 14 4 2.24 31 Northumbria 2 2.31 Bedfordshire 0 1.87
=41 n/a UWS 9 15 2.24 21 Portsmouth 0 2.22 Cumbria 0 1.80
=41 1.40 York St John 7 6 2.24 16 Chester 2 2.21 Newman 0 1.80
44 1.40 St Mary’s, Twickenham 7 15 2.23 16 Wolverhampton 3 2.20 St Mary’s, Twickenham 0 1.70
45 n/a Cumbria 6 14 2.14 13 Newman 0 2.20 South Wales 0 1.70
46 1.30 Newman 4 0 1.98 8 Worcester 0 2.14 York St John 0 1.40
47 2.05 Sunderland 6 3 1.96 12 Hull 8 2.14 Liverpool Hope 0 1.30
48 n/a Liverpool Hope 9 4 1.94 17 Sunderland 4 1.91 Bucks New 0 1.30
49 n/a Leeds Trinity 3 0 1.80 5 Bucks New 0 1.85 UWS 0 1.20
50 1.60 Bucks New 5 0 1.72 9 Southampton Solent 0 1.45 Southampton Solent 0 1.20
51 n/a Southampton Solent 6 0 1.38 8 Leeds Trinity – – Leeds Trinity – –
2.11 National profile 790 25 2.83 2,235 National profile 19.5 2.73 National profile 39.2 3.04
27 Area studies1 n/a LSE 20 55 3.40 67 Birmingham 39 3.27 LSE 100 4.00
2 n/a Birmingham 8 44 3.37 26 LSE 37 3.14 Exeter 100 4.00
3 n/a Exeter 15 45 3.25 47 Aston 28 3.07 London Met 70 3.70
4 n/a London Met 9 35 3.09 26 Oxford 32 3.00 UCL 84 3.68
=5 n/a UEA 14 34 3.08 43 Exeter 27 2.96 Nottingham A: American and Canadian studies
63 3.63
=5 n/a Aston 12 27 3.08 37 Sussex 26 2.96 UEA 50 3.50
7 n/a Oxford 71 36 3.07 218 Westminster 33 2.94 Birmingham 50 3.50
8 n/a UCL 39 43 3.03 119 UEA 30 2.93 Bath 40 3.40

RESEARCH EXCELLENCE FRAMEWORK 2014: INSTITUTIONS RANKED BY SUBJECTOverall Output Impact
2014
rank
ord
er b
y G
PA
2008
GPA
Institution Tota
l num
ber o
f FTE
sta
ff
subm
itted
% o
f 4*
rese
arch
act
ivity
GPA
Rese
arch
pow
er
Institution % o
f 4*
rese
arch
act
ivity
GPA
Institution % o
f 4*
rese
arch
act
ivity
GPA
9 n/a Cambridge 32 30 3.02 97 Edinburgh 23 2.92 Portsmouth 40 3.24 10 n/a Nottingham A: American and
Canadian studies 20 31 2.97 58 Cambridge 28 2.91 Cambridge 20 3.10
11 n/a Glasgow 11 20 2.95 32 Glasgow 21 2.91 Aston 30 3.10 12 n/a Edinburgh 22 21 2.91 64 Sheffield 20 2.86 Oxford 40 3.05 13 n/a Sussex 13 21 2.90 38 London Met 21 2.86 UHI 20 3.00 14 n/a Portsmouth 39 25 2.89 114 Nottingham A: American and
Canadian studies 24 2.74 Nottingham B: Contemporary
Chinese studies 10 2.97
15 n/a UHI 7 17 2.83 21 Soas 20 2.71 Glasgow 0 2.80 16 n/a Bath 26 23 2.81 73 Portsmouth 19 2.70 Edinburgh 13 2.77 17 n/a Soas 47 19 2.78 131 UCL 24 2.67 Soas 0 2.73 18 n/a Sheffield 14 13 2.77 39 UHI 11 2.63 Sheffield 0 2.70 19 n/a Nottingham B: Contemporary
Chinese studies 22 16 2.75 61 Bath 19 2.62 Sussex 0 2.60
20 n/a Westminster 5 22 2.70 13 Nottingham B: Contemporary Chinese studies
13 2.56 Chester 0 2.60
21 n/a Loughborough 24 9 2.51 59 Loughborough 12 2.50 Loughborough 0 2.53 22 n/a Wolverhampton 7 2 2.11 15 Wolverhampton 4 2.32 Westminster 0 2.40 23 n/a Chester 8 9 2.08 17 Chester 13 2.13 Wolverhampton 0 1.50
n/a National profile 483 28 2.93 1,415 National profile 23.6 2.80 National profile 34.7 3.13 28 Modern languages and Linguistics
1 n/a Queen Mary A: Linguistics 8 62 3.58 27 Queen Mary A: Linguistics 58 3.52 Cardiff 100 4.00 2 n/a Edinburgh B: Linguistics 34 45 3.29 113 Edinburgh B: Linguistics 41 3.23 Bangor 90 3.90
=3 n/a Kent 25 39 3.24 80 Queen Margaret 36 3.23 Heriot–Watt 90 3.90 =3 n/a Queen Margaret 11 34 3.24 35 Kent 34 3.18 Reading 80 3.80 =5 n/a Southampton 25 39 3.23 79 Warwick 33 3.11 Sheffield B: Linguistics 80 3.80 =5 n/a Queen’s Belfast 23 40 3.23 76 Glasgow B: Celtic studies 38 3.10 Queen’s Belfast 77 3.77
7 n/a Cardiff 15 37 3.21 48 Cambridge 35 3.09 Swansea A: Modern languages and Linguistics
70 3.70
=8 n/a Cambridge 97 40 3.20 309 Southampton 29 3.04 York 60 3.60 =8 n/a Essex 13 40 3.20 40 Cardiff 21 3.04 Ulster A: Celtic studies 60 3.60 10 n/a Glasgow B: Celtic studies 6 38 3.19 20 Queen’s Belfast 28 3.02 Queen Mary A: Linguistics 60 3.60
=11 n/a Manchester 73 41 3.16 229 Essex 34 3.02 Newcastle 60 3.53 =11 n/a York 14 45 3.16 44 Manchester 31 2.97 Edinburgh A: Modern languages and
Celtic and Scottish studies 58 3.50
=13 n/a Bangor 25 41 3.13 78 Royal Holloway 30 2.97 Sheffield A: Languages and culture 50 3.50 =13 n/a Royal Holloway 25 34 3.13 77 Liverpool 24 2.96 Royal Holloway 50 3.50
15 n/a Warwick 34 30 3.09 105 Durham 25 2.95 Southampton 50 3.50 =16 n/a Newcastle 50 35 3.04 152 King’s College London 28 2.92 Kent 60 3.47 =16 n/a Queen Mary B: Modern languages,
literatures and culture 31 35 3.04 95 Birmingham 22 2.92 UCL 57 3.43
18 n/a Sheffield B: Linguistics 7 28 3.01 21 Bristol 24 2.92 Roehampton 60 3.40 =19 n/a UCL 48 32 3.00 145 Oxford 28 2.91 Swansea B: Celtic studies 40 3.40 =19 n/a King’s College London 41 26 3.00 122 York 34 2.90 Aston 60 3.33 =21 n/a Durham 34 25 2.98 101 Uclan 25 2.90 Manchester 45 3.30 =21 n/a Sheffield A: Languages and
Culture 33 31 2.98 99 Newcastle 26 2.88 Essex 30 3.30
=23 n/a Edinburgh A: Modern languages and Celtic and Scottish studies
37 31 2.96 108 Swansea B: Celtic studies 20 2.87 Wales (joint submission with Wales Trinity Saint David)
40 3.30
=23 n/a Reading 22 27 2.96 64 Nottingham 23 2.86 Queen Margaret 30 3.30 25 n/a Liverpool 21 26 2.95 62 Queen Mary B: Modern languages,
literatures and culture 28 2.86 Glasgow B: Celtic studies 30 3.30
26 n/a Birkbeck 25 22 2.94 75 Bangor 26 2.85 Wales Trinity Saint David (joint submission with Wales)
40 3.30
27 n/a Nottingham 58 26 2.92 168 Exeter 27 2.81 Nottingham 44 3.27 28 n/a Leeds 63 31 2.91 184 Birkbeck 20 2.81 Cambridge 36 3.25
=29 n/a Birmingham 33 16 2.90 96 UCL 22 2.78 King’s College London 24 3.24 =29 n/a Swansea B: Celtic studies 4 21 2.90 12 Sheffield A: Languages and culture 25 2.77 Edinburgh B: Linguistics 40 3.20

RESEARCH EXCELLENCE FRAMEWORK 2014: INSTITUTIONS RANKED BY SUBJECTOverall Output Impact
2014
rank
ord
er b
y G
PA
2008
GPA
Institution Tota
l num
ber o
f FTE
sta
ff
subm
itted
% o
f 4*
rese
arch
act
ivity
GPA
Rese
arch
pow
er
Institution % o
f 4*
rese
arch
act
ivity
GPA
Institution % o
f 4*
rese
arch
act
ivity
GPA
31 n/a Bristol 31 29 2.89 90 Nottingham Trent 27 2.77 Birkbeck 30 3.20 32 n/a Oxford 117 27 2.88 336 Reading 15 2.76 Queen Mary B: Modern languages,
literatures and culture 30 3.10
33 n/a Ulster A: Celtic studies 11 25 2.86 30 Leeds 20 2.75 Nottingham Trent 30 3.10 =34 n/a Wales (joint submission with
Wales Trinity Saint David) 12 26 2.85 35 Soas 30 2.74 Durham 30 3.00
=34 n/a Wales Trinity Saint David (joint submission with Wales)
1 26 2.85 3 St Andrews 13 2.73 Glasgow A: Modern languages and Linguistics
50 2.97
=36 n/a St Andrews 33 13 2.84 93 Aberdeen 24 2.73 Warwick 20 2.90 =36 n/a Exeter 32 30 2.84 91 Sheffield B: Linguistics 12 2.72 St Andrews 0 2.90 =36 n/a Soas 12 27 2.84 35 Aberystwyth B: Celtic studies 25 2.70 Leeds 40 2.84
39 n/a Heriot–Watt 10 33 2.82 28 Wales (joint submission with Wales Trinity Saint David)
23 2.69 Birmingham 0 2.80
40 n/a Aston 19 24 2.80 52 Wales Trinity Saint David (joint submission with Wales)
23 2.69 Wolverhampton 0 2.80
41 n/a Uclan 11 20 2.78 29 Roehampton 8 2.66 Ulster B: Modern languages and Linguistics
0 2.70
42 n/a Swansea A: Modern languages and Linguistics
12 17 2.77 33 Edinburgh A: Modern languages and Celtic and Scottish studies
15 2.65 Soas 0 2.70
43 n/a Roehampton 10 17 2.72 28 Glasgow A: Modern languages and Linguistics
15 2.62 Uclan 20 2.70
=44 n/a Aberdeen 22 21 2.71 60 Swansea A: Modern languages and Linguistics
5 2.59 Liverpool 20 2.67
=44 n/a Glasgow A: Modern languages and Linguistics
22 23 2.71 60 UHI 14 2.59 Aberdeen 27 2.63
=44 n/a UHI 6 16 2.71 16 Ulster A: Celtic studies 15 2.57 Oxford 25 2.62 47 n/a Nottingham Trent 9 23 2.64 23 UWE 12 2.47 Leicester 0 2.60 48 n/a Aberystwyth B: Celtic studies 12 18 2.56 31 Aston 5 2.45 Aberystwyth A: Modern languages
and Linguistics 0 2.60
49 n/a Leicester 12 5 2.49 30 Ulster B: Modern languages and Linguistics
14 2.45 UHI 0 2.60
50 n/a Wolverhampton 11 11 2.46 27 Leicester 5 2.40 Bristol 20 2.40 51 n/a UWE 10 9 2.43 24 Heriot–Watt 15 2.39 Exeter 10 2.30 52 n/a Ulster B: Modern languages and
Linguistics 12 9 2.42 30 Wolverhampton 12 2.34 UWE 0 2.20
53 n/a Aberystwyth A: Modern languages and Linguistics
7 5 2.25 16 Westminster 0 2.24 Aberystwyth B: Celtic studies 0 2.10
54 n/a Greenwich 3 7 2.14 6 Aberystwyth A: Modern languages and Linguistics
7 2.11 Salford 0 1.80
55 n/a Salford 11 2 2.04 22 Salford 3 2.08 Westminster 0 1.60 56 n/a Westminster 4 0 1.99 8 Greenwich – – Greenwich – – 57 n/a London Institute in Paris 3 0 1.54 5 London Institute in Paris – – London Institute in Paris – –
n/a National profile 1,386 30 2.96 4,101 National profile 24.8 2.86 National profile 37.8 3.12 29 English Language and Literature
1 2.95 Warwick 37 58 3.53 132 Warwick 49 3.41 Newcastle 100 4.00 2 3.15 York 36 61 3.49 126 York 49 3.33 Kingston 100 4.00 3 2.90 Newcastle 32 57 3.46 111 Durham 42 3.30 Swansea 100 4.00 4 2.80 Durham 34 52 3.42 116 UCL 50 3.29 Bedfordshire 100 4.00 5 3.05 Queen Mary 41 54 3.41 140 Aberdeen 38 3.28 St Andrews 90 3.90 6 2.95 St Andrews 28 54 3.40 95 Queen Mary 41 3.23 Warwick 68 3.68
=7 2.85 UCL 28 52 3.36 95 Newcastle 38 3.21 Lancaster 67 3.67 =7 2.60 Swansea 17 53 3.36 56 St Andrews 42 3.21 Manchester Met 63 3.63
9 2.70 Sussex 35 45 3.28 113 Cambridge 38 3.20 Oxford 60 3.60 =10 3.00 Nottingham 42 48 3.27 137 Cardiff 36 3.20 Queen Mary 68 3.60 =10 2.85 Cardiff 24 42 3.27 79 Swansea 41 3.17 Queen’s Belfast 60 3.60 =10 2.80 UEA 18 45 3.27 60 Sussex 43 3.16 York 68 3.60
13 3.00 Oxford 88 42 3.26 286 Huddersfield 31 3.16 Bolton 60 3.60 14 2.90 Aberdeen 22 31 3.24 70 Oxford Brookes 30 3.14 UEA 53 3.53
=15 2.80 King’s College London 45 45 3.23 144 Northumbria 37 3.12 King’s College London 52 3.52
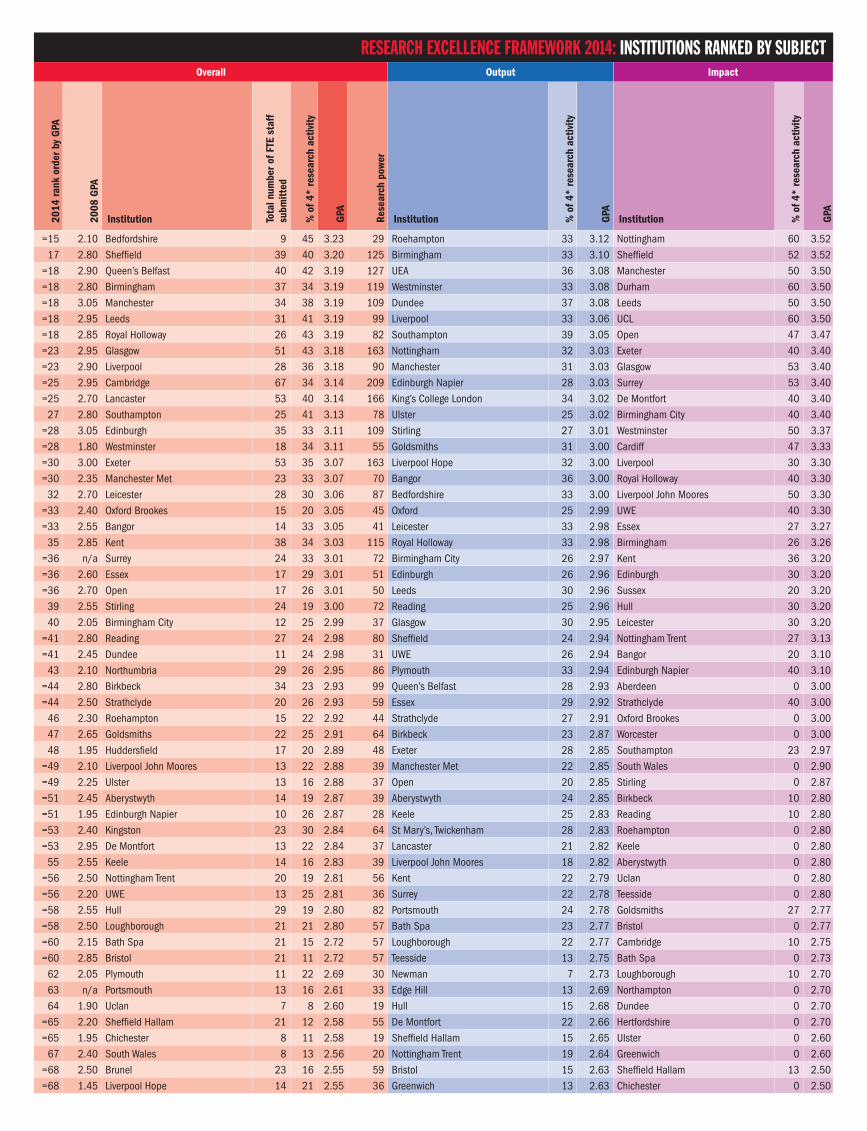
RESEARCH EXCELLENCE FRAMEWORK 2014: INSTITUTIONS RANKED BY SUBJECTOverall Output Impact
2014
rank
ord
er b
y G
PA
2008
GPA
Institution Tota
l num
ber o
f FTE
sta
ff
subm
itted
% o
f 4*
rese
arch
act
ivity
GPA
Rese
arch
pow
er
Institution % o
f 4*
rese
arch
act
ivity
GPA
Institution % o
f 4*
rese
arch
act
ivity
GPA
=15 2.10 Bedfordshire 9 45 3.23 29 Roehampton 33 3.12 Nottingham 60 3.52 17 2.80 Sheffield 39 40 3.20 125 Birmingham 33 3.10 Sheffield 52 3.52
=18 2.90 Queen’s Belfast 40 42 3.19 127 UEA 36 3.08 Manchester 50 3.50 =18 2.80 Birmingham 37 34 3.19 119 Westminster 33 3.08 Durham 60 3.50 =18 3.05 Manchester 34 38 3.19 109 Dundee 37 3.08 Leeds 50 3.50 =18 2.95 Leeds 31 41 3.19 99 Liverpool 33 3.06 UCL 60 3.50 =18 2.85 Royal Holloway 26 43 3.19 82 Southampton 39 3.05 Open 47 3.47 =23 2.95 Glasgow 51 43 3.18 163 Nottingham 32 3.03 Exeter 40 3.40 =23 2.90 Liverpool 28 36 3.18 90 Manchester 31 3.03 Glasgow 53 3.40 =25 2.95 Cambridge 67 34 3.14 209 Edinburgh Napier 28 3.03 Surrey 53 3.40 =25 2.70 Lancaster 53 40 3.14 166 King’s College London 34 3.02 De Montfort 40 3.40
27 2.80 Southampton 25 41 3.13 78 Ulster 25 3.02 Birmingham City 40 3.40 =28 3.05 Edinburgh 35 33 3.11 109 Stirling 27 3.01 Westminster 50 3.37 =28 1.80 Westminster 18 34 3.11 55 Goldsmiths 31 3.00 Cardiff 47 3.33 =30 3.00 Exeter 53 35 3.07 163 Liverpool Hope 32 3.00 Liverpool 30 3.30 =30 2.35 Manchester Met 23 33 3.07 70 Bangor 36 3.00 Royal Holloway 40 3.30
32 2.70 Leicester 28 30 3.06 87 Bedfordshire 33 3.00 Liverpool John Moores 50 3.30 =33 2.40 Oxford Brookes 15 20 3.05 45 Oxford 25 2.99 UWE 40 3.30 =33 2.55 Bangor 14 33 3.05 41 Leicester 33 2.98 Essex 27 3.27
35 2.85 Kent 38 34 3.03 115 Royal Holloway 33 2.98 Birmingham 26 3.26 =36 n/a Surrey 24 33 3.01 72 Birmingham City 26 2.97 Kent 36 3.20 =36 2.60 Essex 17 29 3.01 51 Edinburgh 26 2.96 Edinburgh 30 3.20 =36 2.70 Open 17 26 3.01 50 Leeds 30 2.96 Sussex 20 3.20
39 2.55 Stirling 24 19 3.00 72 Reading 25 2.96 Hull 30 3.20 40 2.05 Birmingham City 12 25 2.99 37 Glasgow 30 2.95 Leicester 30 3.20
=41 2.80 Reading 27 24 2.98 80 Sheffield 24 2.94 Nottingham Trent 27 3.13 =41 2.45 Dundee 11 24 2.98 31 UWE 26 2.94 Bangor 20 3.10
43 2.10 Northumbria 29 26 2.95 86 Plymouth 33 2.94 Edinburgh Napier 40 3.10 =44 2.80 Birkbeck 34 23 2.93 99 Queen’s Belfast 28 2.93 Aberdeen 0 3.00 =44 2.50 Strathclyde 20 26 2.93 59 Essex 29 2.92 Strathclyde 40 3.00
46 2.30 Roehampton 15 22 2.92 44 Strathclyde 27 2.91 Oxford Brookes 0 3.00 47 2.65 Goldsmiths 22 25 2.91 64 Birkbeck 23 2.87 Worcester 0 3.00 48 1.95 Huddersfield 17 20 2.89 48 Exeter 28 2.85 Southampton 23 2.97
=49 2.10 Liverpool John Moores 13 22 2.88 39 Manchester Met 22 2.85 South Wales 0 2.90 =49 2.25 Ulster 13 16 2.88 37 Open 20 2.85 Stirling 0 2.87 =51 2.45 Aberystwyth 14 19 2.87 39 Aberystwyth 24 2.85 Birkbeck 10 2.80 =51 1.95 Edinburgh Napier 10 26 2.87 28 Keele 25 2.83 Reading 10 2.80 =53 2.40 Kingston 23 30 2.84 64 St Mary’s, Twickenham 28 2.83 Roehampton 0 2.80 =53 2.95 De Montfort 13 22 2.84 37 Lancaster 21 2.82 Keele 0 2.80
55 2.55 Keele 14 16 2.83 39 Liverpool John Moores 18 2.82 Aberystwyth 0 2.80 =56 2.50 Nottingham Trent 20 19 2.81 56 Kent 22 2.79 Uclan 0 2.80 =56 2.20 UWE 13 25 2.81 36 Surrey 22 2.78 Teesside 0 2.80 =58 2.55 Hull 29 19 2.80 82 Portsmouth 24 2.78 Goldsmiths 27 2.77 =58 2.50 Loughborough 21 21 2.80 57 Bath Spa 23 2.77 Bristol 0 2.77 =60 2.15 Bath Spa 21 15 2.72 57 Loughborough 22 2.77 Cambridge 10 2.75 =60 2.85 Bristol 21 11 2.72 57 Teesside 13 2.75 Bath Spa 0 2.73
62 2.05 Plymouth 11 22 2.69 30 Newman 7 2.73 Loughborough 10 2.70 63 n/a Portsmouth 13 16 2.61 33 Edge Hill 13 2.69 Northampton 0 2.70 64 1.90 Uclan 7 8 2.60 19 Hull 15 2.68 Dundee 0 2.70
=65 2.20 Sheffield Hallam 21 12 2.58 55 De Montfort 22 2.66 Hertfordshire 0 2.70 =65 1.95 Chichester 8 11 2.58 19 Sheffield Hallam 15 2.65 Ulster 0 2.60
67 2.40 South Wales 8 13 2.56 20 Nottingham Trent 19 2.64 Greenwich 0 2.60 =68 2.50 Brunel 23 16 2.55 59 Bristol 15 2.63 Sheffield Hallam 13 2.50 =68 1.45 Liverpool Hope 14 21 2.55 36 Greenwich 13 2.63 Chichester 0 2.50
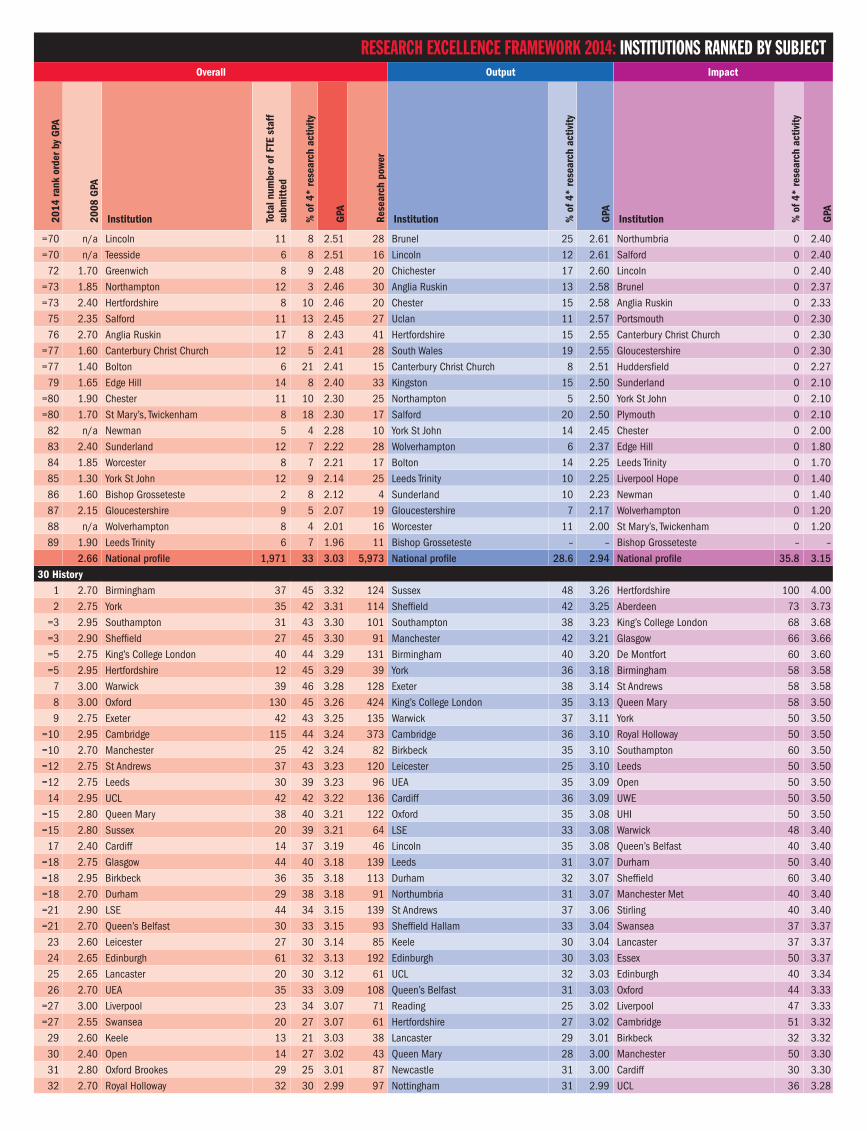
RESEARCH EXCELLENCE FRAMEWORK 2014: INSTITUTIONS RANKED BY SUBJECTOverall Output Impact
2014
rank
ord
er b
y G
PA
2008
GPA
Institution Tota
l num
ber o
f FTE
sta
ff
subm
itted
% o
f 4*
rese
arch
act
ivity
GPA
Rese
arch
pow
er
Institution % o
f 4*
rese
arch
act
ivity
GPA
Institution % o
f 4*
rese
arch
act
ivity
GPA
=70 n/a Lincoln 11 8 2.51 28 Brunel 25 2.61 Northumbria 0 2.40 =70 n/a Teesside 6 8 2.51 16 Lincoln 12 2.61 Salford 0 2.40
72 1.70 Greenwich 8 9 2.48 20 Chichester 17 2.60 Lincoln 0 2.40 =73 1.85 Northampton 12 3 2.46 30 Anglia Ruskin 13 2.58 Brunel 0 2.37 =73 2.40 Hertfordshire 8 10 2.46 20 Chester 15 2.58 Anglia Ruskin 0 2.33
75 2.35 Salford 11 13 2.45 27 Uclan 11 2.57 Portsmouth 0 2.30 76 2.70 Anglia Ruskin 17 8 2.43 41 Hertfordshire 15 2.55 Canterbury Christ Church 0 2.30
=77 1.60 Canterbury Christ Church 12 5 2.41 28 South Wales 19 2.55 Gloucestershire 0 2.30 =77 1.40 Bolton 6 21 2.41 15 Canterbury Christ Church 8 2.51 Huddersfield 0 2.27
79 1.65 Edge Hill 14 8 2.40 33 Kingston 15 2.50 Sunderland 0 2.10 =80 1.90 Chester 11 10 2.30 25 Northampton 5 2.50 York St John 0 2.10 =80 1.70 St Mary’s, Twickenham 8 18 2.30 17 Salford 20 2.50 Plymouth 0 2.10
82 n/a Newman 5 4 2.28 10 York St John 14 2.45 Chester 0 2.00 83 2.40 Sunderland 12 7 2.22 28 Wolverhampton 6 2.37 Edge Hill 0 1.80 84 1.85 Worcester 8 7 2.21 17 Bolton 14 2.25 Leeds Trinity 0 1.70 85 1.30 York St John 12 9 2.14 25 Leeds Trinity 10 2.25 Liverpool Hope 0 1.40 86 1.60 Bishop Grosseteste 2 8 2.12 4 Sunderland 10 2.23 Newman 0 1.40 87 2.15 Gloucestershire 9 5 2.07 19 Gloucestershire 7 2.17 Wolverhampton 0 1.20 88 n/a Wolverhampton 8 4 2.01 16 Worcester 11 2.00 St Mary’s, Twickenham 0 1.20 89 1.90 Leeds Trinity 6 7 1.96 11 Bishop Grosseteste – – Bishop Grosseteste – –
2.66 National profile 1,971 33 3.03 5,973 National profile 28.6 2.94 National profile 35.8 3.15 30 History
1 2.70 Birmingham 37 45 3.32 124 Sussex 48 3.26 Hertfordshire 100 4.00 2 2.75 York 35 42 3.31 114 Sheffield 42 3.25 Aberdeen 73 3.73
=3 2.95 Southampton 31 43 3.30 101 Southampton 38 3.23 King’s College London 68 3.68 =3 2.90 Sheffield 27 45 3.30 91 Manchester 42 3.21 Glasgow 66 3.66 =5 2.75 King’s College London 40 44 3.29 131 Birmingham 40 3.20 De Montfort 60 3.60 =5 2.95 Hertfordshire 12 45 3.29 39 York 36 3.18 Birmingham 58 3.58
7 3.00 Warwick 39 46 3.28 128 Exeter 38 3.14 St Andrews 58 3.58 8 3.00 Oxford 130 45 3.26 424 King’s College London 35 3.13 Queen Mary 58 3.50 9 2.75 Exeter 42 43 3.25 135 Warwick 37 3.11 York 50 3.50
=10 2.95 Cambridge 115 44 3.24 373 Cambridge 36 3.10 Royal Holloway 50 3.50 =10 2.70 Manchester 25 42 3.24 82 Birkbeck 35 3.10 Southampton 60 3.50 =12 2.75 St Andrews 37 43 3.23 120 Leicester 25 3.10 Leeds 50 3.50 =12 2.75 Leeds 30 39 3.23 96 UEA 35 3.09 Open 50 3.50
14 2.95 UCL 42 42 3.22 136 Cardiff 36 3.09 UWE 50 3.50 =15 2.80 Queen Mary 38 40 3.21 122 Oxford 35 3.08 UHI 50 3.50 =15 2.80 Sussex 20 39 3.21 64 LSE 33 3.08 Warwick 48 3.40
17 2.40 Cardiff 14 37 3.19 46 Lincoln 35 3.08 Queen’s Belfast 40 3.40 =18 2.75 Glasgow 44 40 3.18 139 Leeds 31 3.07 Durham 50 3.40 =18 2.95 Birkbeck 36 35 3.18 113 Durham 32 3.07 Sheffield 60 3.40 =18 2.70 Durham 29 38 3.18 91 Northumbria 31 3.07 Manchester Met 40 3.40 =21 2.90 LSE 44 34 3.15 139 St Andrews 37 3.06 Stirling 40 3.40 =21 2.70 Queen’s Belfast 30 33 3.15 93 Sheffield Hallam 33 3.04 Swansea 37 3.37
23 2.60 Leicester 27 30 3.14 85 Keele 30 3.04 Lancaster 37 3.37 24 2.65 Edinburgh 61 32 3.13 192 Edinburgh 30 3.03 Essex 50 3.37 25 2.65 Lancaster 20 30 3.12 61 UCL 32 3.03 Edinburgh 40 3.34 26 2.70 UEA 35 33 3.09 108 Queen’s Belfast 31 3.03 Oxford 44 3.33
=27 3.00 Liverpool 23 34 3.07 71 Reading 25 3.02 Liverpool 47 3.33 =27 2.55 Swansea 20 27 3.07 61 Hertfordshire 27 3.02 Cambridge 51 3.32
29 2.60 Keele 13 21 3.03 38 Lancaster 29 3.01 Birkbeck 32 3.32 30 2.40 Open 14 27 3.02 43 Queen Mary 28 3.00 Manchester 50 3.30 31 2.80 Oxford Brookes 29 25 3.01 87 Newcastle 31 3.00 Cardiff 30 3.30 32 2.70 Royal Holloway 32 30 2.99 97 Nottingham 31 2.99 UCL 36 3.28

RESEARCH EXCELLENCE FRAMEWORK 2014: INSTITUTIONS RANKED BY SUBJECTOverall Output Impact
2014
rank
ord
er b
y G
PA
2008
GPA
Institution Tota
l num
ber o
f FTE
sta
ff
subm
itted
% o
f 4*
rese
arch
act
ivity
GPA
Rese
arch
pow
er
Institution % o
f 4*
rese
arch
act
ivity
GPA
Institution % o
f 4*
rese
arch
act
ivity
GPA
33 2.50 Reading 16 20 2.98 48 Oxford Brookes 29 2.99 Exeter 40 3.24 34 3.00 Kent 31 27 2.96 93 Liverpool 31 2.99 Kent 40 3.20
=35 2.85 Aberdeen 24 26 2.95 71 Goldsmiths 28 2.95 Bangor 20 3.20 =35 2.30 Strathclyde 22 27 2.95 65 Glasgow 25 2.92 Teesside 20 3.20 =35 2.60 Bristol 19 25 2.95 55 Open 25 2.92 LSE 34 3.18
38 2.05 Goldsmiths 10 21 2.94 29 Bristol 27 2.91 Strathclyde 27 3.13 39 2.60 Nottingham 29 28 2.92 85 Swansea 21 2.90 Sussex 27 3.13 40 2.45 Bangor 13 11 2.90 38 Kent 24 2.89 Dundee 27 3.03
=41 1.85 Northumbria 20 23 2.88 58 Strathclyde 29 2.89 UEA 30 3.00 =41 2.50 Stirling 13 22 2.88 37 Northampton 22 2.89 Nottingham 40 3.00 =43 3.00 Essex 18 19 2.87 52 Bangor 11 2.81 Oxford Brookes 10 3.00 =43 2.05 Sheffield Hallam 15 24 2.87 43 Hull 22 2.78 Leicester 30 3.00
45 2.30 Northampton 8 19 2.86 23 Teesside 14 2.78 Hull 10 3.00 46 2.70 Hull 25 18 2.83 71 Huddersfield 14 2.76 Reading 13 3.00
=47 n/a Manchester Met 14 16 2.82 40 Dundee 16 2.75 Roehampton 0 3.00 =47 2.40 Teesside 11 13 2.82 31 Roehampton 21 2.75 Wolverhampton 0 3.00 =49 2.40 Newcastle 24 20 2.81 67 Glasgow Caledonian 7 2.75 Keele 0 3.00 =49 2.25 Lincoln 11 23 2.81 31 Soas 21 2.74 Nottingham Trent 20 3.00 =49 2.15 Glasgow Caledonian 6 9 2.81 17 South Wales 12 2.74 Ulster 13 2.90
52 n/a UHI 4 17 2.80 12 Manchester Met 12 2.73 Huddersfield 20 2.90 =53 2.70 Dundee 16 16 2.77 44 Royal Holloway 18 2.71 Goldsmiths 0 2.80 =53 2.35 UWE 13 13 2.77 37 Westminster 19 2.71 Edge Hill 20 2.80 =55 2.40 Huddersfield 14 13 2.76 39 Plymouth 14 2.69 Glasgow Caledonian 0 2.80 =55 2.10 Nottingham Trent 8 11 2.76 23 Winchester 15 2.69 Sheffield Hallam 13 2.77 =57 2.30 Roehampton 14 14 2.70 38 Aberdeen 14 2.68 Bath Spa 0 2.70 =57 2.30 De Montfort 13 16 2.70 34 Essex 12 2.67 Worcester 0 2.70 =59 2.35 Aberystwyth 15 8 2.69 40 Nottingham Trent 9 2.67 Bristol 0 2.63 =59 2.55 South Wales 8 8 2.69 21 Stirling 15 2.66 South Wales 0 2.60
61 2.55 Ulster 16 10 2.65 43 Canterbury Christ Church 6 2.64 Liverpool John Moores 0 2.60 =62 2.00 Canterbury Christ Church 14 5 2.63 37 Aberystwyth 6 2.63 Aberystwyth 0 2.50 =62 2.10 Plymouth 11 9 2.63 29 Liverpool John Moores 9 2.61 Canterbury Christ Church 0 2.50
64 1.85 Edge Hill 7 11 2.62 18 Edge Hill 10 2.60 Winchester 0 2.50 65 2.55 Winchester 11 10 2.59 28 UHI 6 2.59 Liverpool Hope 0 2.50 66 2.80 Soas 17 15 2.58 44 UWE 2 2.53 Northampton 0 2.50 67 2.15 Wolverhampton 13 7 2.56 34 Ulster 9 2.52 Newcastle 0 2.47
=68 1.90 Liverpool John Moores 7 6 2.53 18 Wolverhampton 11 2.51 Lincoln 0 2.40 =68 1.40 Worcester 5 13 2.53 13 Chichester 12 2.50 Plymouth 0 2.40
70 2.00 Chichester 8 9 2.46 18 Chester 5 2.50 Leeds Trinity 0 2.40 71 1.75 Newman 2 7 2.43 6 Anglia Ruskin 13 2.50 Uclan 0 2.30 72 2.35 Chester 6 3 2.35 14 Worcester 20 2.45 Chester 0 2.30 73 2.00 Westminster 5 12 2.34 12 St Mary’s, Twickenham 19 2.44 Northumbria 0 2.23 74 2.20 Uclan 10 7 2.33 24 De Montfort 4 2.38 Chichester 0 2.20 75 n/a Liverpool Hope 11 4 2.31 24 Sunderland 6 2.38 Soas 0 2.10 76 2.00 Leeds Trinity 4 0 2.24 9 Uclan 10 2.35 Westminster 0 2.10 77 2.25 Greenwich 7 4 2.23 15 Liverpool Hope 7 2.32 Greenwich 0 2.00 78 n/a St Mary’s, Twickenham 4 12 2.22 9 Greenwich 7 2.28 Gloucestershire 0 2.00 79 2.30 Bath Spa 6 2 2.18 14 Leeds Trinity 0 2.27 St Mary’s, Twickenham 0 2.00 80 2.35 Sunderland 4 6 2.16 9 Gloucestershire 7 2.11 Sunderland 0 1.30 81 2.65 Anglia Ruskin 6 8 2.12 12 Bath Spa 4 2.07 Anglia Ruskin 0 1.00 82 1.90 Gloucestershire 5 5 1.95 9 Bishop Grosseteste – – Bishop Grosseteste – – 83 n/a Bishop Grosseteste 3 6 1.93 6 Newman – – Newman – –
2.66 National profile 1,786 31 3.04 5,429 National profile 27.8 2.96 National profile 36.1 3.18 31 Classics*
1 3.15 Cambridge 39 53 3.41 131 Cambridge 39 3.19 Cambridge 66 3.66
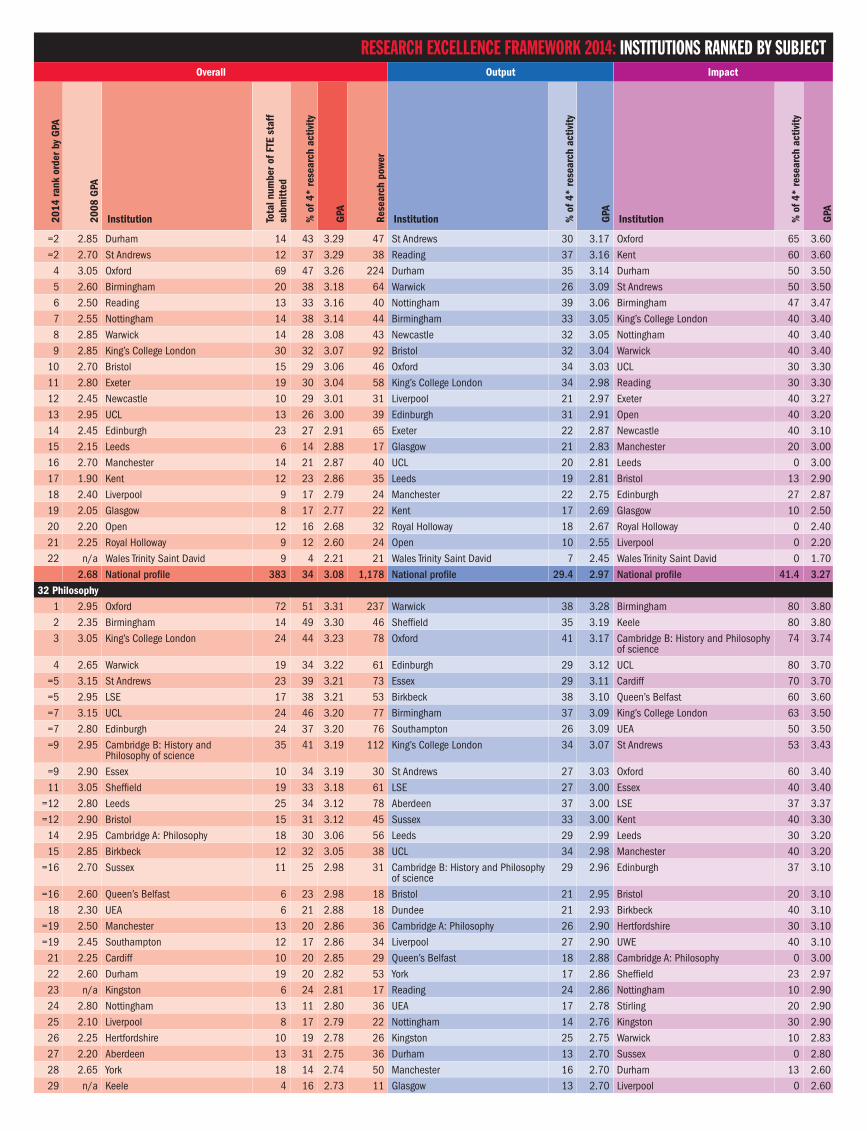
RESEARCH EXCELLENCE FRAMEWORK 2014: INSTITUTIONS RANKED BY SUBJECTOverall Output Impact
2014
rank
ord
er b
y G
PA
2008
GPA
Institution Tota
l num
ber o
f FTE
sta
ff
subm
itted
% o
f 4*
rese
arch
act
ivity
GPA
Rese
arch
pow
er
Institution % o
f 4*
rese
arch
act
ivity
GPA
Institution % o
f 4*
rese
arch
act
ivity
GPA
=2 2.85 Durham 14 43 3.29 47 St Andrews 30 3.17 Oxford 65 3.60 =2 2.70 St Andrews 12 37 3.29 38 Reading 37 3.16 Kent 60 3.60
4 3.05 Oxford 69 47 3.26 224 Durham 35 3.14 Durham 50 3.50 5 2.60 Birmingham 20 38 3.18 64 Warwick 26 3.09 St Andrews 50 3.50 6 2.50 Reading 13 33 3.16 40 Nottingham 39 3.06 Birmingham 47 3.47 7 2.55 Nottingham 14 38 3.14 44 Birmingham 33 3.05 King’s College London 40 3.40 8 2.85 Warwick 14 28 3.08 43 Newcastle 32 3.05 Nottingham 40 3.40 9 2.85 King’s College London 30 32 3.07 92 Bristol 32 3.04 Warwick 40 3.40
10 2.70 Bristol 15 29 3.06 46 Oxford 34 3.03 UCL 30 3.30 11 2.80 Exeter 19 30 3.04 58 King’s College London 34 2.98 Reading 30 3.30 12 2.45 Newcastle 10 29 3.01 31 Liverpool 21 2.97 Exeter 40 3.27 13 2.95 UCL 13 26 3.00 39 Edinburgh 31 2.91 Open 40 3.20 14 2.45 Edinburgh 23 27 2.91 65 Exeter 22 2.87 Newcastle 40 3.10 15 2.15 Leeds 6 14 2.88 17 Glasgow 21 2.83 Manchester 20 3.00 16 2.70 Manchester 14 21 2.87 40 UCL 20 2.81 Leeds 0 3.00 17 1.90 Kent 12 23 2.86 35 Leeds 19 2.81 Bristol 13 2.90 18 2.40 Liverpool 9 17 2.79 24 Manchester 22 2.75 Edinburgh 27 2.87 19 2.05 Glasgow 8 17 2.77 22 Kent 17 2.69 Glasgow 10 2.50 20 2.20 Open 12 16 2.68 32 Royal Holloway 18 2.67 Royal Holloway 0 2.40 21 2.25 Royal Holloway 9 12 2.60 24 Open 10 2.55 Liverpool 0 2.20 22 n/a Wales Trinity Saint David 9 4 2.21 21 Wales Trinity Saint David 7 2.45 Wales Trinity Saint David 0 1.70
2.68 National profile 383 34 3.08 1,178 National profile 29.4 2.97 National profile 41.4 3.27 32 Philosophy
1 2.95 Oxford 72 51 3.31 237 Warwick 38 3.28 Birmingham 80 3.80 2 2.35 Birmingham 14 49 3.30 46 Sheffield 35 3.19 Keele 80 3.80 3 3.05 King’s College London 24 44 3.23 78 Oxford 41 3.17 Cambridge B: History and Philosophy
of science 74 3.74
4 2.65 Warwick 19 34 3.22 61 Edinburgh 29 3.12 UCL 80 3.70 =5 3.15 St Andrews 23 39 3.21 73 Essex 29 3.11 Cardiff 70 3.70 =5 2.95 LSE 17 38 3.21 53 Birkbeck 38 3.10 Queen’s Belfast 60 3.60 =7 3.15 UCL 24 46 3.20 77 Birmingham 37 3.09 King’s College London 63 3.50 =7 2.80 Edinburgh 24 37 3.20 76 Southampton 26 3.09 UEA 50 3.50 =9 2.95 Cambridge B: History and
Philosophy of science 35 41 3.19 112 King’s College London 34 3.07 St Andrews 53 3.43
=9 2.90 Essex 10 34 3.19 30 St Andrews 27 3.03 Oxford 60 3.40 11 3.05 Sheffield 19 33 3.18 61 LSE 27 3.00 Essex 40 3.40
=12 2.80 Leeds 25 34 3.12 78 Aberdeen 37 3.00 LSE 37 3.37 =12 2.90 Bristol 15 31 3.12 45 Sussex 33 3.00 Kent 40 3.30
14 2.95 Cambridge A: Philosophy 18 30 3.06 56 Leeds 29 2.99 Leeds 30 3.20 15 2.85 Birkbeck 12 32 3.05 38 UCL 34 2.98 Manchester 40 3.20
=16 2.70 Sussex 11 25 2.98 31 Cambridge B: History and Philosophy of science
29 2.96 Edinburgh 37 3.10
=16 2.60 Queen’s Belfast 6 23 2.98 18 Bristol 21 2.95 Bristol 20 3.10 18 2.30 UEA 6 21 2.88 18 Dundee 21 2.93 Birkbeck 40 3.10
=19 2.50 Manchester 13 20 2.86 36 Cambridge A: Philosophy 26 2.90 Hertfordshire 30 3.10 =19 2.45 Southampton 12 17 2.86 34 Liverpool 27 2.90 UWE 40 3.10
21 2.25 Cardiff 10 20 2.85 29 Queen’s Belfast 18 2.88 Cambridge A: Philosophy 0 3.00 22 2.60 Durham 19 20 2.82 53 York 17 2.86 Sheffield 23 2.97 23 n/a Kingston 6 24 2.81 17 Reading 24 2.86 Nottingham 10 2.90 24 2.80 Nottingham 13 11 2.80 36 UEA 17 2.78 Stirling 20 2.90 25 2.10 Liverpool 8 17 2.79 22 Nottingham 14 2.76 Kingston 30 2.90 26 2.25 Hertfordshire 10 19 2.78 26 Kingston 25 2.75 Warwick 10 2.83 27 2.20 Aberdeen 13 31 2.75 36 Durham 13 2.70 Sussex 0 2.80 28 2.65 York 18 14 2.74 50 Manchester 16 2.70 Durham 13 2.60 29 n/a Keele 4 16 2.73 11 Glasgow 13 2.70 Liverpool 0 2.60

RESEARCH EXCELLENCE FRAMEWORK 2014: INSTITUTIONS RANKED BY SUBJECTOverall Output Impact
2014
rank
ord
er b
y G
PA
2008
GPA
Institution Tota
l num
ber o
f FTE
sta
ff
subm
itted
% o
f 4*
rese
arch
act
ivity
GPA
Rese
arch
pow
er
Institution % o
f 4*
rese
arch
act
ivity
GPA
Institution % o
f 4*
rese
arch
act
ivity
GPA
=30 2.35 Kent 13 18 2.72 36 Cardiff 10 2.68 Manchester Met 0 2.50 =30 3.05 Reading 11 17 2.72 30 Hertfordshire 18 2.66 Hull 0 2.50
32 2.95 Stirling 12 13 2.71 34 Stirling 14 2.63 Southampton 0 2.30 33 2.50 Dundee 5 14 2.68 13 Kent 13 2.56 Open 10 2.30 34 2.60 Glasgow 11 8 2.57 28 Open 7 2.50 York 0 2.27 35 n/a UWE 6 11 2.45 15 Oxford Brookes 14 2.50 Reading 0 2.20 36 2.35 Open 8 6 2.39 19 Keele 0 2.44 Glasgow 0 2.20 37 1.75 Oxford Brookes 6 9 2.30 14 UWE 5 2.35 Dundee 0 2.20 38 2.40 Manchester Met 8 4 2.26 18 Manchester Met 7 2.13 St Mary’s, Twickenham 20 2.20 39 2.20 Hull 7 2 2.22 16 Hull 3 2.10 Oxford Brookes 0 1.80 40 n/a St Mary’s, Twickenham 5 4 1.61 8 St Mary’s, Twickenham 0 1.40 Aberdeen 0 1.40
2.74 National profile 591 31 3.01 1,778 National profile 26.3 2.92 National profile 35.3 3.07 33 Theology and Religious studies*
1 3.00 Durham 25 50 3.34 83 Leeds 37 3.15 Lancaster 87 3.87 2 2.65 Birmingham 9 51 3.26 29 Birmingham 53 3.15 Durham 77 3.77
=3 2.60 Lancaster 22 42 3.15 70 Durham 35 3.11 Birmingham 60 3.60 =3 2.55 Leeds 11 33 3.15 34 UCL 32 3.07 Kent 60 3.60 =3 2.90 UCL 7 37 3.15 22 Oxford 36 3.06 Cambridge 53 3.53
6 2.90 Cambridge 24 34 3.12 76 Cardiff 35 3.05 Aberdeen 53 3.53 7 2.15 Kent 8 38 3.11 25 Soas 29 3.02 King’s College London 50 3.50 8 2.75 Edinburgh 27 34 3.09 82 Sheffield 20 3.00 Manchester 50 3.50 9 2.70 King’s College London 26 39 3.08 80 Nottingham 33 2.97 Wales Trinity Saint David 50 3.50
10 2.25 Cardiff 9 33 3.06 28 Bristol 28 2.91 Heythrop 40 3.40 11 2.70 Soas 14 29 3.04 43 St Andrews 28 2.90 Edinburgh 40 3.30 12 2.90 Oxford 33 34 3.02 99 Exeter 21 2.90 Glasgow 40 3.30
=13 2.75 Nottingham 16 30 3.01 47 Edinburgh 24 2.89 UCL 50 3.30 =13 2.45 Exeter 11 21 3.01 34 Kent 31 2.89 Exeter 20 3.20
15 2.85 Manchester 15 28 2.97 43 Cambridge 20 2.87 Winchester 20 3.10 =16 2.65 St Andrews 14 31 2.93 41 Open 27 2.86 Nottingham 13 3.00 =16 2.85 Sheffield 4 21 2.93 12 King’s College London 30 2.84 Leeds 20 3.00
18 2.95 Aberdeen 19 29 2.88 55 Lancaster 22 2.80 Oxford 40 2.90 19 2.45 Bristol 9 21 2.85 25 Manchester 18 2.71 St Andrews 40 2.90 20 1.50 Heythrop 16 22 2.82 45 Roehampton 24 2.64 Cardiff 20 2.90 21 2.25 Open 6 18 2.71 16 Canterbury Christ Church 9 2.55 Soas 20 2.80 22 n/a Wales Trinity Saint David 8 14 2.64 22 Aberdeen 17 2.54 Canterbury Christ Church 0 2.80 23 2.30 Glasgow 11 11 2.56 28 Heythrop 13 2.54 Liverpool Hope 0 2.70 24 1.60 Canterbury Christ Church 6 6 2.52 15 Wales Trinity Saint David 6 2.47 Sheffield 10 2.70 25 2.00 Roehampton 7 16 2.47 17 Liverpool Hope 15 2.41 St Mary’s, Twickenham 20 2.60 26 1.95 Liverpool Hope 15 9 2.37 35 Chester 13 2.40 Bristol 0 2.50 27 2.15 Chester 11 8 2.35 26 Glasgow 5 2.38 Gloucestershire 0 2.40 28 1.60 Winchester 8 6 2.33 20 St Mary’s, Twickenham 8 2.29 Open 0 2.30 29 2.20 Gloucestershire 5 3 2.21 12 York St John 3 2.23 Chester 0 2.10 30 2.20 St Mary’s, Twickenham 5 9 2.20 11 Leeds Trinity 0 2.20 Roehampton 0 2.10 31 1.45 York St John 7 2 2.07 14 Winchester 3 2.19 Leeds Trinity 0 2.00 32 1.65 Leeds Trinity 4 0 1.99 7 Gloucestershire 4 2.17 York St John 0 1.90 33 n/a Newman 2 0 1.79 4 Newman – – Newman – –
2.49 National profile 413 28 2.91 1,201 National profile 23.7 2.79 National profile 37.4 3.15 34 Art and Design: History, practice and theory
1 n/a Reading B: Typography and Graphic communication
8 56 3.51 29 Courtauld 50 3.39 Heriot–Watt 90 3.90
2 n/a Courtauld 33 56 3.49 113 Reading B: Typography and Graphic communication
46 3.39 York 87 3.87
3 n/a Westminster 24 45 3.36 81 St Andrews 44 3.33 UEA 80 3.80 4 n/a St Andrews 13 38 3.30 42 Warwick 46 3.20 Sheffield Hallam 73 3.73 5 n/a York 19 47 3.29 62 Westminster 34 3.19 Glasgow 73 3.73
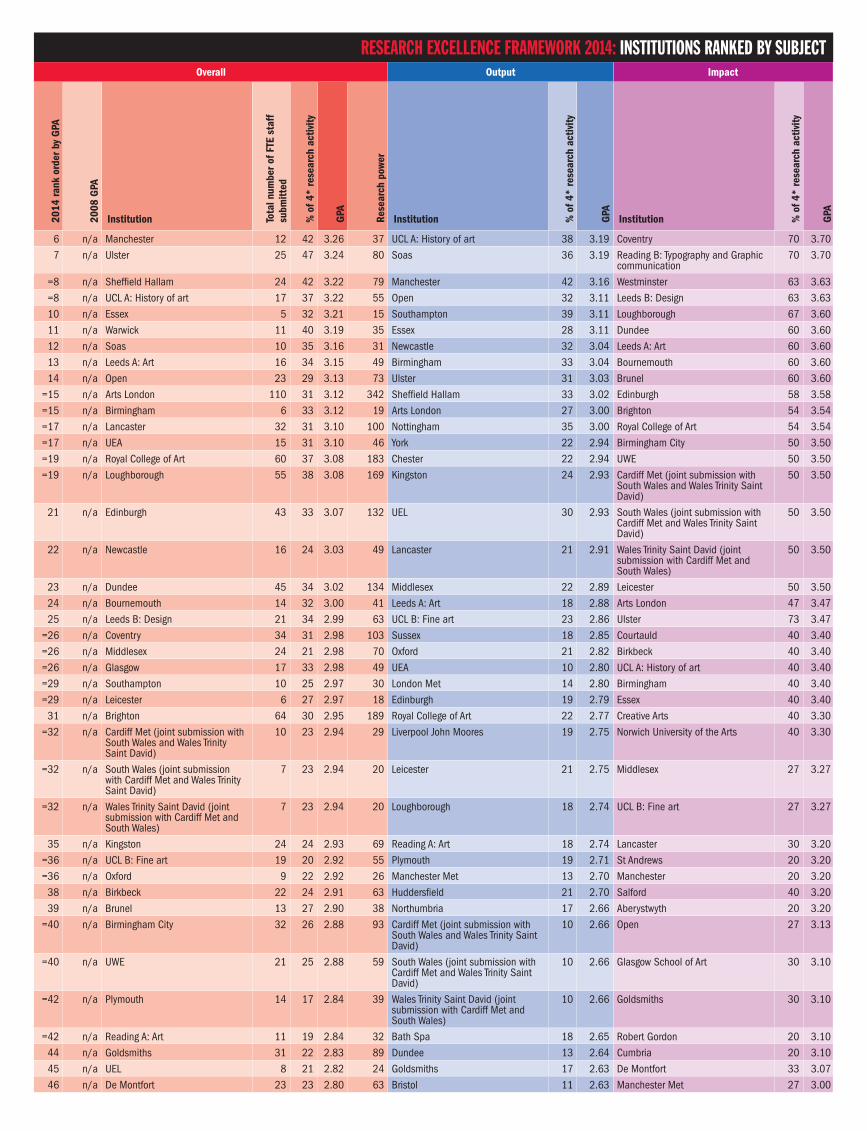
RESEARCH EXCELLENCE FRAMEWORK 2014: INSTITUTIONS RANKED BY SUBJECTOverall Output Impact
2014
rank
ord
er b
y G
PA
2008
GPA
Institution Tota
l num
ber o
f FTE
sta
ff
subm
itted
% o
f 4*
rese
arch
act
ivity
GPA
Rese
arch
pow
er
Institution % o
f 4*
rese
arch
act
ivity
GPA
Institution % o
f 4*
rese
arch
act
ivity
GPA
6 n/a Manchester 12 42 3.26 37 UCL A: History of art 38 3.19 Coventry 70 3.70 7 n/a Ulster 25 47 3.24 80 Soas 36 3.19 Reading B: Typography and Graphic
communication 70 3.70
=8 n/a Sheffield Hallam 24 42 3.22 79 Manchester 42 3.16 Westminster 63 3.63 =8 n/a UCL A: History of art 17 37 3.22 55 Open 32 3.11 Leeds B: Design 63 3.63 10 n/a Essex 5 32 3.21 15 Southampton 39 3.11 Loughborough 67 3.60 11 n/a Warwick 11 40 3.19 35 Essex 28 3.11 Dundee 60 3.60 12 n/a Soas 10 35 3.16 31 Newcastle 32 3.04 Leeds A: Art 60 3.60 13 n/a Leeds A: Art 16 34 3.15 49 Birmingham 33 3.04 Bournemouth 60 3.60 14 n/a Open 23 29 3.13 73 Ulster 31 3.03 Brunel 60 3.60
=15 n/a Arts London 110 31 3.12 342 Sheffield Hallam 33 3.02 Edinburgh 58 3.58 =15 n/a Birmingham 6 33 3.12 19 Arts London 27 3.00 Brighton 54 3.54 =17 n/a Lancaster 32 31 3.10 100 Nottingham 35 3.00 Royal College of Art 54 3.54 =17 n/a UEA 15 31 3.10 46 York 22 2.94 Birmingham City 50 3.50 =19 n/a Royal College of Art 60 37 3.08 183 Chester 22 2.94 UWE 50 3.50 =19 n/a Loughborough 55 38 3.08 169 Kingston 24 2.93 Cardiff Met (joint submission with
South Wales and Wales Trinity Saint David)
50 3.50
21 n/a Edinburgh 43 33 3.07 132 UEL 30 2.93 South Wales (joint submission with Cardiff Met and Wales Trinity Saint David)
50 3.50
22 n/a Newcastle 16 24 3.03 49 Lancaster 21 2.91 Wales Trinity Saint David (joint submission with Cardiff Met and South Wales)
50 3.50
23 n/a Dundee 45 34 3.02 134 Middlesex 22 2.89 Leicester 50 3.50 24 n/a Bournemouth 14 32 3.00 41 Leeds A: Art 18 2.88 Arts London 47 3.47 25 n/a Leeds B: Design 21 34 2.99 63 UCL B: Fine art 23 2.86 Ulster 73 3.47
=26 n/a Coventry 34 31 2.98 103 Sussex 18 2.85 Courtauld 40 3.40 =26 n/a Middlesex 24 21 2.98 70 Oxford 21 2.82 Birkbeck 40 3.40 =26 n/a Glasgow 17 33 2.98 49 UEA 10 2.80 UCL A: History of art 40 3.40 =29 n/a Southampton 10 25 2.97 30 London Met 14 2.80 Birmingham 40 3.40 =29 n/a Leicester 6 27 2.97 18 Edinburgh 19 2.79 Essex 40 3.40
31 n/a Brighton 64 30 2.95 189 Royal College of Art 22 2.77 Creative Arts 40 3.30 =32 n/a Cardiff Met (joint submission with
South Wales and Wales Trinity Saint David)
10 23 2.94 29 Liverpool John Moores 19 2.75 Norwich University of the Arts 40 3.30
=32 n/a South Wales (joint submission with Cardiff Met and Wales Trinity Saint David)
7 23 2.94 20 Leicester 21 2.75 Middlesex 27 3.27
=32 n/a Wales Trinity Saint David (joint submission with Cardiff Met and South Wales)
7 23 2.94 20 Loughborough 18 2.74 UCL B: Fine art 27 3.27
35 n/a Kingston 24 24 2.93 69 Reading A: Art 18 2.74 Lancaster 30 3.20 =36 n/a UCL B: Fine art 19 20 2.92 55 Plymouth 19 2.71 St Andrews 20 3.20 =36 n/a Oxford 9 22 2.92 26 Manchester Met 13 2.70 Manchester 20 3.20
38 n/a Birkbeck 22 24 2.91 63 Huddersfield 21 2.70 Salford 40 3.20 39 n/a Brunel 13 27 2.90 38 Northumbria 17 2.66 Aberystwyth 20 3.20
=40 n/a Birmingham City 32 26 2.88 93 Cardiff Met (joint submission with South Wales and Wales Trinity Saint David)
10 2.66 Open 27 3.13
=40 n/a UWE 21 25 2.88 59 South Wales (joint submission with Cardiff Met and Wales Trinity Saint David)
10 2.66 Glasgow School of Art 30 3.10
=42 n/a Plymouth 14 17 2.84 39 Wales Trinity Saint David (joint submission with Cardiff Met and South Wales)
10 2.66 Goldsmiths 30 3.10
=42 n/a Reading A: Art 11 19 2.84 32 Bath Spa 18 2.65 Robert Gordon 20 3.10 44 n/a Goldsmiths 31 22 2.83 89 Dundee 13 2.64 Cumbria 20 3.10 45 n/a UEL 8 21 2.82 24 Goldsmiths 17 2.63 De Montfort 33 3.07 46 n/a De Montfort 23 23 2.80 63 Bristol 11 2.63 Manchester Met 27 3.00
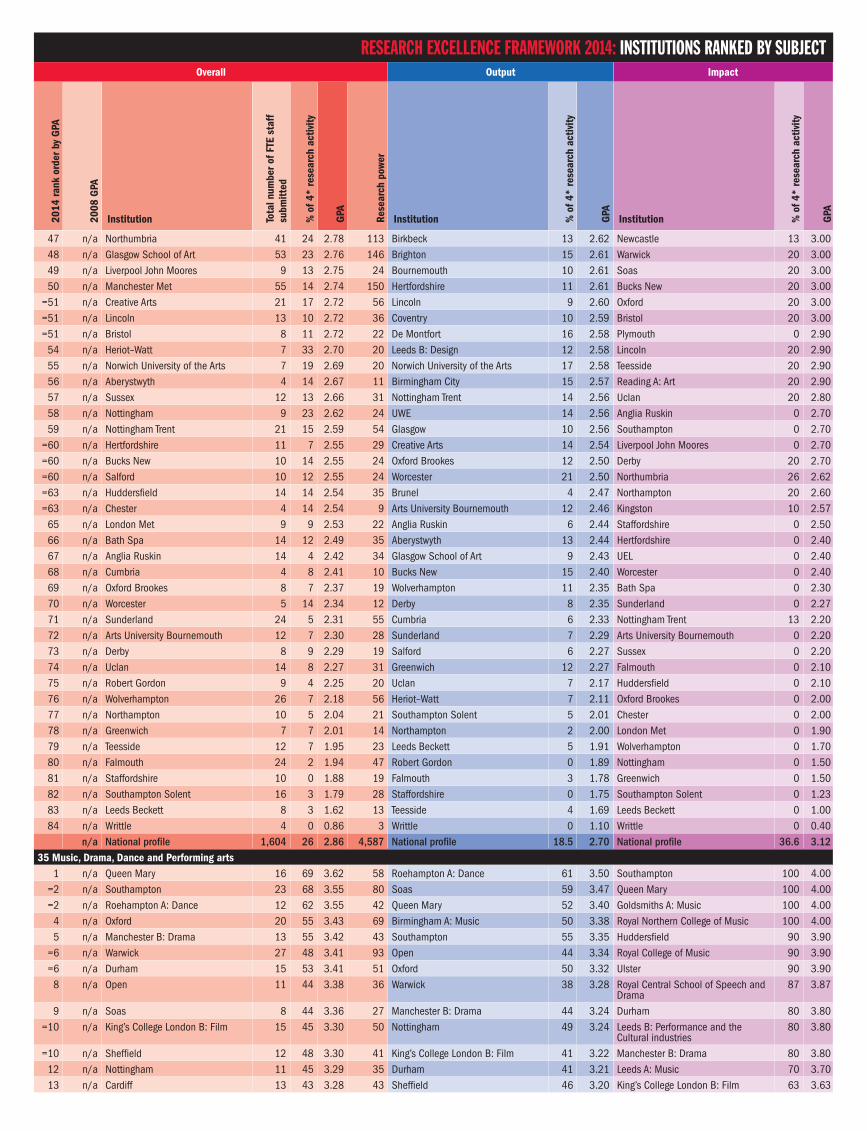
RESEARCH EXCELLENCE FRAMEWORK 2014: INSTITUTIONS RANKED BY SUBJECTOverall Output Impact
2014
rank
ord
er b
y G
PA
2008
GPA
Institution Tota
l num
ber o
f FTE
sta
ff
subm
itted
% o
f 4*
rese
arch
act
ivity
GPA
Rese
arch
pow
er
Institution % o
f 4*
rese
arch
act
ivity
GPA
Institution % o
f 4*
rese
arch
act
ivity
GPA
47 n/a Northumbria 41 24 2.78 113 Birkbeck 13 2.62 Newcastle 13 3.00 48 n/a Glasgow School of Art 53 23 2.76 146 Brighton 15 2.61 Warwick 20 3.00 49 n/a Liverpool John Moores 9 13 2.75 24 Bournemouth 10 2.61 Soas 20 3.00 50 n/a Manchester Met 55 14 2.74 150 Hertfordshire 11 2.61 Bucks New 20 3.00
=51 n/a Creative Arts 21 17 2.72 56 Lincoln 9 2.60 Oxford 20 3.00 =51 n/a Lincoln 13 10 2.72 36 Coventry 10 2.59 Bristol 20 3.00 =51 n/a Bristol 8 11 2.72 22 De Montfort 16 2.58 Plymouth 0 2.90
54 n/a Heriot–Watt 7 33 2.70 20 Leeds B: Design 12 2.58 Lincoln 20 2.90 55 n/a Norwich University of the Arts 7 19 2.69 20 Norwich University of the Arts 17 2.58 Teesside 20 2.90 56 n/a Aberystwyth 4 14 2.67 11 Birmingham City 15 2.57 Reading A: Art 20 2.90 57 n/a Sussex 12 13 2.66 31 Nottingham Trent 14 2.56 Uclan 20 2.80 58 n/a Nottingham 9 23 2.62 24 UWE 14 2.56 Anglia Ruskin 0 2.70 59 n/a Nottingham Trent 21 15 2.59 54 Glasgow 10 2.56 Southampton 0 2.70
=60 n/a Hertfordshire 11 7 2.55 29 Creative Arts 14 2.54 Liverpool John Moores 0 2.70 =60 n/a Bucks New 10 14 2.55 24 Oxford Brookes 12 2.50 Derby 20 2.70 =60 n/a Salford 10 12 2.55 24 Worcester 21 2.50 Northumbria 26 2.62 =63 n/a Huddersfield 14 14 2.54 35 Brunel 4 2.47 Northampton 20 2.60 =63 n/a Chester 4 14 2.54 9 Arts University Bournemouth 12 2.46 Kingston 10 2.57
65 n/a London Met 9 9 2.53 22 Anglia Ruskin 6 2.44 Staffordshire 0 2.50 66 n/a Bath Spa 14 12 2.49 35 Aberystwyth 13 2.44 Hertfordshire 0 2.40 67 n/a Anglia Ruskin 14 4 2.42 34 Glasgow School of Art 9 2.43 UEL 0 2.40 68 n/a Cumbria 4 8 2.41 10 Bucks New 15 2.40 Worcester 0 2.40 69 n/a Oxford Brookes 8 7 2.37 19 Wolverhampton 11 2.35 Bath Spa 0 2.30 70 n/a Worcester 5 14 2.34 12 Derby 8 2.35 Sunderland 0 2.27 71 n/a Sunderland 24 5 2.31 55 Cumbria 6 2.33 Nottingham Trent 13 2.20 72 n/a Arts University Bournemouth 12 7 2.30 28 Sunderland 7 2.29 Arts University Bournemouth 0 2.20 73 n/a Derby 8 9 2.29 19 Salford 6 2.27 Sussex 0 2.20 74 n/a Uclan 14 8 2.27 31 Greenwich 12 2.27 Falmouth 0 2.10 75 n/a Robert Gordon 9 4 2.25 20 Uclan 7 2.17 Huddersfield 0 2.10 76 n/a Wolverhampton 26 7 2.18 56 Heriot–Watt 7 2.11 Oxford Brookes 0 2.00 77 n/a Northampton 10 5 2.04 21 Southampton Solent 5 2.01 Chester 0 2.00 78 n/a Greenwich 7 7 2.01 14 Northampton 2 2.00 London Met 0 1.90 79 n/a Teesside 12 7 1.95 23 Leeds Beckett 5 1.91 Wolverhampton 0 1.70 80 n/a Falmouth 24 2 1.94 47 Robert Gordon 0 1.89 Nottingham 0 1.50 81 n/a Staffordshire 10 0 1.88 19 Falmouth 3 1.78 Greenwich 0 1.50 82 n/a Southampton Solent 16 3 1.79 28 Staffordshire 0 1.75 Southampton Solent 0 1.23 83 n/a Leeds Beckett 8 3 1.62 13 Teesside 4 1.69 Leeds Beckett 0 1.00 84 n/a Writtle 4 0 0.86 3 Writtle 0 1.10 Writtle 0 0.40
n/a National profile 1,604 26 2.86 4,587 National profile 18.5 2.70 National profile 36.6 3.12 35 Music, Drama, Dance and Performing arts
1 n/a Queen Mary 16 69 3.62 58 Roehampton A: Dance 61 3.50 Southampton 100 4.00 =2 n/a Southampton 23 68 3.55 80 Soas 59 3.47 Queen Mary 100 4.00 =2 n/a Roehampton A: Dance 12 62 3.55 42 Queen Mary 52 3.40 Goldsmiths A: Music 100 4.00
4 n/a Oxford 20 55 3.43 69 Birmingham A: Music 50 3.38 Royal Northern College of Music 100 4.00 5 n/a Manchester B: Drama 13 55 3.42 43 Southampton 55 3.35 Huddersfield 90 3.90
=6 n/a Warwick 27 48 3.41 93 Open 44 3.34 Royal College of Music 90 3.90 =6 n/a Durham 15 53 3.41 51 Oxford 50 3.32 Ulster 90 3.90
8 n/a Open 11 44 3.38 36 Warwick 38 3.28 Royal Central School of Speech and Drama
87 3.87
9 n/a Soas 8 44 3.36 27 Manchester B: Drama 44 3.24 Durham 80 3.80 =10 n/a King’s College London B: Film 15 45 3.30 50 Nottingham 49 3.24 Leeds B: Performance and the
Cultural industries 80 3.80
=10 n/a Sheffield 12 48 3.30 41 King’s College London B: Film 41 3.22 Manchester B: Drama 80 3.80 12 n/a Nottingham 11 45 3.29 35 Durham 41 3.21 Leeds A: Music 70 3.70 13 n/a Cardiff 13 43 3.28 43 Sheffield 46 3.20 King’s College London B: Film 63 3.63
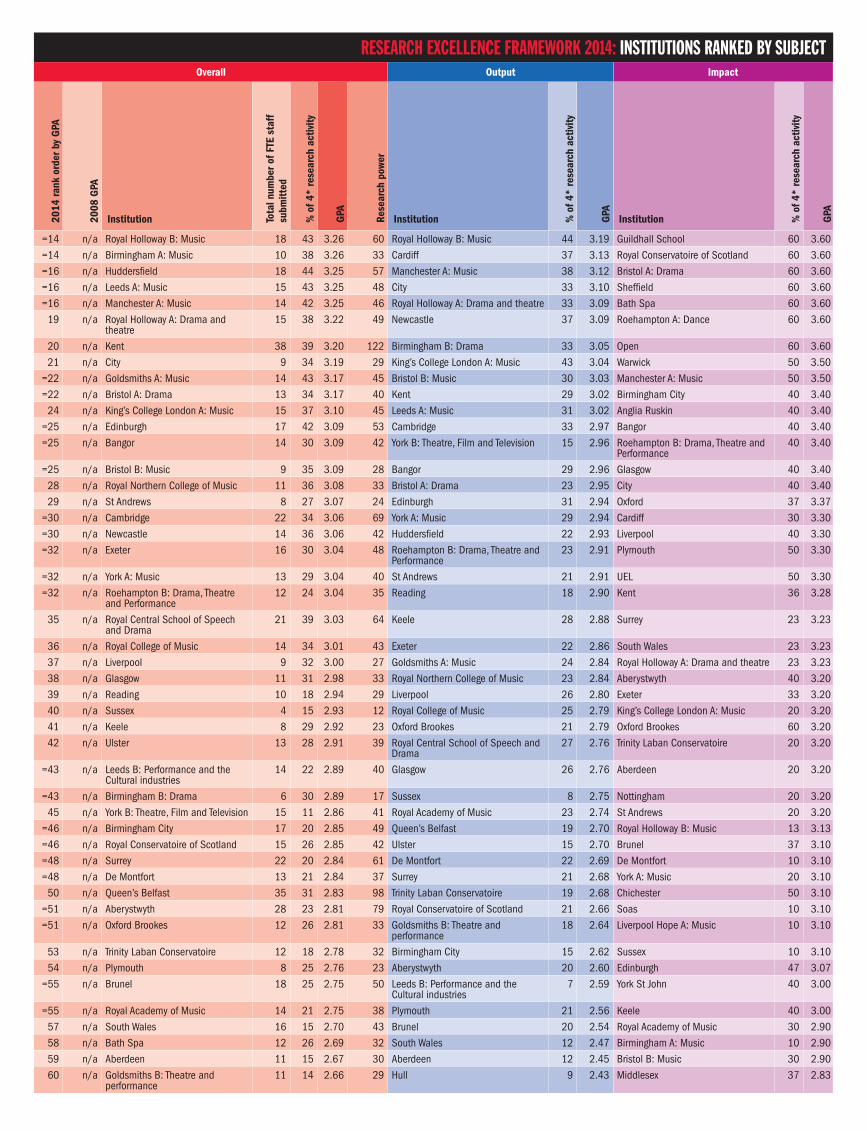
RESEARCH EXCELLENCE FRAMEWORK 2014: INSTITUTIONS RANKED BY SUBJECTOverall Output Impact
2014
rank
ord
er b
y G
PA
2008
GPA
Institution Tota
l num
ber o
f FTE
sta
ff
subm
itted
% o
f 4*
rese
arch
act
ivity
GPA
Rese
arch
pow
er
Institution % o
f 4*
rese
arch
act
ivity
GPA
Institution % o
f 4*
rese
arch
act
ivity
GPA
=14 n/a Royal Holloway B: Music 18 43 3.26 60 Royal Holloway B: Music 44 3.19 Guildhall School 60 3.60 =14 n/a Birmingham A: Music 10 38 3.26 33 Cardiff 37 3.13 Royal Conservatoire of Scotland 60 3.60 =16 n/a Huddersfield 18 44 3.25 57 Manchester A: Music 38 3.12 Bristol A: Drama 60 3.60 =16 n/a Leeds A: Music 15 43 3.25 48 City 33 3.10 Sheffield 60 3.60 =16 n/a Manchester A: Music 14 42 3.25 46 Royal Holloway A: Drama and theatre 33 3.09 Bath Spa 60 3.60
19 n/a Royal Holloway A: Drama and theatre
15 38 3.22 49 Newcastle 37 3.09 Roehampton A: Dance 60 3.60
20 n/a Kent 38 39 3.20 122 Birmingham B: Drama 33 3.05 Open 60 3.60 21 n/a City 9 34 3.19 29 King’s College London A: Music 43 3.04 Warwick 50 3.50
=22 n/a Goldsmiths A: Music 14 43 3.17 45 Bristol B: Music 30 3.03 Manchester A: Music 50 3.50 =22 n/a Bristol A: Drama 13 34 3.17 40 Kent 29 3.02 Birmingham City 40 3.40
24 n/a King’s College London A: Music 15 37 3.10 45 Leeds A: Music 31 3.02 Anglia Ruskin 40 3.40 =25 n/a Edinburgh 17 42 3.09 53 Cambridge 33 2.97 Bangor 40 3.40 =25 n/a Bangor 14 30 3.09 42 York B: Theatre, Film and Television 15 2.96 Roehampton B: Drama, Theatre and
Performance 40 3.40
=25 n/a Bristol B: Music 9 35 3.09 28 Bangor 29 2.96 Glasgow 40 3.40 28 n/a Royal Northern College of Music 11 36 3.08 33 Bristol A: Drama 23 2.95 City 40 3.40 29 n/a St Andrews 8 27 3.07 24 Edinburgh 31 2.94 Oxford 37 3.37
=30 n/a Cambridge 22 34 3.06 69 York A: Music 29 2.94 Cardiff 30 3.30 =30 n/a Newcastle 14 36 3.06 42 Huddersfield 22 2.93 Liverpool 40 3.30 =32 n/a Exeter 16 30 3.04 48 Roehampton B: Drama, Theatre and
Performance 23 2.91 Plymouth 50 3.30
=32 n/a York A: Music 13 29 3.04 40 St Andrews 21 2.91 UEL 50 3.30 =32 n/a Roehampton B: Drama, Theatre
and Performance 12 24 3.04 35 Reading 18 2.90 Kent 36 3.28
35 n/a Royal Central School of Speech and Drama
21 39 3.03 64 Keele 28 2.88 Surrey 23 3.23
36 n/a Royal College of Music 14 34 3.01 43 Exeter 22 2.86 South Wales 23 3.23 37 n/a Liverpool 9 32 3.00 27 Goldsmiths A: Music 24 2.84 Royal Holloway A: Drama and theatre 23 3.23 38 n/a Glasgow 11 31 2.98 33 Royal Northern College of Music 23 2.84 Aberystwyth 40 3.20 39 n/a Reading 10 18 2.94 29 Liverpool 26 2.80 Exeter 33 3.20 40 n/a Sussex 4 15 2.93 12 Royal College of Music 25 2.79 King’s College London A: Music 20 3.20 41 n/a Keele 8 29 2.92 23 Oxford Brookes 21 2.79 Oxford Brookes 60 3.20 42 n/a Ulster 13 28 2.91 39 Royal Central School of Speech and
Drama 27 2.76 Trinity Laban Conservatoire 20 3.20
=43 n/a Leeds B: Performance and the Cultural industries
14 22 2.89 40 Glasgow 26 2.76 Aberdeen 20 3.20
=43 n/a Birmingham B: Drama 6 30 2.89 17 Sussex 8 2.75 Nottingham 20 3.20 45 n/a York B: Theatre, Film and Television 15 11 2.86 41 Royal Academy of Music 23 2.74 St Andrews 20 3.20
=46 n/a Birmingham City 17 20 2.85 49 Queen’s Belfast 19 2.70 Royal Holloway B: Music 13 3.13 =46 n/a Royal Conservatoire of Scotland 15 26 2.85 42 Ulster 15 2.70 Brunel 37 3.10 =48 n/a Surrey 22 20 2.84 61 De Montfort 22 2.69 De Montfort 10 3.10 =48 n/a De Montfort 13 21 2.84 37 Surrey 21 2.68 York A: Music 20 3.10
50 n/a Queen’s Belfast 35 31 2.83 98 Trinity Laban Conservatoire 19 2.68 Chichester 50 3.10 =51 n/a Aberystwyth 28 23 2.81 79 Royal Conservatoire of Scotland 21 2.66 Soas 10 3.10 =51 n/a Oxford Brookes 12 26 2.81 33 Goldsmiths B: Theatre and
performance 18 2.64 Liverpool Hope A: Music 10 3.10
53 n/a Trinity Laban Conservatoire 12 18 2.78 32 Birmingham City 15 2.62 Sussex 10 3.10 54 n/a Plymouth 8 25 2.76 23 Aberystwyth 20 2.60 Edinburgh 47 3.07
=55 n/a Brunel 18 25 2.75 50 Leeds B: Performance and the Cultural industries
7 2.59 York St John 40 3.00
=55 n/a Royal Academy of Music 14 21 2.75 38 Plymouth 21 2.56 Keele 40 3.00 57 n/a South Wales 16 15 2.70 43 Brunel 20 2.54 Royal Academy of Music 30 2.90 58 n/a Bath Spa 12 26 2.69 32 South Wales 12 2.47 Birmingham A: Music 10 2.90 59 n/a Aberdeen 11 15 2.67 30 Aberdeen 12 2.45 Bristol B: Music 30 2.90 60 n/a Goldsmiths B: Theatre and
performance 11 14 2.66 29 Hull 9 2.43 Middlesex 37 2.83

RESEARCH EXCELLENCE FRAMEWORK 2014: INSTITUTIONS RANKED BY SUBJECTOverall Output Impact
2014
rank
ord
er b
y G
PA
2008
GPA
Institution Tota
l num
ber o
f FTE
sta
ff
subm
itted
% o
f 4*
rese
arch
act
ivity
GPA
Rese
arch
pow
er
Institution % o
f 4*
rese
arch
act
ivity
GPA
Institution % o
f 4*
rese
arch
act
ivity
GPA
=61 n/a Middlesex 21 20 2.50 53 Liverpool Hope A: Music 4 2.42 Cambridge 0 2.80
=61 n/a Liverpool Hope A: Music 8 4 2.50 19 Middlesex 18 2.40 Winchester 0 2.80
=63 n/a Hull 21 9 2.47 52 Bath Spa 17 2.38 Birmingham B: Drama 40 2.80
=63 n/a UEL 7 17 2.47 18 Rose Bruford 11 2.36 Canterbury Christ Church 10 2.70
65 n/a Guildhall School 16 21 2.44 39 Canterbury Christ Church 19 2.31 Goldsmiths B: Theatre and performance
10 2.70
66 n/a Chichester 12 24 2.41 28 Manchester Met 8 2.31 Reading 0 2.70
67 n/a Winchester 12 9 2.40 30 Winchester 13 2.28 Hertfordshire 20 2.70
68 n/a Canterbury Christ Church 14 15 2.39 33 Lincoln 4 2.26 Newcastle 20 2.60
69 n/a Manchester Met 11 5 2.36 25 Worcester 0 2.25 Manchester Met 0 2.60
70 n/a Anglia Ruskin 14 12 2.33 32 Chichester 21 2.23 Chester 0 2.60
=71 n/a York St John 10 13 2.29 23 UEL 11 2.22 Hull 13 2.50
=71 n/a Rose Bruford 6 7 2.29 14 Salford 11 2.18 Rose Bruford 0 2.50
73 n/a Salford 12 10 2.28 27 Guildhall School 11 2.11 Queen’s Belfast 20 2.40
74 n/a Falmouth 26 12 2.14 56 York St John 8 2.11 Falmouth 30 2.40
75 n/a Hertfordshire 5 4 2.09 11 Falmouth 10 2.10 York B: Theatre, Film and Television 0 2.40
76 n/a Worcester 4 0 2.05 9 West London 10 2.10 Salford 0 2.00
77 n/a Lincoln 11 2 2.02 23 Anglia Ruskin 6 1.98 Liverpool Hope B: Drama 0 1.90
=78 n/a West London 5 7 1.88 8 Bedfordshire 17 1.92 Edge Hill 0 1.60
=78 n/a Sunderland 2 0 1.88 4 Hertfordshire 0 1.90 Bedfordshire 0 1.60
80 n/a Chester 9 2 1.81 16 Edge Hill 0 1.79 West London 0 1.40
81 n/a Bedfordshire 7 11 1.80 12 Liverpool Hope B: Drama 0 1.78 Worcester 0 1.40
82 n/a Liverpool Hope B: Drama 9 0 1.79 16 Leeds Beckett 3 1.65 Lincoln 0 1.30
83 n/a Edge Hill 12 0 1.72 20 Chester 3 1.63 Leeds Beckett 0 1.00
84 n/a Leeds Beckett 11 2 1.41 16 Sunderland – – Sunderland – –
n/a National profile 1,142 29 2.87 3,278 National profile 25 2.75 National profile 38.8 3.14
36 Communication, Cultural and Media studies, Library and Information management
1 n/a LSE 14 65 3.59 50 LSE 47 3.38 LSE 100 4.00
2 n/a Cardiff 13 61 3.49 47 Wolverhampton 39 3.25 Cardiff 100 4.00
3 n/a Goldsmiths 21 55 3.43 72 De Montfort 49 3.24 Leicester B: Museum studies 100 4.00
4 n/a Leicester B: Museum studies 11 52 3.40 37 UEA 38 3.22 King’s College London 90 3.90
=5 n/a Westminster 18 52 3.37 60 Loughborough B: Communication and Media studies
41 3.21 Goldsmiths 87 3.87
=5 n/a Wolverhampton 7 48 3.37 24 Cardiff 40 3.21 Westminster 87 3.87
7 n/a Loughborough B: Communication and Media studies
31 50 3.35 103 Westminster 42 3.19 Leeds 63 3.63
8 n/a King’s College London 33 54 3.29 109 Leicester B: Museum studies 35 3.18 Sussex 60 3.60
9 n/a Royal Holloway 13 45 3.27 43 Goldsmiths 34 3.15 Sheffield 60 3.60
10 n/a Leeds 25 48 3.26 81 Nottingham 33 3.11 Loughborough A: Library and Information management
60 3.60
11 n/a Nottingham 16 40 3.23 52 Royal Holloway 40 3.11 Portsmouth 60 3.60
=12 n/a Glasgow 24 45 3.22 77 Leicester A: Media and Communication
34 3.09 Wolverhampton 60 3.60
=12 n/a Newcastle 14 42 3.22 46 Newcastle 33 3.08 City 53 3.53
14 n/a De Montfort 11 36 3.18 34 Leeds 35 3.02 Bournemouth 63 3.50
=15 n/a Sussex 26 41 3.17 81 Glasgow 33 3.02 Brighton 60 3.50
=15 n/a Leicester A: Media and Communication
22 37 3.17 70 Edinburgh Napier 30 3.00 Loughborough B: Communication and Media studies
50 3.40
17 n/a UEA 10 35 3.14 30 UEL 29 2.97 Leicester A: Media and Communication
53 3.40
=18 n/a Bournemouth 25 36 3.10 77 Queen Margaret 25 2.95 Ulster 40 3.40
=18 n/a UEL 15 33 3.10 46 King’s College London 33 2.93 Stirling 40 3.40
20 n/a City 25 33 3.06 75 Northumbria A: Communication, Cultural and Media studies
29 2.92 Royal Holloway 40 3.40
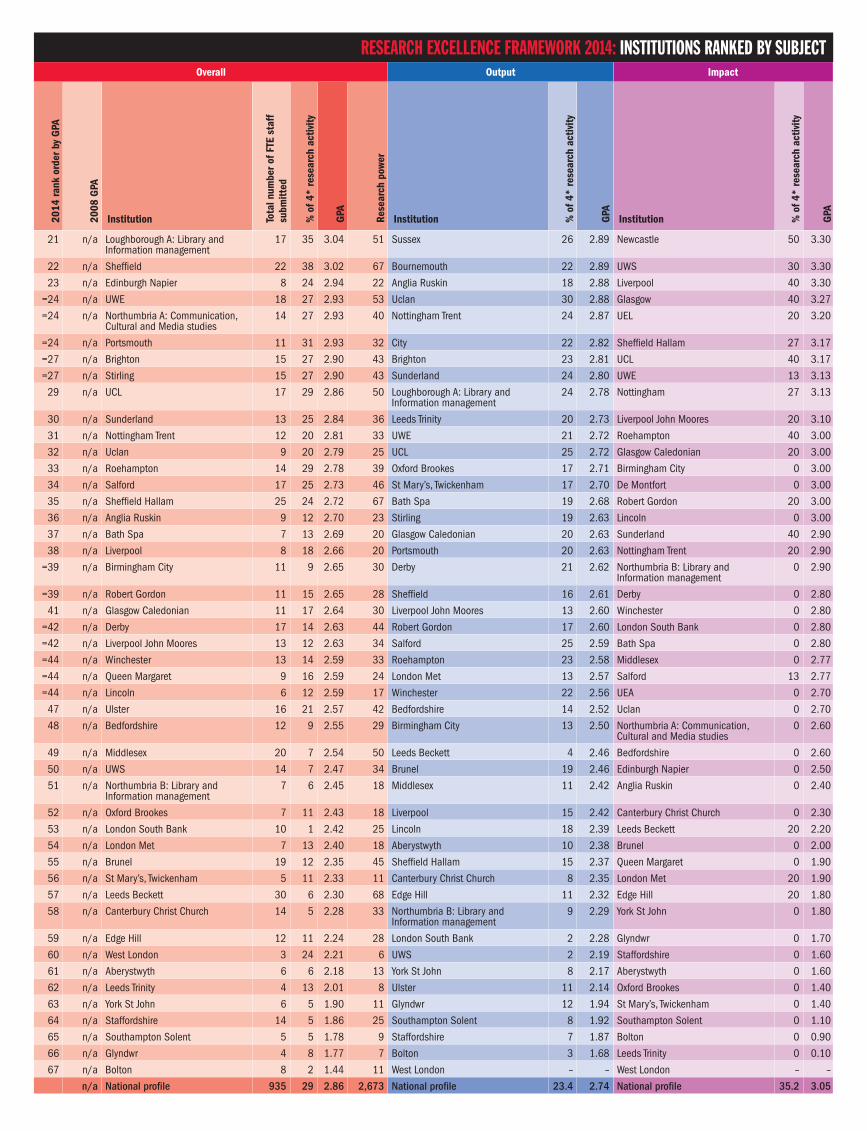
RESEARCH EXCELLENCE FRAMEWORK 2014: INSTITUTIONS RANKED BY SUBJECTOverall Output Impact
2014
rank
ord
er b
y G
PA
2008
GPA
Institution Tota
l num
ber o
f FTE
sta
ff
subm
itted
% o
f 4*
rese
arch
act
ivity
GPA
Rese
arch
pow
er
Institution % o
f 4*
rese
arch
act
ivity
GPA
Institution % o
f 4*
rese
arch
act
ivity
GPA
21 n/a Loughborough A: Library and Information management
17 35 3.04 51 Sussex 26 2.89 Newcastle 50 3.30
22 n/a Sheffield 22 38 3.02 67 Bournemouth 22 2.89 UWS 30 3.30
23 n/a Edinburgh Napier 8 24 2.94 22 Anglia Ruskin 18 2.88 Liverpool 40 3.30
=24 n/a UWE 18 27 2.93 53 Uclan 30 2.88 Glasgow 40 3.27
=24 n/a Northumbria A: Communication, Cultural and Media studies
14 27 2.93 40 Nottingham Trent 24 2.87 UEL 20 3.20
=24 n/a Portsmouth 11 31 2.93 32 City 22 2.82 Sheffield Hallam 27 3.17
=27 n/a Brighton 15 27 2.90 43 Brighton 23 2.81 UCL 40 3.17
=27 n/a Stirling 15 27 2.90 43 Sunderland 24 2.80 UWE 13 3.13
29 n/a UCL 17 29 2.86 50 Loughborough A: Library and Information management
24 2.78 Nottingham 27 3.13
30 n/a Sunderland 13 25 2.84 36 Leeds Trinity 20 2.73 Liverpool John Moores 20 3.10
31 n/a Nottingham Trent 12 20 2.81 33 UWE 21 2.72 Roehampton 40 3.00
32 n/a Uclan 9 20 2.79 25 UCL 25 2.72 Glasgow Caledonian 20 3.00
33 n/a Roehampton 14 29 2.78 39 Oxford Brookes 17 2.71 Birmingham City 0 3.00
34 n/a Salford 17 25 2.73 46 St Mary’s, Twickenham 17 2.70 De Montfort 0 3.00
35 n/a Sheffield Hallam 25 24 2.72 67 Bath Spa 19 2.68 Robert Gordon 20 3.00
36 n/a Anglia Ruskin 9 12 2.70 23 Stirling 19 2.63 Lincoln 0 3.00
37 n/a Bath Spa 7 13 2.69 20 Glasgow Caledonian 20 2.63 Sunderland 40 2.90
38 n/a Liverpool 8 18 2.66 20 Portsmouth 20 2.63 Nottingham Trent 20 2.90
=39 n/a Birmingham City 11 9 2.65 30 Derby 21 2.62 Northumbria B: Library and Information management
0 2.90
=39 n/a Robert Gordon 11 15 2.65 28 Sheffield 16 2.61 Derby 0 2.80
41 n/a Glasgow Caledonian 11 17 2.64 30 Liverpool John Moores 13 2.60 Winchester 0 2.80
=42 n/a Derby 17 14 2.63 44 Robert Gordon 17 2.60 London South Bank 0 2.80
=42 n/a Liverpool John Moores 13 12 2.63 34 Salford 25 2.59 Bath Spa 0 2.80
=44 n/a Winchester 13 14 2.59 33 Roehampton 23 2.58 Middlesex 0 2.77
=44 n/a Queen Margaret 9 16 2.59 24 London Met 13 2.57 Salford 13 2.77
=44 n/a Lincoln 6 12 2.59 17 Winchester 22 2.56 UEA 0 2.70
47 n/a Ulster 16 21 2.57 42 Bedfordshire 14 2.52 Uclan 0 2.70
48 n/a Bedfordshire 12 9 2.55 29 Birmingham City 13 2.50 Northumbria A: Communication, Cultural and Media studies
0 2.60
49 n/a Middlesex 20 7 2.54 50 Leeds Beckett 4 2.46 Bedfordshire 0 2.60
50 n/a UWS 14 7 2.47 34 Brunel 19 2.46 Edinburgh Napier 0 2.50
51 n/a Northumbria B: Library and Information management
7 6 2.45 18 Middlesex 11 2.42 Anglia Ruskin 0 2.40
52 n/a Oxford Brookes 7 11 2.43 18 Liverpool 15 2.42 Canterbury Christ Church 0 2.30
53 n/a London South Bank 10 1 2.42 25 Lincoln 18 2.39 Leeds Beckett 20 2.20
54 n/a London Met 7 13 2.40 18 Aberystwyth 10 2.38 Brunel 0 2.00
55 n/a Brunel 19 12 2.35 45 Sheffield Hallam 15 2.37 Queen Margaret 0 1.90
56 n/a St Mary’s, Twickenham 5 11 2.33 11 Canterbury Christ Church 8 2.35 London Met 20 1.90
57 n/a Leeds Beckett 30 6 2.30 68 Edge Hill 11 2.32 Edge Hill 20 1.80
58 n/a Canterbury Christ Church 14 5 2.28 33 Northumbria B: Library and Information management
9 2.29 York St John 0 1.80
59 n/a Edge Hill 12 11 2.24 28 London South Bank 2 2.28 Glyndwr 0 1.70
60 n/a West London 3 24 2.21 6 UWS 2 2.19 Staffordshire 0 1.60
61 n/a Aberystwyth 6 6 2.18 13 York St John 8 2.17 Aberystwyth 0 1.60
62 n/a Leeds Trinity 4 13 2.01 8 Ulster 11 2.14 Oxford Brookes 0 1.40
63 n/a York St John 6 5 1.90 11 Glyndwr 12 1.94 St Mary’s, Twickenham 0 1.40
64 n/a Staffordshire 14 5 1.86 25 Southampton Solent 8 1.92 Southampton Solent 0 1.10
65 n/a Southampton Solent 5 5 1.78 9 Staffordshire 7 1.87 Bolton 0 0.90
66 n/a Glyndwr 4 8 1.77 7 Bolton 3 1.68 Leeds Trinity 0 0.10
67 n/a Bolton 8 2 1.44 11 West London – – West London – –
n/a National profile 935 29 2.86 2,673 National profile 23.4 2.74 National profile 35.2 3.05


