Research & Evaluation. Defining Recidivism Felony adjudication (conviction) within 3 years of...
63
Research & Evaluation
-
Upload
benny-mayo -
Category
Documents
-
view
220 -
download
1
Transcript of Research & Evaluation. Defining Recidivism Felony adjudication (conviction) within 3 years of...

Research & Evaluation

Defining Recidivism
Felony adjudication (conviction) within 3 years of release from closed custody or commitment to probation.

Defining the Assessments ORRA: OYA Recidivism Risk Assessment. Identifies the
likelihood a youth will recidivate after release from closed custody or commitment to probation.
ORRA-V: OYA Recidivism Risk Assessment–Violent. Identifies the likelihood a youth will VIOLENTLY recidivate after release from closed custody or commitment to probation. Recognizes the propensity for violence or threatening crimes that may result in physical harm.

Why Develop a Risk Assessment
Program evaluation Placement and treatment decisions Parole Decisions Sentencing practices RNA fails to differentiate risk populations Poor predictive accuracy

The Data
15,968 total youth Date range of population January 2005 to May 2007
Four Youth Populations County Probation Committed to OYA Probation Released from OYA Close Custody Facility Released from OYA Close Custody Facility to Supervision
in the adult system

Dozens of Variables were Considered
Age at first referral
Total prior sex offense referrals
Total prior felony referrals
Total prior theft referrals
Total prior runaway referrals
Total prior property referrals

Dozens of Variables were Considered (cont.)
Total burglary referrals
Total prior misdemeanor referrals
Total prior robbery referrals
Total prior violation referrals
Total prior dependency referrals
Total prior harassment referrals

Variables contributing to the ORRA Scores and their effects
Prior felony AOD referral (Y/N) Prior weapon referral (Y/N) Age Criminal mischief referral (Y/N) No. prior misdemeanor referrals No. prior theft referrals Adjudicated delinquent (Y/N) No. prior AOD referrals Current sex offense (Y/N) No. prior runaway referrals Gender (male higher risk) Interactions – mischief referral by
No. prior misdemeanors No. prior theft referrals No runaway referrals
+25.5%
+21.2
+ 4.6
+83.2
+10.3
+ 5.2
+21.6
+11.1
- 39.5
+11.4
+20.4
Flattens out Increases Flattens out

So… What exactly does this mean?
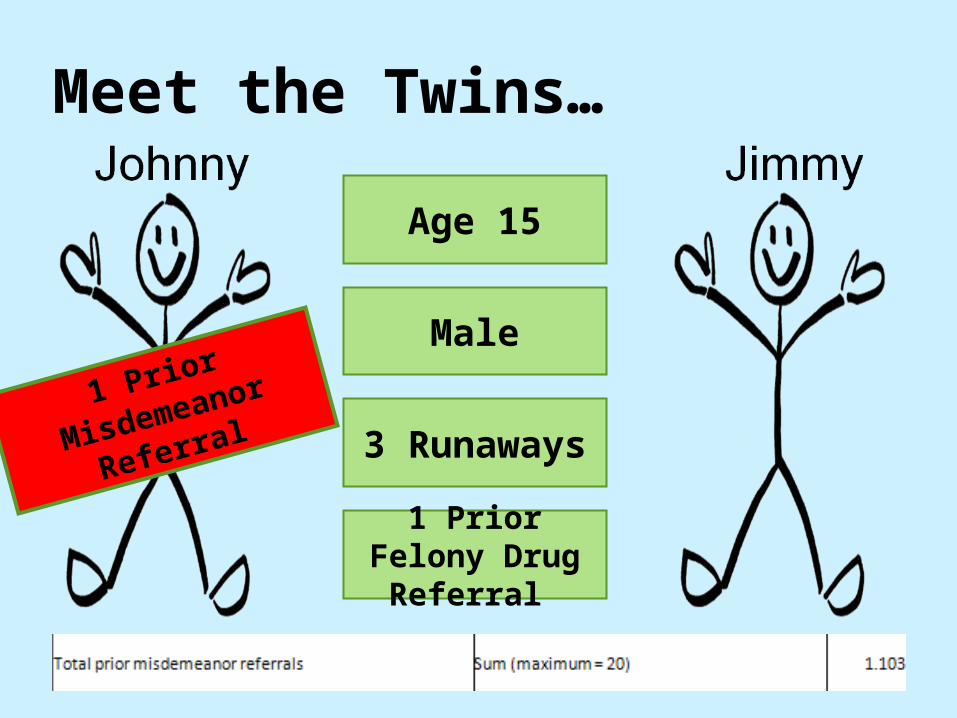
Meet the Twins…
Age 15
Male
3 Runaways
1 Prior Felony Drug Referral
1 Prior
Misdemeanor
Referral

Interpreting ScoresEach youth has a score between 0% and
100%
The score approximates the probability that the youth will recidivate○ For example, a youth with a score of 40% has
a 40% probability they will recidivate○ This also means the youth has a 60%
approximate score that the youth will NOT recidivate.

Model Accuracy
Overall Accuracy for ORRA = 73%Accurate for all subpopulations
Accuracy of 50% suggests poor predictive accuracy
Accuracy of 100% suggests perfect predictive accuracy

Comparison of the Four Populations
Percent by Group
0
1
2
3
4
5
6
7
8
9
10
ORRA Scores
0.0 0.1 0.2 0.3 0.4 0.5 0.6 0.7 0.8 0.9 1.0
Distribution of ORRA Scores by Group
COUNTY PROBATIONDOCOYA PROBATIONYCF
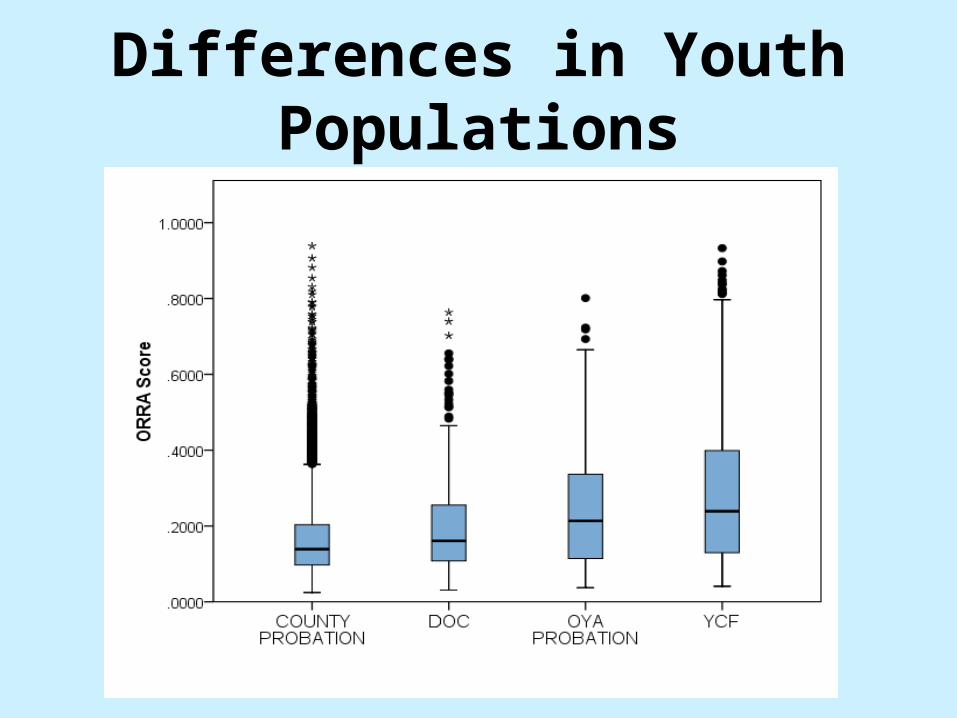
Differences in Youth Populations

Predictive Accuracy
Population GroupActual
RecidivismExpected
RecidivismEntire study population 18.5% 18.5%County probation 16.6% 16.6%OYA probation 24.2% 24.2%Juvenile released from OYA close custody 28.6% 29.1%DOC youth released from OYA close custody 23.0% 21.7%

Interpreting Scores
ORRA and ORRA-V scores can also be evaluated for a specific population
The average score for a group of youth estimates the expected recidivism rate for the group
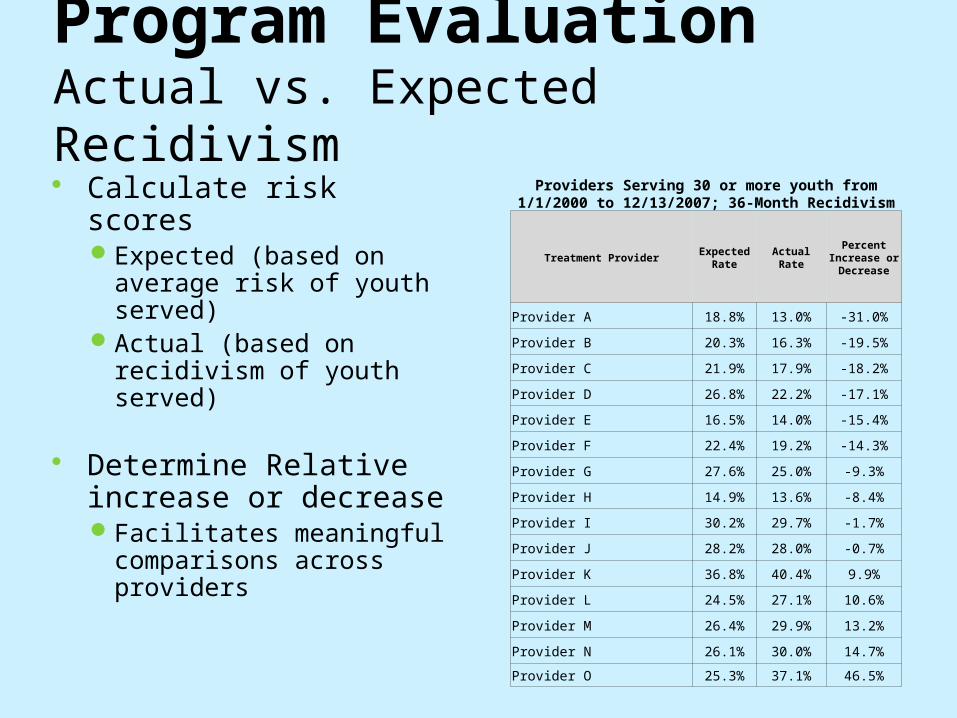
Program EvaluationActual vs. Expected Recidivism Calculate risk scores
Expected (based on average risk of youth served)
Actual (based on recidivism of youth served)
Determine Relative increase or decreaseFacilitates meaningful
comparisons across providers
Providers Serving 30 or more youth from 1/1/2000 to 12/13/2007; 36-Month Recidivism
Treatment Provider Expected Rate Actual Rate
Percent Increase or Decrease
Provider A 18.8% 13.0% -31.0%
Provider B 20.3% 16.3% -19.5%
Provider C 21.9% 17.9% -18.2%
Provider D 26.8% 22.2% -17.1%
Provider E 16.5% 14.0% -15.4%
Provider F 22.4% 19.2% -14.3%
Provider G 27.6% 25.0% -9.3%
Provider H 14.9% 13.6% -8.4%
Provider I 30.2% 29.7% -1.7%
Provider J 28.2% 28.0% -0.7%
Provider K 36.8% 40.4% 9.9%
Provider L 24.5% 27.1% 10.6%
Provider M 26.4% 29.9% 13.2%
Provider N 26.1% 30.0% 14.7%
Provider O 25.3% 37.1% 46.5%

Things Done and Things Still to Do
Done -- Test for all OYA youth groupsMales/FemalesMinoritiesCrime Type
Still to Do -- Make the ORRA dynamicIncidenceRevocationsProgramming
ORRA-V
Used the same dataset Used “violent recidivism” – a subset of
recidivism Violent recidivism includes murder,
arson…robbery, assault, and burglary

Variables contributing to the ORRA-V Scores and
their effects
Male Prior weapon referral (Y/N) No. prior misdemeanor referrals No. prior felony referrals Prior felony assault referral (Y/N) Prior felony theft referrals (Y/N) Misdemeanor theft referrals (Y/N) Prior curfew violation (Y/N) No. prior runaway referrals Interactions:
Weapons X felony theft Misdemeanor Referrals X felony
referrals
+178.1%
+ 62.0
+ 13.5
+ 31.3
+ 32.1
+ 36.1
+ 20.1
+ 22.1
+ 8.6
Flattens out
Flattens out

Differences between the ORRA and the ORRA-V
Variable ORRA ORRA-V
Male + 20 +178%
Weapon offense + 21 + 62
Misdemeanor referrals + 10 + 13
Runaway referrals + 11 + 31
Felony referrals + 9
Felony assault referrals + 32
Felony theft referrals + 36
Misdemeanor theft referrals + 20
Curfew violation + 22
Felony AOD referral + 26
Age + 5
Mischief referral + 83
Number theft referrals + 5
Prior adjudication + 22
Number AOD referrals + 11
Current sex offense - 40

OVIRA and ONIRA
OVIRA measures the likelihood a youth will engage in a violent act in the first six months of closed custody
ONIRA measures the likelihood a youth will engage in numerous non-violent incidents in the first six months of closed custody
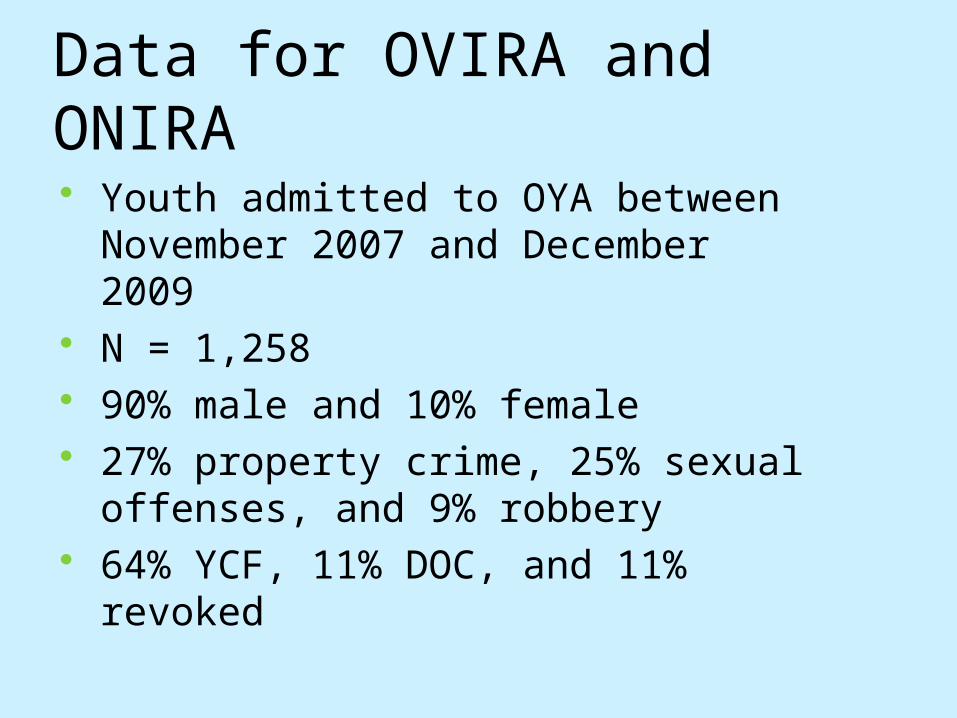
Data for OVIRA and ONIRA Youth admitted to OYA between
November 2007 and December 2009 N = 1,258 90% male and 10% female 27% property crime, 25% sexual
offenses, and 9% robbery 64% YCF, 11% DOC, and 11% revoked
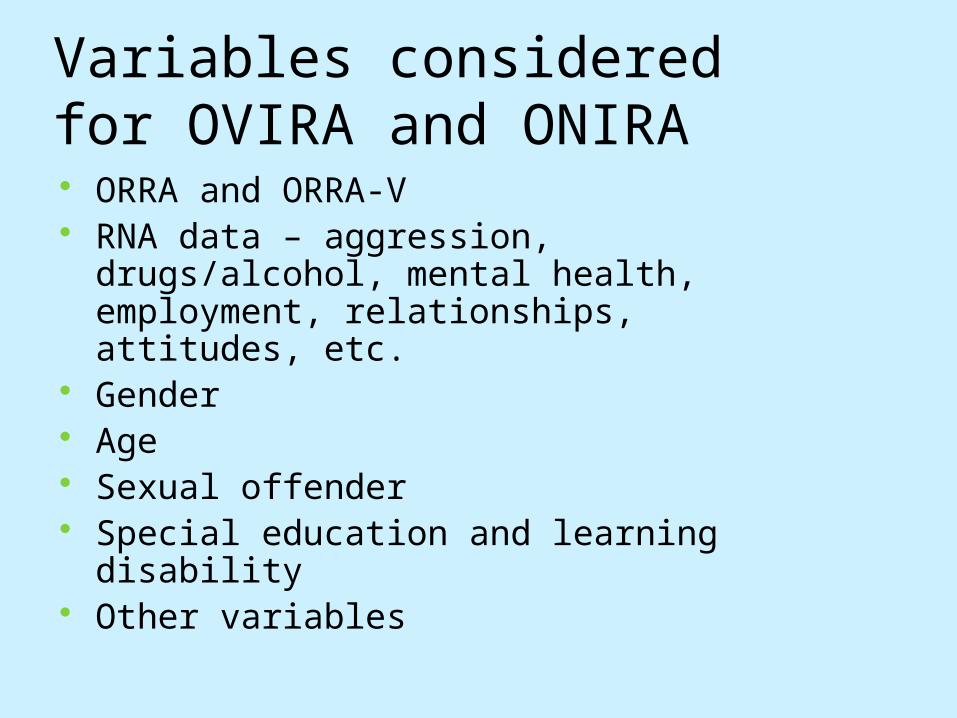
Variables considered for OVIRA and ONIRA ORRA and ORRA-V RNA data – aggression, drugs/alcohol,
mental health, employment, relationships, attitudes, etc.
Gender Age Sexual offender Special education and learning disability Other variables

OVIRA – OYA Violent Incident Risk Assessment
Violence considered an assault or peer fight resulting in isolation/segregation
Considered “immediately threatening to life, health, or facility safety, security, or good order.”

ONIRA – OYA Nuisance Incident Risk Assessment
Considered four or more non-violent incidents in the first months of closed custody

Variables contributing to OVIRA
and ONIRA scoresVariable OVIRA ONIRAAge at admission -20% - 27%
Male -43
SED +55 + 139
Sex offender -45 - 49
Mental health protective - 9
Full relationship risk +29
Belief in fighting/aggression
+49
RNA prescreen social score
- 11
Mental health risk + 28
Aggression protective - 22
Parental authority/control
+ 50
ORRA +1224 (HR=13.2)
ORRA-V - 95 (HR=.05)

Typologies

C E
B D
A
F
Typologies

Type A Description
Highest need population AOD use is high both current and historical Poor relationships and likely lack relationship skills Highest on aggression and attitude issues History of Mental Health = ADD/ADHD or mental health
diagnosis – recommend analysis of RNA items 15.5 and 15.6 to differentiate ADD/ADHD versus Formal MH Diagnosis
Education issues are prominent – recommend analysis of RNA item 3.1 for potential responsivity issues 3.1 = Special Education or Formal Diagnosis of Special
Education Need (LD, SED, MRDD Indicators)

Treatment Recommendation
Estimated to require longest dosage of treatment (e.g., 12-18 months)
Group may require more stabilization than other groups due to co-occurring mental health and learning concerns
AOD Treatment (longer in duration due to persistency) MH treatment with QMHP Educational intervention Social Skills/Relationship Skills development (intensive) Engagement in prosocial activities that can foster
protective factors Potential family therapy component Aggression Replacement Training (intensive) Cognitive Behavioral program to address thinking

Type E Description
66% of this cluster is SO
Highest on protective factors
Low need for MH = ADD/ADHD or mental health diagnosis – recommend analysis of RNA items 15.5 and 15.6 to differentiate ADD/ADHD versus Formal MH Diagnosis
Education issues are low – recommend analysis of RNA item 3.1 for potential responsivity issues 3.1 = Special Education or Formal Diagnosis of Special
Education Need (LD, SED, MRDD Indicators)

Treatment Recommendations
(Type E)Sex Offender Treatment when appropriate
(Abbreviated Kaufman or general cognitive behavioral treatment)
Capitalize on whatever activities youth engaged in prior to coming as leverage for treatment engagement
Seek opportunities for continued engagement

Optimal Length of Stay Calculated length of stay
in months
Plotted LOS against recidivism for the overall sample
On average, providers reduce recidivism by approximately 3% per month of supervision
But, there may be a window of time where providers are most effective

Program Evaluation Continuum
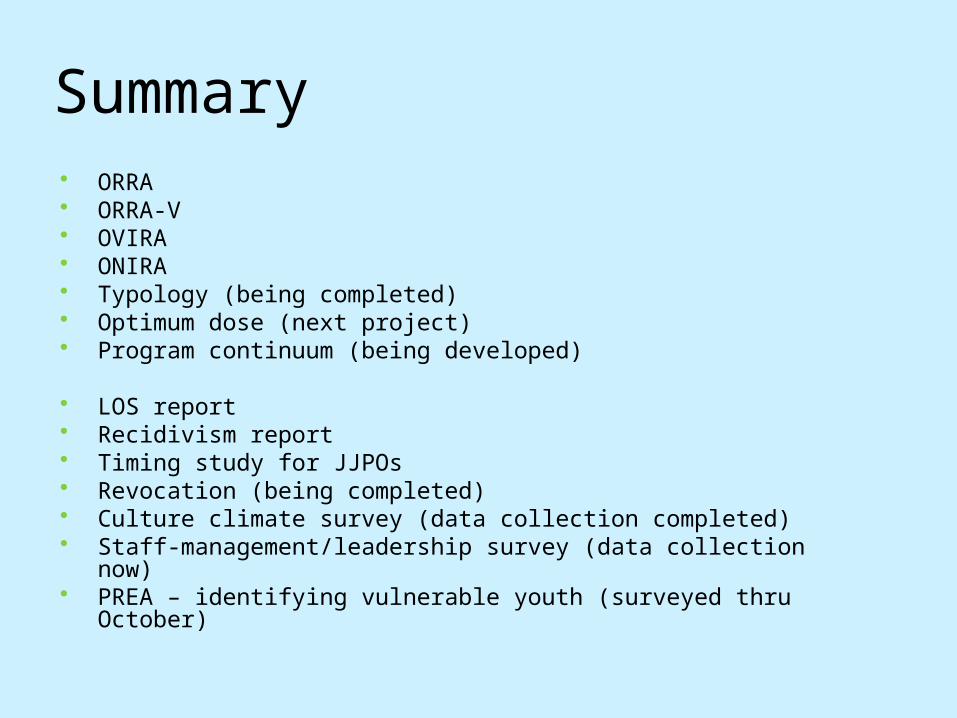
Summary ORRA ORRA-V OVIRA ONIRA Typology (being completed) Optimum dose (next project) Program continuum (being developed)
LOS report Recidivism report Timing study for JJPOs Revocation (being completed) Culture climate survey (data collection completed) Staff-management/leadership survey (data collection now) PREA – identifying vulnerable youth (surveyed thru October)


ORRA Risk Level n Actual Expected % Difference n Actual Expected % Difference n Actual Expected % DifferenceLow 419 11.7% 9.6% 21.9% 124 10.5% 9.3% 12.9% 22 22.7% 10.4% 118.3%Moderate 428 21.3% 18.4% 15.8% 106 19.8% 17.5% 13.1% 30 16.7% 18.0% -7.2%Moderate-High 484 39.9% 31.5% 26.7% 56 26.8% 30.4% -11.8% 24 45.8% 29.8% 53.7%High 477 51.6% 56.5% -8.7% 55 43.6% 53.7% -18.8% 33 39.4% 58.0% -32.1%Total 1808 32.0% 29.9% 7.0% 341 21.4% 22.5% -4.9% 109 31.2% 31.2% 0.0%
Comparing Actual vs Expected* 36-Month Recidivism Rates by ORRA Risk Level and Status** All Youth Released from OYA or DOC from 10/1/2003 - 6/30/2007 (N = 2258)
**Status includes youth committed to YCF, youth committed to DOC that were under the custody of OYA, youth committed to DOC that were under the custody of OYA but returned to DOC prior to release.
*Expected rates are mean ORRA scores
ReturnedDOCYCF
Close Custody PopulationsMaking comparisons while controlling for risk

Why Problems with the RNA
Not valid for OYA femalesApproximately 85% of the youth in Close
Custody were High Risk – little practical information
The Area Under the Curve (AUC) was .56 DOC had the solution
Methodology for developing risk tool based on local data
The AUC for their risk tool was .78

How Methodology
Subjects○ N = 28,431 dispositions (19,309 unique youth)○ Qualifying events occurred between 1/1/2005
and 5/14/2010○ Youth qualified if they were:
Placed on county probationCommitted to OYA probationReleased from an OYA close custody facilityRelease from OYA close custody to supervision in
the adult system

What’s Next
ONIRA: OYA Nuisance Incident Risk Assessment
OVIRA: OYA Violent Incident Risk Assessment

How Methodology continued
Omitted disposition records of youth:○ Supervised under interstate compact○ Returned to DOC to complete their sentences
in adult institutions○ Committed to OYA or county probation who
were subsequently committed to an OYA YCF without recidivating
Randomly selected one disposition per youth
Final dataset: N = 15,986

How
Methodology continuedDependent (Outcome) Variable
○ Recidivism event: OYA official recidivism measureFelony Adjudication or ConvictionDisposition of formal supervision
○ Groups○ Tracking Dates○ Tracking Periods: 12-, 24-, 36-, 48-Month

How
Methodology continuedIndependent Variables
○ Over 50 starting variables○ Bootstrap Re-sampling
Run 1000 randomly sampled logistic regressions for each tracking period
Lists the proportion of time each variable is significantly related to the outcome variable
Selected the top 30% of the variables to develop the model
○ Run stepwise Logistic Regression for each tracking period

How
Methodology continuedDeveloping the Model
○ Run stepwise Logistic Regression for each tracking period
○ Determine the concordance rate for each model
○ Test for interactions○ Run stepwise Logistic Regression for each
tracking period including significant interaction variables

How
Methodology continuedSelecting and refining the final model
○ 36-Month tracking period had the highest concordance rate (.73) and included 12 predictor variables 3 interaction terms

How
ResultsModel Accuracy:
○ AUC = .72○ Estimates Actual Recidivism
Population GroupActual
RecidivismExpected
RecidivismEntire study population 18.5% 18.5%County probation 16.6% 16.6%OYA probation 24.2% 24.2%Juvenile released from OYA close custody 28.6% 29.1%DOC youth released from OYA close custody 23.0% 21.7%

How
The Model
PREDICTOR VARIABLES VALUESODDS RATIO
Prior felony drug or alcohol referral No = 0, Yes = 1 1.255
Prior weapon offense referral No = 0, Yes = 1 1.212
Age at start tracking Age at probation start or release to community from close custody
1.046
Prior criminal mischief referral No = 0, Yes = 1 1.832
Total prior misdemeanor referrals Sum (maximum = 20) 1.103
Total prior theft referrals Sum (no maximum) 1.052
Prior delinquency adjudication No = 0, Yes = 1 1.216
Total prior drug or alcohol referrals Sum (no maximum) 1.111
Current sex offense disposition No = 0, Yes = 1 0.605
Total prior runaway referrals Sum (maximum = 20) 1.114
Total prior felony referrals Sum (maximum = 6) 1.204
Male Female = 0, Male = 1 2.628
Interaction: prior criminal mischief referral & total prior misdemeanor referrals
Product of the two variable terms specified 0.897
Interaction: prior criminal mischief referral & total prior theft referrals
Product of the two variable terms specified 1.108
Interaction: prior criminal mischief referral & total prior runaway referrals
Product of the two variable terms specified 0.935

What for Interpreting ORRA Scores
Each youth get a score between 0 and 1The score represents the probability that the
youth will recidivate○ For example, a youth with a score of .42 has a
42% probability they will recidivateThe average score for a group of youth
estimates the expected recidivism rate for the group○ For example, the average ORRA score for
females on OYA probation was 13.1 and the actual recidivism rate was 13.0.

What for
ORRA has multiple usesPlacement and treatment decisionsParole decisionsProgram evaluationsSentencing practicesFoundation for future improvement in risk
assessment
No Yes
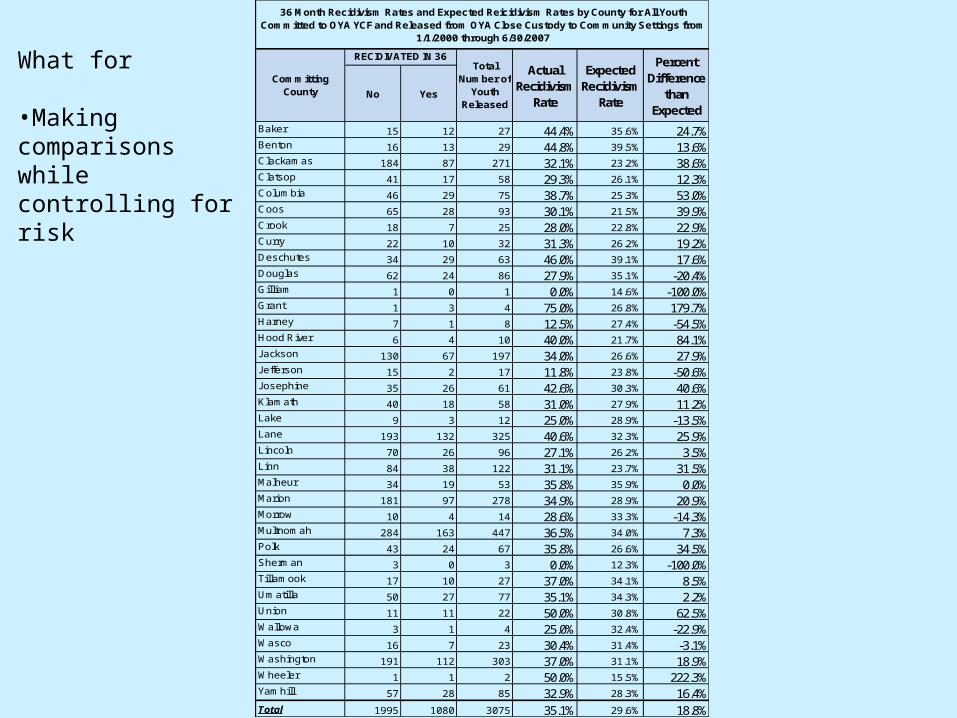
Baker 15 12 27 44.4% 35.6% 24.7%Benton 16 13 29 44.8% 39.5% 13.6%Clackamas 184 87 271 32.1% 23.2% 38.6%Clatsop 41 17 58 29.3% 26.1% 12.3%Columbia 46 29 75 38.7% 25.3% 53.0%Coos 65 28 93 30.1% 21.5% 39.9%Crook 18 7 25 28.0% 22.8% 22.9%Curry 22 10 32 31.3% 26.2% 19.2%Deschutes 34 29 63 46.0% 39.1% 17.6%Douglas 62 24 86 27.9% 35.1% -20.4%Gilliam 1 0 1 0.0% 14.6% -100.0%Grant 1 3 4 75.0% 26.8% 179.7%Harney 7 1 8 12.5% 27.4% -54.5%Hood River 6 4 10 40.0% 21.7% 84.1%Jackson 130 67 197 34.0% 26.6% 27.9%Jefferson 15 2 17 11.8% 23.8% -50.6%Josephine 35 26 61 42.6% 30.3% 40.6%Klamath 40 18 58 31.0% 27.9% 11.2%Lake 9 3 12 25.0% 28.9% -13.5%Lane 193 132 325 40.6% 32.3% 25.9%Lincoln 70 26 96 27.1% 26.2% 3.5%Linn 84 38 122 31.1% 23.7% 31.5%Malheur 34 19 53 35.8% 35.9% 0.0%Marion 181 97 278 34.9% 28.9% 20.9%Morrow 10 4 14 28.6% 33.3% -14.3%Multnomah 284 163 447 36.5% 34.0% 7.3%Polk 43 24 67 35.8% 26.6% 34.5%Sherman 3 0 3 0.0% 12.3% -100.0%Tillamook 17 10 27 37.0% 34.1% 8.5%Umatilla 50 27 77 35.1% 34.3% 2.2%Union 11 11 22 50.0% 30.8% 62.5%Wallowa 3 1 4 25.0% 32.4% -22.9%Wasco 16 7 23 30.4% 31.4% -3.1%Washington 191 112 303 37.0% 31.1% 18.9%Wheeler 1 1 2 50.0% 15.5% 222.3%Yamhill 57 28 85 32.9% 28.3% 16.4%Total 1995 1080 3075 35.1% 29.6% 18.8%
36 Month Recidivism Rates and Expected Reicidivism Rates by County for All Youth Committed to OYA YCF and Released from OYA Close Custody to Community Settings from
1/1/2000 through 6/30/2007
Committing County
RECIDIVATED IN 36 MONTHS Total
Number of Youth
Released
Actual Recidivism
Rate
Expected Recidivism
Rate
Percent Difference
than Expected
What for
•Making comparisons while controlling for risk

No Yes
Baker 17 4 21 19.0% 25.4% -25.0%Benton 29 9 38 23.7% 25.2% -6.0%Clackamas 388 103 491 21.0% 18.3% 14.8%Clatsop 50 14 64 21.9% 22.1% -0.9%Columbia 42 9 51 17.6% 21.5% -17.9%Coos 120 44 164 26.8% 17.6% 52.2%Crook 25 7 32 21.9% 22.3% -2.0%Curry 25 10 35 28.6% 22.4% 27.8%Deschutes 58 36 94 38.3% 31.9% 19.9%Douglas 54 14 68 20.6% 29.7% -30.6%Gilliam 3 0 3 0.0% 14.8% -100.0%Grant 5 3 8 37.5% 24.1% 55.3%Harney 1 2 3 66.7% 32.7% 103.8%Hood River 14 9 23 39.1% 17.8% 119.9%Jackson 192 66 258 25.6% 25.1% 1.9%Jefferson 23 13 36 36.1% 24.9% 44.9%Josephine 70 25 95 26.3% 25.7% 2.3%Klamath 82 31 113 27.4% 22.3% 23.2%Lake 9 7 16 43.8% 24.5% 78.9%Lane 278 97 375 25.9% 22.1% 16.9%Lincoln 91 26 117 22.2% 19.6% 13.2%Linn 131 31 162 19.1% 21.3% -10.1%Malheur 49 30 79 38.0% 32.6% 16.7%Marion 225 108 333 32.4% 25.9% 25.0%Morrow 13 5 18 27.8% 26.6% 4.5%Multnomah 186 147 333 44.1% 30.5% 44.5%Polk 49 19 68 27.9% 26.9% 3.9%Sherman 2 0 2 0.0% 9.9% -100.0%Tillamook 30 9 39 23.1% 24.9% -7.1%Umatilla 59 21 80 26.3% 35.5% -26.1%Union 12 10 22 45.5% 22.8% 99.1%Wallowa 8 4 12 33.3% 24.9% 33.9%Wasco 28 7 35 20.0% 21.8% -8.3%Washington 211 67 278 24.1% 24.4% -1.4%Wheeler 2 0 2 0.0% 21.7% -100.0%Yamhill 84 31 115 27.0% 23.7% 13.6%Total 2665 1018 3683 27.6% 24.0% 15.0%
Percent Difference
than Expected
36 Month Recidivism Rates and Expected Reicidivism Rates by County for All Youth Committed to OYA Probation from 1/1/2000 through 6/30/2007
Committing County
RECIDIVATED IN 36 MONTHS
Total Number of
Youth Released
Actual Recidivism
Rate
Expected Recidivism
Rate
What for
•Making comparisons while controlling for risk

ORRA Risk Level n Actual Expected % Difference n Actual Expected % Difference n Actual Expected % DifferenceLow 419 11.7% 9.6% 21.9% 124 10.5% 9.3% 12.9% 22 22.7% 10.4% 118.3%Moderate 428 21.3% 18.4% 15.8% 106 19.8% 17.5% 13.1% 30 16.7% 18.0% -7.2%Moderate-High 484 39.9% 31.5% 26.7% 56 26.8% 30.4% -11.8% 24 45.8% 29.8% 53.7%High 477 51.6% 56.5% -8.7% 55 43.6% 53.7% -18.8% 33 39.4% 58.0% -32.1%Total 1808 32.0% 29.9% 7.0% 341 21.4% 22.5% -4.9% 109 31.2% 31.2% 0.0%
Comparing Actual vs Expected* 36-Month Recidivism Rates by ORRA Risk Level and Status** All Youth Released from OYA or DOC from 10/1/2003 - 6/30/2007 (N = 2258)
**Status includes youth committed to YCF, youth committed to DOC that were under the custody of OYA, youth committed to DOC that were under the custody of OYA but returned to DOC prior to release.
*Expected rates are mean ORRA scores
ReturnedDOCYCF
What for
•Making comparisons while controlling for risk

Other risk equations
ORRA+ ORRA-V Risk of being involved in a violent
incident in the first year in OYA close custody

Implementing ORRA Scores…An Example
Used ORRA Scores in Evaluating the Effectiveness of Residential ProgramsIs the actual recidivism rate different than
the predicted recidivism rate?Is there an optimal length of stay?With which youth is a program most
effective? All youth in residential programs from
2000 to 2007Used official OYA definition for recidivism

Actual vs. Expected Recidivism Calculated risk scores
Expected (based on average risk of youth served)
Actual (based on recidivism of youth served)
Determined Relative increase or decreaseFacilitates meaningful
comparisons across providers
Providers Serving 30 or more youth from 1/1/2000 to 11/1/2007; 36-Month Recidivism
Treatment ProviderYouth Served
Expected Rate
Actual Rate
Percent Increase or Decrease
A 80 14.7 13.8 -6.1%
B 125 14.0 13.6 -2.9%
C 345 27.4 30.4 10.9%
D 287 25.8 29.3 13.6%
E 211 32.0 37.4 16.9%
F 306 37.0 44.1 19.2%
G 490 31.1 37.1 19.3%
H 141 15.4 18.4 19.5%
I 641 21.9 26.2 19.6%
J 141 32.9 39.7 20.7%
K 211 19.6 23.7 20.9%
L 184 21.9 26.6 21.5%
M 121 25.0 33.9 35.6%
N 117 28.6 39.3 37.4%
O 480 25.2 35.2 39.7%

Next step? Right Youth…Right Program In depth analysis about who programs
are most effective withPotential variables include sex, age, offense
type
In addition to understanding which youth are most effectively served by a specific program, this analysis may identify gaps and determine which youth are not served well by current provider resources

Questions
Contact Research:
Lance Schnacker (503) 378-6551
Paul Bellatty

Current OYA Population

Why Problems with the RNA
Not valid for OYA femalesApproximately 85% of the youth in Close
Custody were High Risk – little practical information
The Area Under the Curve (AUC) was .56 DOC had the solution
Methodology for developing risk tool based on local data
The AUC for their risk tool was .78

How Methodology
Subjects○ N = 28,431 dispositions (19,309 unique youth)○ Qualifying events occurred between 1/1/2005
and 5/14/2010○ Youth qualified if they were:
Placed on county probationCommitted to OYA probationReleased from an OYA close custody facilityRelease from OYA close custody to supervision in
the adult system

How Methodology continued
Omitted disposition records of youth:○ Supervised under interstate compact○ Returned to DOC to complete their sentences
in adult institutions○ Committed to OYA or county probation who
were subsequently committed to an OYA YCF without recidivating
Randomly selected one disposition per youth
Final dataset: N = 15,986

How
Methodology continuedDependent (Outcome) Variable
○ Recidivism event: OYA official recidivism measureFelony Adjudication or ConvictionDisposition of formal supervision
○ Groups○ Tracking Dates○ Tracking Periods: 12-, 24-, 36-, 48-Month