Research, Development and Education Priorities...Maine aquaculture growers, service providers,...
52
Maine Aquaculture Innovation Center January 2020 Research, Development and Education Priorities for the Aquaculture Sector in Maine
Transcript of Research, Development and Education Priorities...Maine aquaculture growers, service providers,...

Maine Aquaculture Innovation CenterJanuary 2020
Research, Developmentand Education Priorities
for the Aquaculture Sector in Maine

Report prepared by:
Anne Langston Noll and Christopher DavisMaine Aquaculture Innovation Center
Study conducted in collaboration with:
Sebastian BelleMaine Aquaculture AssociationMeggan DwyerUniversity of Maine Aquaculture Research InstituteDana MorseMaine Sea Grant
With thanks to:
Alex CirataUniversity of Maine Aquaculture Research Institute InternThe Maine aquaculture sector for its support and time
January 2020
Correspondence and enquiries should be addressed to:
Dr. Christopher DavisExecutive Director, Maine Aquaculture Innovation Center193 Clarks Cove RoadWalpole, ME [email protected]
esea
rch,
Dev
elop
men
t an
d Ed
ucat
ion
Prio
riti
esfo
r the
Aqua
cultu
re S
ecto
r in
Mai
neTABLE OF CONTENTS
Executive Summary . . . . . . . . . . . . . . . . . . . 1Introduction . . . . . . . . . . . . . . . . . . . . . . . . . 2Methodology . . . . . . . . . . . . . . . . . . . . . . . . 4Results and Discussion . . . . . . . . . . . . . . . . . 7Conclusions and Recommendations . . . . . .47References . . . . . . . . . . . . . . . . . . . . . . . . . 48
Damariscotta oysters Photo by Chris Davis

Aquaculture Sector in Maine 1
T he research priorities survey has been an ongoing initiative coordinated by the Maine Aquaculture InnovationCenter in collaboration with Maine Aquaculture Association, Maine Sea Grant, and the University of Maine’sAquaculture Research Institute since 2012. This report is based on the research priorities survey conducted in
June 2019 of Maine’s aquaculture community, and is compared with surveys from 2012 and 2016 to look at trends.There have been some changes in the prioritization of needs since 2016, but many of the same research,
development, and education (R&D&E) needs persist and remain unaddressed. As expected, there are differentR&D&E priorities for different aquaculture sectors. The survey found the following needs across the aquaculturecluster and within specific sectors:
Recommended R&D foci to maximize impact across multiple aquaculture sectors include:● Research on methodologies for invasive species management● Research on biofouling control methods● Research on pest and predator management strategies● Climate change predictive models with a focus on aquaculture production● Improving understanding of the beneficial impacts of aquaculture on water quality/ecosystem● Streamlining distribution
Recommended Sector Development foci to maximize impact across multiple aquaculture sectors include:● Accessibility to water quality data● Development of public information materials for use and dissemination by the aquaculture community● Marketing campaign for Maine farmed seafood● Market development● Development of Best Management Practices for shellfish and sea vegetable sectors
Recommended Education foci to maximize impact across multiple aquaculture sectors include:● Training for growers on community relations and communication strategies● Public education strategy● Career education programs for schools● High school internship programs
Recommended R&D foci to maximize impact across the shellfish aquaculture sectors include:● Seed collection strategies (sea scallop and mussel growers)● Nursery/hatchery technology(sea scallop and mussel growers)● Shellfish disease research (oyster growers)● Farm/business management strategies to reduce revenue losses caused by biotoxin closures (sea scallop growers)
Recommended R&D foci to maximize impact across the sea vegetable aquaculture sector include:● The development of new value-added products (food and non-food),● Processing infrastructure● Regulation
Recommended R&D&E foci to maximize impact across the finfish aquaculture sector include:● Sea lice management● Workforce development● Access to capital
The Maine Aquaculture Innovation Center in collaboration with the University of Maine’s Aquaculture ResearchInstitute, Maine Sea Grant, and the Maine Aquaculture Association will continue to conduct these surveys on a biennialbasis. The findings from this 2019 report will be reported at the 2020 Maine Aquaculture Research, Development andEducation Summit (January 17th, 2020)
EXECUTIVE SUMMARY

2 Research, Development and Education Priorities
Research, Developmentand Education Priorities
for the Aquaculture Sector in Maine
January 2020
M aine’s coastal communities, a nexus of complex,dynamic, social-environmental systems, facemany serious challenges to their long-standing
economic and cultural traditions. They range from theimpacts of accelerated coastal tourism and recreation (~37million visitors/year)1, the integration of fisheries andaquaculture, and the conservation of marine ecosystems.These challenges are further complicated by theuncertainty caused by environmental change.
As a large rural state (~30,000mi2, population~1.3million)2 ranked 31st in the nation for per capitaincome in 20183 Maine’s economic prosperity isdependent on its geography, physical and naturalresources, and human capital. In this context, Maine’scoastline, working waterfronts, and marine resourcesrepresent a crucial asset, supporting a wide spectrum ofinterdependent sectors. Within this spectrum, theaquaculture sector has demonstrated its potential fortransformative, knowledge-based economic, social andenvironmental opportunities, while also conserving andbuilding upon the vital cultural and economic traditions ofrural, coastal communities.
According to the Maine Aquaculture Economic ImpactReport4:
• Maine’s aquaculture sector has a direct economicimpact of $73.4 million in output, 571 inemployment, and $35.7 million in labor income in2014
• Including multiplier effects, Maine’s aquaculturesector generates a statewide annual economiccontribution of $137.6 million in output (i.e., salesrevenue), 1,078 full- and part-time jobs, and $56.1million in labor income based on 2014 data
• Between 2007 and 2014, the total economic impactof aquaculture almost tripled from $50 million to$137 million dollars
• The majority of jobs related to aquacultureproduction are full-time, year-round positions. Lessthan 30% of employment is seasonal
• The top three species — in terms of 2014 sales— areAtlantic salmon, blue mussels and Eastern oysters.
• Thirty-nine percent of the respondents reported $0revenue, likely indicating a large number of newbusinesses
INTRODUCTION

Aquaculture Sector in Maine 3
In 2015, the landed value of oysters, mussels, and scallopsin the U.S. was roughly $700 million5. Maine accountedfor approximately 4% of that total, delivering $24 millionto harvesters. Of the landed shellfish total, Maineaquaculture accounted for 25%, producing a landed valueof approximately $6.5 million. Maine’s existing shellfishaquaculture industry may generate a total economic benefitof over $15 million5.The vast majority of Maine’s aquaculture businesses havecommon characteristics such as:
• Small size • Small workforce • Reduced capacity for staff development and training• Reduced capacity for research and development
These characteristics can hinder growth both as a businessand a sector.
The aquaculture sector is fortunate to have a well-established research and innovation ecosystem to supportMaine’s community of small aquaculture-related businessesand maximize growth, organizations.
These organizations include:• Maine Aquaculture Innovation Center• Maine Sea Grant
• Maine Aquaculture Association• University of Maine, Aquaculture Research Institute• Downeast Institute• Coastal Enterprises Inc• Island Institute• Maine Technology Institute• Gulf of Maine Research Institute• University of New England• Gulf of Maine Research Institute• University of Maine Darling Marine Center• University of Maine Center for Cooperative
Aquaculture Research
An understanding of the research, development, andeducation needs of Maine’s aquaculture sector is essentialfor these organizations to collaborate, and to directresources to maximize benefits to the sector.
The research priorities survey has been an ongoing initiativecoordinated by the Maine Aquaculture Innovation Centerin collaboration with Maine Aquaculture Association,Maine Sea Grant, and the University of Maine’sAquaculture Research Institute since 2012. This report isbased on the research priorities survey of Maine’saquaculture community conducted in June 2019.
Sea scallop Photo by Chris Davis

4 Research, Development and Education Priorities
T he main purpose of this study was to elicit and prioritize theresearch, development, and education needs of the aquaculturesector in Maine.
There is no single database in Maine of people involved in the aquaculture sector. To ensure comprehensive inclusion ofMaine aquaculture growers, service providers, researchers, students, educators, and other personnel, a survey mailing listwas compiled from the following sources, and duplicates were removed.
• A list of Maine registrants to the Northeast Aquaculture Conference & Exposition held in 2019 • The Maine Aquaculture Association membership list• The University of Maine’s Aquaculture Research Institute mailing list• A list of limited purpose aquaculture license holders• A list of aquaculture lease-holders
A survey was created in Survey Monkey using the 2016 “Maine Aquaculture Research Priorities” survey as a basis.
The survey was emailed to 851 separate email addresses. Of these: • 545 were opened (64.0%)• 271 were unopened (31.8%)• 30 bounced (3.5%)
A reminder email was sent to people who had not responded after 14 days.. A Thank You email was sent to everyone whocompleted the survey.
In total there were 208 responses:• 160 complete (76.9%)• 48 partial (23.1%)
As some of the questions were conditional, respondents did not see every question.
A range of question styles were used:• Multiple choice• Likert scale• Open-ended.
To prioritize research topics, respondents were asked to rate the importance of a list of research areas on a 5 point Likert-scale (urgently important to not important). Respondents could also select a “Not Relevant to Me” option. The responseswere weighted, and a weighted average was generated. In this report, weighted averages were interpreted as follows:
• < 2 = urgently important• 2.01 - 3.99 = moderately important• 4.00 - 5 = not important
METHODOLOGY

Aquaculture Sector in Maine 5
The weighted average was calculated by Survey Monkey as follows, where:
w = weight of answer choice (1 = urgently important, 5 = not important)
x = response count for answer choice
x1w1 + x2w2 + x3w3 ... xnwn
Total“Not Relevant to Me” responses were not factored into the weighted average.
A qualitative, thematic analysis was used to examine themes or patterns of meaningwithin the responses to open questions.
NOTE OF CAUTION:
The results of this survey represent the individuals responding, and while the results provide some
insight into the demographics and structure of Maine’s aquaculture sector, there may be elements
that are not represented by survey respondents.
When results have been filtered for growers, there may have been more than one response per
aquaculture business entity.Kelp harvest Photo by Chris Davis
Scallop juveniles Photo by Hugh Cowperthwaite

6 Research, Development and Education Priorities

Aquaculture Sector in Maine 7
FIGURE 1: Affiliations of survey respondents in 2019 (n=208)
RESULTS and DISCUSSION
A total of 208 people responded to the survey, with an average completion rate of 76%.The typical time spent on the survey was just over 12 minutes, with newer growers taking slightly longer to reply (almost16 minutes) and completing more of the survey (85%).
Question 1. What best describes your affiliation to the Maine aquaculture industry?
2019 Survey: Answered: 208; Skipped: 2
At over a quarter of respondents, shellfish growers were the largest population represented. Researchers and students werethe second largest group of respondents (Figure 1).
This is similar to the results of the previous R&D Priorities survey conducted in 2016 (n=170) where 26.8% of therespondents were shellfish growers, and the second largest group of respondents were researchers and students (25%). Inthe 2012 R&D Priorities Survey (n=90), the respondents had a higher proportion of shellfish growers (34%), but thenumber of researchers and students was similar (25.56%). The population of finfish growers was higher in 2012 (10%)most likely due to the pool of respondents being smaller.
The total number of responding growers (finfish, shellfish, sea vegetable and recreational growers) has increased over time(2012 n=45; 2016 n=62; 2019 n=70). In addition, when considering only growers, representation of the differentaquaculture sectors in Maine has changed over time (Figure 2). This reflects the growth of Maine’s aquaculture sector, andin particular the growth of the sea vegetable and shellfish sectors.
8 Research, Development and Education Priorities
FIGURE 2: Changes in Production Sector distribution since 2012
Question 2. What products or services do you provide? (check all that apply)
2019 Survey: Answered: 13; Skipped: 197
Only industry service providers were guided to this question, and as such there were only 13 responses. Industry serviceproviders mostly provide consulting and research services to the aquaculture sector in Maine (Figure 3).
FIGURE 3: Services Provided by Service Providers in 2019 (n=13)

Aquaculture Sector in Maine 9
When compared to the previous R&D surveys conducted in 2016 (question respondents n=29) and 2012 (questionrespondents n=41), there were some changes in the types of service providers represented by the respondents.
• In 2016 and 2012 there was a much higher proportion of service providers involved in marketing, packaging and/orprocessing aquacultured products (19.5% in 2012; 20.7% in 2016; 2.9% in 2019)
• The proportion of responding aquatic animal health services providers has fluctuated (4.8% in 2012; 20.7% in 2016;2.9% in 2019)
• In the 2012 survey, wholesale sales of aquacultured products was chosen by 21.9% of question respondents but notrepresented at all in 2019
• Distribution and transport of aquaculture products and Retail sales of aquaculture products were not represented at allin 2019. No Feed service providers were represented in 2019, but were in 2016 (3.4%) and 2012 (4.8%)
• Training and investment capital were not included as survey options in 2016 and 2012, although education andinnovation support were mentioned in comments. These were included as multiple-choice options in 2019 and wereselected by 11.4% (training) and 8.6% (investment and capital) of respondents
• For the 1st time, SBIR support services were reported in 2019
Question 3. How long have you been involved with aquaculture in Maine?
2019 Survey: Answered: 70; Skipped: 140
Only responding growers (shellfish, finfish, sea vegetable and recreational growers) were guided to this question, and allanswered the question.
The majority of respondents were relatively new to aquaculture, with 65% involved in Maine aquaculture for less than 6years (Figure 4).
FIGURE 4: Amount of time that responding growers had been involved in Maine Aquaculture in 2019 (n=70)

10 Research, Development and Education Priorities
All finfish growers have been involved in aquaculture for longer than 3 years, and most for more than 12 years (Figure 5).
Most of the new entries to aquaculture are shellfish growers; 82% of those involved in aquaculture for less than 6 years areshellfish growers; 6.5% sea vegetable growers; 8.7% finfish growers; and 2.7% recreational growers (Figure 6).
FIGURE 5: Frequency Distribution of Years in Business for Aquaculture Producers in Maine Aquaculture, 2019 bysector (n=70)
FIGURE 6: Sector affiliations of newer growers in 2019 (n=46)
The number of new entries into Maine’s aquaculture sector has changed over time. In 2012, (n=45) 45% of growers wereinvolved in Maine’s aquaculture sector for more than 10 years (Figure 7).

Aquaculture Sector in Maine 11
The percentage of the responding grower population that was involved in Maine aquaculture for less than 3 years peakedin 2016 (Figure 9).
FIGURE 9: Amount of time that respondents had been involved in Maine Aquaculture (%)
FIGURE 7: Amount of time that respondents had beeninvolved in Maine Aquaculture in 2012 (n=45)
FIGURE 8: Amount of time that responding shellfishgrowers had been involved in Maine Aquaculture in2019 (n=57)

12 Research, Development and Education Priorities
In 2019, a third of the responding shellfish growers have been involved in Maine aquaculture for more than 6 years (Figure8). However, the shellfish sub-sector also has a large number of respondents who are newer farmers (less than 6 years)(Figure 8). Reflecting the nascent nature of the sea scallop sector, all responding scallop growers have been involved inMaine aquaculture for less than 6 years (Figure 11).
More than two-thirds of responding oyster growers have been involved in the sector for 6 years or less (Figure 10)reflecting the recent growth in this sector.
In contrast, even though the mussel sector is small, it has been active in Maine for many years, and the responding musselgrowers have all been involved in aquaculture for more than 6 years, and most for more than 12 years (Figure 12).The finfish farming sector has been active in Maine for many years although there has been recent diversification (seeQuestion 5) of species and production technology. The responding finfish growers have all been involved in aquaculturefor more than 3 years, and most for more than 12 years. (Figure 13)
FIGURE 10: Time that responding oyster growers hadbeen involved in Maine Aquaculture (n=44)
FIGURE 12: Amount of time that responding musselgrowers had been involved in Maine Aquaculture (n=3)
FIGURE 13: Amount of time that responding Finfishgrowers had been involved in Maine Aquaculture (n=4)
FIGURE 11: Amount of time that responding scallopgrowers had been involved in Maine Aquaculture (n=6)

Aquaculture Sector in Maine 13
FIGURE 14: Amount of time that respondingsea vegetable growers had been involved inMaine Aquaculture (n=5
The sea vegetable farming sector is relatively newand this is reflected in the length of time seavegetable farmers have been involved in Maineaquaculture; most of the responding seavegetables growers have been involved inaquaculture for less than 3 years. (Figure 14)
Question 4. Which of the following culture systems do you work with? (check all that apply)
2019 Survey: Answered: 69 Skipped: 141
All responding growers (total n=70) were guided to this question but 1 grower chose not to answer (shellfish n=57, finfishn=4, sea vegetable n=5 and recreational growers n=3).
Surface cages are the most commonly used culture system and are used by shellfish growers, recreational growers, and seavegetable growers.
Recirculating Aquaculture Systems (RAS) are used by all sectors.
FIGURE 15: Frequency Distribution of Culture Systems used by Responding Producers in 2019
14 Research, Development and Education Priorities
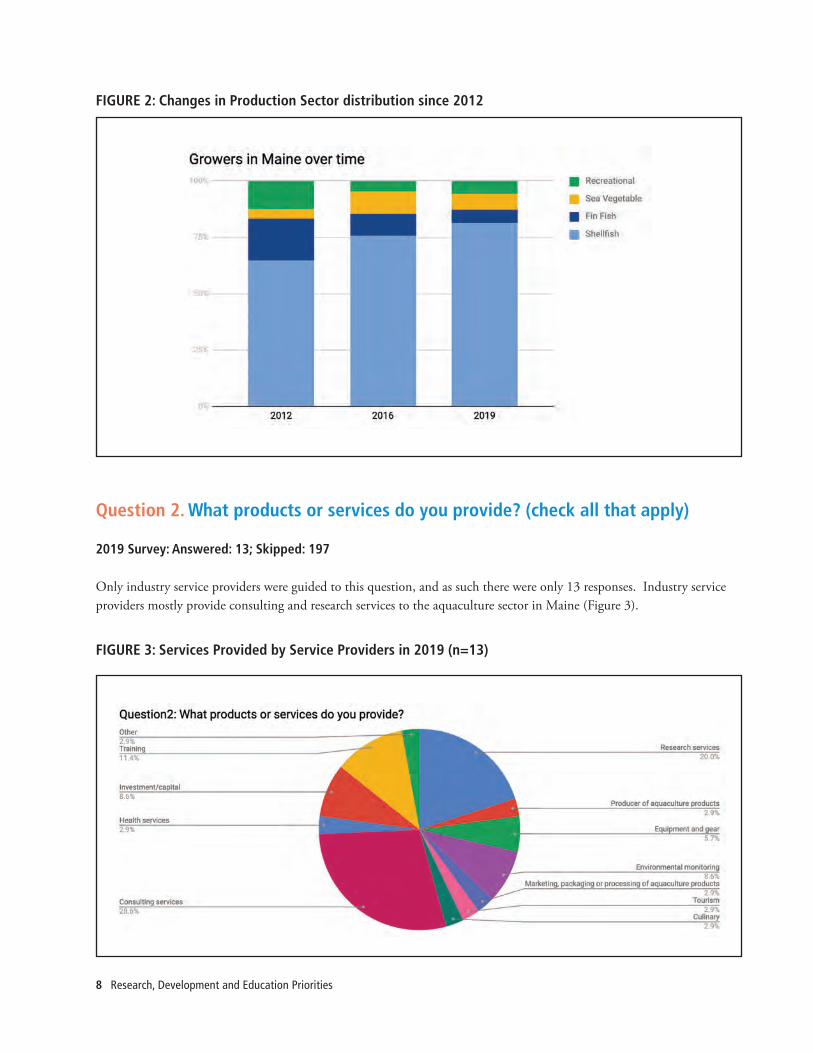
FIGURE 16: FrequencyDistribution of Culture Systems used by RespondingProducers in 2016
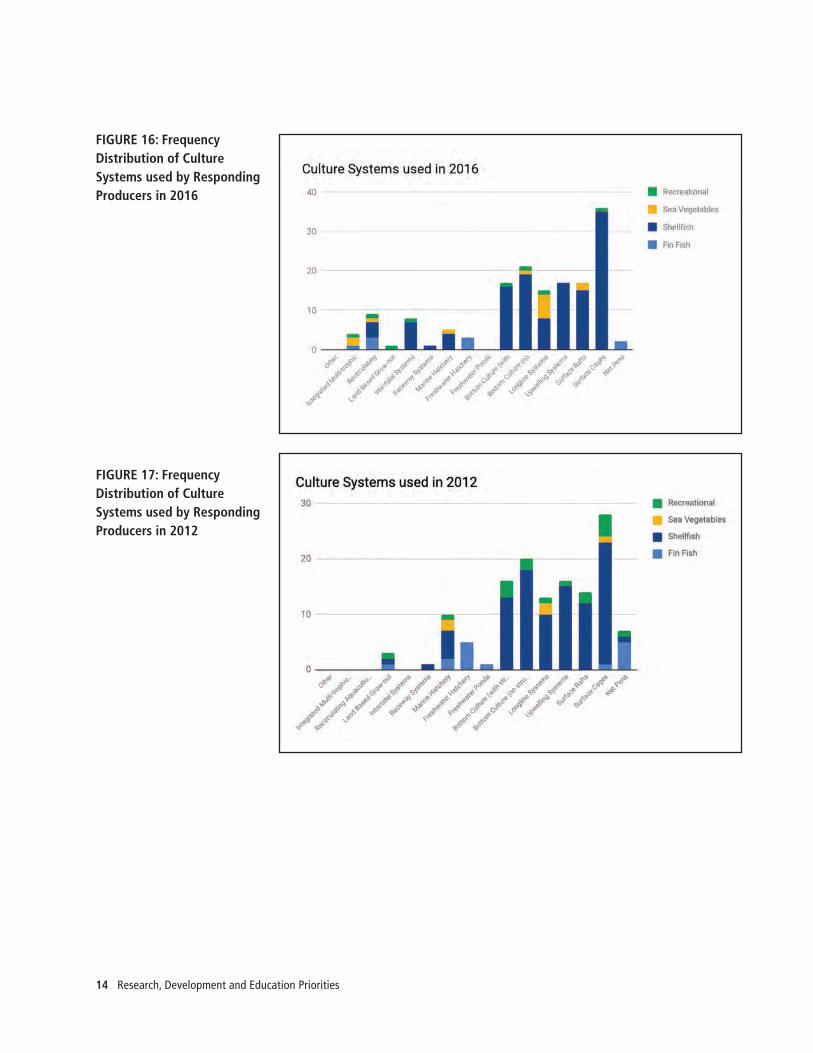
FIGURE 17: FrequencyDistribution of Culture Systems used by RespondingProducers in 2012

Table 1: Aquaculture Culture Systems in Maine (as represented by survey respondents)
Culture System 2012 2016 2019
Net Pens ✓ ✓ ✓ Surface Cages ✓ ✓ ✓ Surface Rafts ✓ ✓ ✓ Upwelling Systems ✓ ✓ ✓ Longline Systems ✓ ✓ ✓ Bottom Culture (no structures) ✓ ✓ ✓ Bottom Culture (with structures) ✓ ✓ ✓ Freshwater Ponds ✓ ✓ Freshwater Hatchery ✓ ✓ ✓ Marine Hatchery ✓ ✓ ✓ Raceway Systems ✓ ✓ ✓ Intertidal Systems ✓ ✓ Land Based Grow-out Systems ✓ ✓ ✓ Recirculating Aquaculture Systems ✓ ✓ Integrated Multi-trophic Systems ✓ ✓ Other ✓
The culture systems used by growers have changed only slightly over time (Table 1; Figures 15-17). The following systemswere not reported by survey respondents in 2012:
● Integrated Multi-trophic Aquaculture Systems ● Recirculating Aquaculture Systems● Intertidal Systems
This diversification may be a consequence of the culture of emerging species (see Question 5), an increase inexperimentation by Maine growers, or gear innovations nationally and globally.
Aquaculture Sector in Maine 15

16 Research, Development and Education Priorities
Question 5. Please indicate the principal species you culture (check only one box).
2019 survey: Answered: 69 Skipped: 141
All growers (total n=70) were guided to this question but 1 grower choose not answer (shellfish n=57, finfish n=4, seavegetable n=5 and recreational growers n=3).
FIGURE 18: Principal Species Cultured by Maine Growers in 2019
FIGURE 19: Principal Species Cultured by Maine Growers in 2016

Aquaculture Sector in Maine 17
There have been changes in the diversity of “main crop” species represented in the research priorities surveys over time(Table 2).
Finfish species represented in the surveys have continued to include Atlantic salmon, but the marine species Atlantic codand Atlantic halibut were only represented in the 2012 survey. Eels, trout, and aquaponic species are all now representedby the 2019 research priorities survey.
Hard-shell clams, soft-shelled clams, and green sea urchins were represented in previous research priorities but are no-longer represented as principal cultured species in 2019. In contrast, sea scallops are now clearly represented in the researchpriorities reported by growers for 2019.
Macro- and micro-algae species are represented in 2019. Only kelp species are represented as principal species..
FIGURE 20: Principal Species Cultured by Maine Growers in 2012

Table 2: Species Cultured in Maine (as represented by responding growers)
Principal Species 2012 2016 2019
Atlantic salmon ✓ ✓ ✓ Atlantic cod ✓
Atlantic halibut ✓
Eels ✓ ✓ Trout ✓ Baitfish
Aquaponics species ✓ Ornamental species ✓
Eastern oysters ✓ ✓ ✓ European oysters ✓ ✓ ✓ Blue mussels ✓ ✓ ✓ Hard clams ✓
Soft-shelled clams ✓
Razor clams
Surf clams
Arctic surf clams
Sea scallops ✓ ✓ Bay scallops
Green sea urchins ✓
Marine worms
Sugar kelp ✓ ✓ ✓ Skinny sugar kelp ✓ Winged kelp ✓ Horsetail kelp
Dulse
Irish moss
Porphyra species
Other ✓ (microalgae)
18 Research, Development and Education Priorities
(kelp species notpresented as separatespecies in the 2012survey)
(sea vegetables notpresented as separatespecies in the 2016survey)

Aquaculture Sector in Maine 19
Question 6. What is the single greatest barrier to your success?
2019 Survey: Answered: 62; Skipped: 148
All growers (shellfish, finfish, sea vegetable and recreational growers) were guided to this question and 8 skipped thequestion. This was an open question, and a qualitative, thematic analysis was carried out.
Overarching themes in 2019: Several cross-cutting themes were identified as barriers by more than one sector in 2019:● Regulations and the lease process (in particular the time required to obtain a standard lease)● Access to capital ● Crop loss
Overarching themes over time: Access to funding, capital, shellfish health (although not expressed as crop loss), andregulations were also common themes in 2016, indicating that these barriers are still experienced by the aquaculture sectorin Maine.
Access to capital and shellfish disease are also identified as urgently important topics in the survey questions in 2016 and2019 (see question 9).
Seedstock/hatchery production was a common barrier in 2012 but did not come up as a barrier on 2016 or 2019.Similarly, predation was a theme in 2012 that did not recur in 2016 and 2019. However, nursery priorities and themanagement of invasive species/predators/biofouling are identified as urgently important research priorities in 2019.
Finfish growers identified 3 key barriers to business success in 2019: ● Infrastructure. For finfish growers this was expressed as a trained workforce● Crop-loss due to parasites ● Access to capital
Feedback: “Workforce development and making sure training programs are in place so that we can hire local people”
“Sea lice and lack of approved treatment options”
Sea vegetable growers identified 2 key barriers to business in 2019: ● Infrastructure. For sea vegetable growers, this referred to processing infrastructure● Regulations
Feedback: “Processing/drying facilities”
“Open grow areas”

20 Research, Development and Education Priorities
Shellfish growers identified a greater number of barriers due to the higher number of respondents. Key barriers included:
● Access to information. A lack of easy access to up to date, reliable information was identified as a barrier● Community acceptance. This was mentioned in relation to bad press generated by recent high profile lease
applications, but also potential conflict with other water users (e.g. lobstermen, and riparian landowners)● Market. This was in reference to both anxiety about local market saturation, and how to identify markets as a new
grower ● Regulation. This was sometimes referred to as “red tape”, and there were mentions of regulations to prevent growth
of the industry ● Access to capital was mentioned mostly as a barrier for new growers starting out with a need for expensive equipment● Crop-loss (particularly overwintering losses)● Time. This was mostly in relation to time to work the farm, and time to balance workloads, but also referred to the
delay between investment and income● Business planning/growth. Many growers identified the need for support to scale up their business. This included
support for paperwork, lease applications etc, as well as a need for business planning knowledge
Feedback: “Regulations meant to stop our industry”
“Bad press that new lease application explosion is causing ...”
“Local market saturation (related: price drops, bottlenecks for getting product direct tocustomers or sold out of state”
“Potential conflicts with lobstermen & shorefront owners”
“A centralized source for information on oyster culture, trouble-shooting etc.”
“I have too much going on to tend it all ”
In addition to these overarching barriers to business success, there were some species-specific barriers identified by differentshellfish sectors.
Sea scallop growers identified biotoxins, and seed supply as barriers to business success.
Feedback: “Obtaining seed”
“Cost of biotoxin testing”
Oyster growers identified overwintering as a barrier to business success.
Feedback: “High mortality during overwintering”

Aquaculture Sector in Maine 21
Question 7. What do you see as the greatest opportunity to succeed in your venture?
2019 Survey: Answered: 55; Skipped: 155
All growers (shellfish, finfish, sea vegetable and recreational growers) were guided to this question and 15 skipped thequestion. This was an open question, and a qualitative, thematic analysis was carried out.
Overarching themes: Marketing was a cross-cutting theme identified by many sectors as the greatest opportunity forsuccess. This theme incorporated the importance of name recognition and the Maine brand, and also the opportunitiesassociated with the expansion of markets and products. The opportunities associated with expanding markets and sales,and product diversification were also common themes in previous surveys (in 2016 and 2012).
Additional themes included the opportunities to succeed related to:● Choosing a good site (e.g. a high quality growing area)● Securing appropriate resources (e.g. for new equipment)● Product diversification (e.g. diversifying species that are farmed, as well as exploring non-traditional revenue streams)● Good public relations/community cooperation● The wisdom of “don’t overreach” (i.e. don’t try to grow too quickly as a new business)
Feedback: “To integrate into a community”
“The market wants fresh farmed shellfish from Maine, and I believe there are a few species that aren't farmed yet that have significant potential”
“The quality of Maine grown shellfish and recognition of Maine brand”
“Product quality and excellent name recognition for Maine seafood”
“Species diversification and not-traditional revenue streams”
“Diversification of revenue streams through new products and species”
“Good riparian relations”
Unlike question 6 (identifying barriers), there was little variation in the responses to question 7 (identifying opportunitiesfor success) that could be attributed to species.
The only species-specific opportunities for success that were identified were for sea scallops and related to sales of product.
Feedback: “Direct to consumer sales”
“Ability to sell live product”

22 Research, Development and Education Priorities
Question 8. Please indicate all the species you are currently involved with (check all that apply).
2019 Survey; Answered: 183; Skipped: 27. All survey respondents were guided to this question.
By jointly analyzing responses to questions 5 and 8, including responses filtered for growers or non-growers, it was possibleto identify primary commercial species, secondary commercial species, and non-commercial species (Table 3).
Table 3: Aquacultured Species in Maine, 2019 (as represented by survey respondents) Principal Only Secondary Only Only
Commercial Species Commercial Species Commercial Species Non-commercialAtlantic salmon ✓ Eels ✓ Trout ✓ Aquaponic spp ✓ Atlantic cod ✓Atlantic halibut ✓Baitfish ✓Ornamentals ✓Blue mussels ✓ Eastern oysters ✓ European oysters ✓ Sea scallops ✓ Hard clams ✓ Surf clams ✓ Softshell clams ✓ Razor clams ✓ Bay scallops ✓ Arctic surf clams ✓Sugar kelp ✓ Skinny kelp ✓ Winged kelp ✓ Horsetail kelp ✓ Irish moss ✓ Dulse ✓ Porphyra spp ✓ Green sea urchin ✓ Marine worms ✓ Other microalgae Wild set macroalgae
Twelve different species were identified as “main crop” species by survey respondents. An additional twelve species wereidentified as “secondary crop” species. As such, the research, development, and education priorities identified in the 2019survey represent those 24 species.
Aquaculture Sector in Maine 23
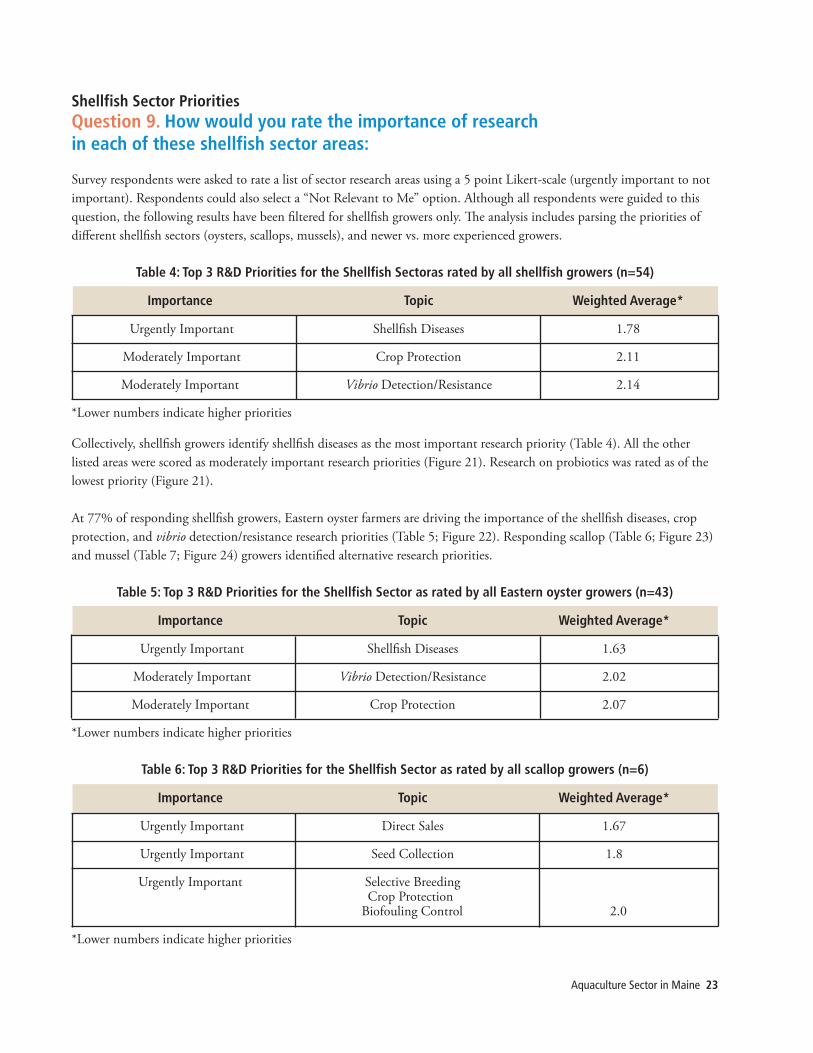
Shellfish Sector Priorities Question 9. How would you rate the importance of research in each of these shellfish sector areas:
Survey respondents were asked to rate a list of sector research areas using a 5 point Likert-scale (urgently important to notimportant). Respondents could also select a “Not Relevant to Me” option. Although all respondents were guided to thisquestion, the following results have been filtered for shellfish growers only. The analysis includes parsing the priorities ofdifferent shellfish sectors (oysters, scallops, mussels), and newer vs. more experienced growers.
Table 4: Top 3 R&D Priorities for the Shellfish Sectoras rated by all shellfish growers (n=54) Importance Topic Weighted Average*
Urgently Important Shellfish Diseases 1.78
Moderately Important Crop Protection 2.11
Moderately Important Vibrio Detection/Resistance 2.14
*Lower numbers indicate higher priorities
Collectively, shellfish growers identify shellfish diseases as the most important research priority (Table 4). All the otherlisted areas were scored as moderately important research priorities (Figure 21). Research on probiotics was rated as of thelowest priority (Figure 21).
At 77% of responding shellfish growers, Eastern oyster farmers are driving the importance of the shellfish diseases, cropprotection, and vibrio detection/resistance research priorities (Table 5; Figure 22). Responding scallop (Table 6; Figure 23)and mussel (Table 7; Figure 24) growers identified alternative research priorities.
Table 5: Top 3 R&D Priorities for the Shellfish Sector as rated by all Eastern oyster growers (n=43)
Importance Topic Weighted Average*
Urgently Important Shellfish Diseases 1.63
Moderately Important Vibrio Detection/Resistance 2.02
Moderately Important Crop Protection 2.07
*Lower numbers indicate higher priorities
Table 6: Top 3 R&D Priorities for the Shellfish Sector as rated by all scallop growers (n=6)
Importance Topic Weighted Average*
Urgently Important Direct Sales 1.67
Urgently Important Seed Collection 1.8
Urgently Important Selective Breeding Crop Protection Biofouling Control 2.0
*Lower numbers indicate higher priorities

24 Research, Development and Education Priorities
Scallop growers identified direct sales and seed collection as the two most important research priorities for their businesses.Selective breeding, crop protection, and biofouling control were also identified as urgently important (Table 6).
All other listed research areas were ranked as moderately important, with probiotics rated as being of lowest priority(Figure 23).
Table 7: Top 3 R&D Priorities for the Shellfish Sector as rated by all mussel growers (n=3)
Importance Topic Weighted Average*
Urgently Important Site Selection 1.67
Urgently Important Seed Collection 1.8
Urgently Important Reducing Grow-out Period Nursery Technology Biofouling Control 2.0
*Lower numbers indicate higher priorities
Mussel farmers identified site selection and seed collection as the two most important research priorities for theirbusinesses. Reducing the grow-out period, nursery technology, and biofouling control were also identified as urgentlyimportant (Table 6).
Several listed research areas were ranked as moderately important (Figure 23).
Probiotic research, vibrio detection and resistance, direct sales from farms, and selective breeding were rated by musselfarmers as not important research areas (Figure 23).
Vibrio detection and resistance was only rated by oyster growers as a priority, not by mussel and scallop farmers.
Seed collection strategies were rated as urgently important priorities by both mussel and scallop farmers, as unlike oysterfarmers, mussel and scallop farmers rely on wild seed.
Biofouling control was also rated as urgently important priorities by both mussel and scallop farmers.
Newer vs. More Experienced Growers:Scallop grower priorities did not change according to the time growers have been involved in aquaculture, because allscallop growers have been involved in aquaculture for LESS than 6 years (Table 8).
Mussel grower priorities did not change according to the time growers have been involved in aquaculture, because allmussel growers have been involved in aquaculture for MORE than 6 years (Table 8).
When looking at the whole shellfish sector, there were only subtle differences in the priorities identified by newer vs. moreexperienced growers (Table 9, Figure 25, Figure 26), and again this appears to be driven by oyster growers (Table 10,Figure 27, Figure 28).
An interesting difference that can be seen between newer vs. more experienced shellfish growers is that, generally, newergrowers rate priorities as higher priority (Table 9, Figure 25, Figure 26)

Aquaculture Sector in Maine 25
BUPSY Oyster Seed System Photo by Anne Langston Noll
FIGURE 21:Shellfish SectorR&D Priorities* in2019 (all shellfishgrowers) (n= 54)

26 Research, Development and Education Priorities
*Lower numbers indicate higher priorities
FIGURE 22: ShellfishSector R&D Priorities*in 2019 (Easternoyster growers)(n=43)
FIGURE 23: ShellfishSector R&D Priorities*in 2019 (scallopgrowers) (n= 6)
FIGURE 24: ShellfishSector R&D Priorities*in 2019 (musselgrowers) (n=3)

Aquaculture Sector in Maine 27
Table 8: Newer vs More Experienced Responding Growers
All shellfish grower Oyster growers Scallop growers Mussel growers
Newer Growers 66% of all shellfish 67% of all oyster 100% of scallop None<6 years in the growers have been in growers have been in growers have been inthe sector the sector for less the sector for less the sector for less
than 6 years than 6 years than 6 years
Newer Growers 34% of all shellfish 33% of all oyster None 100% of mussel>6 years in the growers have been in growers have been in growers have been inthe sector the sector for more the sector for more the sector for more
than 6 years than 6 years than 6 years
Table 9: Top 3 R&D Priorities for the Shellfish Sector Newer vs experienced
Newer growers Scallop growers Combined <6 years in the sector > 6 years in the sector
1 Shellfish Diseases Shellfish Diseases Shellfish Diseases Urgently important Urgently important Urgently important
2 Crop Protection Direct Sales from Farms Vibrio Detection/Resistance Moderately important Urgently important Moderately important
3 Vibrio Detection/Resistance Crop Protection Crop Protection Moderately important Urgently important Moderately important
Table 10: Top 3 R&D Priorities for the Oyster SectorNewer vs experienced
Newer growers Scallop growers Combined <6 years in the sector > 6 years in the sector
1 Shellfish Diseases Shellfish Diseases Shellfish Diseases Urgently important Urgently important Urgently important
2 Vibrio Detection/Resistance Crop Protection Vibrio Detection/Resistance Moderately important Urgently important Moderately important
3 Crop Protection Direct Sales from Farms Selective Breeding Moderately important Urgently important Moderately important

28 Research, Development and Education Priorities
*Lower numbers indicate higher priorities
FIGURE 25: ShellfishSector R&D Priorities*in 2019 (newershellfish growers)(n=36))
IGURE 26: ShellfishSector R&D Priorities*in 2019 (moreexperienced shellfishgrowers) (n=18)
FIGURE 27: ShellfishSector R&D Priorities*in 2019 (newer oystergrowers) (n=29)

Finfish Sector Priorities: Question 10. How would you rate the importance of research in each of these finfish sector areas:
Survey respondents were asked to rate a list of sector research areas using a 5 point Likert-scale (urgently important to notimportant). Respondents could also select a “Not Relevant to Me” option. Although all respondents were guided to thisquestion, the following results have been filtered for finfish growers only.
Due to the small number of finfish grower respondents, it is not appropriate to parse results for species-specific prioritiesnor the priorities of newer vs. more experienced growers.
Table 11: Top 3 R&D Priorities for the Finfish Sector (n=4)
Importance Topic Weighted Average
Urgently Important Sea Lice 1.00
Urgently Important Effluent Treatment 1.50
Urgently Important Fish Vaccines 1.75
Sea lice, effluent treatment and fish vaccine were all identified by responding finfish growers as urgently important researchpriorities. All the other listed areas were scored as moderately important research priorities. Amoebic Gill Disease was ratedas of lowest importance.
Aquaculture Sector in Maine 29
FIGURE 28: ShellfishSector R&D Priorities*in 2019 (moreexperienced oystergrowers) (n=14)
*Lower numbersindicate higher
priorities

30 Research, Development and Education Priorities
Sea Vegetable Sector Priorities: Question 11. How would you rate the importance of research in each of these sea vegetable areas:
Survey respondents were asked to rate a list of sector research areas using a 5 point Likert-scale (urgently important to notimportant). Respondents could also select a “Not Relevant to Me” option. Although all respondents were guided to thisquestion, the following results have been filtered for sea vegetable growers only.
Due to the small number of sea vegetable grower respondents, it is not appropriate to parse results for species-specificpriorities nor the priorities of newer vs. more experienced growers.
Table 12: Top 3 R&D Priorities for the Sea Vegetable Sector (n=4)
Importance Topic Weighted Average
Urgently Important Storage & Shipping Technology 1.75
Urgently Important Identifying New High Value-added Products 2.0 Harvesting Technology Market Research Biofouling 2.0
Storage and shipping technology was the most important research priority identified by sea vegetable growers. IdentifyingNew High Value-added Products, Harvesting Technology, Market Research, and Biofouling were also identified as urgentlyimportant priorities (Table 12).
All the other listed areas were scored as moderately important research priorities (Figure 30).
FIGURE 29: FinfishSector R&DPriorities* (n=4)
*Lower numbersindicate higher
priorities

Aquaculture Sector in Maine 31
General Aquaculture Priorities: Question 12. How would you rate the importance of R&D in each of these areas:
Table 13: Top 3 General Aquaculture R&D Priorities (responding growers) (n=62)
Importance Topic Weighted Average
Urgently Important Access to working waterfront 1.67
Urgently Important Water quality monitoring and accessing water quality information 1.9
Urgently Important Social acceptability 1.95
*Lower numbers indicate higher priorities
Although the above were the Top 3 priorities (Table 13), there were two additional areas that were also identified asurgently important by all responding growers:
● Seafood safety● Management of invasive species, predators & biofouling
All the other listed areas were scored as moderately important research priorities (Figure 31).
There are no differences in the priorities identified by newer growers vs more experienced growers.
When filtering by sector (Shellfish vs Finfish vs Sea Vegetable growers) some differences in priorities become apparent(Table 14).
● Shellfish growers identified 7 urgent priorities ● Finfish growers identified 2 urgent priorities ● Sea vegetable growers identified 4 urgent priorities
FIGURE 30:Sea Vegetable SectorR&D Priorities* (n=4)
*Lower numbersindicate higher
priorities

32 Research, Development and Education Priorities
Sea vegetable growers rated waste utilization and effluent reduction (weighted average 4.0) as not important, whereas incontrast finfish growers identified it as urgently important (weighted average 1.75).
The following topics were rated by finfish growers as not important, whereas shellfish and sea vegetable growers identifiedthem as moderately important:
● Inter-tidal aquaculture (Finfish weighted average 4.0; shellfish 2.46; sea vegetable 3.0)● Biofouling control (Finfish weighted average 4.5; shellfish 2.44; sea vegetable 2.75)● Identification of new candidate species (Finfish weighted average 4.75; shellfish 2.7; sea vegetable 3.0)
Table 14: Urgently Important PrioritiesGeneral Aquaculture
Shellfish vs Finfish vs Sea Vegetable
Shellfish Finfish Sea Vegetable (n=51) (n=4) (n=4)
1 Access to working waterfront Waste utilization and Access to working waterfront (weighted average 1.58) effluent reduction (weighted average 1.5) (weighted average 1.75)
2 Management of invasive species, Training and professional Information materials for predators & biofouling development (weighted the general public (weighted average 1.75) average 2.0) (weighted average 1.75)
3 Water quality monitoring and Offshore aquaculture accessing water quality information (weighted average 2.0) (weighted average 1.76)
4 Social acceptability Policy & Regulations (weighted average 1.88) (weighted average 2.0)
5 Seafood Safety (weighted average 1.92)
6 Management of impacts of environmental change (weighted average 1.94)
7 Policy & Regulations (weighted average 1.96)
When differentiating between shellfish sub-sectors (scallop vs mussel vs oyster growers), more differences in prioritiesbecome apparent (Table 15).
Mussel growers rated coop development (weighted average 4.67) and market & branding research (weighted average 4.0)as not important, whereas in contrast finfish growers identified these as urgently or moderately important.

Aquaculture Sector in Maine 33
Table 15: Urgently Important PrioritiesGeneral Aquaculture
Scallop vs Mussel vs Oyster
Scallop (n=6) Mussel (n=3) Oyster (n=41)
1 Seafood Safety Policy & Regulations Access to working waterfront (weighted average 1.33) (weighted average 1.0) (weighted average 1.7)
2 Water quality monitoring and Social acceptability Water quality monitoring and accessing water quality information (weighted average 1.0) accessing water quality information (weighted average 1.33) (weighted average 1.77)
3 Access to working waterfront Access to working waterfront Management of invasive species, (weighted average 1.33) (weighted average 1.33) predators & biofouling (weighted average 1.78)
4 Access to capital Information materials for Seafood Safety (weighted average 1.67) the general public (weighted average 1.95) (weighted average 1.33)
5 Coop development Management of invasive species, Social acceptability (weighted average 1.67) predators & biofouling (weighted average 1.95) (weighted average 1.33)
6 Offshore aquaculture Biofouling control Management of impacts of (weighted average 1.67) (weighted average 1.67) environmental change (weighted average 2.0)
7 Management of impacts of Seafood Safety environmental change (weighted average 2.0)
(weighted average 1.67)
8 Social acceptability Water quality monitoring and (weighted average 1.67) accessing water quality information (weighted average 2.0)
9 Management of invasive species, predators & biofouling (weighted average 1.83)
10 Policy & Regulations (weighted average 1.83)
11 Information materials for the general public (weighted average 2.0)
12 Training and professional development (weighted average 2.0)

34 Research, Development and Education Priorities
FIGURE 31: General Aquaculture R&D Priorities* (responding growers) (n=62)
*Lower numbers indicate higher priorities
Processing & Product Development Priorities: Question 13. How would you rate the importance of research in each of these areas:
Table 16: Top 3 Processing & Product Development R&D Priorities (responding growers) (n=61)
Importance Topic Weighted Average
Moderately Important Food traceability 2.30 Moderately Important Understanding consumer preferences and markets 2.39
Moderately Important Developing cooperative marketing strategies 2.39
*Lower numbers indicate higher priorities
All the other listed areas were also scored as moderately important research priorities.

Aquaculture Sector in Maine 35
FIGURE 32: Processing & Product Development R&D Priorities* (responding growers) (n=61)
*Lower numbers indicate higher priorities
Although the above were the Top 3 priorities (Table 16), all the listed areas were scored as moderately important researchpriorities (Figure 32).
There are no differences in the priorities identified by newer growers vs more experienced growers.
When filtering by sector (Shellfish vs Finfish vs Sea Vegetable growers) some differences in priorities become apparent(Table 17). Sea vegetable growers were the only group to identify any processing and product development topics asurgently important priorities (Table 17). In particular, sea vegetable growers rated food and non-food productdevelopment as urgently important.
Table 17: Urgently Important PrioritiesProcessing & Product DevelopmentShellfish vs Finfish vs Sea Vegetable
Shellfish (n=50) Finfish (n=4) Sea Vegetable (n=4)
1 None. All priorities were None. All priorities were New non-food value added rated as moderately important rated as moderately important products for pharma, biotech etc industries (weighted average 1.5)
2 New food product development (weighted average 1.67)
3 By-product re-use (weighted average 2)
*Lower numbers indicate higher priorities

36 Research, Development and Education Priorities
An in-depth analysis into shellfish sub-sectors (scallop vs mussel vs oyster growers) more differences in priorities becomeapparent (Table 18).
Mussel growers did not rate processing and product development topic areas as urgently important, and all the topic areasscored 3+ (i.e. of moderate priority but erring towards not important). Food traceability was rated by mussel growers asnot important (weighted average 4.0).
Scallop growers in contrast rated food traceability as an urgently important research priority (weighted average 1.83).Understanding consumer preferences and markets, and multi/shared-use processing centers were also rated as urgentlyimportant by scallop growers (Table 18).
Table 18: Urgently Important PrioritiesProcessing & Product Development
Scallop vs. Mussel vs. Oyster
Scallop (n=6) Mussel (n=3) Oyster (n=40)
1 Understanding consumer None. All priorities were None. All priorities were preferences & markets rated as moderately important rated as moderately important (weighted average 1.67) or not important
2 Food traceability (weighted average 1.83)
3 Multi/shared-use processing centers (weighted average 2.0)
*Lower numbers indicate higher priorities
Farm Operations Technology: Question 14. How would you rate the importance of research in each ofthese areas
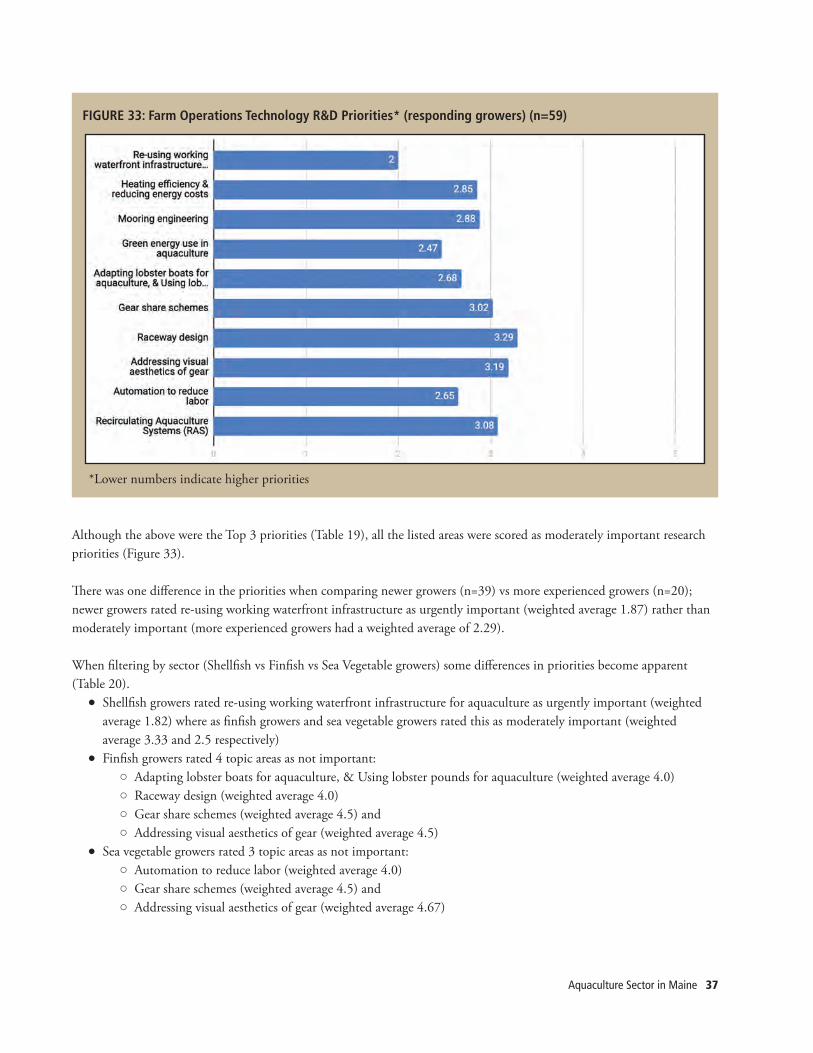
Table 19: Top 3 Farm Operations Technology R&D Priorities (responding growers) (n=59))
Importance Topic Weighted Average*
Urgently Important Re-using working waterfront infrastructure 2.00 for aquaculture
Moderately Important Green energy use in aquaculture 2.47
Moderately Important Automation to reduce labor 2.65
*Lower numbers indicate higher priorities
All the other listed areas were scored as moderately important research priorities.
Aquaculture Sector in Maine 37
FIGURE 33: Farm Operations Technology R&D Priorities* (responding growers) (n=59)
*Lower numbers indicate higher priorities
Although the above were the Top 3 priorities (Table 19), all the listed areas were scored as moderately important researchpriorities (Figure 33).
There was one difference in the priorities when comparing newer growers (n=39) vs more experienced growers (n=20);newer growers rated re-using working waterfront infrastructure as urgently important (weighted average 1.87) rather thanmoderately important (more experienced growers had a weighted average of 2.29).
When filtering by sector (Shellfish vs Finfish vs Sea Vegetable growers) some differences in priorities become apparent(Table 20).
● Shellfish growers rated re-using working waterfront infrastructure for aquaculture as urgently important (weightedaverage 1.82) where as finfish growers and sea vegetable growers rated this as moderately important (weightedaverage 3.33 and 2.5 respectively)
● Finfish growers rated 4 topic areas as not important: ○ Adapting lobster boats for aquaculture, & Using lobster pounds for aquaculture (weighted average 4.0) ○ Raceway design (weighted average 4.0)○ Gear share schemes (weighted average 4.5) and ○ Addressing visual aesthetics of gear (weighted average 4.5)
● Sea vegetable growers rated 3 topic areas as not important: ○ Automation to reduce labor (weighted average 4.0)○ Gear share schemes (weighted average 4.5) and ○ Addressing visual aesthetics of gear (weighted average 4.67)

38 Research, Development and Education Priorities
Table 20: Urgently Important Priorities, Farm Operations Technology
Shellfish vs Finfish vs Sea Vegetable
Shellfish (n=48) Finfish (n=4) Sea Vegetable (n=4)
1 Re-using working waterfront None. All priorities were rated None. All priorities were infrastructure for aquaculture as moderately important rated as moderately important (weighted average 1.82) or not important
*Lower numbers indicate higher priorities
When drilling down into shellfish sub-sectors (scallop vs mussel vs oyster growers) more differences in priorities becomeapparent (Table 21).
Raceway design was scored as “not relevant to me” by all responding mussel growers. In addition, mussel growers ratedgear share schemes as not important (weighted average 4.5).
In contrast, several farm operations topic areas were rated as urgently important by mussel growers (Table 21).
Oyster growers only identified one farm operations topic area as an urgently important research priority. All other farmoperations topic areas were rated as moderately important by oyster growers.
Scallop growers rated several farm operations topic areas as urgently important (Table 21). All other farm operations topicareas were rated as moderately important by scallop growers.
Table 21: Urgently Important Priorities, Farm Operations Technology
Scallop vs Mussel vs Oyster
Scallop (n=6) Mussel (n=3) Oyster (n=39)
1 Re-using working waterfront Automation to reduce labor Re-using working waterfront infrastructure for aquaculture (weighted average 1.0) infrastructure for aquaculture (weighted average 1.67) (weighted average 1.94)
2 Gear share schemes Green energy use in aquaculture (weighted average 1.67) (weighted average 1.0)
3 Moring engineering Moring engineering (weighted average 1.83) (weighted average 167)
4 Green energy use in aquaculture Re-using working waterfront (weighted average 2.0) infrastructure for aquaculture (weighted average 1.67)
5 Adapting lobster boats for aquaculture, & Using lobster pounds for aquaculture (weighted average 2.0)
*Lower numbers indicate higher priorities

Aquaculture Sector in Maine 39
Education & Training: Question 15. How would you prioritize target audiences for outreach and education?
Table 22: Top 3 Target Audiences: Education Priorities (n=163)*
Importance Topic Weighted Average**
Urgently Important New growers 1.95
Moderately Important High schoolers Maine science teachers 2.12
Moderately Important Culinary Scored 2.15 and Post-secondary 2.16 respectively
*All respondents were guided to this question.**Lower numbers indicate higher priorities
New growers were highlighted as the top priority target audience by the entire population of respondents. This does notappear to be driven by growers. When selecting for growers only (n=58), the target audience priorities shift to culinary(2.13), Maine science teachers (2.20), and public/community festivals (2.23).
FIGURE 34: Education Priorities*:Target Audiences (as scored by all respondents) (n=163)
*Lower numbers indicate higher priorities

40 Research, Development and Education Priorities
Question 16. How would you prioritize curricula and training needs?
Table 23: Top 3 Curricula: Education Priorities (n=161)*
Importance Topic Weighted Average**
Urgently Important Community relations 1.89
Urgently Important Best management practices Stewardship of the environment Both scored 1.93
Urgently Important Addressing riparian owner concerns 2.00
*All respondents were guided to this question.**Lower numbers indicate higher priorities
Community relations and Addressing riparian concerns were both scored as urgently important by the entire population ofrespondents. The same curricula scored as important when selecting for just growers (n=57): Community relations (1.93),Addressing riparian owner concerns (1.96) scored as most important, with Best management practices (2.05) andStewardship of the environment (2.06) also scoring as urgently important.
FIGURE 35: Education Priorities*: Curricula (as scored by all respondents) (n=161)
*Lower numbers indicate higher priorities
Aquaculture Sector in Maine 41
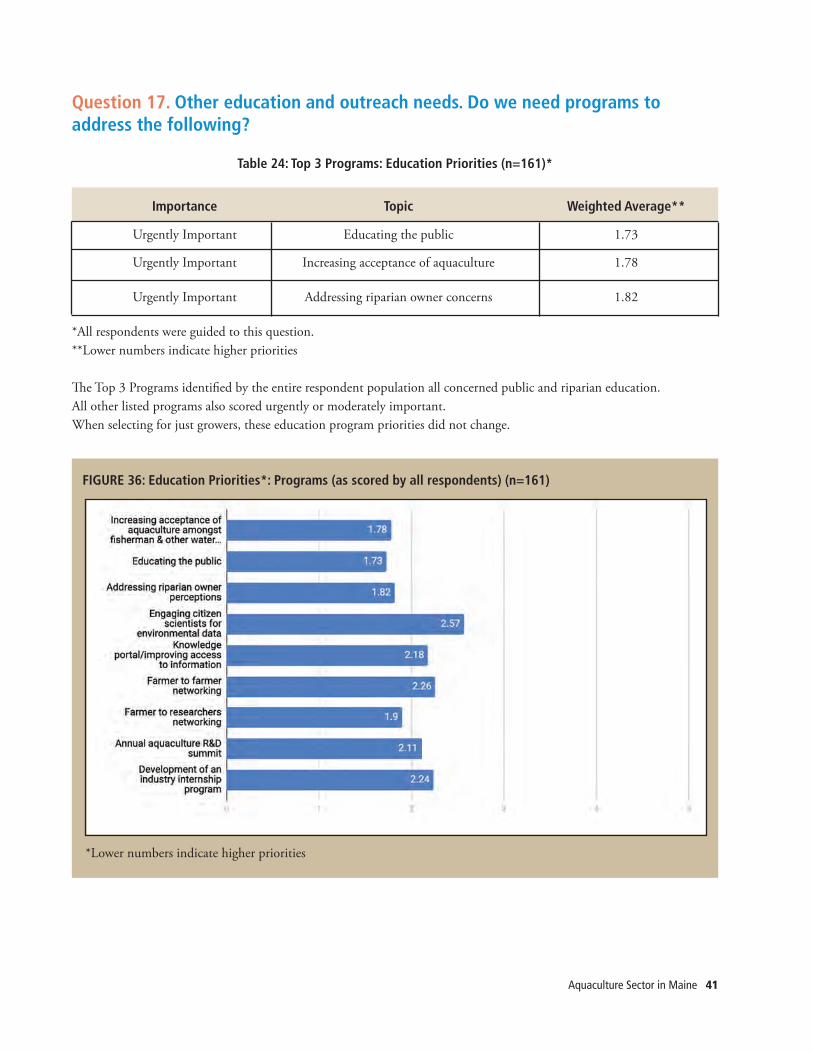
Question 17. Other education and outreach needs. Do we need programs toaddress the following?
Table 24: Top 3 Programs: Education Priorities (n=161)*
Importance Topic Weighted Average**
Urgently Important Educating the public 1.73
Urgently Important Increasing acceptance of aquaculture 1.78
Urgently Important Addressing riparian owner concerns 1.82
*All respondents were guided to this question.**Lower numbers indicate higher priorities
The Top 3 Programs identified by the entire respondent population all concerned public and riparian education. All other listed programs also scored urgently or moderately important. When selecting for just growers, these education program priorities did not change.
FIGURE 36: Education Priorities*: Programs (as scored by all respondents) (n=161)
*Lower numbers indicate higher priorities

42 Research, Development and Education Priorities
FIGURE 37: Education Priorities*: Programs (as scored by growers)
*Lower numbers indicate higher priorities
Question 18. Which time of year would be best for you to attend trainingsessions?
2019 Survey: Answered: 158; Skipped: 52
Winter was identified by over 70% of respondents as the best time of year to attend training sessions.
When selecting just growers, the preference for winter training sessions rose to 88% of the respondents.
FIGURE 38: Timing of Training Sessions

Aquaculture Sector in Maine 43
Community Identified Research NeedsQuestion 19. If a $25,000 seed grant were available to address a critical issuefacing your venture in Maine, what would be your most important priority?
2019 Survey: Answered: 129; Skipped: 81
All respondents were guided to this question; 129 answered and 81 skipped the question. This was an open question, and aqualitative, thematic analysis was carried out.
Overarching themes for 2019: Overall the dominating themes were related to seed grants for: ● Workforce development ● Public education● Improving technology/gear/equipment/mechanization
Shellfish growers (n=40) put forward a wide range of suggestions for seed grants including:● Understanding the beneficial impacts of aquaculture on water quality/ ecosystem● Biofouling control● Pest/predator management● Nursery protocols for sea scallops (including use of probiotics)● Developing a rapid result biotoxin assay● Intertidal aquaculture
The two most common suggestions were:● A state-wide marketing campaign for Maine farmed seafood● Understanding the impact of climate change and ocean acidification on production.
Feedback: “Marketing of Maine grown aquaculture products”
“Climate change predictive models with focus on production”
Finfish growers (n=4) suggested 4 topics for seed grants:● RAS waste stream utilization● Sea lice reduction methods● Automated processing equipment / training● Water quality
Sea vegetable growers (n=3) suggested 3 topics for seed grants:● Food safety ● Advertising/marketing● New technology to enable scaling of harvest
Educators (n=10) suggested two key initiatives:● High school internship program development (pipeline development and general help with farm)● Career education in Middle/High School

44 Research, Development and Education Priorities
Question 20. If you could direct a $1,000,000 research initiative, what would be its focus?
2019 Survey: Answered: 129; Skipped: 81
All respondents were guided to this question; 129 answered and 81 skipped the question. This was an open question, and aqualitative, thematic analysis was carried out.
Overarching themes for 2019: Overall the dominating themes related to $1million initiatives included: ● Understanding environmental impacts of aquaculture● Marketing campaign for Maine farmed seafood● Distribution and processing● Workforce development● Technology development (in particular RAS systems, processing technology, growing technology)● Sector expansion (including product diversification, site selection)● Public outreach and education hugely important
When selecting for growers only (n=48), the most common suggestion was a marketing campaign for Maine farmedseafood.
Feedback: “Support the ideas of growers to advance the industry”
Shellfish growers (n=39) suggested several topics for large scale research investment:● Climate change research ● Pest/predator management● Marketing ● Product diversification● Developing and/or testing new growing technology
Scallop growers (n=5) suggested investment in:● Biotoxin testing,● Farm management strategies to cope with biotoxin closures,● Spat collection or husbandry, and● Exploring opportunities to make aquaculture more accessible to people in year round coastal communities
Feedback: “Biotoxins, mapping historic biotoxin closure and create production plans with biotoxinconstraints built in”
Finfish growers (n=3) suggested several topics for large scale research investment:● RAS workforce development ● Sea lice reduction methods● Experimental offshore farm ● Streamlining distribution● Removal of phosphorus from wastewater

Aquaculture Sector in Maine 45
Feedback: “Streamlining distribution (traceability tech, shipping logistics, tracking improvements,order processing, cold-chain distribution.”
Sea vegetable growers (n=3)● Product diversification● Design and testing of kelp harvesting barge
Feedback: “Uses for sea vegetables other than food”
Many educators (n=11) indicated they would like to see investment in education, and specifically:● Outreach/Practical sharing of knowledge with communities
Feedback: “Organizing a coalition to create positive publicity and to educate the public about thevast potential benefits if we (the state of Maine) invest in and encourage aquaculture inMaine; from small-scale up through large industrial scale. We have the infrastructure todo both and the jobs created can only benefit this state and hopefully encourage youngpeople to stay in a young and growing industry.”
In 2012 the range of initiative suggestions was smaller, possibly due to the smaller number of respondents (n=38).Initiative suggestions included:
● site selection ● species and product diversification● climate change (although not as dominant as in 2019)● seedstock/hatchery/breeding programs● disease and breeding for disease resistance● polyculture● predation management
Eels Photo by Meggan Dwyer

46 Research, Development and Education Priorities
Top: Sea Farm Buoys Photo by Anne Langston Noll; Scallop Photo by Hugh Cowperthwaite

Aquaculture Sector in Maine 47
Parsing sectors: Examining priorities by sector, and especially analyzing open questions, is important to identify specific research needs,and to ensure urgent needs for emerging or smaller sectors are not missed.
Newer vs More Experienced Growers: There are some differing research and development needs between newer and more experienced growers, but thedifferences are less apparent than in 2016 when there was a higher proportion of growers who had been involved in thesector for less than 3 years.
Parsing research priorities for sectors: In future surveys it would be helpful to follow-up the survey with one-to-one interviews to clarify the research needs ofdifferent sectors. For example, in this 2019 survey it is possible that different sectors understood “Effluent treatment” indifferent ways. Was it perceived as a question about overboard discharges and opening up shellfish areas, or as treatment ofaquaculture discharges?
Feedback: “I have participated in shared waters class and the island institute boot camp! BothEXCELLENT!”
The difference between research and development: There are differences between research and development that are not easily ascertained for responses to a survey and requireinterpretation. In the context of aquaculture in Maine we are referring to research and development to innovate andintroduce new products and processes, but also this survey has identified topics for sector development (strategies forpromoting economic growth ).
Recommended R&D foci for Cross-Sector Impact:● Research on methodologies for invasive species management,● Research on biofouling control methods,● Research on pest and predator management strategies,● Climate change predictive models with focus on aquaculture production,● Improving understanding of the beneficial impacts of aquaculture on water quality/ ecosystem,● Streamlining distribution
Recommended Sector Development foci:● Accessibility to water quality data,● Development of public information materials for use and dissemination by the entire aquaculture community,● Marketing campaign for Maine farmed seafood,● Market development,● Development of Best Management Practices for shellfish and sea vegetable sectors
CONCLUSIONS and RECOMMENDATIONS

48 Research, Development and Education Priorities
Recommended Education foci:● Training for growers on community relations and communication strategies● Public education strategy ● Career education programs for schools● High school internship program(s)
Recommended R&D foci to maximize impact across the shellfish aquaculture sectors:● Seed collection strategies (sea scallop and mussel growers)● Nursery/hatchery technology(sea scallop and mussel growers)● Shellfish disease research (oyster growers)● Farm/business management strategies to reduce revenue losses caused by biotoxin closures (sea scallop growers)
Recommended R&D foci to maximize impact across the sea vegetable aquaculture sector:● The development of new value-added products (food and non-food)● Processing infrastructure● Regulation
Recommended R&D&E foci to maximize impact across the finfish aquaculture sector:● Sea lice management● Workforce development● Access to capital
The Maine Aquaculture Innovation Center and the University of Maine’s Aquaculture Research Institute (ARI) are thestate’s primary public resources for applied aquaculture research and act as a conduit between academia and aquaculturestakeholders. The ability to respond to stakeholders’ research, education, and training needs using academic-industrypartnerships to resolve aquaculture bottlenecks and challenges are key to the viability and economic growth and output ofthe sector and in creating resilient rural, coastal economies. These biennial surveys and the resulting summits are aninvaluable tool for strengthening these connections.
1. Maine Office of Tourism Annual Report 2018 https://motpartners.com/wp-content/uploads/2019/04/2018_MOT_GovCon_Annual-Report.pdf Accessed November 25th 2019
2. United States Census Bureau https://www.census.gov/quickfacts/ME Accessed November 25th 20193. Per capita personal income in the United States in 2018, by state https://www.statista.com/statistics/303555/us-per-
capita-personal-income/ Accessed November 25th 20194. Cole A., Langston A., & Davis C.V., 2017 Maine Aquaculture Economic Impact Report.
https://umaine.edu/aquaculture/economic-impact-report/5. The Hale Group, 2016 Maine Farmed Shellfish Market Analysis.
REFERENCES

Aquaculture Sector in Maine 49Oyster mesh bags Photo by Anne Langston Noll

TheMaine AquacultureAssociation
Cooke Aquaculture Photo by Emily Tarr