We, the Undersigned, do acknowledge to have received from ...
RESEARCH BRIEF APRIL 2014
Free to Fail or On-Track to College Why Grades Drop When Students Enter High School and What Adults Can Do About It
Todd Rosenkranz, Marisa de la Torre, W. David Stevens, and Elaine M. Allensworth

Acknowledgements
The authors would like to acknowledge the many people who helped make this work possible. We are indebted to the administrators, teachers, and students who generously shared their time and experiences with us. The project would not have been possible without their support. We thank members of the University of Chicago Consortium on Chicago School Research’s Steering Committee who commented on an earlier draft of the report — especially Lila Leff, Karen Lewis, and Amy Treadwell for their valuable insights. Finally we would like to thank members of the UChicago CCSR staff who provided helpful feedback during our writing process. Special thanks goes to the communications staff, Emily Krone, Bronwyn McDaniel, and Jessica Puller, and to Jenny Nagaoka and Molly Gordon for a thorough technical read. The research in this series was supported by the Carnegie Foundation of New York and the National Science Foundation. The work of UChicago CCSR is also supported by the Spencer Foundation.
This report was produced by UChicago CCSR’s publications and communications staff: Emily Krone, Director for Outreach and Communication; Bronwyn McDaniel, Communications and Research Manager; and Jessica Puller, Communications Specialist.
Graphic Design: Jeff Hall Design Photography: Cynthia HoweEditing: Ann Lindner
04.2014/750/[email protected]

1
UCHICAGO CCSR Research Brief | Free to Fail or On-Track to College: Why Grades Drop
SummaryAcross most high schools, students’ attendance and academic effort suffer in the transition to high school, leading to a decline in grades. This puts stu-dents at a disadvantage for high school graduation and for college and career readiness. Schools and teachers have a big role to play in preventing these declines. High school teachers often assume freshmen are ready to take on the responsibility for managing their own academic behavior; students inter-pret their new freedom to mean that attending classes and working hard are choices rather than responsibilities. Systems that monitor student attendance and engagement and strategies that respond to student withdrawal can help reverse the decline in grades in the transition to high school.
CHAPTER 1
Ninth grade is the make-it-or-break-it year for
many high school students. Research has shown
that students who pass their ninth-grade classes
are very likely to graduate from high school—and
those who get mostly As and Bs in ninth grade are
almost guaranteed to do so. At the same time, those
who fail just one or two classes in ninth grade are at
high risk of never graduating. In fact, ninth-grade
performance is a better predictor of who eventually
will graduate from high school than either eighth-
grade test scores or background characteristics
such as gender, race, and economic status.1
Despite the importance of freshman-year grades
for graduation, student course performance drops
markedly during the high school transition. Studies
show that, on average, ninth-grade students attend
fewer days of school, struggle more to stay motivat-
ed, and receive lower marks in classes than they did
in eighth grade.2 These issues are particularly pro-
nounced in urban areas. Overall in Chicago, more
than half of freshmen fail a course, and the average
unweighted freshman GPA is below a C.3
Drops in GPA are worrisome because course
performance is extremely important for future
outcomes. Ninth-grade GPA is an incredibly strong
predictor of high school graduation. High school
GPA is also the strongest predictor of college
graduation—only students who graduate with at
least a B average have a 50 percent chance of earn-
ing a four-year college degree.4 Yet, because grades
drop considerably in ninth grade, very few students
end the ninth-grade year with a B average or bet-
ter.5 Grades do not improve, on average, as students
move through high school.6 Such low course per-
formance leads many students to drop out of school
and have few quality post-secondary opportuni-
ties.7 Few students finish high school with course
grades that indicate they will succeed in college.
Why do students earn lower grades as they
begin high school? How do student behaviors
and school practices contribute to the decline?
And what can schools do to support students
during the transition? A team of researchers at
the University of Chicago Consortium on School
Research (UChicago CCSR) is studying the high
school transition to answer these questions and
to provide schools with evidence that can be used
to craft targeted solutions to improve ninth-grade
course performance. This research brief describes
the extent of the decline in grades and academic
effort as students enter high school in Chicago, as
well as school practices that lead to this decline.
UCHICAGO CCSR Research Brief | Free to Fail or On-Track to College: Why Grades Drop
2
It also highlights promising approaches teachers
and schools have used to address these issues. We
begin in the next section by examining how course
grades change across the high school transition.
KEY FINDINGS:
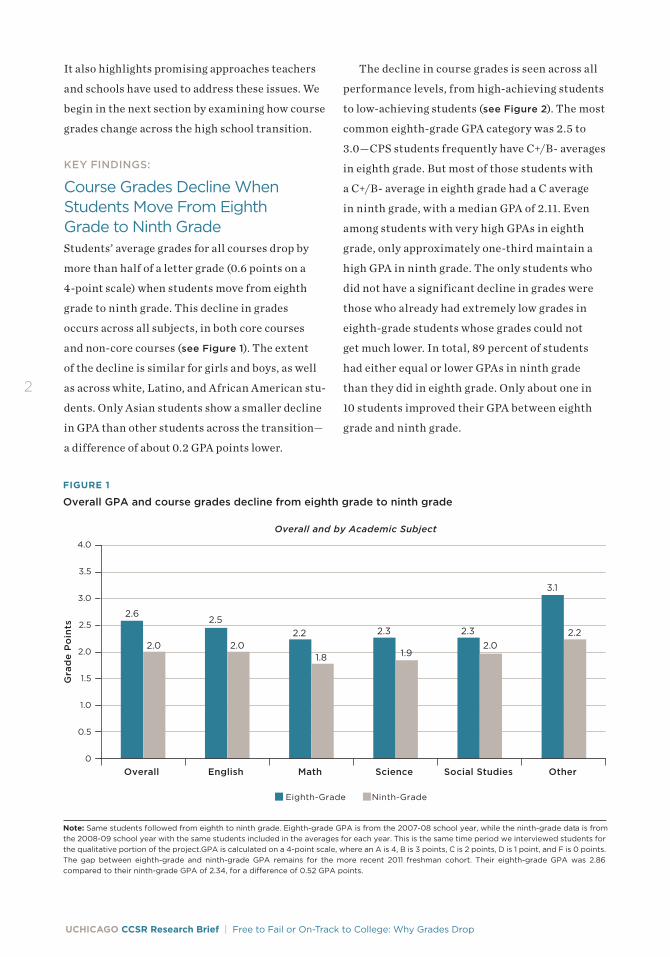
Course Grades Decline When Students Move From Eighth Grade to Ninth GradeStudents’ average grades for all courses drop by
more than half of a letter grade (0.6 points on a
4-point scale) when students move from eighth
grade to ninth grade. This decline in grades
occurs across all subjects, in both core courses
and non-core courses (see Figure 1). The extent
of the decline is similar for girls and boys, as well
as across white, Latino, and African American stu-
dents. Only Asian students show a smaller decline
in GPA than other students across the transition—
a difference of about 0.2 GPA points lower.
The decline in course grades is seen across all
performance levels, from high-achieving students
to low-achieving students (see Figure 2). The most
common eighth-grade GPA category was 2.5 to
3.0—CPS students frequently have C+/B- averages
in eighth grade. But most of those students with
a C+/B- average in eighth grade had a C average
in ninth grade, with a median GPA of 2.11. Even
among students with very high GPAs in eighth
grade, only approximately one-third maintain a
high GPA in ninth grade. The only students who
did not have a significant decline in grades were
those who already had extremely low grades in
eighth-grade students whose grades could not
get much lower. In total, 89 percent of students
had either equal or lower GPAs in ninth grade
than they did in eighth grade. Only about one in
10 students improved their GPA between eighth
grade and ninth grade.
FIGURE 1
Overall GPA and course grades decline from eighth grade to ninth grade
Gra
de
Po
ints
2.0
4.0
3.0
1.0
2.5
3.5
1.5
0.5
0
Eighth-Grade Ninth-Grade
Overall English Math Science Social Studies Other
2.6
2.0
2.5
2.02.2
1.8
2.3
1.9
2.3
2.0
3.1
2.2
Overall and by Academic Subject
Note: Same students followed from eighth to ninth grade. Eighth-grade GPA is from the 2007-08 school year, while the ninth-grade data is from the 2008-09 school year with the same students included in the averages for each year. This is the same time period we interviewed students for the qualitative portion of the project.GPA is calculated on a 4-point scale, where an A is 4, B is 3 points, C is 2 points, D is 1 point, and F is 0 points. The gap between eighth-grade and ninth-grade GPA remains for the more recent 2011 freshman cohort. Their eighth-grade GPA was 2.86 compared to their ninth-grade GPA of 2.34, for a di�erence of 0.52 GPA points.

3
UCHICAGO CCSR Research Brief | Free to Fail or On-Track to College: Why Grades Drop
Grades Drop, but Not Because the Work is Harder
On average, the work that students are asked to do
in ninth grade is not harder than in eighth grade.
We conducted a longitudinal study of
students, following a sample of eighth-graders
in neighborhood schools to the tenth grade.
Researchers observed students’ English and
math classes each year, documented the tasks
that students were asked to do, and interviewed
students several times each year about those
classes. We also examined students’ responses
on district-wide surveys from 1997 to 2009
that asked students about their classes. We
compared what students said about their classes
in the middle grade years to their responses to
the same questions on surveys they took while
in high school. Both sources of information
showed the same thing—classes were not more
difficult in ninth grade than in middle school for
most students. In fact, students reported that
ninth grade was less academically demanding
than middle school. Another brief in the Free
to Fail series, Classroom Instruction Across
the Transition to High School provides more
information on these patterns.
FIGURE 2
GPA declines regardless of the level of eighth-grade GPA
GP
A P
oin
ts
2.0
4.0
3.0
1.0
2.5
3.5
1.5
0.5
0
Eighth-Grade GPA Ninth-Grade GPA
4.0-3.5 3.5-3.0 3.0-2.5 2.5-2.0 2.0-1.5 1.5-1.0 1.0-0.5 0.5-0.0
Distribution of Ninth-Grade Course Grades by Students’ Eighth-Grade Course Grades
Grade 8 GPA
Note: Same students followed from eighth to ninth grade. The eighth-grade GPA categories are from the 2007-08 school year, while the ninth- grade data is from the 2008-09 school year with the same students included in the analysis for each year. GPA is calculated on a 4-point scale where an A is 4 points, B is 3 points, C is 2 points, D is 1 point, and F is 0 points.
How to Read This Graph
This figure shows the distribution of eighth- and
ninth-grade GPA based on students’ eighth-grade
GPA. The figure is divided into eight groups based
on students’ eighth-grade GPA. For each group, the
blue outline represents the range of the eighth-grade
GPAs while the solid box shows the GPA distribution
in ninth grade for those same students.
GP
A P
oin
ts
2.0
4.0
3.0
1.0
2.5
3.5
1.5
0.5
0Eighth-Grade GPA Ninth-Grade GPA
95th Percentile
5th Percentile
75th Percentile
25th Percentile
Eighth-Grade Performance Range
Ninth-Grade Performance Distibution

UCHICAGO CCSR Research Brief | Free to Fail or On-Track to College: Why Grades Drop
4
Attendance and Study Habits Decline From Eighth to Ninth GradeDoing well in school requires that students put
forth consistent academic effort. Numerous
studies across the country have shown that time
spent on homework is strongly associated with
students’ grades.8 The 2007 UChicago CCSR
report, What Matters for Staying On-Track and
Graduating in Chicago Public Schools, found that
student academic behaviors such as attendance
and studying are far more important in determin-
ing whether ninth-graders pass their classes than
student background characteristics (e.g., race,
gender, and poverty) when entering high school.9
In fact, strong effort can help students entering
high school with low test scores outperform their
higher-achieving peers who display weak effort.10
As students move into high school, attendance
and study habits significantly decline. Students miss
almost three times as many days of school in ninth
grade as in eighth grade (see Figure 3). This increase
is primarily driven by an explosion in the number of
unexcused absences, which is nearly four times larger
in ninth grade than in eighth grade. In 2008-09, the
typical ninth-grader missed 27 days of school, with
21.4 of those days due to unexcused absences.11
Not only do students miss more classes in high
school than middle school, but they also report
putting in less effort. We asked the 2008-09 ninth-
grade cohort survey questions about whether they
study for tests, regularly set aside time to study,
and place studying ahead of socializing. They
answered the same questions two years earlier,
WE DEFINE ACADEMIC EFFORT AS:
• Attending Classes
• Paying Attention in Class
• Participating in Class
• Completing Homework
• Seeking Help When Needed
• Studying
Nu
mb
er o
f D
ays
Ab
sen
t
20
30
10
25
15
5
0
Excused Absences Unexcused Absences
FIGURE 3
Unexcused absences quadruple in ninth grade compared to eighth grade
Average Number of Days Absent in Eighth and Ninth Grade (Total, Excused, and Unexcused)
Eighth Grade Ninth Grade
10.5
5.5
5.0
27.0
21.4
5.6
Note: Same students followed from eighth to ninth grade. Eighth-grade absences are from the 2007-08 school year, while the ninth-grade data is from the 2008-09 school year; the same students were included in both years.
on a survey given in the spring of 2007, when
they were in seventh grade. As shown in Table 1,
students were slightly less likely to strongly agree
with a question about whether they set aside
time for homework and studying in ninth grade
than they reported two years earlier when they
were in seventh grade (13 percent compared to 16
percent).12 They also were slightly less likely to
strongly agree with a question about whether they
try hard on their schoolwork, even if they find it
boring (18 percent compared to 27 percent).

5
UCHICAGO CCSR Research Brief | Free to Fail or On-Track to College: Why Grades Drop
Declines in Academic Effort Explain the Decline in Grades Grades plummeted in large part because effort
(see blue box on p.4) declined substantially
across the transition. On average, students’ grades
in English and math drop by just under a half of
a GPA point from eighth to ninth grade (0.45 in
English and 0.40 in math). By far, the largest factor
contributing to changes in GPA is the number of
days missed from school (see Figure 4). Absences
explain three-fourths of the drop in English and
math grades (72 percent in English and 78 percent
in math). When combined with differences in
study habits, which also decline from eighth to
ninth grade, about 90 percent of the difference
in GPA points is explained. Other factors, such as
students’ prior test scores and race/ethnicity, had
no relationship with the decline. This suggests
that if students had shown up and worked as hard
in ninth grade as they did in eighth grade, their
grades would likely have remained the same
across the transition to high school.
Less Adult Monitoring at School Makes It Possible For Students to Reduce EffortThrough our qualitative work (see How We
Studied the High School Transition on p.12), we
found adult monitoring declines precipitously
across the transition, making it easier for students
to miss classes and reduce their study effort in
TABLE 1
Student responses in high school about studying are less positive than their responses to the same questions when they were in middle school
Percent of Students Answering “Strongly Agree”
In Middle School In High School
Set aside time for homework and studying 16% 13%
Try hard on schoolwork, even if it is boring 27% 18%
When need to study, do not go out with friends 17% 12%
Always study for tests 13% 10%
Note: Data from the middle school year come from the 2007 survey, while the high school data come from the 2009 survey. The figures are based only on students who answered the survey questions in both years.
high school. When reflecting on their eighth-grade
experiences, ninth-grade students described
how adults in the school tightly regulated their
in-school behavior in middle school. For instance,
students often recounted “walking the line”—
going to class, lunch, or the restroom in groups
GP
A P
oin
ts 0.3
0.5
0.1
0.4
0.2
0
Explained by Di�erences in Background and Test Scores
Explained by Di�erences in Study Habits
Explained by Di�erences in Absences
Unexplained
FIGURE 4
Declines in grades are explained by the increase in absences
Gap in GPA Between Middle Grades and Ninth Grade, and Which Variables Account For It
Gap in English GPA Gap in Math GPA
72%
12%
14%
0.40
78%
8%
13%
0.45
Between Middle Grades and Ninth Grade
Note: Analysis is based on eighth- and ninth-grade students in the 2008-09 school year who answered CCSR surveys in the spring of 2009. GPA is calculated on a 4-point scale where an A is 4 points, B is 3 points, C is 2 points, D is 1 point, and an F is 0 points. The GPA di�erence in this figure is not the same as the GPA di�erence in Figure 2 because this is a di�erent group of students (survey respondents).

UCHICAGO CCSR Research Brief | Free to Fail or On-Track to College: Why Grades Drop
6
with adult supervision. If they wanted to travel
in the school outside of a supervised group, they
needed to get adult permission. Overall, students
described elementary school as having many
explicit rules. As one student griped, “[In eighth
grade] you need to ask permission to do everything.”
These student reflections match researchers’
observations of students’ experiences in middle
school, where many students were in self-con-
tained classrooms or moved to different classes as
a supervised group.
In contrast, what immediately struck students
about high school was the latitude they were given
to travel through the school building independent-
ly. “We get to go to our classes, like by ourselves,”
one student shared, “and it’s cool.” Another stu-
dent said, “There’s more freedom at [high] school.
Like for lunch you can actually go out for lunch and
go to the library. Or go to the computer lab and use
the computers. You’re on your own.” High school
affords students a degree of physical autonomy
not experienced in eighth grade. Virtually every
student appreciated the new freedom and inde-
pendence when they entered high school as it
made them feel more like a young adult.
With less adult monitoring, however, it became
easier for students to do what was virtually impos-
sible in eighth grade: skip class. Students pointed
out that with so many students in the building,
it is hard for adults to tell where any one student
should be at a given time. As a result, it takes little
effort to skip class for other activities: “[In ninth
grade] the security guards are not like ‘Go to class!
Go to class!’ If you want to just go to the library or
something, just chill in the hallway and they’ll think
you’re probably on lunch or something.”
The decrease in behavioral management,
and the ease with which students could miss
class, changed how students thought about class
attendance. Whereas in eighth-grade attendance
was considered an enforced obligation, in ninth
grade it became a choice—something individual
students chose to do, or not to do, based on
personal motivation and interest:
In [elementary school]…you still walk
around in groups, you walk in a line.
In [high school] you just walk. It’s
your choice to go to lunch or English
or all those classes. In [elementary
school] you gotta go to all those
classes. You get a choice in [high
school]…It’s more free.
[In ninth grade] you have a choice either
to go to class or you don’t go to class,
and nobody’s going to be on you to go
to your classes in high school. But in
[eighth grade] you can’t do nothing,
you just go to class and that’s it.
The reduction in monitoring goes beyond whether
students go to class. Students also reported that
teachers no longer “made” them do their classwork
in ninth grade. Instead, they were now responsible
for motivating themselves to pay attention and
complete assignments. As one student explained:
[The biggest difference between
teachers in high school and elementary
school] is that teachers in eighth grade
pushed us more to work and stuff like
that. And they were always, like, on
us to do our work, do our work, do
our work. And then [in ninth grade],
they’re like, ‘You know what, we try
our best to tell you guys do your work.
You guys don’t want to do it, then it’s
up to you guys.’
Students’ perceptions closely mirrored how many
teachers talked about students’ responsibility
for staying on-task. For example, a high school
English teacher remarked that ninth-grade

7
UCHICAGO CCSR Research Brief | Free to Fail or On-Track to College: Why Grades Drop
students are growing up and now need to
realize the repercussions of their actions:
I give them time every day to do the
[class]work. I don’t accept if they come
in the next day and say I didn’t get it,
because it’s their choice. That’s their
part of the responsibility. They have 20
minutes to decide if they want to do
their work and get a good grade or if
they want to mess around. And that’s
ok, so you’re going to take a zero,
that’s your choice.
As these comments illustrate, adults in high school
are less likely to take responsibility for manag-
ing students’ academic behavior than they were in
eighth grade. School staff members no longer either
directly control students’ movement in the building
or make students participate in class and make sure
students complete their homework. Thus, students
move from a school environment where it takes
significant and intentional effort to opt out of learn-
ing routines to one where they must voluntarily opt
into them. Unfortunately, many students respond to
this change by missing more school; they cut back on
studying and on getting their work done.
School and Teacher Practices Make a Difference in the Course Grades Ninth-Graders Receive, Even Among Students With Similar Prior PerformanceIn almost every high school in the city, the average
GPA for students in ninth grade is lower than the
average eighth-grade GPA for those same students.
However, the degree to which they decline varies
greatly across high schools. At some schools, stu-
dents’ ninth-grade grades are not much lower than
they were in eighth grade. At other schools, how-
ever, the average GPA drops by one GPA point or
more from what students received in eighth grade
(see Figure 5); thus, the particular school that a
student attends can make a difference in the degree
to which the course grades of students will drop.
While the decline in GPA for ninth-graders
varies across schools, teacher practices within
schools also matter for the course grades of stu-
dents. Within the same school, students with the
same eighth-grade course grades show a wide vari-
ability in the average ninth-grade course grade by
classroom (see Figure 6). Figure 6 shows the dif-
ference in grades a C student in eighth grade will
get in different classrooms in three neighborhood
high schools which served very similar student
populations in terms of eighth-grade GPA average
(an average of 2.4 GPA points in eighth grade for
their incoming ninth-graders).
Depending on the classroom that students attend
for their ninth-grade classes, the final course grades
can differ by as much as 1.5 GPA points for students
who had a similar incoming GPA from eighth grade.
For example, in School A, students with a C average
in English in eighth grade could get a very low-aver-
age course grade of just above 1.0 in English I in the
fall. In the same school, students with the same
eighth-grade course performance can get almost an
average English I GPA of 2.5 by attending a different
class in the same school. Similar variability is
observed in the algebra classes.
The three schools in the chart, which were
chosen at random, illustrate different possible
patterns. School A shows that the GPA spread
between classroom is almost equal between their
English I classes and their Algebra I classes, but
the average grades for the Algebra I classes are
generally lower than the average grades for the
English I classes. For School B, the GPA spread
is equal but more compact than the spread is for
School A. Unlike School A, the Algebra I classes in
School B generally receive better average grades
than do the English I classes. School C shows that
the GPA spread can be different in the same school
for different subjects, as the spread for English

UCHICAGO CCSR Research Brief | Free to Fail or On-Track to College: Why Grades Drop
8
FIGURE 5
GPAs decline in ninth grade at almost all high schools
Ave
rag
e S
tud
ents
’ GP
A in
Nin
th G
rad
e
2.0
4.0
3.0
1.0
2.5
3.5
1.5
0.5
0
Average GPA in Eighth Grade by Average GPA in Ninth Grade: Averages by High School
Average Students’ GPA in Eighth Grade 2.0 4.03.01.0 2.5 3.51.50.50
Note: Figure 5 shows the average GPA of first-time ninth-grade students in all the non-charter high schools in the system and compares their ninth-grade GPA to their eighth-grade GPA in the prior year, from wherever they attended middle school. Each square represents a high school. The line in the middle is an identity line — at schools on the line, students receive about the same grades in ninth grade as they did in eighth grade. The vast majority of the squares are below the line because ninth-grade GPAs are lower than eighth-grade GPAs for students at almost all high schools. Yet, there are di�erences in the degree to which grades decline across schools, and these di�erences can be quite large.
FIGURE 6
Ninth-grade grades di�er by more than one GPA point across classes, among students with the same eighth-grade GPA
GP
A P
oin
ts 2.0
3.0
1.0
2.5
1.5
0.5
Average Grades in English I and Algebra I Classes for First-time Ninth-Graders in Three High Schools, Adjusted for Prior GPA
School A School B School C
Fall English I Fall Algebra I
Note: Figure 6 shows the average grades in each ninth-grade fall semester English and Algebra I class in three schools serving ninth-graders with similar eighth-grade GPAs. Each diamond represents a classroom in the school with first-time freshmen in 2008-09. The placement of each diamond on the vertical axis shows the average course grade in the classroom, adjusted through statistical models for di�erences that can be attributed to students’ eighth-grade GPA, relative to students with a 2.4 or C average in eighth grade. Adjustments for prior grades come from models that include all first-time ninth-graders in the district (approximately 39,000 students in 2,200 classrooms in 105 schools), not just students in these three schools.

9
UCHICAGO CCSR Research Brief | Free to Fail or On-Track to College: Why Grades Drop
I classes is more compact than is the spread for
Algebra I classes.
In sum, students’ grades are strongly affected
by their high school context, as well as by their ex-
periences in individual classrooms with individual
teachers. The ways that teachers and schools
monitor students and provide instructional
support may help to explain these differences.13
Teacher Support Can Sustain Student Effort and GradesPass rates, grades, and student attendance are
better at schools and classrooms where students
report high levels of student-teacher trust and
teacher support.14
When describing what constitutes support,
students rarely mention emotional support or per-
sonal connections. Instead, three key character-
istics of the most helpful teachers emerged from
their interviews. First, they provide students with
individualized attention around the specific aca-
demic problems with which they are struggling.
Second, supportive teachers monitor students’
work, provide regular updates on their progress,
and inform them of ways to improve their grade.
Finally, they teach material, concepts, and proce-
dures in ways that are clear and understandable;
in the students’ words, they “explain things right,”
and are willing to cover materials several times
and in several ways.
The experiences of Melinda provide a good
example of how supports can change a student’s
trajectory. In eighth grade, Melinda was a C math
student who sometimes struggled to do her work.
She also missed five days of schools during the
year. As a ninth-grader, however, she bucked the
trend, never missing math class during the first
three quarters, receiving a B in algebra, and
describing algebra as her favorite class. When
asked to explain her improvement, Melinda
pointed to her ninth-grade teacher.
Math was so hard for me in eighth
grade because the teacher didn’t
know how to explain things right.
So, I wasn’t learning anything. Now
in ninth grade, algebra is simple
because I have a teacher that teaches
me well. When she puts notes on the
board, she explains the notes word
for word, and she shows us exactly
what we have to do. And if we don’t
understand it, she shows us again so
that we do understand it. She’s not,
like, “Ok, this is what you gotta do,”
and throws a book in your face and
makes you do the work.... She breaks
it down the best she can, and then if
we still don’t get it, she’ll show it to
us a different way so that we do
understand it.
Melinda’s improved instructional experience
and grasp of algebra had two important effects.
First, because the work seemed easier, Melinda
felt more engaged in math:
WE DEFINE TEACHER ACADEMIC SUPPORT AS:
• Clear Explanations
• Regular Updates on Progress
• Help With Specific Academic Problems
These factors emerge as important from both qualitative interviews of students and from quantitative analysis of large scale surveys. See How We Studied the High School Transition on p.12 for a description of the data sources for this research brief.
UCHICAGO CCSR Research Brief | Free to Fail or On-Track to College: Why Grades Drop
10
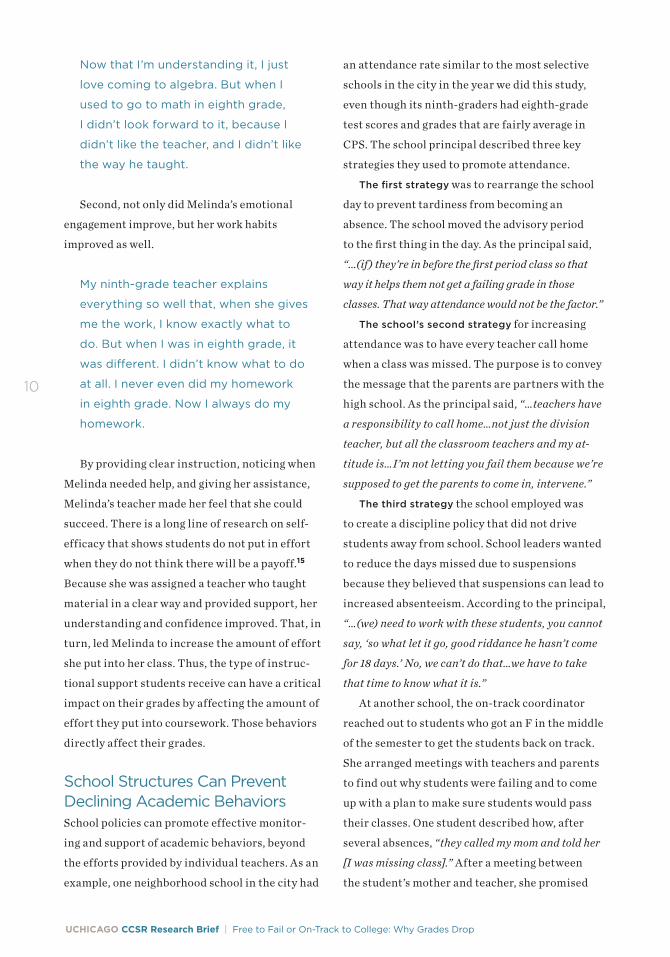
Now that I’m understanding it, I just
love coming to algebra. But when I
used to go to math in eighth grade,
I didn’t look forward to it, because I
didn’t like the teacher, and I didn’t like
the way he taught.
Second, not only did Melinda’s emotional
engagement improve, but her work habits
improved as well.
My ninth-grade teacher explains
everything so well that, when she gives
me the work, I know exactly what to
do. But when I was in eighth grade, it
was different. I didn’t know what to do
at all. I never even did my homework
in eighth grade. Now I always do my
homework.
By providing clear instruction, noticing when
Melinda needed help, and giving her assistance,
Melinda’s teacher made her feel that she could
succeed. There is a long line of research on self-
efficacy that shows students do not put in effort
when they do not think there will be a payoff.15
Because she was assigned a teacher who taught
material in a clear way and provided support, her
understanding and confidence improved. That, in
turn, led Melinda to increase the amount of effort
she put into her class. Thus, the type of instruc-
tional support students receive can have a critical
impact on their grades by affecting the amount of
effort they put into coursework. Those behaviors
directly affect their grades.
School Structures Can Prevent Declining Academic BehaviorsSchool policies can promote effective monitor-
ing and support of academic behaviors, beyond
the efforts provided by individual teachers. As an
example, one neighborhood school in the city had
an attendance rate similar to the most selective
schools in the city in the year we did this study,
even though its ninth-graders had eighth-grade
test scores and grades that are fairly average in
CPS. The school principal described three key
strategies they used to promote attendance.
The first strategy was to rearrange the school
day to prevent tardiness from becoming an
absence. The school moved the advisory period
to the first thing in the day. As the principal said,
“...(if) they’re in before the first period class so that
way it helps them not get a failing grade in those
classes. That way attendance would not be the factor.”
The school’s second strategy for increasing
attendance was to have every teacher call home
when a class was missed. The purpose is to convey
the message that the parents are partners with the
high school. As the principal said, “…teachers have
a responsibility to call home…not just the division
teacher, but all the classroom teachers and my at-
titude is…I’m not letting you fail them because we’re
supposed to get the parents to come in, intervene.”
The third strategy the school employed was
to create a discipline policy that did not drive
students away from school. School leaders wanted
to reduce the days missed due to suspensions
because they believed that suspensions can lead to
increased absenteeism. According to the principal,
“…(we) need to work with these students, you cannot
say, ‘so what let it go, good riddance he hasn’t come
for 18 days.’ No, we can’t do that…we have to take
that time to know what it is.”
At another school, the on-track coordinator
reached out to students who got an F in the middle
of the semester to get the students back on track.
She arranged meetings with teachers and parents
to find out why students were failing and to come
up with a plan to make sure students would pass
their classes. One student described how, after
several absences, “they called my mom and told her
[I was missing class].” After a meeting between
the student’s mother and teacher, she promised

11
UCHICAGO CCSR Research Brief | Free to Fail or On-Track to College: Why Grades Drop
her mom, “I would stop [cutting]. Now I go to class
and do my work. I have an A now.” This school had
grades that were higher compared with schools
serving similar students that particular year.
Grades dropped in ninth grade by about half as
much as typical at this school than at others—
comparing students with similar eighth-grade
grades and test scores.
SummaryLow student effort and declining grades are
school organizational problems. When a large
group of students go from attending class, com-
pleting homework, and receiving good grades
in eighth grade, to skipping class and getting
behind in homework in ninth grade, this signals
that teachers’ practices and school structures
are key contributors to the decline in student
performance. Without strategies for promoting
effort and addressing declines, students are free
to fail just as they start their high school career.
This undermines their chances of graduating four
years later and pursuing a college degree.
Currently, ninth grade is often structured in
such a way that students feel it is their choice to
opt in to academic routines. Coming to class,
turning in homework, and asking for extra help
are all voluntary activities. Many ninth-graders,
however, are not ready to assume complete
responsibility for managing their own academic
behavior. Students interpret the lack of monitor-
ing and adult supervision of their academic behav-
ior to mean that work effort is a choice rather than
a responsibility. Few students report consistently
exerting academic effort, and teachers complain
that their strategies to increase effort—which
often consist solely of encouraging students to
work harder—are not very effective.
Ninth-grade, therefore, can end up sorting
students based on whether they have strong work
habits and supports, rather than helping them devel-
op strong work habits. While we expect 14-year-olds
to take responsibility to get their work done by
themselves, ninth-graders are adolescents juggling
new roles and responsibilities in multiple spheres
of their lives. They need to learn how to manage
their time and effort in school, but schools are not
necessarily set up to teach them how to do this if
they are unable to figure it out on their own. Lucky
students—who are easily self-motivated, have sup-
portive teachers, or have families that are monitoring
their performance—end up succeeding in ninth-
grade classes and are on the path to graduation.
Unfortunately, not all students have these advantages.
Structuring classrooms and academic routines
so students have to opt out of engagement is one
way to minimize declines in academic behaviors
and grades. An example of this can be seen in a
study on early college high schools—small schools
that provide both high school and college classes
to students underrepresented in college. Edmunds
et al. (2012) found that early college students had
better attendance and higher levels of engagement
compared with similar students at other schools,
in large part because the early college high schools
“mandate engagement.” By creating structures,
instructional experiences, relationships, and
supports that make it difficult for students to
disengage from schooling, they increase the
number of students staying in school.
Another way to minimize declines in academic
behaviors is to create monitoring systems for iden-
tifying students who are withdrawing and reach
out before students fall far behind.16 Individual
teachers can closely monitor performance and cre-
ate systems that provide immediate feedback when
students’ grades fall. Some teachers create check-
lists for students to keep track of the work they have
and have not completed. Some update grade reports
weekly or more often, so students know right away
when their grade slips. These practices help teach-
ers identify students for support, and also help
create classrooms where students stay engaged
and are less likely to be off-task.17

UCHICAGO CCSR Research Brief | Free to Fail or On-Track to College: Why Grades Drop
12
While individual teachers can monitor and
intervene with students who are withdrawing,
sometimes students fall through cracks. Schools
can set up centralized data for monitoring stu-
dents so they are not completely reliant on the
efforts of individual teachers. These efforts can
also help individual teachers identify students
who need help. Data reports, such as the CPS
“Freshman Success” reports which flag students
showing signs of failure and poor attendance,
make it easy for teachers and other school staff
to identify students in need of help. At some
schools, teams of teachers meet and develop
strategies for specific students. At others,
counselors bring together teachers, parents, and
students to develop plans for improving students’
attendance and grades. Schools can also use
data to assess how well they are serving differ-
ent groups of students and develop strategies for
supporting students facing similar challenges. In
fact, attendance improved in CPS from an average
of 27 days missed of school in ninth grade to an
average of 20.8 days since the introduction of the
“Freshman Success” report in 2009.
For eighth-grade teachers, preparation for
high school is not just about developing students’
academic skills and making sure they pass tests;
it is also about preparing them for the increased
responsibility of high school. It is difficult to suc-
cessfully prepare students for a new context before
they experience it. But at the very least, students
and their families could be made aware of the
How We Studied the High School Transition
This research brief draws on findings from the
Focus on Freshmen project—a multi-method
study examining factors associated with fresh-
man-year course performance in the Chicago
Public Schools (CPS). The research uses quan-
titative data from district-wide administrative
records, and biennial surveys of all teachers and
students in grades 6-12. It also uses qualitative
data on students and teachers in nine neighbor-
hood schools.
The quantitative analysis is based on all schools in the district that serve eighth and ninth grades. CPS student administrative records
provide data on school enrollment, test scores,
grades, and attendance for students across the
system. In addition, we use survey data from the
UChicagao CCSR biennial district-wide survey
administered to students and teachers. Through
Rasch analysis, different measures of school
climate, academic expectations, and students’
academic effort are created using responses to
different items from the survey.
Quantitative analysis presented here is both
descriptive and based on statistical models that
take into account different student characteris-
tics. Analyses that compare survey measures
over time are based on hierarchical linear models
that take into account the measurement error
and the clustering of the data. These models control
for gender, race/ethnicity, whether students were
old for the grade, whether they were receiving
special education, whether they were classified
as limited English proficient, their test scores, and
yearly dummies in order to estimate the changes
in students’ responses from middle grade to high
school. These analyses used data from surveys from
2007 to 2009. The total number of survey responses
used across this time span was approximately
700,000 student surveys.
Analyses that look into reasons for differences in
grades between the middle grade years and ninth
grade are based on a cross section of students in
those grades in the 2008-09 school year. These
models control for gender, race/ethnicity, whether
students were old for the grade, whether they were
receiving special education, whether they were classi-
fied as limited English proficient, and their test scores.
Also, absences and study habits measures are in the
model to determine how much these variables explain
the differences in grades. The analysis is based on
hierarchical linear models where the clustering of the
data based on the schools students attend is taken into
account. This analysis used the eighth- and ninth-grade
data for approximately 22,000 students who attended
CPS in both their eighth- and ninth-grade years.
13
UCHICAGO CCSR Research Brief | Free to Fail or On-Track to College: Why Grades Drop
changes in expectations around responsibility in
high school and the common pitfalls for students
in the ninth-grade year. Families also have a role
in monitoring students as they transition into high
school to make sure they stay on-track through-
out ninth-grade. This does not mean teachers or
families should take responsibility away from
students, but that adults should monitor students
closely and intervene right away if they fail to meet
expectations around academic behaviors.
In sum, systems that monitor student engage-
ment and proactively respond to withdrawal can
help schools change practices that allow students
to exert minimal academic effort and receive poor
grades. When teachers and school staff reach out
to students to find out why they have missed class
or fallen behind in their work, it shows adults
care about the student as a learner and allows
whatever is keeping the student from engaging
in learning to be addressed. This is a first order
task. If students do not participate in academic
routines, other reforms, such as addressing cur-
ricular rigor or increasing graduation standards,
have little chance of succeeding. When schools
effectively support academic effort, students
respond positively and can even improve on their
eighth-grade performance in high school. As the
old saying goes, “showing up is half the battle.”
Finding ways to support academic effort will go a
long way towards helping students succeed during
the high school transition and stay on the path
towards college.
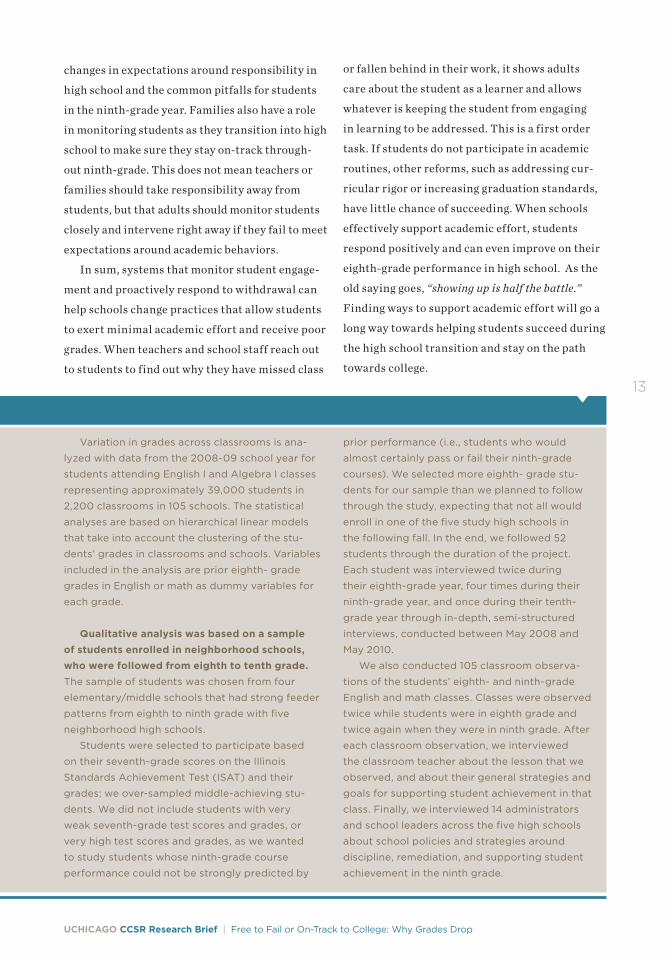
Variation in grades across classrooms is ana-
lyzed with data from the 2008-09 school year for
students attending English I and Algebra I classes
representing approximately 39,000 students in
2,200 classrooms in 105 schools. The statistical
analyses are based on hierarchical linear models
that take into account the clustering of the stu-
dents’ grades in classrooms and schools. Variables
included in the analysis are prior eighth- grade
grades in English or math as dummy variables for
each grade.
Qualitative analysis was based on a sample of students enrolled in neighborhood schools, who were followed from eighth to tenth grade. The sample of students was chosen from four
elementary/middle schools that had strong feeder
patterns from eighth to ninth grade with five
neighborhood high schools.
Students were selected to participate based
on their seventh-grade scores on the Illinois
Standards Achievement Test (ISAT) and their
grades; we over-sampled middle-achieving stu-
dents. We did not include students with very
weak seventh-grade test scores and grades, or
very high test scores and grades, as we wanted
to study students whose ninth-grade course
performance could not be strongly predicted by
prior performance (i.e., students who would
almost certainly pass or fail their ninth-grade
courses). We selected more eighth- grade stu-
dents for our sample than we planned to follow
through the study, expecting that not all would
enroll in one of the five study high schools in
the following fall. In the end, we followed 52
students through the duration of the project.
Each student was interviewed twice during
their eighth-grade year, four times during their
ninth-grade year, and once during their tenth-
grade year through in-depth, semi-structured
interviews, conducted between May 2008 and
May 2010.
We also conducted 105 classroom observa-
tions of the students’ eighth- and ninth-grade
English and math classes. Classes were observed
twice while students were in eighth grade and
twice again when they were in ninth grade. After
each classroom observation, we interviewed
the classroom teacher about the lesson that we
observed, and about their general strategies and
goals for supporting student achievement in that
class. Finally, we interviewed 14 administrators
and school leaders across the five high schools
about school policies and strategies around
discipline, remediation, and supporting student
achievement in the ninth grade.

UCHICAGO CCSR Research Brief | Free to Fail or On-Track to College: Why Grades Drop
14
ReferencesAllensworth, E. (2013)The Use of Ninth Grade Early Warning Indicators to Improve Chicago Schools. Journal of Education for Students Placed at Risk, 18: 68–83.
Allensworth, E. and Easton, J.Q. (2005)The On-Track Indicator as a Predictor of High School Graduation. Chicago, IL: The University of Chicago Consortium on Chicago School Research.
Allensworth, E. and Easton, J.Q. (2007)What Matters for Staying On-Track and Graduating in Chicago Public Schools. Chicago, IL: The University of Chicago Consortium on Chicago School Research.
Allensworth, E., Gwynne J., Stitzel-Pareja, A., Sebastian, J., and Stevens, W.D. (Forthcoming)Free to fail or on-track to college: Setting the stage for academic challenge. Chicago, IL: The University of Chicago Consortium on Chicago School Research.
Benner, A.D. and Graham, S. (2009)The transition to high school as a developmental process among multi-ethnic urban youth. Child Development, 80 (2), 356-376.
Bowen, W.G., Chingos, M.M., and McPherson, M.S. (2009)Crossing the Finish Line: Completing College at America’s Public Universities. Princeton, NJ: Princeton University Press.
Cooper, H., Robinson, J.C., and Patall, E.A. (2006)Does homework improve academic achievement? A synthesis of research, 1987-2003. Review of Educational Research, 76 (1), 1-62.
Eccles, J.S., Lord, S., and Midgely, C. (1991)What are we doing to early adolescents? The im-pact of educational contexts on early adolescents. American Journal of Education, 99 (4), 521-542.
Edmunds, J., Willse, J., Arshavsky, N., and Dallas, A. (2012)Mandated Engagement: The Impact of Early College High Schools. Greensboro, NC: SERVE Center at the University of North Carolina at Greensboro.
Geiser, S. and Santelices, M.V. (2007)Validity of high-school grades in predicting student success beyond the freshman year: High-school record versus standardized tests as indicators or four-year college outcomes. Research & Occasional Paper Series: CSHE.6.07. Berkeley: Center for Studies in Higher Education. Retrieved September 9, 2011, from http://cshe.berkeley.edu/publications/ publications.php?id=265.
Heck, R.H. and Mahoe, R. (2006)Student transition to high school and persistence: Highlighting the influences of social divisions and school contingencies. American Journal of Education, 112, 418-446.
Keith, T.Z. (1982)Time spent on homework and high school grades: A large sample path analysis. Journal of Educational Psychology, 74 (2), 248-253.
Keith, T.Z., Keith, P.B., Troutman, G.C., Bickley, P.G., Trivette, P.S., and Singh, K. (1993)Does parental involvement affect eighth grade stu-dent achievement? Structural analysis of national data. School Psychology Review, 22, 472-494.
Oyserman, D. and James, L. (2009)A possible selves intervention to enhance school involvement. Journal of Adolescence, 25, 313-326.
Peng S.S. and Wright, D. (1994)Explanation of academic achievement of Asian American students. Journal of Educational Research, 87, 346-352.
Reyes, O., Gillock, K., and Kobus, K. (1994)A longitudinal study of school adjustment in urban, minority adolescents: Effects of a high school transition program. American Journal of Community Psychology, 22 (3), 341-369.
Roderick, M. (1993)The path to dropping out: Evidence for intervention.Westport, CT: Auburn House, Greenwood Publishing Group.

15
UCHICAGO CCSR Research Brief | Free to Fail or On-Track to College: Why Grades Drop
Roderick, M. (2003)What’s happening to the boys? Early high school experiences and school outcomes among African American male adolescents in Chicago. Urban Education. 38 (5): 538-607.
Roderick M., Nagaoka, J., and Allensworth, E. (2006)From High School to the Future: A First Look at Chicago Public School Graduates’ College Enrollment, College Preparation, and Graduation from Four Year College. Chicago: The University of Chicago Consortium on Chicago School Research.
Seidman, E., Aber, J.L., LaRue A., and French, S.E. (1996)The impact of the transition to high school on the self-system and perceived social context of poor urban youth. American Journal of Community Psychology, 24 (4), 489-515.
Simmons, R.G. and Blyth, D.A. (1987)Moving into Adolescence: The Impact of Pubertal Change and School Context. New York, NY: DeGruyter.
Weiss, C. and Bearman, P. (2007)Fresh starts: Reinvestigating the effects of the transition to high school on student outcomes. American Journal of Education, 113, 395-421.
Endnotes1 Allensworth and Easton (2005, 2007).
2 Benner and Graham (2009); Eccles et al. (1991); Heck and Mahoe (2006); Reyes et al. (1994); Roderick (1993, 2003); Seidman et al. (1996); Simmons and Blyth (1987); Weiss and Bearman (2007).
3 Allensworth and Easton (2007).
4 Bowen et al. (2009); Geiser and Santelices (2007).
5 Allensworth and Easton (2007).
6 Roderick et al. (2006).
7 Bowen et al. (2009); Heck and Mahoe (2006).
8 Cooper et al. (2006); Keith et al. (1993); Peng and Wright (1994).
9 Allensworth and Easton (2007).
10 Allensworth and Easton (2007); Keith (1982).
11 For this analysis, we show absence data for the academic years that we followed students in our study. Absence rates have improved in recent years, although they still remain high. Ninth- graders in 2010-11 missed an average of 20.8 days of school, compared to 9.0 days in eighth grade.
12 The average student scored 0.21 standard deviation points lower on the study habits measure in ninth grade than in seventh grade.
13 One might explain variation in GPAs across schools as resulting from more lenient or demanding grading practices. There is very little evidence to support this view, however. Grades in Chicago are a more consistent predictor of college graduation than college examination scores. Roderick et al. (2006). In addition, there is no evidence that average school GPAs are associated with the average school achievement levels. In fact, students across the district struggle to receive As and Bs (Allensworth and Easton 2005).
14 Allensworth and Easton (2007); Allensworth et al. (Forthcoming).
15 Oyserman and James (2009).
16 Allensworth (2013)
17 See Allensworth et al. (Forthcoming) for further details of teaching practices that support student engagement.

16
TODD ROSENKRANZ is Data Archivist and Deputy Psychometrician at the Consortium on Chicago School Research. Prior to joining UChicago CCSR, he worked as a Research Analyst at the Chicago Urban League and as a Senior Budget Analyst at the Chicago Panel on School Policy. He received his BA in political science and public affairs from the University of Denver and his MA in public policy from the Harris School of Public Policy at the University of Chicago.
MARISA DE LA TORRE is the Director for Internal Research Capacity at UChicago CCSR. Part of her work involves studying Chicago Public Schools’ policies aimed at the lowest-performing schools in the district. In this area she studies small school reforms, school closing, and turnaround schools. She also conducts research in the area of student mobility, high school choice, and middle grade indicators of high school success. Before joining UChicago CCSR, she worked for the CPS Office of Research, Evaluation, and Accountability. She received a master’s degree in economics from Northwestern University.
W. DAVID STEVENS is Director of Research Engage-ment at UChicago CCSR. Stevens’ responsibilities include developing trainings and workshops for helping practitioners, policymakers, and school
districts understand UChicago CCSR’s research findings and use them in their daily practice. Stevens also leads national engagement activities, working with individuals and organizations interested in reproducing UChicago CCSR’s model of education research. Stevens’ research interests include high school reform, teacher development, and student engagement. He is currently co-principal investigator on a mixed-methods study of the transition to high school and a study of teacher evaluation systems in Illinois. Stevens received his PhD in sociology from Northwestern University.
ELAINE M. ALLENSWORTH is the Lewis-Sebring Director at UChicago CCSR where she has conducted research on educational policy for the last 15 years. She is best known for her studies of high school graduation and college readiness, and also conducts research in the areas of school leadership and school organization. Her work on early indicators of high school gradua-tion has been adopted for tracking systems used in Chicago and other districts across the country. She is one of the authors of the book Organizing Schools for Improvement: Lessons from Chicago, which provides a detailed analysis of school practices and commu-nity conditions that promote school improvement. Dr. Allensworth holds a PhD in Sociology and an MA in urban studies from Michigan State University. She was once a high school Spanish and science teacher.
This report reflects the interpretation of the authors. Although UChicago CCSR’s Steering Committee provided technical advice, no formal endorsement by these individuals, organizations, or the full Consortium should be assumed.
16
ABOUT THE AUTHORS

CONSORTIUM ON CHICAGO SCHOOL RESEARCH
LILA LEFFCo-Chair Umoja Student Development Corporation
KATHLEEN ST. LOUIS CALIENTO Co-Chair Spark, Chicago
Ex-Officio Members
TIMOTHY KNOWLESUrban Education Institute
Institutional Members
JOHN R. BARKERChicago Public Schools
CLARICE BERRYChicago Principals and Administrators Association
AARTI DHUPELIAChicago Public Schools
CHRISTOPHER KOCHIllinois State Board of Education
KAREN G.J. LEWISChicago Teachers Union
SHERRY J. ULERYChicago Public Schools
Individual Members
VERONICA ANDERSON Communications Consultant
JOANNA BROWNLogan Square Neighborhood Association
ANDREW BROYIllinois Network of Charter Schools
RAQUEL FARMER-HINTONUniversity of Wisconsin, Milwaukee
REYNA HERNANDEZIllinois State Board of Education
CHRIS JONESStephen T. Mather High School
DENNIS LACEWELLUrban Prep Charter Academy for Young Men
RUANDA GARTH MCCULLOUGHLoyola University, Chicago
LUISIANA MELÉNDEZErikson Institute
LISA SCRUGGSDuane Morris LLP
LUIS R. SORIAChicago Public Schools
BRIAN SPITTLEDePaul University
MATTHEW STAGNERMathematica Policy Research
AMY TREADWELLChicago New Teacher Center
ERIN UNANDERAl Raby High School
ARIE J. VAN DER PLOEG American Institutes for Research (Retired)
KIM ZALENTBusiness and Professional People for the Public Interest
DirectorsELAINE M. ALLENSWORTHLewis-Sebring DirectorConsortium on Chicago School Research
JENNY NAGAOKADeputy DirectorConsortium on Chicago School Research
MELISSA RODERICKSenior DirectorConsortium on Chicago School Research Hermon Dunlap Smith ProfessorSchool of Social Service AdministrationUniversity of Chicago
PENNY BENDER SEBRINGFounding Director Consortium on Chicago School Research
Steering Committee

OUR MISSION The University of Chicago Consortium on Chicago School Research (UChicago CCSR) conducts research of high technical quality that can inform and assess policy and practice in the Chicago Public Schools. We seek to expand communication among researchers, policymakers, and practitioners as we support the search for solutions to the problems of school reform. UChicago CCSR encourages the use of research in policy action and improvement of practice, but does not argue for particular policies or programs. Rather, we help to build capacity for school reform by identifying what matters for student success and school improvement, creating critical indicators to chart progress, and conducting theory-driven evaluation to identify how programs and policies are working.
1313 East 60th Street
Chicago, Illinois 60637
T 773-702-3364
F 773-702-2010
ccsr.uchicago.edu
9 780989 799416
50995>ISBN 978-0-9897994-1-6