Research at the San Diego Supercomputer...
46
SAN DIEGO SUPERCOMPUTER CENTER Research at the San Diego Supercomputer Center Amit Majumdar Data Enabled Scientific Computing Division San Diego Supercomputer Center (SDSC) University of California San Diego XSEDE Tutorial California State University, San Bernardino April 3-4, 2014
Transcript of Research at the San Diego Supercomputer...
SAN DIEGO SUPERCOMPUTER CENTER
Research at the San Diego Supercomputer Center
Amit Majumdar Data Enabled Scientific Computing Division San Diego Supercomputer Center (SDSC)
University of California San Diego
XSEDE Tutorial California State University, San Bernardino
April 3-4, 2014
SAN DIEGO SUPERCOMPUTER CENTER
Introduction
SDSC High Performance Computing Resources Research at SDSC
Summary
SAN DIEGO SUPERCOMPUTER CENTER
Introduction
SAN DIEGO SUPERCOMPUTER CENTER
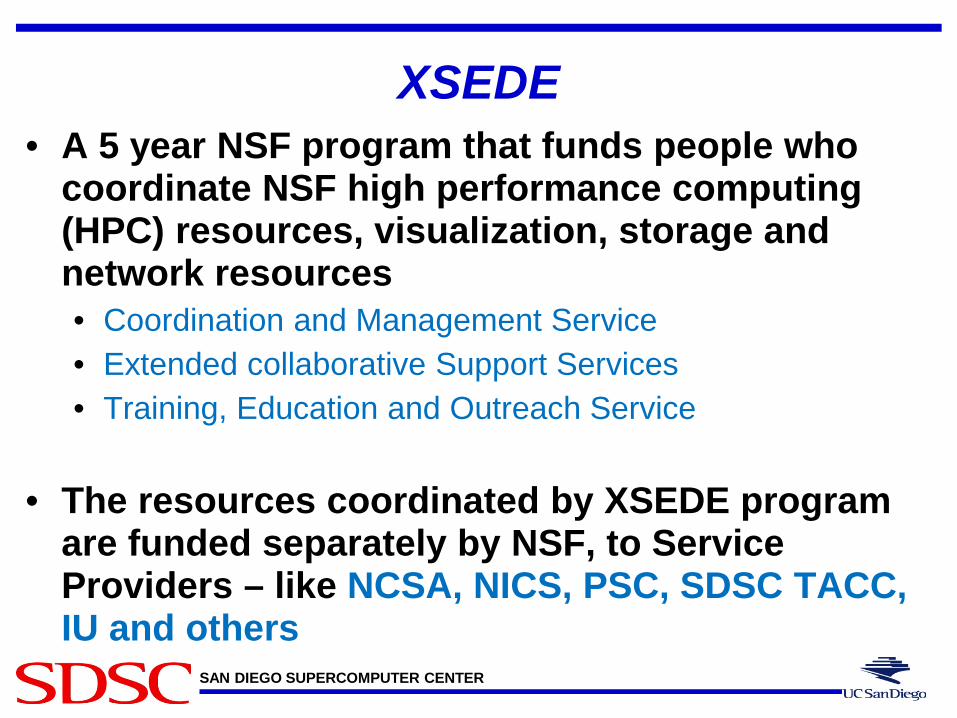
XSEDE • A 5 year NSF program that funds people who
coordinate NSF high performance computing (HPC) resources, visualization, storage and network resources • Coordination and Management Service • Extended collaborative Support Services • Training, Education and Outreach Service
• The resources coordinated by XSEDE program
are funded separately by NSF, to Service Providers – like NCSA, NICS, PSC, SDSC TACC, IU and others
SAN DIEGO SUPERCOMPUTER CENTER
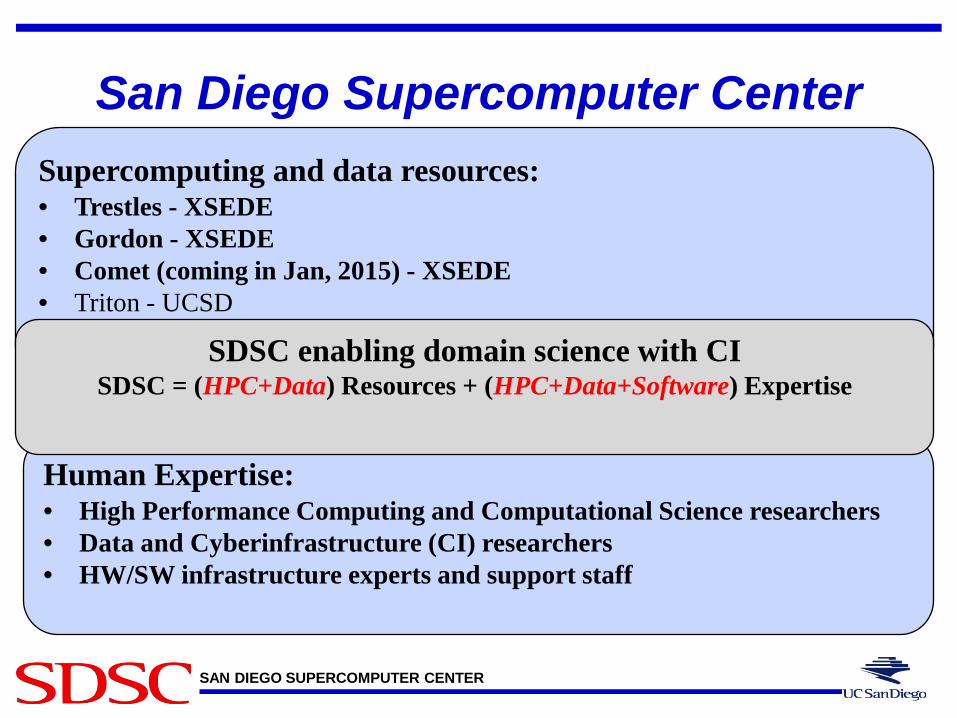
San Diego Supercomputer Center
Supercomputing and data resources: • Trestles - XSEDE • Gordon - XSEDE • Comet (coming in Jan, 2015) - XSEDE • Triton - UCSD
Human Expertise: • High Performance Computing and Computational Science researchers • Data and Cyberinfrastructure (CI) researchers • HW/SW infrastructure experts and support staff
SDSC enabling domain science with CI SDSC = (HPC+Data) Resources + (HPC+Data+Software) Expertise
SAN DIEGO SUPERCOMPUTER CENTER
SDSC High Performance Computing Resources
SAN DIEGO SUPERCOMPUTER CENTER
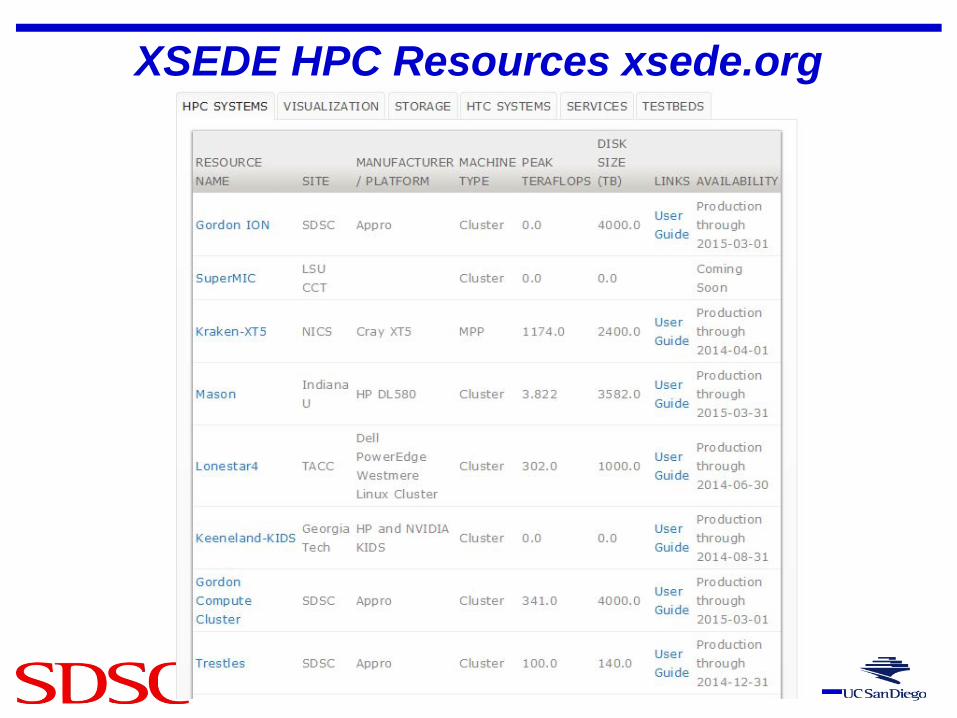
XSEDE HPC Resources xsede.org
SAN DIEGO SUPERCOMPUTER CENTER
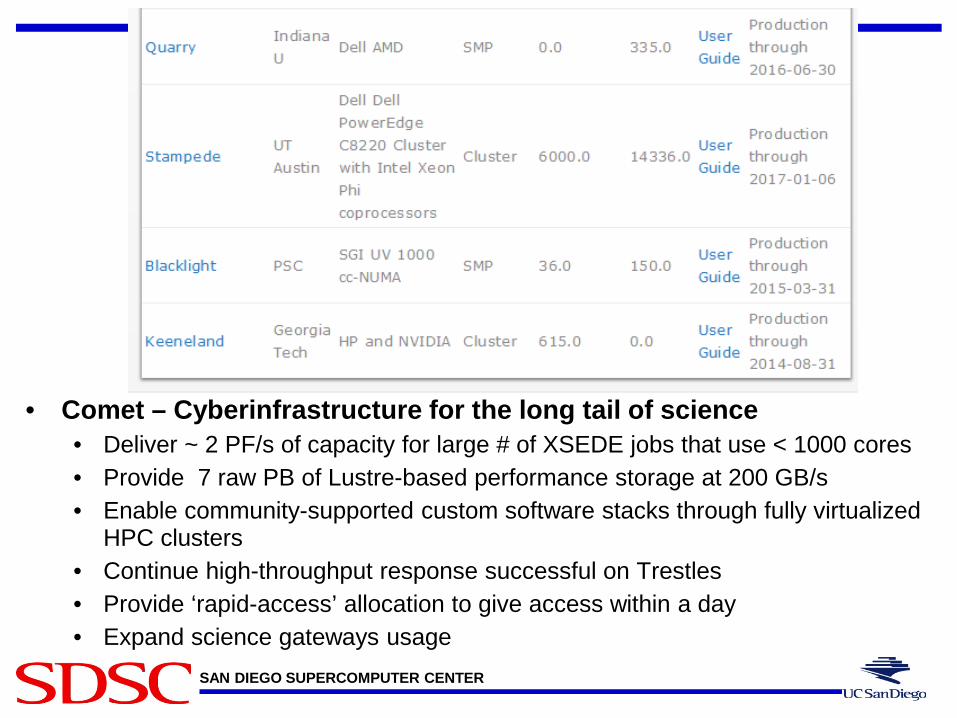
• Comet – Cyberinfrastructure for the long tail of science • Deliver ~ 2 PF/s of capacity for large # of XSEDE jobs that use < 1000 cores • Provide 7 raw PB of Lustre-based performance storage at 200 GB/s • Enable community-supported custom software stacks through fully virtualized
HPC clusters • Continue high-throughput response successful on Trestles • Provide ‘rapid-access’ allocation to give access within a day • Expand science gateways usage
SAN DIEGO SUPERCOMPUTER CENTER
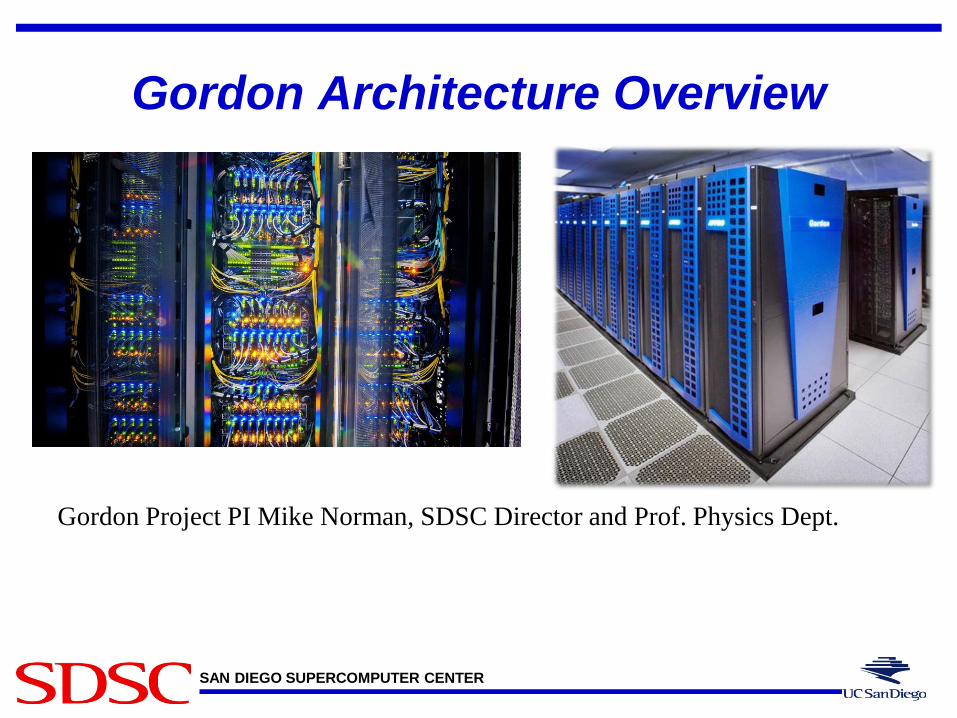
Gordon Architecture Overview
Gordon Project PI Mike Norman, SDSC Director and Prof. Physics Dept.

SAN DIEGO SUPERCOMPUTER CENTER
Gordon – An Innovative Data-Intensive Supercomputer
• Designed to accelerate access to massive amounts of data in areas of genomics, earth science, engineering, medicine, and others
• Emphasizes memory and IO over FLOPS. • Appro integrated 1,024 node Sandy Bridge
cluster • In production operation since February 2012 • Funded by the NSF and available through the
NSF Extreme Science and Engineering Discovery Environment program (XSEDE)
SAN DIEGO SUPERCOMPUTER CENTER
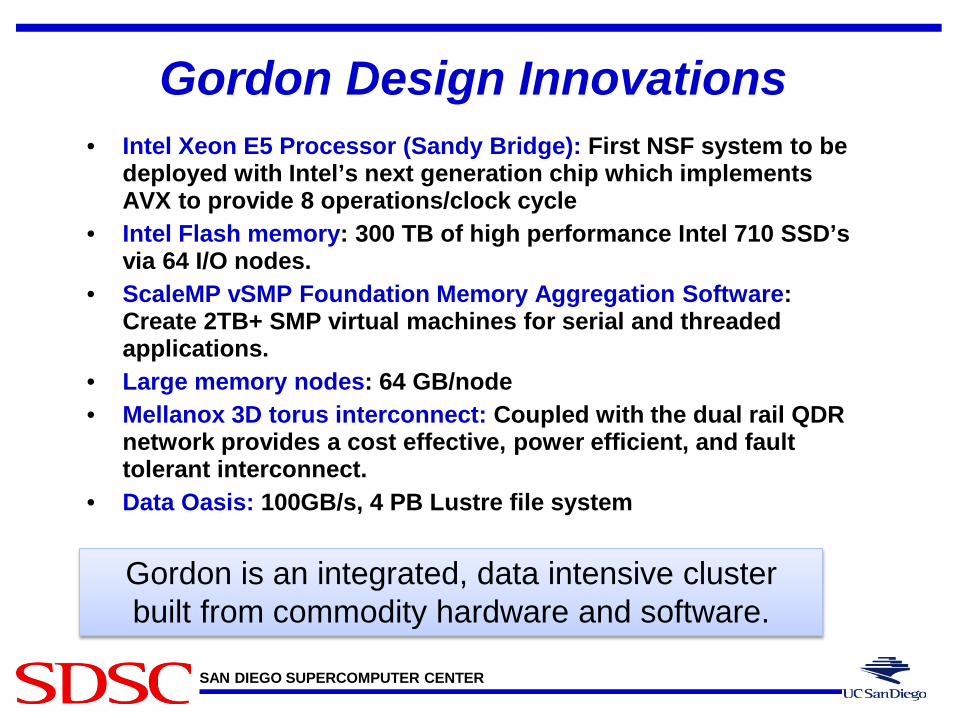
Gordon Design Innovations • Intel Xeon E5 Processor (Sandy Bridge): First NSF system to be
deployed with Intel’s next generation chip which implements AVX to provide 8 operations/clock cycle
• Intel Flash memory: 300 TB of high performance Intel 710 SSD’s via 64 I/O nodes.
• ScaleMP vSMP Foundation Memory Aggregation Software: Create 2TB+ SMP virtual machines for serial and threaded applications.
• Large memory nodes: 64 GB/node • Mellanox 3D torus interconnect: Coupled with the dual rail QDR
network provides a cost effective, power efficient, and fault tolerant interconnect.
• Data Oasis: 100GB/s, 4 PB Lustre file system
Gordon is an integrated, data intensive cluster built from commodity hardware and software.
SAN DIEGO SUPERCOMPUTER CENTER
SDSC HPC - Trestles
SAN DIEGO SUPERCOMPUTER CENTER
SAN DIEGO SUPERCOMPUTER CENTER
Research at SDSC
SAN DIEGO SUPERCOMPUTER CENTER
SDSC – Research Collaboration & Projects • SDSC computational scientists collaborate with domain
scientists from different domains • CFD, astrophysics, biochemistry, geoscience, medical, space physics,
bioinformatics, economics etc. • Science Gateways
• CIPRES (phylogenetics), NSG (neuroscience), etc. • Gateway Software Institute (PI Nancy Wilkins-Diehr)
• SDSC research work and labs • Performance modeling (PMaC lab) • Visualization • Data Analytics (PACE) • Workflows • HPCGeo lab • CyberGIS

SAN DIEGO SUPERCOMPUTER CENTER
Protein Data Bank (dedicated I/O node) The RCSB Protein Data Bank (PDB) is the leading primary database that provides access to the experimentally determined structures of proteins, nucleic acids and complex assemblies. In order to allow users to quickly identify more distant 3D relationships, the PDB provides a pre-calculated set of all possible pairwise 3D protein structure alignments.
Although the pairwise structure comparisons are computationally intensive, the bottleneck is the centralized server that is responsible for assigning work, collecting results and updating the MySQL database. Using a dedicated Gordon I/O node and the associated 16 compute nodes, work could be accomplished 4-6x faster than using the OSG
Configuration Time for 15M alignments speedup
Reference (OSG) 24 hours 1
Lyndonville 6.3 hours 3.8
Taylorsville 4.1 hours 5.8
SAN DIEGO SUPERCOMPUTER CENTER
Real-time reporting UCSD Network Telescope (dedicated I/O node)
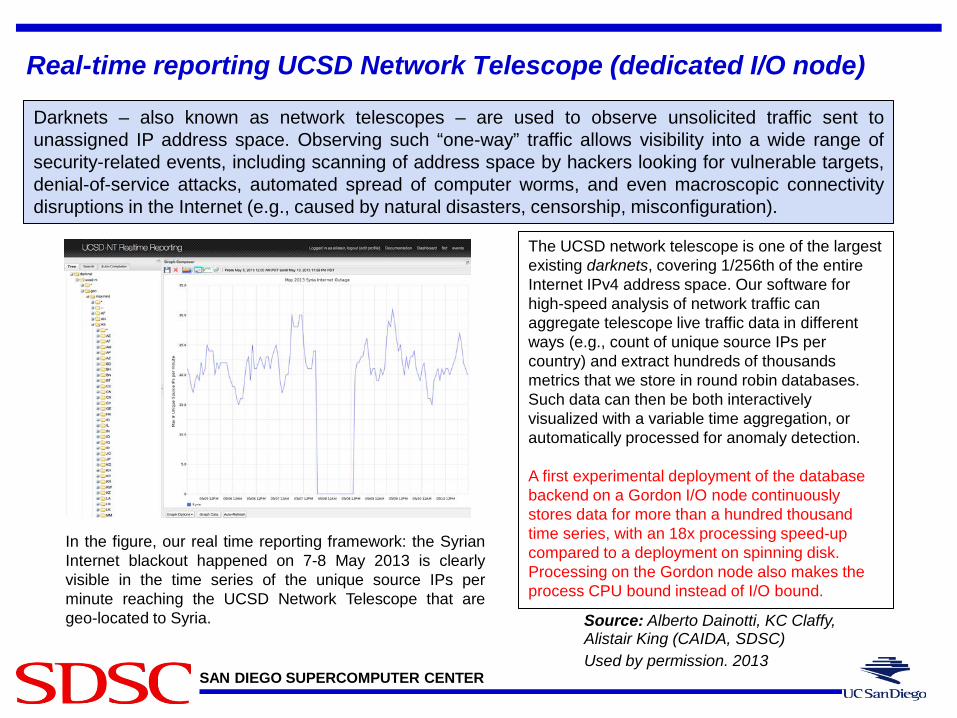
Darknets – also known as network telescopes – are used to observe unsolicited traffic sent to unassigned IP address space. Observing such “one-way” traffic allows visibility into a wide range of security-related events, including scanning of address space by hackers looking for vulnerable targets, denial-of-service attacks, automated spread of computer worms, and even macroscopic connectivity disruptions in the Internet (e.g., caused by natural disasters, censorship, misconfiguration).
The UCSD network telescope is one of the largest existing darknets, covering 1/256th of the entire Internet IPv4 address space. Our software for high-speed analysis of network traffic can aggregate telescope live traffic data in different ways (e.g., count of unique source IPs per country) and extract hundreds of thousands metrics that we store in round robin databases. Such data can then be both interactively visualized with a variable time aggregation, or automatically processed for anomaly detection. A first experimental deployment of the database backend on a Gordon I/O node continuously stores data for more than a hundred thousand time series, with an 18x processing speed-up compared to a deployment on spinning disk. Processing on the Gordon node also makes the process CPU bound instead of I/O bound.
Source: Alberto Dainotti, KC Claffy, Alistair King (CAIDA, SDSC) Used by permission. 2013
In the figure, our real time reporting framework: the Syrian Internet blackout happened on 7-8 May 2013 is clearly visible in the time series of the unique source IPs per minute reaching the UCSD Network Telescope that are geo-located to Syria.
SAN DIEGO SUPERCOMPUTER CENTER
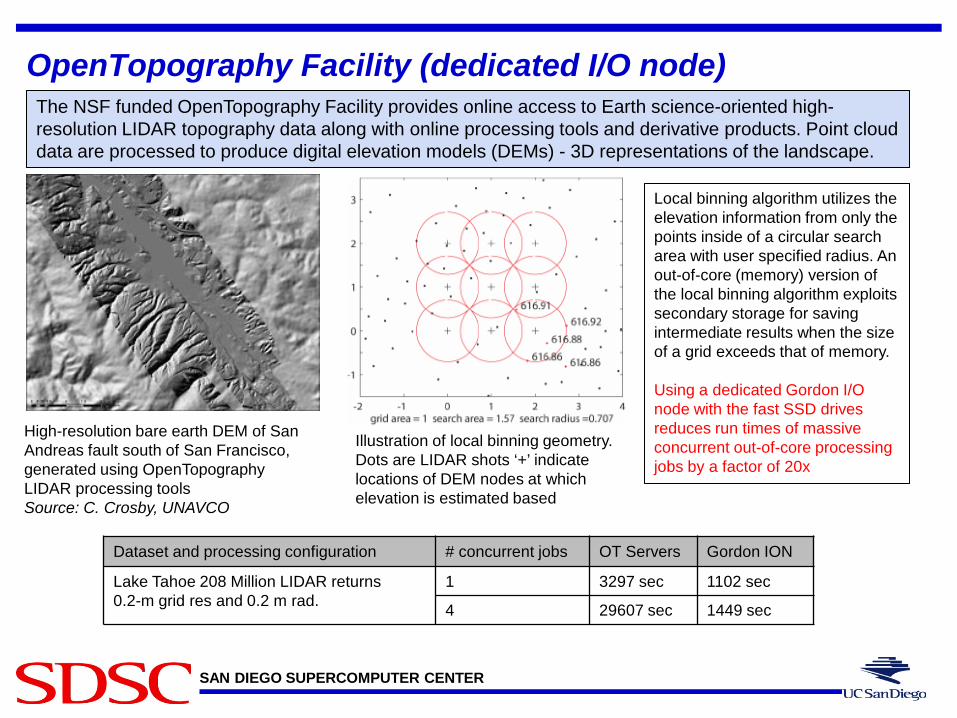
OpenTopography Facility (dedicated I/O node) The NSF funded OpenTopography Facility provides online access to Earth science-oriented high-resolution LIDAR topography data along with online processing tools and derivative products. Point cloud data are processed to produce digital elevation models (DEMs) - 3D representations of the landscape.
High-resolution bare earth DEM of San Andreas fault south of San Francisco, generated using OpenTopography LIDAR processing tools Source: C. Crosby, UNAVCO
Illustration of local binning geometry. Dots are LIDAR shots ‘+’ indicate locations of DEM nodes at which elevation is estimated based
Dataset and processing configuration # concurrent jobs OT Servers Gordon ION
Lake Tahoe 208 Million LIDAR returns 0.2-m grid res and 0.2 m rad.
1 3297 sec 1102 sec
4 29607 sec 1449 sec
Local binning algorithm utilizes the elevation information from only the points inside of a circular search area with user specified radius. An out-of-core (memory) version of the local binning algorithm exploits secondary storage for saving intermediate results when the size of a grid exceeds that of memory. Using a dedicated Gordon I/O node with the fast SSD drives reduces run times of massive concurrent out-of-core processing jobs by a factor of 20x
SAN DIEGO SUPERCOMPUTER CENTER
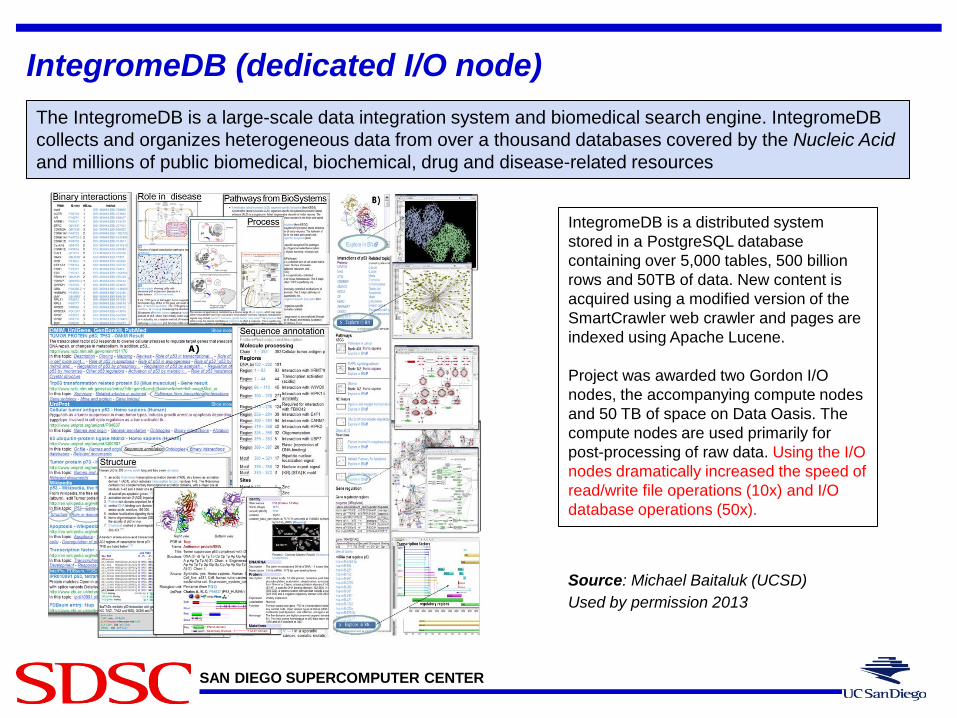
IntegromeDB (dedicated I/O node) The IntegromeDB is a large-scale data integration system and biomedical search engine. IntegromeDB collects and organizes heterogeneous data from over a thousand databases covered by the Nucleic Acid and millions of public biomedical, biochemical, drug and disease-related resources
IntegromeDB is a distributed system stored in a PostgreSQL database containing over 5,000 tables, 500 billion rows and 50TB of data. New content is acquired using a modified version of the SmartCrawler web crawler and pages are indexed using Apache Lucene. Project was awarded two Gordon I/O nodes, the accompanying compute nodes and 50 TB of space on Data Oasis. The compute nodes are used primarily for post-processing of raw data. Using the I/O nodes dramatically increased the speed of read/write file operations (10x) and I/O database operations (50x).
Source: Michael Baitaluk (UCSD) Used by permission 2013

SAN DIEGO SUPERCOMPUTER CENTER
Large-scale pharmacogenomic analysis (SSD) Janssen R&D, a Johnson & Johnson company, has been using whole-genome sequencing in clinical trials of new drug therapies to correlate response or non-response with genetic variants. Janssen has partnered with the Scripps Translational Science Institute (STSI) to perform cutting-edge analyses on hundreds of full human genomes which presents many dimensions of data-intensive challenges.
Each step of the 9-stage read-mapping pipeline had very different resource requirements
To analyze 438 human genomes, this project needed • 16-threads per node and hundreds of nodes to achieve massive
parallelism • at least of 40 GB of RAM per node for some pipeline stages • over 3 TB of flash storage per node via "big flash" nodes at a
metadata-IOPS rate not sustainable by Lustre • over 1.6 TB of input data per node at some pipeline stages • 1 GB/s read rate from Lustre per node
This project accomplished in 5 weeks on Gordon what would have taken 2.5 years of 24/7 compute on a single, 8-core workstation with 32 GB of RAM.
Peak footprint: • 257 TB of Oasis
Scratch • 5,000 cores in
use (30% of Gordon's total capacity)
SAN DIEGO SUPERCOMPUTER CENTER
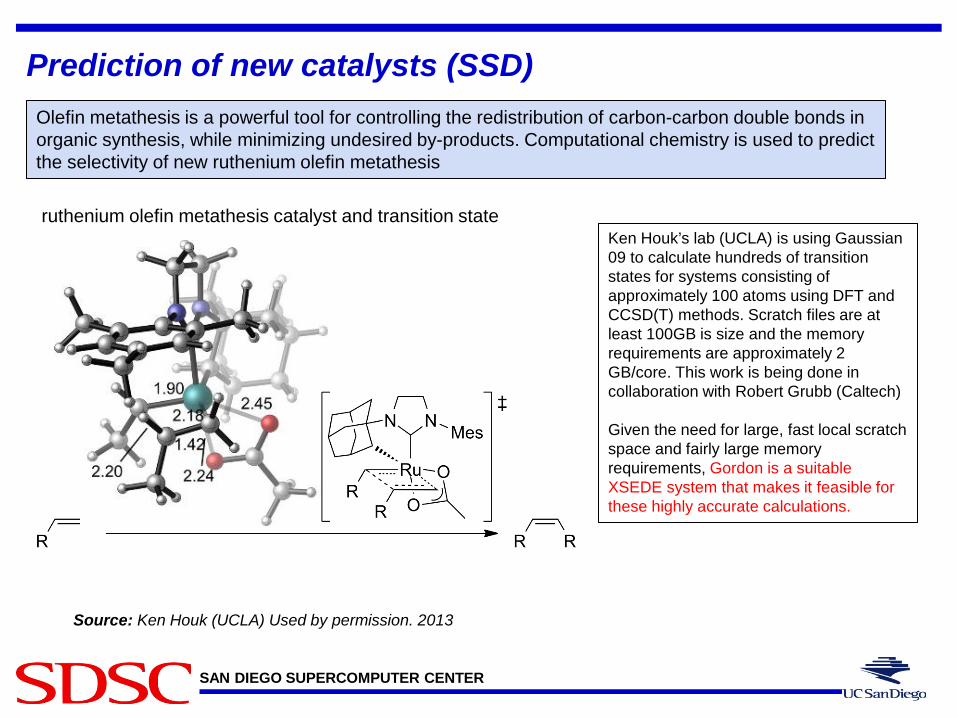
Prediction of new catalysts (SSD)
Source: Ken Houk (UCLA) Used by permission. 2013
Olefin metathesis is a powerful tool for controlling the redistribution of carbon-carbon double bonds in organic synthesis, while minimizing undesired by-products. Computational chemistry is used to predict the selectivity of new ruthenium olefin metathesis
Ken Houk’s lab (UCLA) is using Gaussian 09 to calculate hundreds of transition states for systems consisting of approximately 100 atoms using DFT and CCSD(T) methods. Scratch files are at least 100GB is size and the memory requirements are approximately 2 GB/core. This work is being done in collaboration with Robert Grubb (Caltech) Given the need for large, fast local scratch space and fairly large memory requirements, Gordon is a suitable XSEDE system that makes it feasible for these highly accurate calculations.
ruthenium olefin metathesis catalyst and transition state
SAN DIEGO SUPERCOMPUTER CENTER
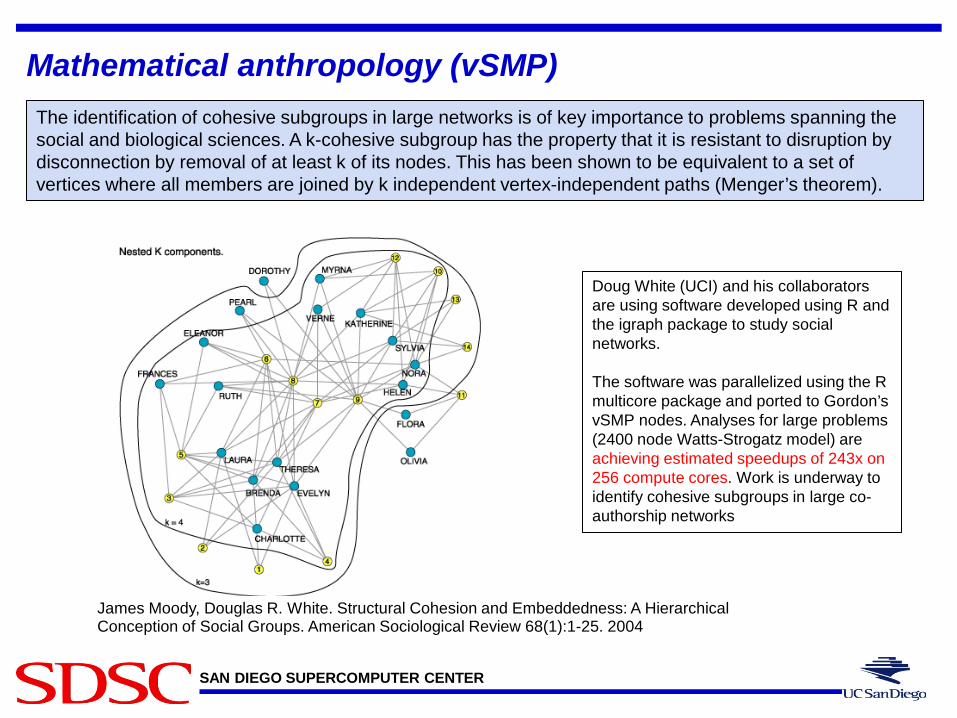
Mathematical anthropology (vSMP)
James Moody, Douglas R. White. Structural Cohesion and Embeddedness: A Hierarchical Conception of Social Groups. American Sociological Review 68(1):1-25. 2004
The identification of cohesive subgroups in large networks is of key importance to problems spanning the social and biological sciences. A k-cohesive subgroup has the property that it is resistant to disruption by disconnection by removal of at least k of its nodes. This has been shown to be equivalent to a set of vertices where all members are joined by k independent vertex-independent paths (Menger’s theorem).
Doug White (UCI) and his collaborators are using software developed using R and the igraph package to study social networks. The software was parallelized using the R multicore package and ported to Gordon’s vSMP nodes. Analyses for large problems (2400 node Watts-Strogatz model) are achieving estimated speedups of 243x on 256 compute cores. Work is underway to identify cohesive subgroups in large co-authorship networks
SAN DIEGO SUPERCOMPUTER CENTER
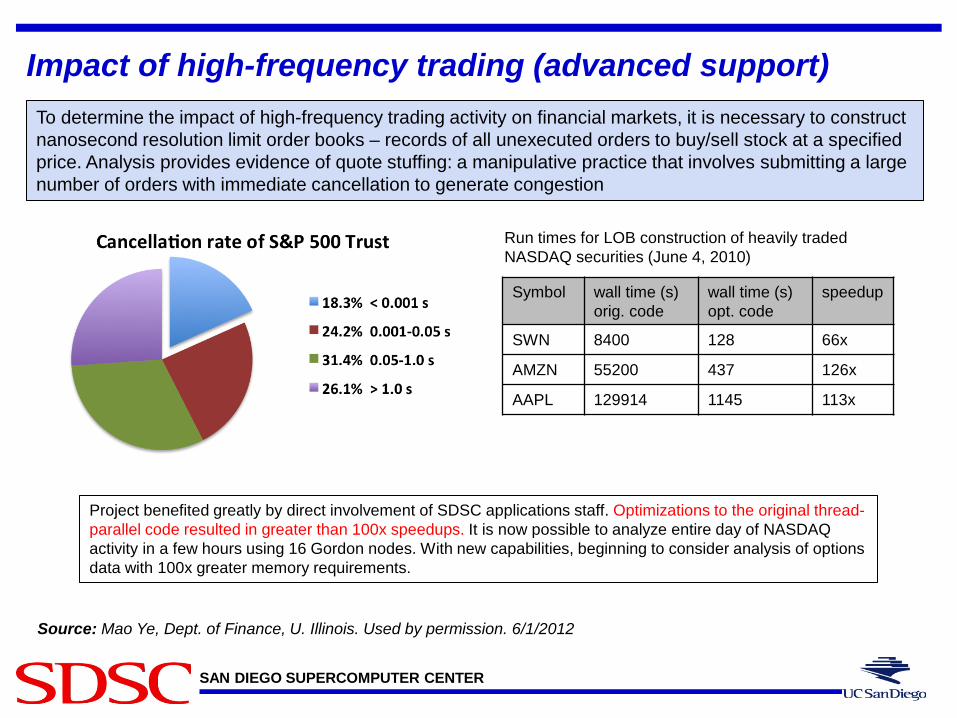
Impact of high-frequency trading (advanced support) To determine the impact of high-frequency trading activity on financial markets, it is necessary to construct nanosecond resolution limit order books – records of all unexecuted orders to buy/sell stock at a specified price. Analysis provides evidence of quote stuffing: a manipulative practice that involves submitting a large number of orders with immediate cancellation to generate congestion
Source: Mao Ye, Dept. of Finance, U. Illinois. Used by permission. 6/1/2012
Symbol wall time (s) orig. code
wall time (s) opt. code
speedup
SWN 8400 128 66x
AMZN 55200 437 126x
AAPL 129914 1145 113x
Project benefited greatly by direct involvement of SDSC applications staff. Optimizations to the original thread-parallel code resulted in greater than 100x speedups. It is now possible to analyze entire day of NASDAQ activity in a few hours using 16 Gordon nodes. With new capabilities, beginning to consider analysis of options data with 100x greater memory requirements.
Run times for LOB construction of heavily traded NASDAQ securities (June 4, 2010)
SAN DIEGO SUPERCOMPUTER CENTER
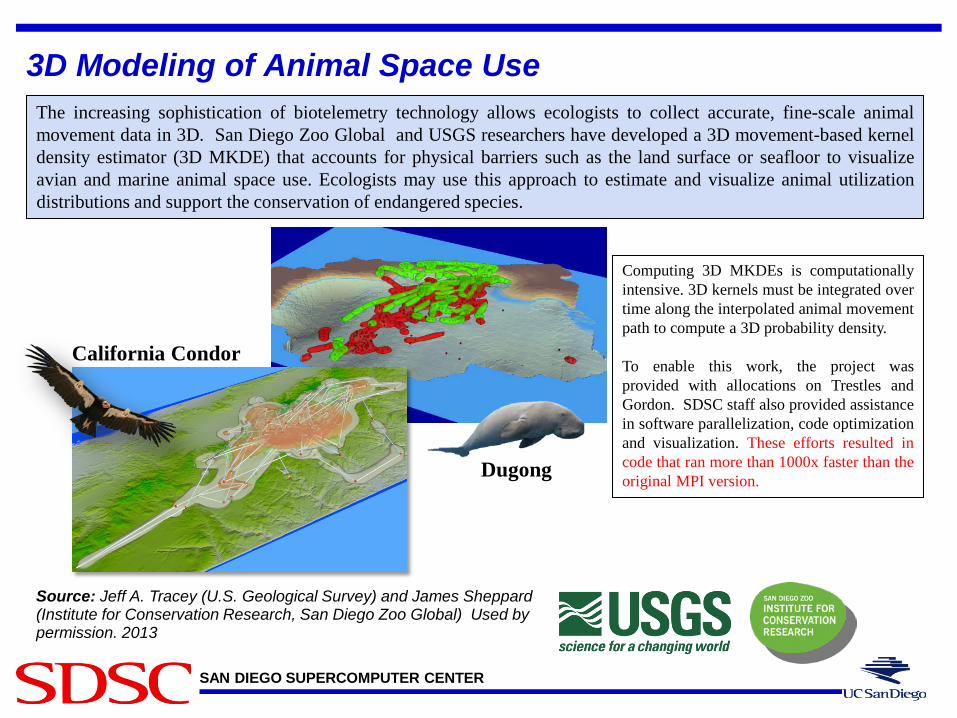
3D Modeling of Animal Space Use
Source: Jeff A. Tracey (U.S. Geological Survey) and James Sheppard (Institute for Conservation Research, San Diego Zoo Global) Used by permission. 2013
The increasing sophistication of biotelemetry technology allows ecologists to collect accurate, fine-scale animal movement data in 3D. San Diego Zoo Global and USGS researchers have developed a 3D movement-based kernel density estimator (3D MKDE) that accounts for physical barriers such as the land surface or seafloor to visualize avian and marine animal space use. Ecologists may use this approach to estimate and visualize animal utilization distributions and support the conservation of endangered species.
Computing 3D MKDEs is computationally intensive. 3D kernels must be integrated over time along the interpolated animal movement path to compute a 3D probability density. To enable this work, the project was provided with allocations on Trestles and Gordon. SDSC staff also provided assistance in software parallelization, code optimization and visualization. These efforts resulted in code that ran more than 1000x faster than the original MPI version.
California Condor
Dugong
SAN DIEGO SUPERCOMPUTER CENTER
Science Gateways • A community infrastructure layer • Provides a set of applications via a customized portal • Specific for researchers from a particular domain • Hides the complexities
• Write peer-reviewed yearly proposals for computer time • Understand HPC machines, policies, complex OS/software • Install and benchmark complex but widely used science applications • Understand, manage remote authentication • Understand/learn batch policies • Figure out data transfer, storage
SAN DIEGO SUPERCOMPUTER CENTER
Example Science Gateways • CIPRES – CI for Phylogenetics RESearch (Mark Miller,
Terri Schwartz, Wayne PfeifferSDSC) – http://www.phylo.org/index.php/portal/ • 8000+ users • RAxML, MrBayes, GARLI, BEAST, MAFT and many other • Provides ~20 million core hours (Service Units) free per year
• NeuroScience Gateway – NSG (Amit Majumdar, Subha Sivagnanam SDSC; Ted Carnevale Yale) – www.nsgportal.org • ~100 users • NEURON, PGENESIS, NEST, PyNN, Brian • Provides ~2 million core hours free
• Similarly many other gateways on bioinformatics, chemistry, CFD, etc. from NICS, NCSA, PSC, IU, Purdue
SAN DIEGO SUPERCOMPUTER CENTER
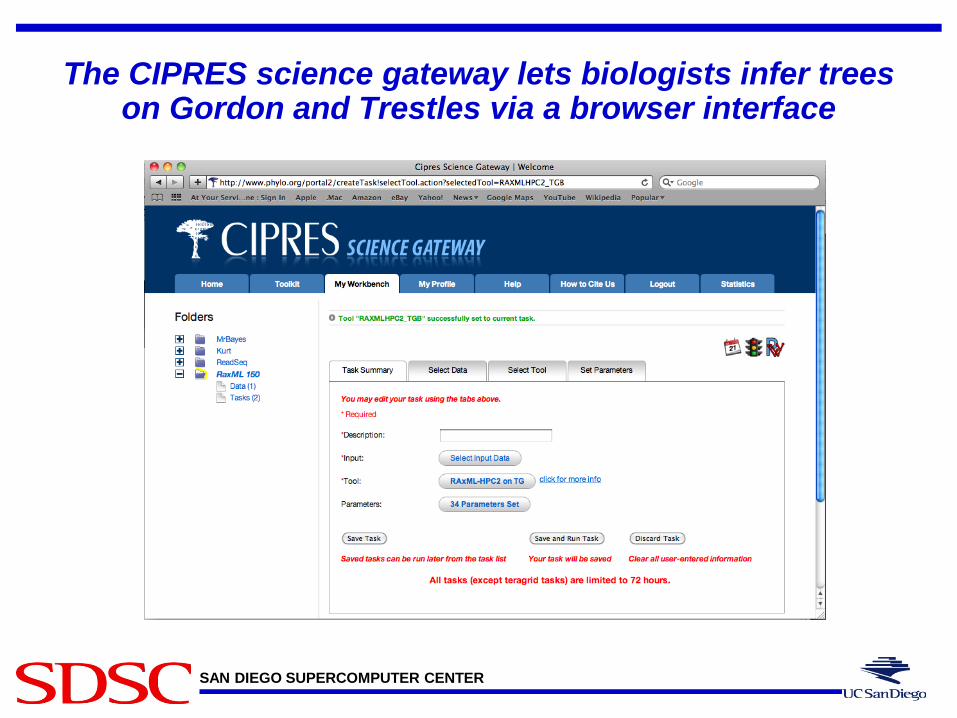
The CIPRES science gateway lets biologists infer trees on Gordon and Trestles via a browser interface
SAN DIEGO SUPERCOMPUTER CENTER
There are many benefits to a browser interface, especially for researchers with little HPC expertise
• Users do not log onto HPC systems & so do not need to learn about Linux, parallelization, or job scheduling
• Users simply use browser interface to • pick code, select options, & set parameters • upload sequence data
• Numbers of cores, processes, & threads are selected automatically based on • input options & parameters • rules developed from benchmarking
• In most cases, users do not need individual allocations • Users still need to understand code options!
SAN DIEGO SUPERCOMPUTER CENTER
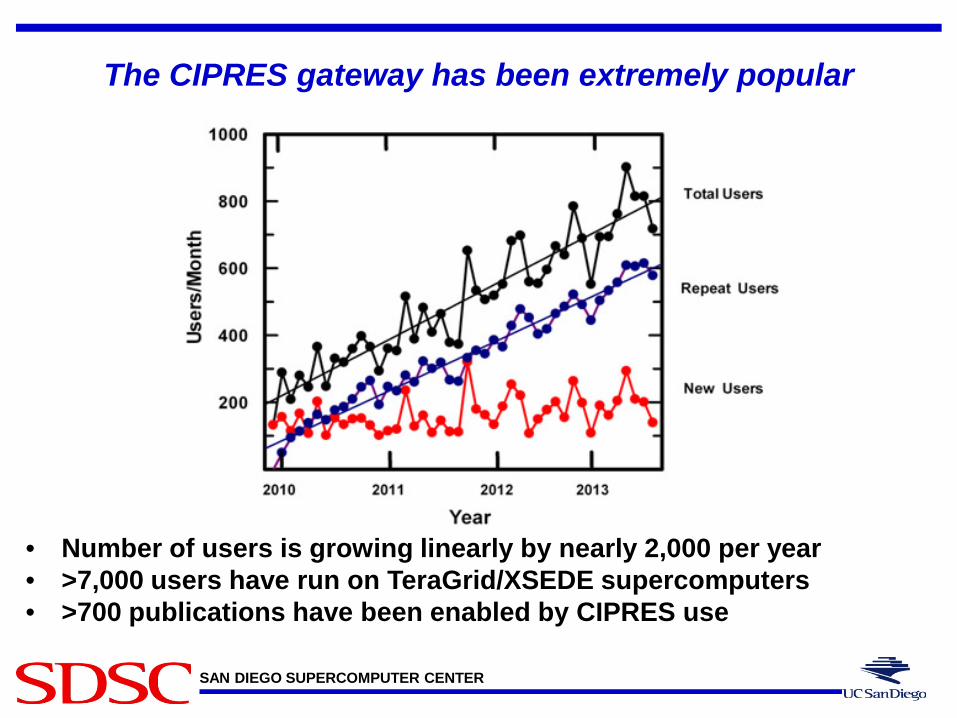
The CIPRES gateway has been extremely popular
• Number of users is growing linearly by nearly 2,000 per year • >7,000 users have run on TeraGrid/XSEDE supercomputers • >700 publications have been enabled by CIPRES use

SAN DIEGO SUPERCOMPUTER CENTER
Performance, Modeling, and Characterization (PMaC) Lab
Laura Carrington, Ph.D
PMaC Lab Director
University of California, San Diego San Diego Supercomputer Center
SAN DIEGO SUPERCOMPUTER CENTER
The PMaC Lab Researching the complex interactions between HPC systems and applications to predict and understand
the factors that affect performance and power on current and future HPC platforms.
Develop tools and techniques to deconstruct HPC systems & HPC applications to provide detailed characterizations of their power and performance.
Develop modeling techniques that combined these characterizations to predict performance and power of HPC systems.
SAN DIEGO SUPERCOMPUTER CENTER
The PMaC Lab Utilize the characterizations to construct power and performance models that guide:
– Improvement of application performance 2 Gordon Bell Finalists, DoD HPCMP Applications, NSF BlueWaters, etc.
– System procurement, acceptance, and installation DoD HPCMP procurement team, DoE upgrade of ORNL Jaguar, installation of NAVO PWR6
– Accelerator assessment for a workload Performance assessment and prediction for GPUs & FPGAs
– Hardware customization/ Hardware-Software co-design Performance and power analysis for Exascale
– Improvement of energy efficiency and resiliency Green Queue Project, DoE SUPER Institute, DoE BSM, etc.
SAN DIEGO SUPERCOMPUTER CENTER
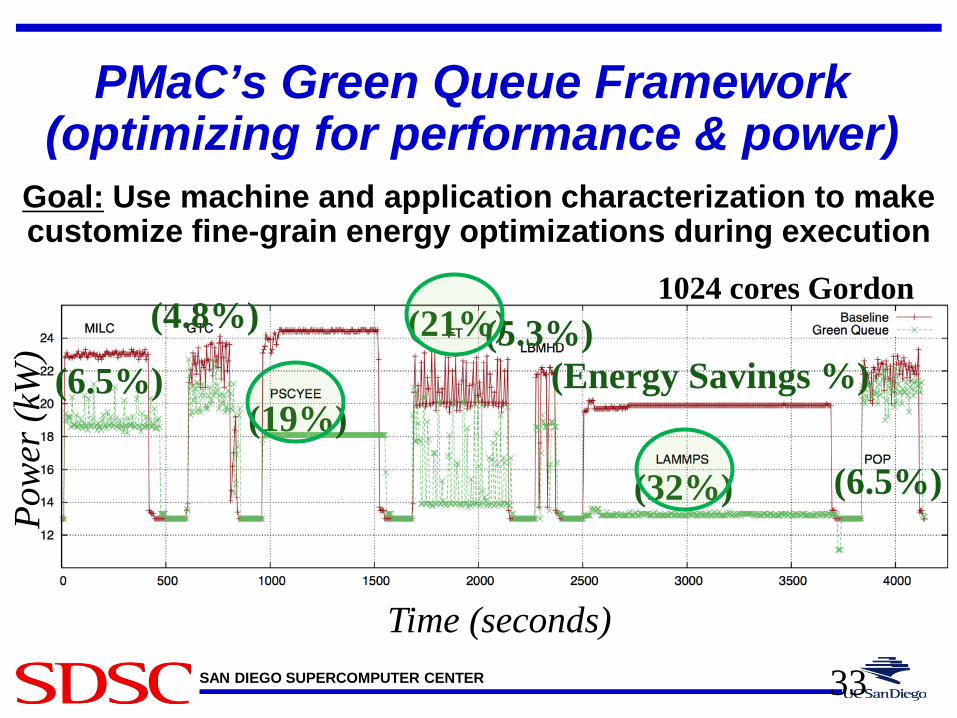
Goal: Use machine and application characterization to make customize fine-grain energy optimizations during execution
PMaC’s Green Queue Framework (optimizing for performance & power)
(6.5%)
(4.8%)
(19%)
(21%) (5.3%)
(32%) (6.5%)
(Energy Savings %)
Time (seconds)
Pow
er (k
W)
1024 cores Gordon
33
SAN DIEGO SUPERCOMPUTER CENTER
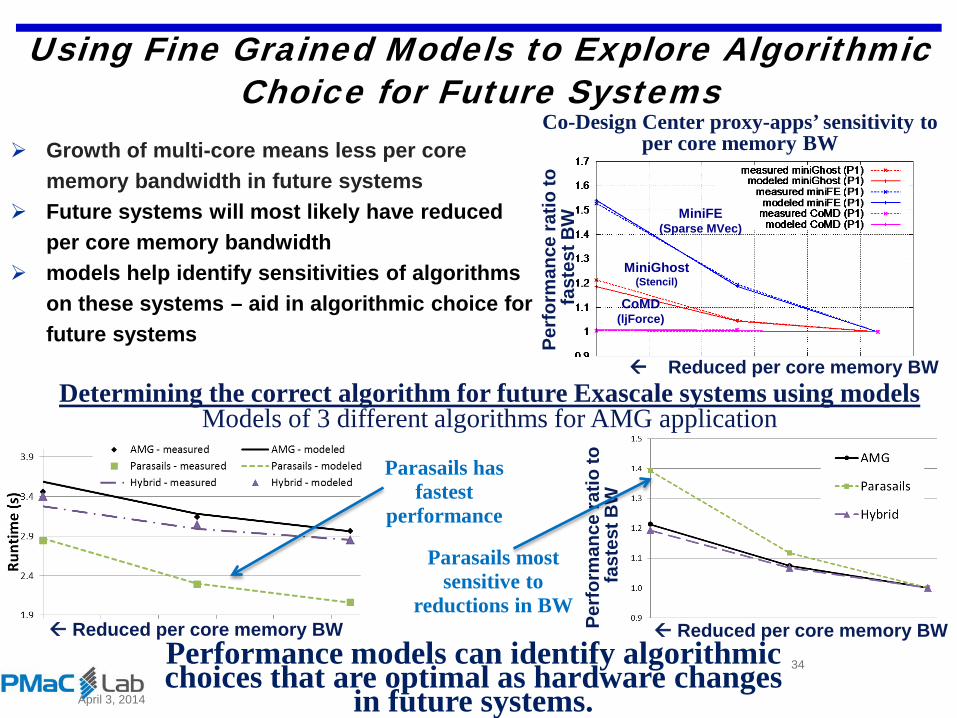
Using Fine Grained Models to Explore Algorithmic Choice for Future Systems
Growth of multi-core means less per core memory bandwidth in future systems
Future systems will most likely have reduced per core memory bandwidth
models help identify sensitivities of algorithms on these systems – aid in algorithmic choice for future systems
34
April 3, 2014
Perf
orm
ance
ratio
to
fast
est B
W
Reduced per core memory BW Reduced per core memory BW
Reduced per core memory BW
CoMD (ljForce)
MiniGhost (Stencil)
MiniFE (Sparse MVec)
Perf
orm
ance
ratio
to
fast
est B
W
Co-Design Center proxy-apps’ sensitivity to per core memory BW
Determining the correct algorithm for future Exascale systems using models Models of 3 different algorithms for AMG application
Parasails has fastest
performance
Parasails most sensitive to
reductions in BW
Performance models can identify algorithmic choices that are optimal as hardware changes
in future systems.
SAN DIEGO SUPERCOMPUTER CENTER
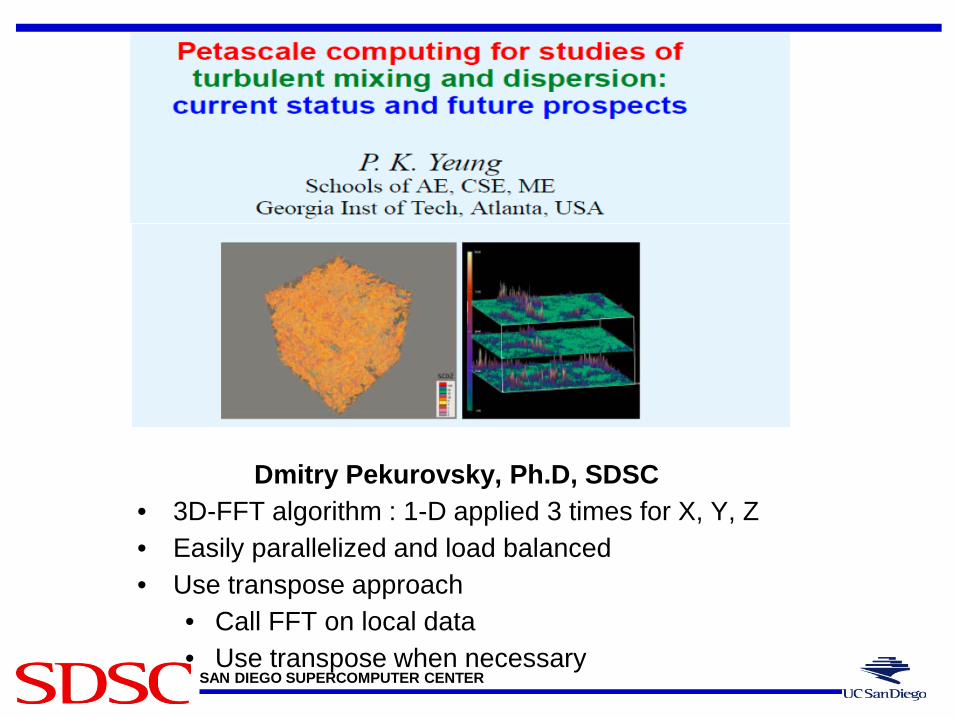
Dmitry Pekurovsky, Ph.D, SDSC • 3D-FFT algorithm : 1-D applied 3 times for X, Y, Z • Easily parallelized and load balanced • Use transpose approach
• Call FFT on local data • Use transpose when necessary
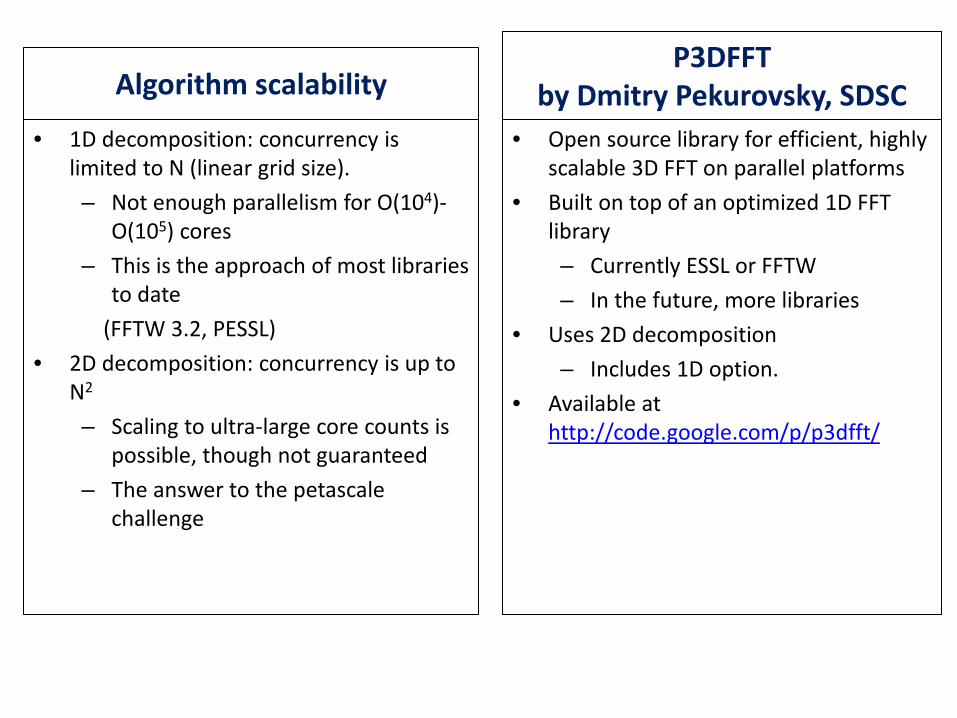
Algorithm scalability
• 1D decomposition: concurrency is limited to N (linear grid size). – Not enough parallelism for O(104)-
O(105) cores – This is the approach of most libraries
to date (FFTW 3.2, PESSL)
• 2D decomposition: concurrency is up to N2
– Scaling to ultra-large core counts is possible, though not guaranteed
– The answer to the petascale challenge
P3DFFT by Dmitry Pekurovsky, SDSC
• Open source library for efficient, highly scalable 3D FFT on parallel platforms
• Built on top of an optimized 1D FFT library – Currently ESSL or FFTW – In the future, more libraries
• Uses 2D decomposition – Includes 1D option.
• Available at http://code.google.com/p/p3dfft/
SAN DIEGO SUPERCOMPUTER CENTER

SAN DIEGO SUPERCOMPUTER CENTER
IN-SITU VISUALIZATION FOR GLOBAL HYBRID SIMULATIONS
Homa Karimabadi (UCSD), Mahidhar Tatineni (SDSC), Amit Majumdar (SDSC)
Burlen Loring (LBL) Patrick O’leary (Kitware Inc), Berk Geveci (Kitware Inc.)
XSEDE13: Gateway to Discovery July 22-25, 2013 San Diego, CA

SAN DIEGO SUPERCOMPUTER CENTER
Space Weather
90 million miles or ~ 100 Suns
Earth’s magnetic field provides a
protective cocoon but it breaks during strong solar storms
SAN DIEGO SUPERCOMPUTER CENTER
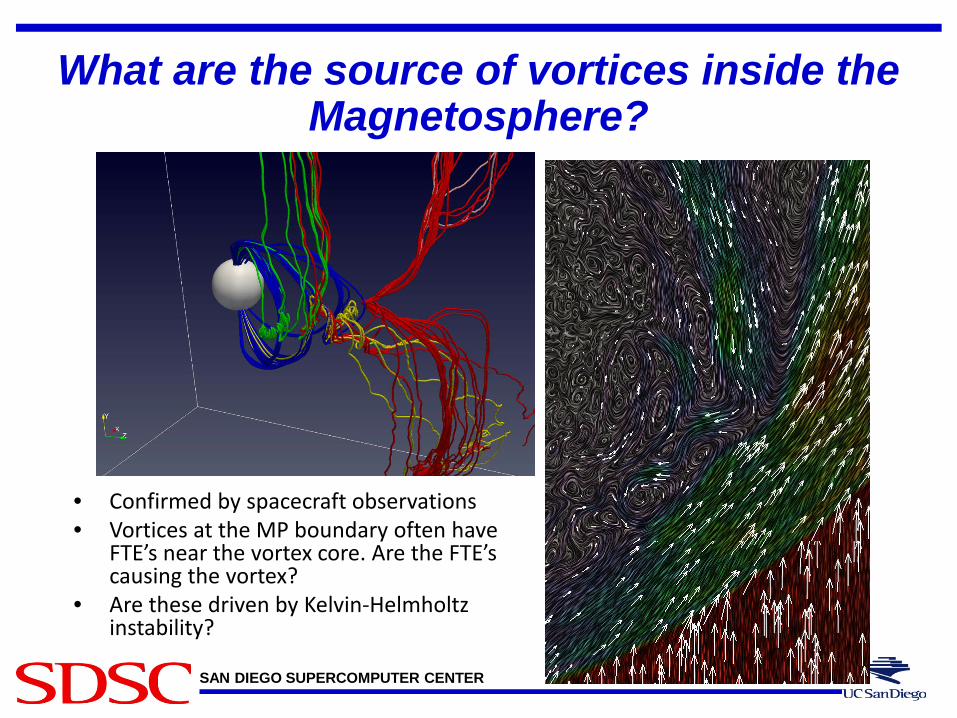
What are the source of vortices inside the Magnetosphere?
• Confirmed by spacecraft observations • Vortices at the MP boundary often have
FTE’s near the vortex core. Are the FTE’s causing the vortex?
• Are these driven by Kelvin-Helmholtz instability?

SAN DIEGO SUPERCOMPUTER CENTER
Why In-situ for this study?
• Simulation is I/O bound and runs are limited by disk quotas • With in-situ we reduce I/O costs by using “extracts” • And increase temporal resolution • Removes need for post processing – saves disk and
computational time.
SAN DIEGO SUPERCOMPUTER CENTER
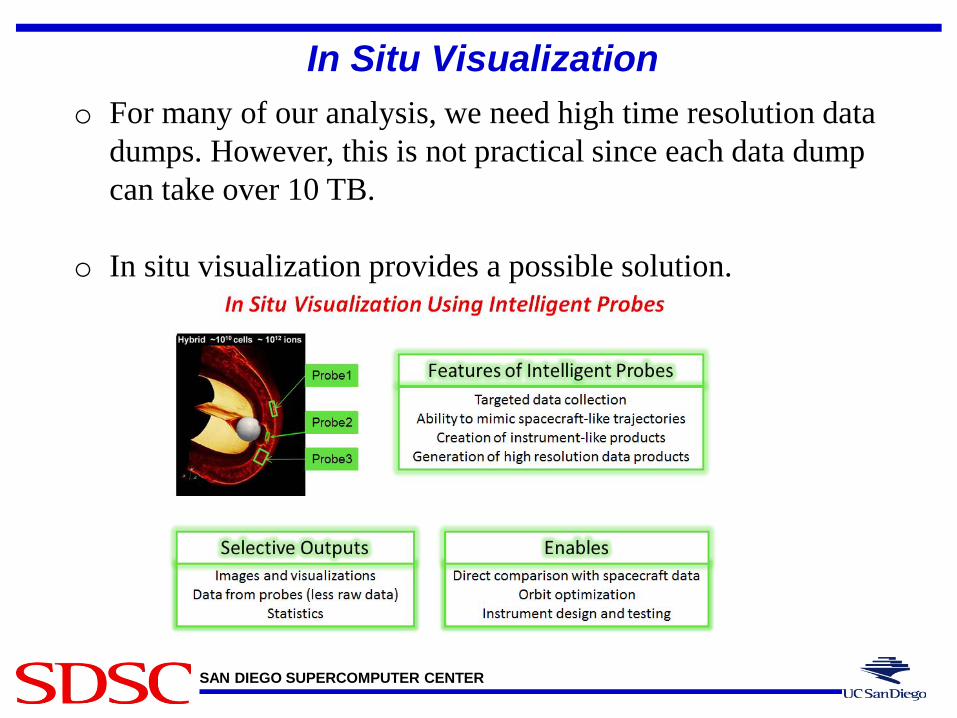
In Situ Visualization o For many of our analysis, we need high time resolution data
dumps. However, this is not practical since each data dump can take over 10 TB.
o In situ visualization provides a possible solution.
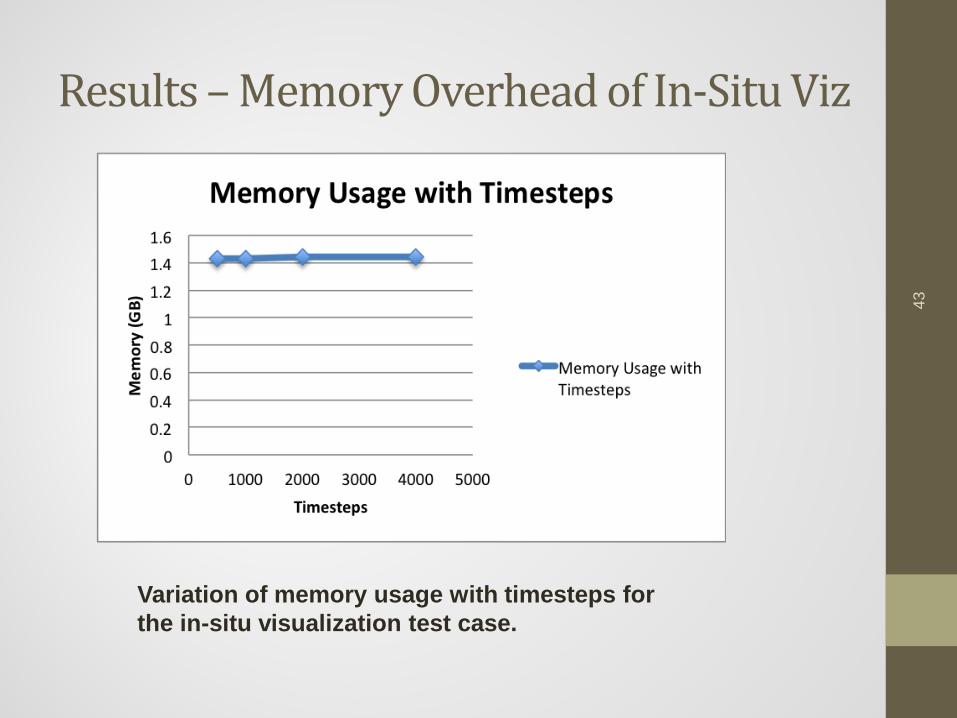
Results – Memory Overhead of In-Situ Viz
43
Variation of memory usage with timesteps for the in-situ visualization test case.
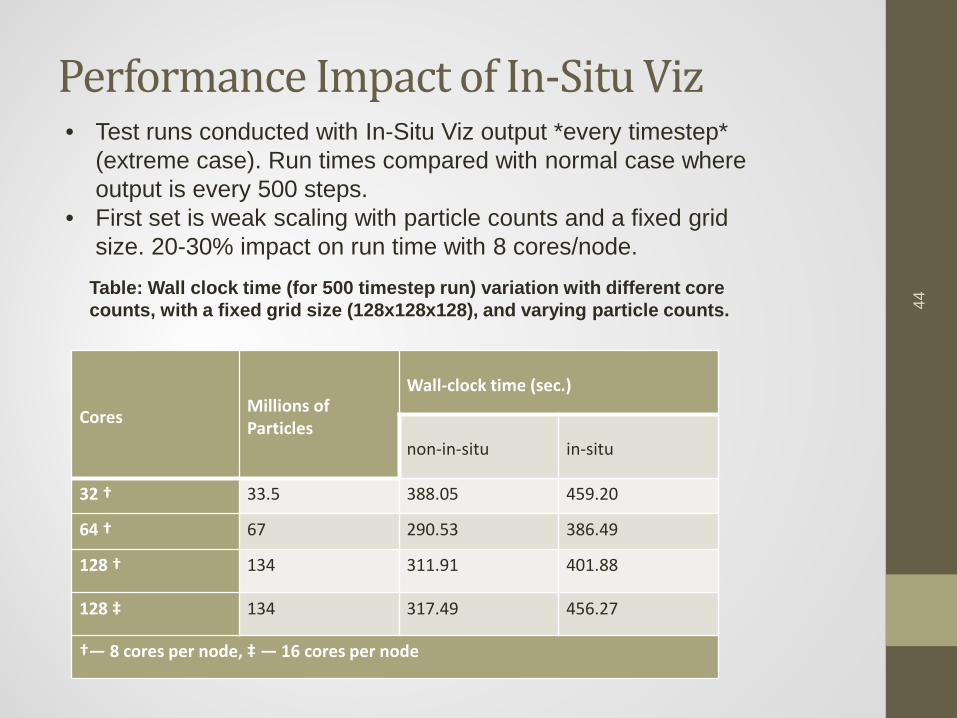
Performance Impact of In-Situ Viz
Cores Millions of Particles
Wall-clock time (sec.)
non-in-situ in-situ
32 † 33.5 388.05 459.20
64 † 67 290.53 386.49
128 † 134 311.91 401.88
128 ‡ 134 317.49 456.27
†— 8 cores per node, ‡ — 16 cores per node
44 Table: Wall clock time (for 500 timestep run) variation with different core
counts, with a fixed grid size (128x128x128), and varying particle counts.
• Test runs conducted with In-Situ Viz output *every timestep* (extreme case). Run times compared with normal case where output is every 500 steps.
• First set is weak scaling with particle counts and a fixed grid size. 20-30% impact on run time with 8 cores/node.
SAN DIEGO SUPERCOMPUTER CENTER
Summary • SDSC (like all the other centers – NCSA, NICS, PSC, TACC and
others) enables domain science research via CI resource and expertise
• Individual research labs and researchers perform CI related research and development
• We encourage you to get allocation and start using the XSEDE resources (more from XSEDE talks)
• Science Gateways are excellent ways to get your science done
SAN DIEGO SUPERCOMPUTER CENTER
End
Thank you