Research Assessment and UK publication patterns Jonathan Adams.
22
Research Assessment and UK publication patterns Jonathan Adams
-
Upload
violet-cole -
Category
Documents
-
view
220 -
download
0
Transcript of Research Assessment and UK publication patterns Jonathan Adams.

Research Assessmentand UK publication patterns
Jonathan Adams

June 2005
Evidence Ltd – what does it do?
• Research performance analysis and interpretation
– Founded 2000
– Grew out of Higher Education Policy Unit at University of Leeds
• UK studies for HEFCE, OST, Gov’t dep’ts, RCs, HEFCW, Royal Society, RDAs
• International analyses for EC, Austria, New Zealand, Sweden, Switzerland
• Office of Science & Technology annual PSA target indicators for the UK research base
• UK Higher Education Research Yearbook
• Institutional research performance reports

June 2005
The UK’s Research Assessment Exercise – what is it?
• A research evaluation cycle
– 1986, 1989, 1992, 1996, 2001, 2008
• Considers outputs, training, funding and strategy across higher education institutions
• Assessment carried out by peer review panels
– 69 subject-based Units of Assessment (UoAs)
• Outcome is a quality-related grade
– Performance indicator and weighting factor for core research funding (QR)
• Chancellor has announced shift to metrics post 2008

June 2005
The RAE has led to an increase in UK share of world citations
9
10
11
12
13
1981 1982 1983 1984 1985 1986 1987 1988 1989 1990 1991 1992 1993 1994 1995 1996 1997 1998 1999 2000 2001 2002 2003
UK
sh
are
(%)
of
wo
rld
cit
atio
ns
Arrows indicate RAE years

June 2005
Improvement has happened at all grade levelsData are for core science UoAs, grade at RAE96
0.6
0.8
1
1.2
1991 1992 1993 1994 1995 1996 1997 1998 1999 2000
Ave
rag
e n
orm
alis
ed i
mp
act
(wo
rld
ave
rag
e =
1.0
)
Grade 4 Grade 3A Grade 3B
16%
12%
17%

June 2005
The RAE is a driver of research activity in universities
• Changes announced by Chancellor in Budget documents will not affect this
• Publications are a key measure of performance
– RA2 allows 4 items per researcher
– These can be books, articles, proceedings or other works
– Citation data for serials makes them ideal for evaluating outcomes as well as output
• This makes publishing patterns a central focus for management and researchers

June 2005
Evidence analysed publications submitted to the RAEs
• RAE2001 RA2 validation, built on RAE1996 journal analyses and international benchmarking
– 195,000 items submitted across the 68 UoAs
– 90% of books, journal articles and conference proceedings were reconciled to real publications
– Progressively identify all journal titles/ISSNs and get frequency data by University and UoA
• Focus on journal articles, initially those on Thomson Scientific (ISI) databases
– Track citation performance

June 2005
Research outputs submitted to RAE show variation in output type across subjects
0%
10%
20%
30%
40%
50%
60%
70%
80%
90%
100%
1 2 3 4 5 6 7 8 9 10 11 12 13 14 15 16 17 18 19 20 21 22 23 24 25 26 27 28 29 30 31 32 33 34 35 36 37 38 39 40 41 42 43 44 45 46 47 48 49 50 51 52 53 54 55 56 57 58 59 60 61 62 63 64 65 66 67 68 69
UoA code
Other
Journal articles
Conference proceedings
Chapters in books
Books
Science & Engineering Humanities & Arts
June 2005
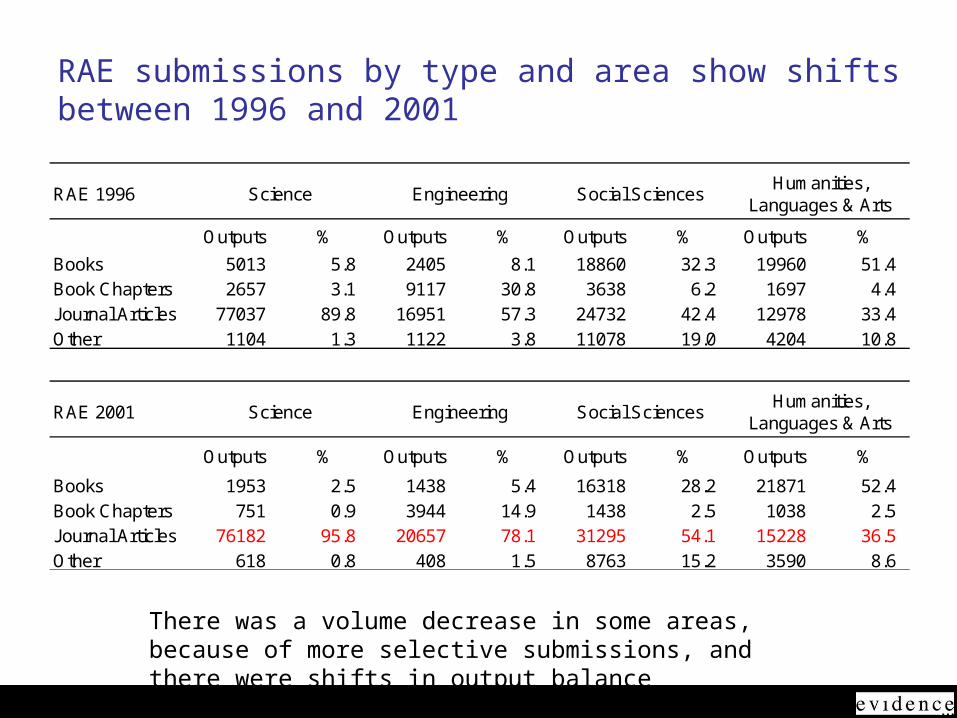
RAE submissions by type and area show shifts between 1996 and 2001
RAE 1996 Science Engineering Social SciencesHumanities,
Languages & Arts
Outputs % Outputs % Outputs % Outputs %
Books 5013 5.8 2405 8.1 18860 32.3 19960 51.4Book Chapters 2657 3.1 9117 30.8 3638 6.2 1697 4.4Journal Articles 77037 89.8 16951 57.3 24732 42.4 12978 33.4Other 1104 1.3 1122 3.8 11078 19.0 4204 10.8
Total 85811 100.0 29595 100.0 58308 100.0 38839 100.0
RAE 2001 Science Engineering Social SciencesHumanities,
Languages & Arts
Outputs % Outputs % Outputs % Outputs %
Books 1953 2.5 1438 5.4 16318 28.2 21871 52.4Book Chapters 751 0.9 3944 14.9 1438 2.5 1038 2.5Journal Articles 76182 95.8 20657 78.1 31295 54.1 15228 36.5Other 618 0.8 408 1.5 8763 15.2 3590 8.6
There was a volume decrease in some areas, because of more selective submissions, and there were shifts in output balance

June 2005
Article concentration by journal was similar in 1996 and 2001
There are many journals with fewer than 100 articles across all UoAs
0
100
200
300
400
500
600
Journal frequency rank
Jou
rnal
art
icle
co
un
t
1996 Article count
2001 Article Count

June 2005
Most journals are submitted to only one or a few UoAs but some spread across many subjects
0
200
400
600
800
1000
1200
1400
1600
1800
2000
1 2 3 4 5 6 7 8 9 10 11 12 13 14 15 16 17 18 19 20 21 24 26 32 34 37
Number of UoAs in which the same journal occurred
Nu
mb
er
of
jou
rnal
s
0
200
400
600
800
1000
1200
1400
Ave
rag
e n
um
ber o
f article
s p
er jo
urn
al
Number of journals
Average number of articles per journal

June 2005
Articles were more common in 2001. ISI coverage varied.
UoABiological Sciences
PhysicsMechanical Engineering
Law Sociology
UoA code 14 19 30 36 42RAE1996Submitted outputs 9063 6675 4909 5142 3792
Journal articles 8333 6094 3060 2599 1645
Number in ISI journals
8086 5976 2626 603 1122
Articles as % of all 91.9 91.3 62.3 50.5 43.4
ISI as % of articles 97.0 98.1 85.8 23.2 68.2
RAE2001Submitted outputs 9931 6933 4353 5328 3530
Journal articles 9726 6673 4039 2777 1846
Number in ISI journals
9638 6113 3714 520 1106
Articles as % of all 97.9 96.2 92.8 52.1 52.3
ISI as % of articles 99.1 91.6 92.0 18.7 59.9

June 2005
Overall: RAE2001 outputs for science and engineering were usually articles, often in ISI journals, but this is less true in other subject areas
0
10
20
30
40
50
60
70
80
90
100
1 2 3 4 5 6 7 8 9 10 11 13 14 15 16 17 18 19 20 21 22 23 24 25 26 27 28 29 30 31 32 33 34 35 36 37 38 39 40 41 42 43 44 45 46 47 48 49 50 51 52 53 54 55 56 57 58 59 60 61 62 63 64 65 66 67 68 69
UoA
Per
cent
age
Articles as % RA2 ISI as % articles

June 2005
There are also HEI factors. Those that submitted more articles tended to have more publications in ISI journals
0
1000
2000
3000
4000
5000
6000
Nu
mb
er o
f ar
ticl
es s
ub
mit
ted
to
RA
E20
01
0
0.2
0.4
0.6
0.8
1
Pro
po
rtion
of artciles in
ISI jo
urn
als
Number of articles Proportion in ISI journals
The correlation is highly significant statistically

June 2005
Thomson data cover a high proportion of journals that science researchers believe represent their best work, but this is not always true in the social sciences
Note the number of journals. A few are high frequency. Many are singletons and may be marginal to the core subject.
UoA Name
Items submitted
to RAE2001
Number of journal articles
Articles in ISI
journals
Count of ISI
journals
Other journals
ISI coverage as % RA2
14 Biological Sciences 9931 9726 9574 1838 164 96.419 Physics 6933 6673 6297 702 116 90.830 Mechanical Engineering 4353 4039 3604 1110 256 82.836 Law 5328 2777 438 150 736 8.239 Politics & international studies 4410 2240 1252 477 577 28.4

June 2005
Frequently submitted journals are usually ISI journals in science areas. Grade effects are not significant in Physics – is this due to cultural commonality?
This example uses data for UoA19. Titles in red are not on Thomson ISI databases
Journal TitleCount for all
unitsCount in 5/5*
unitsFor grade 5/5* units
For all units
Physical Review Letters 786 672 1 1Monthly Notices Of The Royal Astronomical Society 728 590 2 2Physical Review B 442 342 3 3Physics Letters B 345 335 4 4Astrophysical Journal 267 223 5 5European Physical Journal C 152 151 6 8Nuclear Instruments & Methods In Physics Research Section A-accelerators Spectrometers Detectors And Associated Equipment149 144 7 9Applied Physics Letters 180 139 8 7Astronomy and Astrophysics 181 134 9 6Physical Review D 140 131 10 10Nature 120 112 11 12Nuclear Physics B 108 107 12 14Physical Review A 131 83 13 11Journal Of Physics B-atomic Molecular And Optical Physics 104 79 14 15Journal Of Physics-condensed Matter 115 76 15 13Journal of Geophysical Research 96 64 16 16Journal Of Applied Physics 89 63 17 17Physical Review E 79 63 17 18Zeitschrift Fur Physik C - particles And Fields 58 57 19 22Journal Of Chemical Physics 68 50 20 19Physical Review C 65 46 21 21
Articles in RAE2001, UoA19 Rank by frequency

June 2005
Frequently submitted journals are often, but not always, ISI journals in the social sciences. There are grade effects.
Journal TitleCount for all
unitsCount in 5/5*
unitsFor grade 5/5*
unitsFor all units
Journal Of The Operational Research Society 113 58 1 3Journal Of Management Studies 115 49 2 2British Journal Of Management 108 42 3 4British Journal Of Industrial Relations 84 41 4 6Journal of Business Finance and Accounting 61 39 5 12Organization Studies 75 37 6 10European Journal Of Operational Research 59 36 7 13International Journal Of Operations & Production Management 86 35 8 5Human Relations 79 35 8 8International Journal Of Human Resource Management 76 34 10 9Journal of Marketing Management 125 31 11 1Organization 57 27 12 14Economic Journal 38 27 12 17Accounting and Business Research 36 25 14 18Journal Of Banking & Finance 35 25 14 19European Journal of Marketing 81 24 16 7
Articles in RAE2001, UoA43 Rank by frequency
This example uses data for UoA43. Titles in red are not on Thomson ISI databases

June 2005
Changing cultures?
• Economic & Social Research Council
– Evidence study shows researchers use bibliometric data to evaluate research quality but do so as experts
– There is a shift to a trans-Atlantic research culture in which journals will be increasingly significant
• European Science Foundation/Humanities & Arts
– ESF-facilitated panels have been reviewing journal lists
• Music – no general acceptance of validity
• History – 1500 national and international serials in 3 bands
– Further evidence of expanding role of serials as a standard output mode alongside monographs

June 2005
Publication data throw light on other aspects of the research process
• Relationship between UoA subject areas is shown by similarity in journal usage
• Citation impact is correlated with RAE grade when normalised against field
• When impact is normalised against journal there is less grade variation
• Publication data can be linked to other factors such as staff numbers and research income

June 2005
0.00 0.16 0.32 0.48 0.64
Clinical Lab Sci...
Accountancy
Hosp. based...Com. based...Other stud. PharmacyBiochemistryBiol. sciencesPre-clin. stud.PhysiologyPharmacologyAnatomyVeterinary sci.Clin. DentistryFood sci...AgricultureEarth sci.Environ. sci.GeographyArcheologyMineral/mining...ChemistryMetallurgy...PhysicsChem. eng.Computer sci.Gen. Eng.Mechanical eng...Electrical eng...Civil eng.Pure maths.Applied maths.Statistical res...NursingSports related...PsychologyEducationPolitics...Social policy...SociologySocial workCommunication...Built environ.Town/country...Economics...Business... stud.LawLibrary and info...AnthropologyAsian stud.Middle east...Theology...American stud.Iberian...European stud.FrenchGerman, Dutch...EnglishHistoryItalianRussian...LinguisticsClassics...PhilosophyHistory of Art...Art and DesignDrama, Dance...MusicCeltic stud.
Journal frequency analyses show the intellectual relationship between UoAs
Engineering
Medical
Physical
Maths
Bio-Med
Environment
Social
Arts & hum’s
This tree diagram illustrates similarity in the frequency with which journals were submitted to RAE1996

June 2005
There is journal differentiation within communities – these data are for UoA13 Psychology
Citation performance by RAE 2001 grade
0.0
0.5
1.0
1.5
2.0
2.5
3.0
0 1 2 3 4 5 6
grade
cit
ati
on
pe
rfo
rma
nc
e
Article performance relative to journal average Article performance relative to field average World average
4 5 5* 4 5 5*
Citation impact varies with grade normalised by category
But not when normalised by journal impact factor
Grade at RAE2001
Research Assessmentand UK publication patterns
Jonathan Adams