Research Article Survey Paper Case Study Available...
15
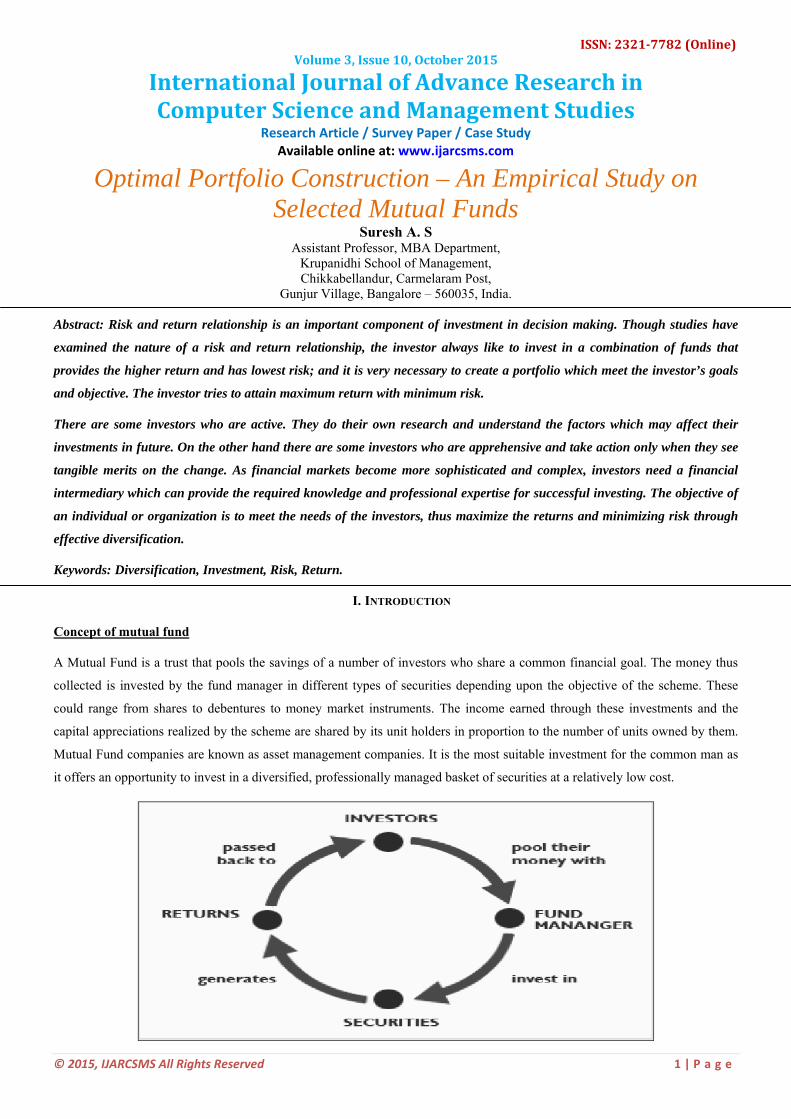
© 2015, IJARCSMS All Rights Reserved 1|Page ISSN: 232 7782 (Online) 1 Computer Science and Management Studies International Journal of Advance Research in Volume 3, Issue 10, October 2015 Research Article / Survey Paper / Case Study Available online at: www.ijarcsms.com Optimal Portfolio Construction – An Empirical Study on Selected Mutual Funds Suresh A. S Assistant Professor, MBA Department, Krupanidhi School of Management, Chikkabellandur, Carmelaram Post, Gunjur Village, Bangalore – 560035, India. Abstract: Risk and return relationship is an important component of investment in decision making. Though studies have examined the nature of a risk and return relationship, the investor always like to invest in a combination of funds that provides the higher return and has lowest risk; and it is very necessary to create a portfolio which meet the investor’s goals and objective. The investor tries to attain maximum return with minimum risk. There are some investors who are active. They do their own research and understand the factors which may affect their investments in future. On the other hand there are some investors who are apprehensive and take action only when they see tangible merits on the change. As financial markets become more sophisticated and complex, investors need a financial intermediary which can provide the required knowledge and professional expertise for successful investing. The objective of an individual or organization is to meet the needs of the investors, thus maximize the returns and minimizing risk through effective diversification. Keywords: Diversification, Investment, Risk, Return. I. INTRODUCTION Concept of mutual fund A Mutual Fund is a trust that pools the savings of a number of investors who share a common financial goal. The money thus collected is invested by the fund manager in different types of securities depending upon the objective of the scheme. These could range from shares to debentures to money market instruments. The income earned through these investments and the capital appreciations realized by the scheme are shared by its unit holders in proportion to the number of units owned by them. Mutual Fund companies are known as asset management companies. It is the most suitable investment for the common man as it offers an opportunity to invest in a diversified, professionally managed basket of securities at a relatively low cost.
Transcript of Research Article Survey Paper Case Study Available...
© 2015, IJARCSMS All Rights Reserved 1 | P a g e
ISSN: 232 7782 (Online) 1
Computer Science and Management Studies
International Journal of Advance Research in Volume 3, Issue 10, October 2015
Research Article / Survey Paper / Case Study Available online at: www.ijarcsms.com
Optimal Portfolio Construction – An Empirical Study on Selected Mutual Funds
Suresh A. S Assistant Professor, MBA Department,
Krupanidhi School of Management, Chikkabellandur, Carmelaram Post,
Gunjur Village, Bangalore – 560035, India. Abstract: Risk and return relationship is an important component of investment in decision making. Though studies have
examined the nature of a risk and return relationship, the investor always like to invest in a combination of funds that
provides the higher return and has lowest risk; and it is very necessary to create a portfolio which meet the investor’s goals
and objective. The investor tries to attain maximum return with minimum risk.
There are some investors who are active. They do their own research and understand the factors which may affect their
investments in future. On the other hand there are some investors who are apprehensive and take action only when they see
tangible merits on the change. As financial markets become more sophisticated and complex, investors need a financial
intermediary which can provide the required knowledge and professional expertise for successful investing. The objective of
an individual or organization is to meet the needs of the investors, thus maximize the returns and minimizing risk through
effective diversification.
Keywords: Diversification, Investment, Risk, Return.
I. INTRODUCTION
Concept of mutual fund
A Mutual Fund is a trust that pools the savings of a number of investors who share a common financial goal. The money thus
collected is invested by the fund manager in different types of securities depending upon the objective of the scheme. These
could range from shares to debentures to money market instruments. The income earned through these investments and the
capital appreciations realized by the scheme are shared by its unit holders in proportion to the number of units owned by them.
Mutual Fund companies are known as asset management companies. It is the most suitable investment for the common man as
it offers an opportunity to invest in a diversified, professionally managed basket of securities at a relatively low cost.
Suresh et al., International Journal of Advance Research in Computer Science and Management Studies Volume 3, Issue 10, October 2015 pg. 1-15
© 2015, IJARCSMS All Rights Reserved ISSN: 2321‐7782 (Online) 2 | P a g e
II. TYPES OF MUTUAL FUNDS SCHEMES
1. Based on their structure:
Open-ended fund: In Open Ended Funds, the fund issues/sells new units continuously for purchase by investors at any
time during the life of a scheme. At the same time investors are free to redeem the units at prevailing NAV from the fund.
Hence, number of unit outstanding in an open-ended fund can fluctuate on a daily basis.
Close-ended fund: In close-ended funds, the number of units issued is fixed. After the initial issue/ IPO, the units are
traded on the exchange like any other stock. Units sold by one investor are purchased by another investor and not by the fund.
2. Based on their investment objective:
Equity fund: These funds invest in equities and equity related instruments. With fluctuating share prices, such funds
show volatile performance, even losses. However, short term fluctuations in the market, generally smoothens out in the long
term, thereby offering higher returns at relatively lower volatility. At the same time, such funds can yield great capital
appreciation as, historically, equities have outperformed all asset classes in the long term. Hence, investment in equity funds
should be considered for a period of at least 3-5 years.
Balanced fund: These investment portfolios include both debt and equity. As a result, on the risk-return ladder, they
fall between equity and debt funds. Balanced funds are the ideal mutual funds vehicle for investors who prefer spreading their
risk across various instruments.
Debt fund: They invest only in debt instruments, and are a good option for investors averse to idea of taking risk
associated with equities. Therefore, they invest exclusively in fixed-income instruments like bonds, debentures, Government of
India securities; and money market instruments such as certificates of deposit (CD), commercial paper (CP) and call money.
3. Based on Other Schemes:
Tax Saving Schemes: These schemes offer tax rebates under specific provisions of the Indian Income Tax laws as the
Government offers tax incentives for investment in specified avenues. Investments made in Equity Linked Saving Schemes and
Pension Schemes are allowed as deduction u/s 88 of the Income Tax Act, 1961.
Industry Specific Schemes: Industry Specific Schemes invest only in the industries specified in the offer document.
The investment is limited to specific industries like InfoTech, FMCG, and Pharmaceuticals etc.
Index Schemes: Index Funds attempt to replicate the performance of a particular index such as the BSE Sensex or the
NSE 50.
Sector specific Schemes: Sectoral Funds are those, which invest exclusively in a specified industry or a group of
industries or various segments such as 'A' Group shares or initial public offerings.
III. OBJECTIVES OF RESEARCH
To select the fund for constructing portfolio.
To find out the relationship of each fund with respect to benchmark.
To compute systematic and unsystematic risk.
To construct an optimum portfolio for investors.

Suresh et al., International Journal of Advance Research in Computer Science and Management Studies Volume 3, Issue 10, October 2015 pg. 1-15
© 2015, IJARCSMS All Rights Reserved ISSN: 2321‐7782 (Online) 3 | P a g e
IV. PROCEDURE
The following steps have been followed in this analysis.
Step1: Returns and risk of 8 randomly selected companies has been calculated for a period of 5 years,
Step2: For applying Sharpe’s Single Index Model Ri, Rm, σei2, σp2, Rf, β values are required.
So all these data are collected and calculated for further proceeding.
Step3: The cutoff point C* is calculated using the formula
( )
∑
∑=
βσ+
σ
= σ
βσ
=i
im2
m2
i
1i ei2
imfim
2
1
R-R
ci
1i ie2
Step4: After computation of Ci for all the funds, the values got were put in a table.
Step5: The Ci values go on increasing up to a certain point and then start decreasing. The highest Point is called cut off point
(C*). The funds which are above C* point are chosen to the Portfolio.
Step6: once the funds for portfolio are chosen, the proportion in which they should be invested is to be determined. This can be
done using a formula where Xi denotes the proportion.
j
ii Z
ZX∑
=
Where
ei2BiZiσ
=(
*
i
Fi CRR
−β−
)
The following funds are taken from different Equity diversified funds of NSE NIFTY.
Table no 1: List of the Equity Diversified funds chosen for the study Sl. no. Company
1 Birla sun life India Gen Next Fund
2 SBI Magnum Mid Cap Fund
3 Kotak Classic Equity
4 SBI Emerging Business Fund 5 Kotak 50 6 Axis Equity Fund
7 TATA Equity Management Fund
8 UTI India Lifestyle Fund
Suresh et al., International Journal of Advance Research in Computer Science and Management Studies Volume 3, Issue 10, October 2015 pg. 1-15
© 2015, IJARCSMS All Rights Reserved ISSN: 2321‐7782 (Online) 4 | P a g e
V. THE RELATIONSHIP BETWEEN INDIVIDUAL FUND AND MARKET RETURN
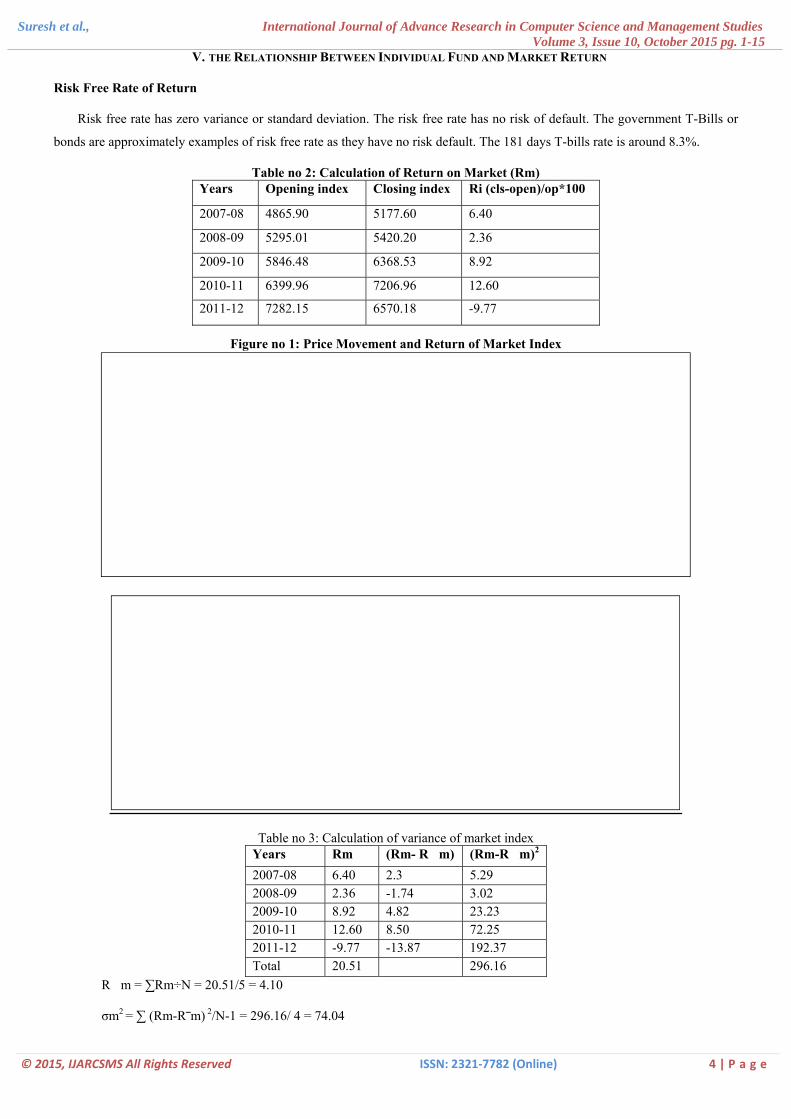
Risk Free Rate of Return
Risk free rate has zero variance or standard deviation. The risk free rate has no risk of default. The government T-Bills or
bonds are approximately examples of risk free rate as they have no risk default. The 181 days T-bills rate is around 8.3%.
Table no 2: Calculation of Return on Market (Rm) Years Opening index Closing index Ri (cls-open)/op*100
2007-08 4865.90 5177.60 6.40
2008-09 5295.01 5420.20 2.36
2009-10 5846.48 6368.53 8.92
2010-11 6399.96 7206.96 12.60
2011-12 7282.15 6570.18 -9.77
Figure no 1: Price Movement and Return of Market Index
Table no 3: Calculation of variance of market index (Rm-R�m)2Years Rm (Rm- R�m)
2007-08 6.40 2.3 5.29 2008-09 2.36 -1.74 3.02 2009-10 8.92 4.82 23.23 2010-11 12.60 8.50 72.25 2011-12 -9.77 -13.87 192.37 Total 20.51 296.16
R�m = ∑Rm÷N = 20.51/5 = 4.10
σm2 = ∑ (Rm-R⎯m) 2/N-1 = 296.16/ 4 = 74.04

Suresh et al., International Journal of Advance Research in Computer Science and Management Studies Volume 3, Issue 10, October 2015 pg. 1-15
© 2015, IJARCSMS All Rights Reserved ISSN: 2321‐7782 (Online) 5 | P a g e
Computation of Risk and Returns of selected funds
1. Birla sun life India Gen Next Fund
Table no 4: NAV and fund return of Birla sun life India gennext Year NAV Beg NAV End Ri (End-Beg)/beg*100 2007-08 70.10 76.10 8.56 2008-09 76.98 88.39 14.82 2009-10 89.15 98.14 10.08 2010-11 99.95 116.84 16.89 2011-2012 117.12 127.94 9.23
Table no 5: Calculation of variance of Birla sun life India gennext
Years Ri (Ri-�R�i) (Ri-�R�i)2 (Rm-Rm�) (Rm-Rm�)2 ∑(Ri-�R�i) (Rm-Rm�)
2007-08 8.56 -3.35 11.22 2.3 5.29 -7.7
2008-09 14.82 2.91 8.46 -1.74 3.02 -5.06
2009-10 10.08 -1.83 3.34 4.82 23.23 -8.82
2010-11 16.89 4.98 24.8 8.5 72.25 42.33
2011-12 9.23 -2.68 7.18 -13.87 192.37 37.17
Total 59.58 55 296.16 57.92
R�i = ∑Ri / N
= 59.58 / 5
= 11.91
σi2 = ∑ (Ri-R�i) 2 / N-1
= 55 / 4
= 13.75
Systematic Risk: βi = ∑ (Ri-R�i) (Rm-R�m)/ (Rm-R�m) 2
= 57.92/296.16
= 0.1955
Unsystematic Risk: σe�i2 = σi2-βi2σm2
= 13.75 - (0.19552*74.04)
= 13.75 -2.8298
= 10.92
INTERPRETATION:
From the above it is inferred that year 2008 has recorded as low return and high return is recorded in the year 2011.In general
the overall returns are positive. The volatility of the fund is very low as compared to the market.

Suresh et al., International Journal of Advance Research in Computer Science and Management Studies Volume 3, Issue 10, October 2015 pg. 1-15
© 2015, IJARCSMS All Rights Reserved ISSN: 2321‐7782 (Online) 6 | P a g e
2. SBI Magnum Midcap Fund
Table no 6: NAV and fund return of SBI Magnum Midcap Fund Year NAV Beg NAV End Ri (end-beg)/beg*100 2007-08 74.82 68.48 -8.47 2008-09 69.87 79.77 14.16 2009-10 80.05 94.35 17.86 2010-11 94.91 104.01 9.58 2011-2012 103.74 97.64 -5.88
Table no 7: Calculation of variance of SBI Magnum Midcap Fund
Years Ri (Ri-Ri) (Ri-Ri)2 (Rm-Rm) (Rm-Rm)2 ∑(Ri-Ri) (Rm-Rm)
2007-08 -8.47 -13.92 193.76 2.3 5.29 -32.01
2008-09 14.16 8.71 75.86 -1.74 3.02 -15.15
2009-10 17.86 12.41 154.008 4.82 23.23 59.81
2010-11 9.58 4.13 17.05 8.5 72.25 35.1
2011-12 -5.88 -11.33 128.36 -13.87 192.37 157.14
Total 27.25 569.03 296.16 204.89
Ri = ∑Ri / N
= 27.25 / 5
= 5.45
σi2 = (Ri-Ri) 2 / n-1
= 569.03 / 4
= 142.25
Systematic Risk: βi = ∑ (Ri-Ri) (Rm-Rm) / (Rm-Rm) 2
= 204.89 / 296.16
= 0.6918
Unsystematic Risk: σei2 = σi2-βi2σm2
=142.25 - (0.69182*74.04)
= 142.25 – 35.4345
= 106.81
INTERPRETATION:
From the above it is inferred that year 2008 has recorded as low return and high return is recorded in the year 2010.In general
the overall return is positive. The volatility of the fund is very low as compared to the market.
Suresh et al., International Journal of Advance Research in Computer Science and Management Studies Volume 3, Issue 10, October 2015 pg. 1-15
© 2015, IJARCSMS All Rights Reserved ISSN: 2321‐7782 (Online) 7 | P a g e
3. Kotak Classic Equity Fund
Table no 8: NAV and fund return of Kotak Classic Equity Fund Year NAV Beg NAV End Ri (end-beg)/beg*100 2007-08 62.30 66.30 6.42
2008-09 66.95 72.58 8.40
2009-10 73.07 83.41 14.15
2010-11 142.10 141.20 -0.63
2011-2012 141.88 141.73 -0.10
Table no : Calculation f variance of Kotak Classic Equity Fund 9(Ri-
oYears Ri Ri) (Ri-Ri)2 (Rm-Rm) (Rm-Rm)2 ∑(Ri-Ri) (Rm-Rm) 2007-08 6.42 0.78 0.608 2.3 5.29 1.79 2008-09 8.40 2.76 7.61 -1.74 3.02 -4.80 2009-10 14.15 8.51 72.42 4.82 23.23 41.01 2010-11 -0.63 -6.27 39.31 8.50 72.25 -53.29 2011-2012 -0.10 -5.74 32.94 -13.87 192.37 79.61 Total 28.24 152.88 296.16 64.32
Ri = ∑Ri / N
= 28.24 / 5
= 5.64
σi2 = ∑ (Ri-Ri) 2 / n-1
= 152.88 / 4
= 38.22
Systematic Risk: βi = ∑ (Ri-Ri) (Rm-Rm) / (Rm-Rm) 2
= 64.32 /296.16 = 0.2171
Unsystematic Risk: σei2 = σi2-βi2σm2
= 38.22 - (0.21712*74.04)
= 38.22 –3.4896
= 34.73
INTERPRETATION:
From the above it is inferred that year 2011 has recorded as low return and high return is recorded in the year 2010.In general
the overall returns are positive. The volatility of the fund is very low as compared to the market
4. SBI Emerging Businesses
Table no 10: NAV and fund return of SBI Emerging Businesses Fund Year NAV Beg NAV End Ri (end-beg)/beg*100
2007-08 86.10 91.10 5.80
2008-09 91.50 96.06 4.98 2009-10 96.88 110.64 14.20
2010-11 111.20 120.53 8.39
2011-2012 121.22 120.45 -0.63

Suresh et al., International Journal of Advance Research in Computer Science and Management Studies Volume 3, Issue 10, October 2015 pg. 1-15
© 2015, IJARCSMS All Rights Reserved ISSN: 2321‐7782 (Online) 8 | P a g e
Table no 11: Calculation of variance of SBI Emerging Businesses Fund
Years Ri (Ri-Ri) (Ri-Ri)2 (Rm-Rm) (Rm-Rm)2 ∑(Ri-Ri)(Rm-Rm) 2007-08 5.80 -0.74 0.547 2.3 5.29 -1.70 2008-09 4.98 -1.56 2.43 -1.74 3.02 2.71 2009-10 14.20 7.66 58.67 4.82 23.23 36.92 2010-11 8.39 1.85 3.42 8.50 72.25 15.72 2011-2012 -0.63 -7.17 51.40 -13.87 192.37 99.44 Total 32.74 116.46 296.16 153.09
Ri = ∑Ri / N
=32.74 / 5
= 6.54
σi2 = ∑ (Ri-R⎯i) 2 / n-1
= 116.46/ 4
= 29.115
Systematic Risk: βi = ∑ (Ri-R⎯i) (Rm-R⎯m) / (Rm-R⎯m) 2
= 153.09 / 296.16
= 0.5169
Unsystematic Risk: σei2 = σi2-βi2σm2
= 29.115 - (0.51692*74.04)
= 29.115 – 19.782
= 9.332
INTERPRETATION:
From the above it is inferred that year 2012 has recorded as low return and high return is recorded in the year 2010.In general
the overall returns are positive. The volatility of the fund is very low as compared to the market.
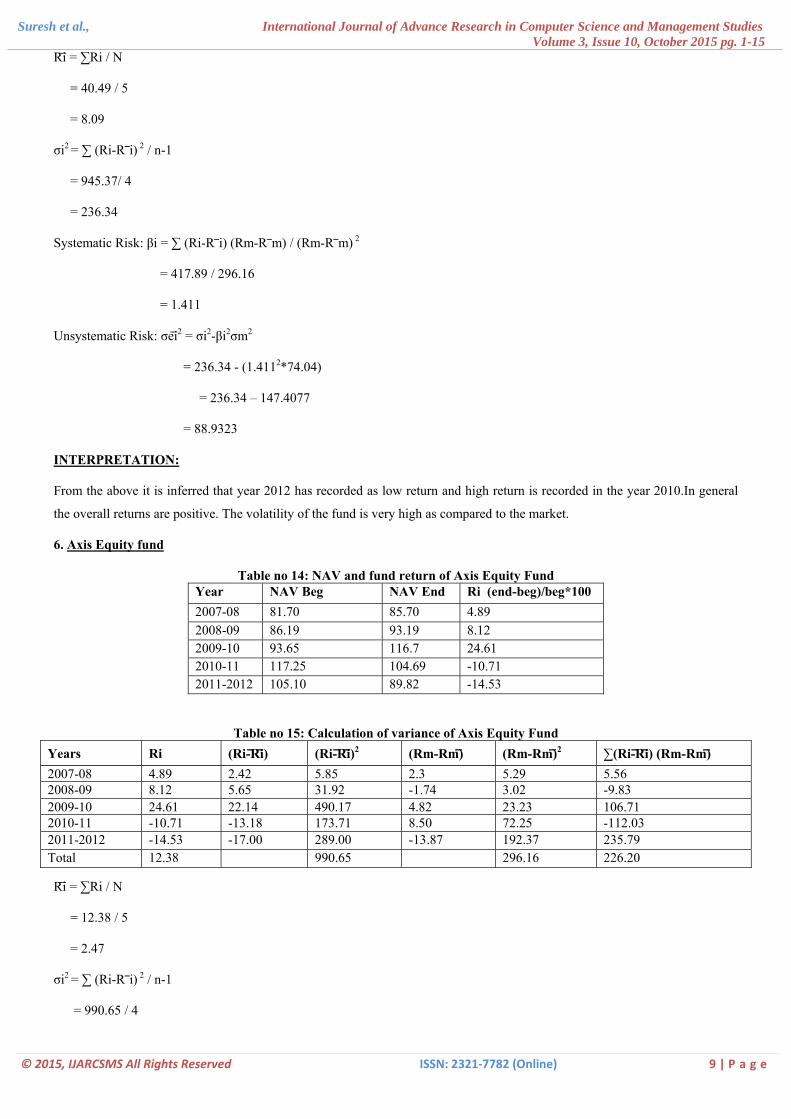
5. Kotak 50 Fund
Table no 12: NAV and fund return of Kotak 50 Fund Year NAV Beg NAV End Ri (end-beg)/beg*100 2007-08 34.80 33.80 -2.87 2008-09 36.30 40.30 11.01 2009-10 40.88 50.88 25.92 2010-11 51.71 61.15 18.25 2011-2012 61.95 54.64 -11.80
Table no 13: Calculation of variance of Kotak 50 Fund Years Ri (Ri-Ri) (Ri-Ri)2 (Rm-Rm) (Rm-Rm)2 ∑(Ri-Ri)(Rm-Rm)
2007-08 -2.87 -10.96 120.12 2.3 5.29 -25.20
2008-09 11.01 2.92 8.52 -1.74 3.02 -5.08
2009-10 25.92 17.83 317.90 4.82 23.23 85.94
2010-11 18.25 10.16 103.22 8.50 72.25 86.36
2011-2012 -11.80 -19.89 395.61 -13.87 192.37 275.87 Total 40.49 945.37 296.16 417.89
Suresh et al., International Journal of Advance Research in Computer Science and Management Studies Volume 3, Issue 10, October 2015 pg. 1-15
© 2015, IJARCSMS All Rights Reserved ISSN: 2321‐7782 (Online) 9 | P a g e
Ri = ∑Ri / N
= 40.49 / 5
= 8.09
σi2 = ∑ (Ri-R⎯i) 2 / n-1
= 945.37/ 4
= 236.34
Systematic Risk: βi = ∑ (Ri-R⎯i) (Rm-R⎯m) / (Rm-R⎯m) 2
= 417.89 / 296.16
= 1.411
Unsystematic Risk: σei2 = σi2-βi2σm2
= 236.34 - (1.4112*74.04)
= 236.34 – 147.4077
= 88.9323
INTERPRETATION:
From the above it is inferred that year 2012 has recorded as low return and high return is recorded in the year 2010.In general
the overall returns are positive. The volatility of the fund is very high as compared to the market.
6. Axis Equity fund
Table no 14: NAV and fund return of Axis Equity Fund Year NAV Beg NAV End Ri (end-beg)/beg*100 2007-08 81.70 85.70 4.89 2008-09 86.19 93.19 8.12 2009-10 93.65 116.7 24.61 2010-11 117.25 104.69 -10.71 2011-2012 105.10 89.82 -14.53
Table no 15: Calcul on of variance of ty Fund ati Axis EquiYears Ri (Ri-Ri) (Ri-Ri)2 (Rm-Rm) (Rm-Rm)2 ∑(Ri-Ri) (Rm-Rm) 2007-08 4.89 2.42 5.85 2.3 5.29 5.56 2008-09 8.12 5.65 31.92 -1.74 3.02 -9.83 2009-10 24.61 22.14 490.17 4.82 23.23 106.71 2010-11 -10.71 -13.18 173.71 8.50 72.25 -112.03 2011-2012 -14.53 -17.00 289.00 -13.87 192.37 235.79 T tal o 12.38 990.65 296.16 226.20
Ri = ∑Ri / N
= 12.38 / 5
= 2.47
σi2 = ∑ (Ri-R⎯i) 2 / n-1
= 990.65 / 4

Suresh et al., International Journal of Advance Research in Computer Science and Management Studies Volume 3, Issue 10, October 2015 pg. 1-15
© 2015, IJARCSMS All Rights Reserved ISSN: 2321‐7782 (Online) 10 | P a g e
= 247.66
Systematic Risk: βi = ∑ (Ri-R⎯i) (Rm-R⎯m) / (Rm-R⎯m) 2
= 226.20 / 296.16
= 0.7637
Unsystematic Risk: σei2 = σi2-βi2σm2
= 247.66 - (0.76372*74.04)
= 247.66– 43.1829
= 204.47
INTERPRETATION:
From the above it is inferred that year 2012 has recorded as low return and high return is recorded in the year 2010.In general
the overall returns are positive. The volatility of the fund is low as compared to the market.
7. Tata Equity Management Fund
Table no 16: NAV and fund return of TATA Equity Management Fund Year NAV Beg NAV End Ri (end-beg)/beg*100 2007-08 93.8 97.8 4.26 2008-09 98.12 116.01 18.23 2009-10 116.90 128.33 9.77 2010-11 128.88 147.21 14.22 2011-2012 147.60 138.23 -6.34
Table no 17: Calculati n of variance of TATA Equity Management Fund o
Years Ri (Ri-Ri) (Ri-Ri)2 (Rm-Rm) (Rm-Rm)2 ∑(Ri-Ri) (Rm-Rm)
2007-08 4.26 -3.74 14.13 2.3 5.29 -8.64 2008-09 18.23 10.21 104.24 -1.74 3.02 -17.76 2009-10 9.77 1.75 3.06 4.82 23.23 8.43 2010-11 14.22 6.20 38.44 8.50 72.25 52.7 2011-2012 -6.34 -14.36 206.20 -13.87 192.37 199.17 Total 40.14 366.07 296.16 233.90
Ri = ∑Ri / N
= 40.14 / 5
= 8.02
σi2 = ∑ (Ri-R⎯i) 2 / n-1
= 366.07 / 4
= 91.51
Systematic Risk: βi = ∑ (Ri-R⎯i) (Rm-R⎯m) / (Rm-R⎯m) 2
= 233.90 / 296.16
= 0.7897
Unsystematic Risk: σei2 = σi2-βi2σm2
= 91.51 - (0.78972*74.04)

Suresh et al., International Journal of Advance Research in Computer Science and Management Studies Volume 3, Issue 10, October 2015 pg. 1-15
© 2015, IJARCSMS All Rights Reserved ISSN: 2321‐7782 (Online) 11 | P a g e
= 91.51 – 46.17
= 45.34
INTERPRETATION:
From the above it is inferred that year 2012 has recorded as low return and high return is recorded in the year 2009.In general
the overall returns are positive. The volatility of the fund is low as compared to the market.
8. UTI India Lifestyle Fund
Table no. 18: NAV and fund return of UTI India Lifestyle Fund Year NAV Beg NAV End Ri (end-beg)/beg*100 2007-08 95.23 101.02 6.08 2008-09 101.80 112.75 10.75 2009-10 113.05 135.95 20.25 2010-11 136.15 150.02 10.18 2011-2012 150.95 161.05 6.69
Table no 19: Calculation of variance of UTI India Lifestyle Fund
Years Ri (Ri-Ri) (Ri-Ri)2 (Rm-Rm) (Rm-Rm)2 ∑(Ri-Ri) (Rm-Rm)
2007-08 6.08 -4.71 22.18 2.3 5.29 -10.83 2008-09 10.75 -0.04 0.0016 -1.74 3.02 0.069 2009-10 20.25 9.46 89.49 4.82 23.23 45.59 2010-11 10.18 -0.61 0.372 8.50 72.25 -5.18 2011-2012 6.69 -4.1 16.81 -13.87 192.37 56.86 Total 53.95 128.85 296.16 86.509
Ri = ∑Ri / N
= 53.95/ 5
= 10.79
σi2 = ∑ (Ri-R⎯i) 2 / n-1
= 128.85 / 4
= 32.21
Systematic Risk: βi = ∑ (Ri-R⎯i) (Rm-R⎯m) / (Rm-R⎯m) 2
= 85.509 / 296.16
= 0.2921
Unsystematic Risk: σei2 = σi2-βi2σm2
= 85.509 - (0.29212*74.04)
= 85.509 – 6.3172
= 25.89
INTERPRETATION:
From the above it is inferred that year 2008 has recorded as low return and high return is recorded in the year 2010.In general
the overall returns are positive. The volatility of the fund is very low as compared to the market.
Suresh et al., International Journal of Advance Research in Computer Science and Management Studies Volume 3, Issue 10, October 2015 pg. 1-15
© 2015, IJARCSMS All Rights Reserved ISSN: 2321‐7782 (Online) 12 | P a g e
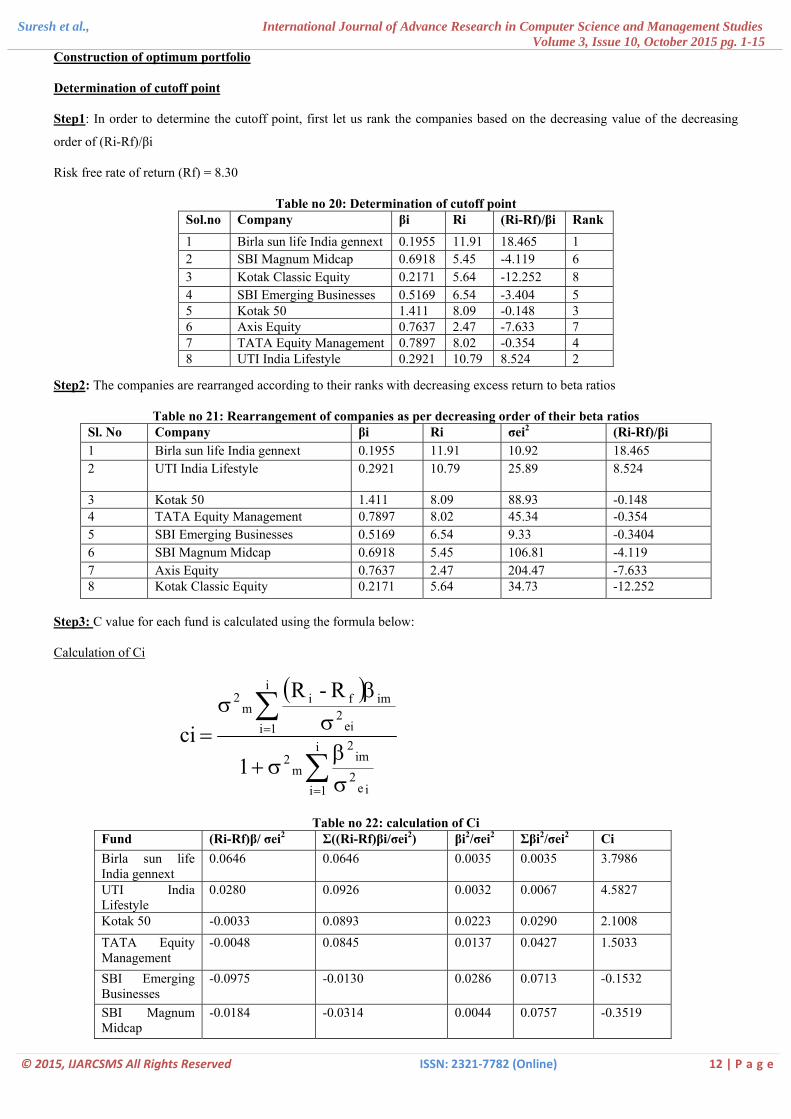
Construction of optimum portfolio
Determination of cutoff point
Step1: In order to determine the cutoff point, first let us rank the companies based on the decreasing value of the decreasing
order of (Ri-Rf)/βi
Risk free rate of return (Rf) = 8.30
Table no 20: Determination of cutoff point Sol.no Company βi Ri (Ri-Rf)/βi Rank
1 Birla sun life India gennext 0.1955 11.91 18.465 1 2 SBI Magnum Midcap 0.6918 5.45 -4.119 6 3 Kotak Classic Equity 0.2171 5.64 -12.252 8 4 SBI Emerging Businesses 0.5169 6.54 -3.404 5 5 Kotak 50 1.411 8.09 -0.148 3 6 Axis Equity 0.7637 2.47 -7.633 7 7 TATA Equity Management 0.7897 8.02 -0.354 4 8 UTI India Lifestyle 0.2921 10.79 8.524 2
Step2: The companies are rearranged according to their ranks with decreasing excess return to beta ratios
Table no 21: Rearrangement of companies as per decreasing order of their beta ratios Sl. No Company βi Ri σei2 (Ri-Rf)/βi 1 Birla sun life India gennext 0.1955 11.91 10.92 18.465 2 UTI India Lifestyle
0.2921 10.79 25.89 8.524
3 Kotak 50 1.411 8.09 88.93 -0.148 4 TATA Equity Management 0.7897 8.02 45.34 -0.354 5 SBI Emerging Businesses 0.5169 6.54 9.33 -0.3404 6 SBI Magnum Midcap 0.6918 5.45 106.81 -4.119 7 Axis Equity 0.7637 2.47 204.47 -7.633 8 Kotak Classic Equity 0.2171 5.64 34.73 -12.252
Step3: C value for each fund is calculated using the formula below:
Calculation of Ci
( )
∑
∑=
βσ+
σ
= σ
βσ
=i
im2
2
i
1i ei2
imfim
2
1
R-R
ci
1i ie2m
Table no 22: calculation of Ci Fund (Ri-Rf)β/ σei2 Σ((Ri-Rf)βi/σei2) βi2/σei2 Σβi2/σei2 Ci Birla sun life India gennext
0.0646 0.0646 0.0035 0.0035 3.7986
UTI India Lifestyle
0.0280 0.0926 0.0032 0.0067 4.5827
Kotak 50 -0.0033 0.0893 0.0223 0.0290 2.1008 TATA Equity Management
-0.0048 0.0845 0.0137 0.0427 1.5033
SBI Emerging Businesses
-0.0975 -0.0130 0.0286 0.0713 -0.1532
SBI Magnum Midcap
-0.0184 -0.0314 0.0044 0.0757 -0.3519
Suresh et al., International Journal of Advance Research in Computer Science and Management Studies Volume 3, Issue 10, October 2015 pg. 1-15
© 2015, IJARCSMS All Rights Reserved ISSN: 2321‐7782 (Online) 13 | P a g e
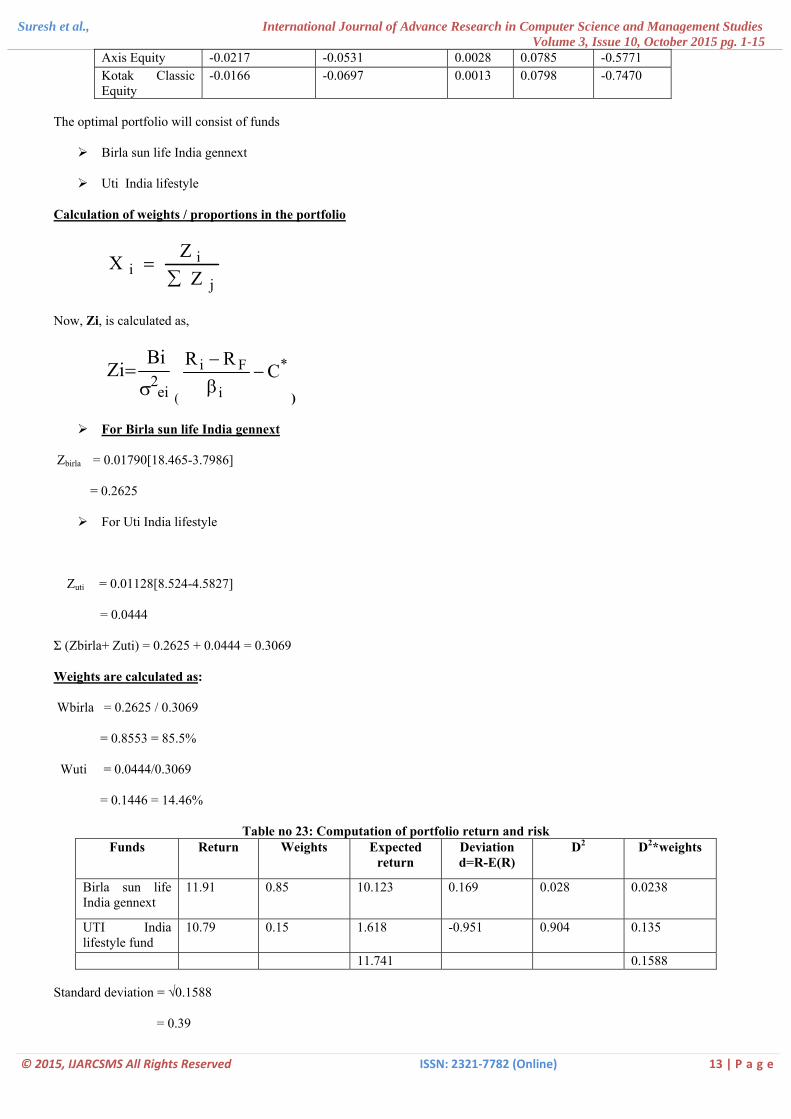
Axis Equity -0.0217 -0.0531 0.0028 0.0785 -0.5771 Kotak Classic Equity
-0.0166 -0.0697 0.0013 0.0798 -0.7470
The optimal portfolio will consist of funds
Birla sun life India gennext
Uti India lifestyle
Calculation of weights / proportions in the portfolio
ji Z∑
iZX =
Now, Zi, is calculated as,
ei2BiZiσ
=(
*
i
Fi CRR
−β−
)
For Birla sun life India gennext
Zbirla = 0.01790[18.465-3.7986]
= 0.2625
For Uti India lifestyle
Zuti = 0.01128[8.524-4.5827]
= 0.0444
Σ (Zbirla+ Zuti) = 0.2625 + 0.0444 = 0.3069
Weights are calculated as:
Wbirla = 0.2625 / 0.3069
= 0.8553 = 85.5%
Wuti = 0.0444/0.3069
= 0.1446 = 14.46%
Table no 23: Computation of portfolio return and risk Funds Return Weights Expected
return Deviation d=R-E(R)
D2 D2*weights
Birla sun life India gennext
11.91 0.85 10.123 0.169 0.028 0.0238
UTI India lifestyle fund
10.79 0.15 1.618 -0.951 0.904 0.135
11.741 0.1588
Standard deviation = √0.1588
= 0.39

Suresh et al., International Journal of Advance Research in Computer Science and Management Studies Volume 3, Issue 10, October 2015 pg. 1-15
© 2015, IJARCSMS All Rights Reserved ISSN: 2321‐7782 (Online) 14 | P a g e
Portfolio return = 11.74%
Portfolio risk = 0.39%
1. The Birla Sun Life India Gennext has the highest return of 18.465% and the Kotak Classic Equity has the lowest return of -
12.25%. If the investor wants to earn a maximum return without considering the risk aspect then investment can be made
on those securities which yield high returns. Even though the return is high, the risk involved in the stock return should be
considered while taking investment decisions.
2. The risk can be reduced if the portfolio is diversified. The point of diversity is to achieve a given level of expected return
while bearing the least possible risk.
VI. CONCLUSION
Mutual fund is booming sector now a days and it has lot of scope to generate income and providing return to the investor,
the mutual fund is one of the way to development of country and helps to mobilizing dead money in the economy which helps
to develop the economic conditions of the country and people. Mutual fund helps to analyze the market conditions, it providing
lot of opportunities to the people for research work and helps the people to know the new things going on around the world. It
gave the more knowledge to the person, because it diversifies the risk by investing in different securities.
Mutual fund has become one of the important sources for investing. It is quite likely that a more efficient portfolio can be
constructed directly from funds. Thus, the two-step process of choosing an asset allocation based on the information about
benchmark indexes and then choosing funds in each category may be one of the best realistically attainable approaches. To use
this approach to portfolio selection effectively, investors would benefit from estimates of future asset returns, risks and
correlations, as well as from fund management’s disclosure of future asset exposures and appropriate benchmarks.
The investor should invest in a fund which has good net asset value and good performance history with respect to NAV.
The outcome of the fund is derived by studying the periodical movements of fund’s net asset value and by comparing the fund’s
performance over their respective benchmarks for the specified period. It was traced that the funds, which embarked lower risk,
did not always validate lower returns or vice versa. This states that the risks and return need not always be in a beeline or point-
blank relationship.
References
1. Dileep, S. & Kesava Rao, G.V. (2013), “A Study on Sustainability of William Sharpe’s Single Index Model”, IJAMBU,1 (1), pp: 48-54.
2. Gopalakrishna Muthu, M. (2014), “Optimal Portfolio Selection using Sharpe’s Single Index Model”, Indian Journal of Applied Research, 4(1), pp: 286-288.
3. Kumar, Arun S. S. and Manjunatha K. (2013), “ A Study on Construction of Optimal Portfolio using Sharpe’s Single Index Model”, International Journal of Research in Commerce, IT and Management, 3 (4), pp: 88-98.
4. Mandal, Niranjan (2013), “Sharpe’s Single Index Model & its Application to Construct Optimal Portfolio: An Empirical Study”, Great Lake Herald, 7 (1), pp: 1-19.
10
10.5
11
11.5
12
Birla sun life India gennext UTI India lifestyle fund
Return of Portfolio
Return

Suresh et al., International Journal of Advance Research in Computer Science and Management Studies Volume 3, Issue 10, October 2015 pg. 1-15
© 2015, IJARCSMS All Rights Reserved ISSN: 2321‐7782 (Online) 15 | P a g e
Websites:
1. www.moneycontrol.com 2. www.kotakmutual.com 3. www.valuesearchonline.com 4. www.nseindia.com 5. www.amfindia.com