Research Article Risk Prediction of One-Year...
11
Research Article Risk Prediction of One-Year Mortality in Patients with Cardiac Arrhythmias Using Random Survival Forest Fen Miao, 1,2 Yun-Peng Cai, 1 Yu-Xiao Zhang, 3 Ye Li, 1 and Yuan-Ting Zhang 1,4 1 Key Laboratory for Health Informatics of the Chinese Academy of Sciences (HICAS), Shenzhen Institutes of Advanced Technology, Shenzhen 518055, China 2 Shenzhen College of Advanced Technology, University of Chinese Academy of Sciences, Beijing 100049, China 3 Department of Senile Cardiovascular Medicine, e General Hospital of the People’s Liberation Army, Beijing 100853, China 4 Joint Research Centre for Biomedical Engineering, Department of Electronic Engineering, Chinese University of Hong Kong, Shatin 00852, Hong Kong Correspondence should be addressed to Yuan-Ting Zhang; [email protected] Received 18 March 2015; Revised 26 June 2015; Accepted 28 July 2015 Academic Editor: Zoran Bursac Copyright © 2015 Fen Miao et al. is is an open access article distributed under the Creative Commons Attribution License, which permits unrestricted use, distribution, and reproduction in any medium, provided the original work is properly cited. Existing models for predicting mortality based on traditional Cox proportional hazard approach (CPH) oſten have low prediction accuracy. is paper aims to develop a clinical risk model with good accuracy for predicting 1-year mortality in cardiac arrhythmias patients using random survival forest (RSF), a robust approach for survival analysis. 10,488 cardiac arrhythmias patients available in the public MIMIC II clinical database were investigated, with 3,452 deaths occurring within 1-year followups. Forty risk factors including demographics and clinical and laboratory information and antiarrhythmic agents were analyzed as potential predictors of all-cause mortality. RSF was adopted to build a comprehensive survival model and a simplified risk model composed of 14 top risk factors. e built comprehensive model achieved a prediction accuracy of 0.81 measured by c-statistic with 10-fold cross validation. e simplified risk model also achieved a good accuracy of 0.799. Both results outperformed traditional CPH (which achieved a c-statistic of 0.733 for the comprehensive model and 0.718 for the simplified model). Moreover, various factors are observed to have nonlinear impact on cardiac arrhythmias prognosis. As a result, RSF based model which took nonlinearity into account significantly outperformed traditional Cox proportional hazard model and has great potential to be a more effective approach for survival analysis. 1. Introduction Cardiac arrhythmias are defined as a group of conditions in which the electrical activity of the heart is irregular or faster or slower than normal [1]. Some arrhythmias are life- threatening and would result in sudden cardiac death if not treated in time. It is one of the most common causes of death when travelling to a hospital. A major challenge in the management of arrhythmias in hospital is the availability of reliable prognostic models that enable patients and physicians to have a realistic expectation of prognosis and to guide treat- ment options including medical treatment, use of devices, more intense monitoring, or end-of-life care. In addition, getting insights into which factors relate to poor outcome may help the physicians adopt appropriate medical treatments. Until now, several models for predicting different kinds of cardiovascular diseases outcome such as heart failure (HF) and coronary heart diseases have been developed using data from clinical trials or observational studies [2–6]. In addition, several risk models for mortality in community were reviewed by Kwok et al. in [7]. However, researches on morality prediction for cardiac arrhythmias patients are still very rare as presented by Hinkle Jr. et al. [8]. In addi- tion, most risk models presented above are based on multi- variable Cox proportional hazard regression (CPH), which was proposed by Cox [9]. CPH is an intuitive and popular survival model by illustrating the importance of each variable and its relationship with a regression coefficient. However, proportional methods suffer from high variance and poor performance as demonstrated by Breiman [10, 11] as solving Hindawi Publishing Corporation Computational and Mathematical Methods in Medicine Volume 2015, Article ID 303250, 10 pages http://dx.doi.org/10.1155/2015/303250
Transcript of Research Article Risk Prediction of One-Year...

Research ArticleRisk Prediction of One-Year Mortality in Patients withCardiac Arrhythmias Using Random Survival Forest
Fen Miao,1,2 Yun-Peng Cai,1 Yu-Xiao Zhang,3 Ye Li,1 and Yuan-Ting Zhang1,4
1Key Laboratory for Health Informatics of the Chinese Academy of Sciences (HICAS), Shenzhen Institutes of Advanced Technology,Shenzhen 518055, China2Shenzhen College of Advanced Technology, University of Chinese Academy of Sciences, Beijing 100049, China3Department of Senile Cardiovascular Medicine, The General Hospital of the People’s Liberation Army, Beijing 100853, China4Joint Research Centre for Biomedical Engineering, Department of Electronic Engineering, Chinese University of Hong Kong,Shatin 00852, Hong Kong
Correspondence should be addressed to Yuan-Ting Zhang; [email protected]
Received 18 March 2015; Revised 26 June 2015; Accepted 28 July 2015
Academic Editor: Zoran Bursac
Copyright © 2015 Fen Miao et al.This is an open access article distributed under theCreative CommonsAttribution License, whichpermits unrestricted use, distribution, and reproduction in any medium, provided the original work is properly cited.
Existing models for predicting mortality based on traditional Cox proportional hazard approach (CPH) often have low predictionaccuracy.This paper aims to develop a clinical riskmodel with good accuracy for predicting 1-year mortality in cardiac arrhythmiaspatients using random survival forest (RSF), a robust approach for survival analysis. 10,488 cardiac arrhythmias patients availablein the public MIMIC II clinical database were investigated, with 3,452 deaths occurring within 1-year followups. Forty risk factorsincluding demographics and clinical and laboratory information and antiarrhythmic agents were analyzed as potential predictors ofall-cause mortality. RSF was adopted to build a comprehensive survival model and a simplified risk model composed of 14 top riskfactors.The built comprehensive model achieved a prediction accuracy of 0.81 measured by c-statistic with 10-fold cross validation.The simplified risk model also achieved a good accuracy of 0.799. Both results outperformed traditional CPH (which achieveda c-statistic of 0.733 for the comprehensive model and 0.718 for the simplified model). Moreover, various factors are observedto have nonlinear impact on cardiac arrhythmias prognosis. As a result, RSF based model which took nonlinearity into accountsignificantly outperformed traditional Cox proportional hazard model and has great potential to be a more effective approach forsurvival analysis.
1. Introduction
Cardiac arrhythmias are defined as a group of conditionsin which the electrical activity of the heart is irregular orfaster or slower than normal [1]. Some arrhythmias are life-threatening and would result in sudden cardiac death if nottreated in time. It is one of the most common causes ofdeath when travelling to a hospital. A major challenge in themanagement of arrhythmias in hospital is the availability ofreliable prognosticmodels that enable patients andphysiciansto have a realistic expectation of prognosis and to guide treat-ment options including medical treatment, use of devices,more intense monitoring, or end-of-life care. In addition,getting insights intowhich factors relate to poor outcomemayhelp the physicians adopt appropriate medical treatments.
Until now, several models for predicting different kindsof cardiovascular diseases outcome such as heart failure(HF) and coronary heart diseases have been developed usingdata from clinical trials or observational studies [2–6]. Inaddition, several risk models for mortality in communitywere reviewed by Kwok et al. in [7]. However, researcheson morality prediction for cardiac arrhythmias patients arestill very rare as presented by Hinkle Jr. et al. [8]. In addi-tion, most risk models presented above are based on multi-variable Cox proportional hazard regression (CPH), whichwas proposed by Cox [9]. CPH is an intuitive and popularsurvival model by illustrating the importance of each variableand its relationship with a regression coefficient. However,proportional methods suffer from high variance and poorperformance as demonstrated by Breiman [10, 11] as solving
Hindawi Publishing CorporationComputational and Mathematical Methods in MedicineVolume 2015, Article ID 303250, 10 pageshttp://dx.doi.org/10.1155/2015/303250

2 Computational and Mathematical Methods in Medicine
the model is very complex, especially for those involvingmultiple variables and further more nonlinear effects cannotbe modeled. Fox example, considerable controversy is stillunsettled regarding the precise association of body massindex (BMI) with prognosis. Even though BMI is oftenconsidered with poor survival in general population, someresearchers such as Uretsky et al. have identified a possibleobesity paradox among patients with heart disease in whichincreased body mass predicts better survival using univariateCPH [12]. The above results are biased due to a linearassumption between BMI and mortality and not consideringthe interaction between BMI and some other factors. There-fore, complex patterns about possible reverse causation inunderweight individuals, including interactions with smok-ing and an unclear inflection point at which increasing bodymass leads to increased risk, were noted by Adams, Flegal,and Fontaine et al. [13–15] through manually adding theinteractions between BMI and other factors or subdivisionof the population into different small groups. However, allof the methods mentioned above are from a subjective pointof view. Random survival forests (RSF) modeling, a directextension of random forest for survival analysis, is proposedby Ishwaran et al. [16] to handle the above difficulties byautomatically assessing the complex effects and interactionsamong all variables from objective view, that is, following theinherent relationship between any factors and the predictiveresult. Ishwaran et al. also demonstrated that RSF has anotheradvantage of insensitivity to noise brought by missing valuesor error data [16]. Thus, it has been used in several riskmodels for different kinds of diseases such as heart failure[17] by Hsich et al. and breast cancer [18] by Omurlu et al.The results show that the RSF model can identify complexinteractions among multiple variables and performed betterthan traditional CPH model. Therefore, the aim of our studyis to identify important risk factors and their complex effectsonmortality and develop an available mortality risk model incardiac arrhythmias patients using RSF.
2. Material and Methods
2.1. Study Population. Our study is based on the publicMIMIC II (Multi-Parameter Intelligent Monitoring in Inten-sive Care) clinical database [19, 20], which contains com-prehensive clinical data including results of laboratory tests,medications, ICD9 diagnoses, and more obtained from hos-pital medical information systems, for 32,536 ICU patients.The data were collected over a seven-year period, beginningin 2001, from a variety of ICUs (medical, surgical, coronarycare, and neonatal), in Boston’s Beth Israel Deaconess Med-ical Center (BIDMC). We defined the patients with cardiacarrhythmias according to ninth revision of the internationalclassification of diseases (ICD9) adopted in the database withICD9 of 427. We define the start point of each patient asthe time of ICU admission and the end point as the deathtime in the hospital or 365 days after the start point. Usingthis approach, 10,488 patients with cardiac arrhythmias wereextracted to establish the predictive model, during which3,452 deaths occurred in hospital or after discharge over 1-year follow-up period for each patient.
2.2. Study Variables. Potential clinical variables previouslyreported to be associatedwithmortalitywere evaluated in ourstudy.The following 40 variables were assessed for prognosticvalue: demographics including age, sex, and BMI, clinicalvariables such as arrhythmias type (CA,VF,VT,AF, and otherslow arrhythmias), valvular heart diseases, renal failure, andCHF, laboratory variables with missing value less than 20%,including glucose, NA, K, SCR, BUN, RBC, WBC, PT, PTT,INR, BR, AST, ALT, and CKPK, and antiarrhythmic agentsincluding class I, class II, class III, class IV, and class V agents(as listed in Table 1). All of the clinical variables are binaryand defined as 1 if the patient suffers from this disease atthe admission time, otherwise defined as 0. The laboratoryvariables are real-valued numbers measured at the admissiontime to the ICU and the measurement scales for all variablesare presented in Table 1.Themedicationwas defined as 1 if thepatient was prescribedwith and took this kind ofmedicationsduring the ICU stay.
2.3. Statistical Analysis with Random Survival Forest. In ourstudy, continuous variables such as age, BMI, SCR, and BUNwere log-transformed before analysis to eliminate the taileffect brought by larger or smaller value. Random survivalforest [16], a new extension of random forest for survival anal-ysis, was implemented in our study to establish predictionmodels in the following ways:
(1) B bootstrap samples are randomly extracted fromthe original dataset, with each bootstrap sample pre-cluding an average 37% of the data, that is, out-of-bagdata (OOB data). B is defined as 1000 in our study.
(2) A survival tree is grown for each bootstrap sample todevelop a comprehensive model composed of all 40variables. 6 candidate variables are randomly selectedfor each node based on the rule defined in [16]. Thecandidate variable with the ability of maximizing thesurvival difference between child nodes is selected tosplit the node.
(3) Every tree was grown to full size until each leaf nodeis with less than 𝑑
0> 0 unique deaths. In our study,
𝑑0is set to be 3.
(4) Select predictive variables by filtering on the basis ofminimal depth, that is, the minimum distance fromthe trunk to the branch level of the nearest maximumsubtree, which is the largest subtree whose root nodesplits on the variable. The smaller the minimal depthis, the more impact the variable has on prediction.
(5) Construct a simplified survival forest of 1000 survivaltrees based on the predictive variables selected aboveto get an optimized model with fewer variables.
(6) The cumulative hazard function for each terminalnode in a grown tree is estimated by Nelson-Aalenestimator [21]. Drop each case 𝑋
𝑖in the validation
dataset down the grown tree; its cumulative hazardfunction is the Nelson-Aalen estimator [21] for thecase’s falling terminal node. The individual hazardsare then averaged to compute the cumulative hazard

Computational and Mathematical Methods in Medicine 3
Table 1: Baseline characteristics of dead and alive patients during one-year followup.
Characteristics Dead Alive 𝑃 value𝑁 3452 7036Demographics
Age, years 75.32 (12.84) 71.94 (23.596) <0.001Gender, male 59% 57% 0.1BMI, kg/m2 22.76 (102) 33.48 (2588) <0.001
Clinical variablesArrhythmias typeCA 518 (15%) 352 (5%) <0.001VF 138 (4%) 211 (3%) 0.459VT 390 (11%) 844 (12%) 0.095AF 2727 (79%) 5488 (78%) 0.281Slow arrhythmias 276 (8%) 1055 (15%) <0.001
HF 1484 (43%) 2110 (30%) <0.001Myocardial infraction 621 (18%) 1266 (18%) 0.867Bundle branch block 18 (0.5%) 38 (0.6%) 0.168Valvular heart diseases 517 (15%) 915 (13%) 0.088Stroke 424 (12%) 633 (9%) 0.01Hypertension 932 (27%) 2251 (32%) <0.001Acute pulmonary heart disease 79 (2%) 141 (2%) 0.238Chronic pulmonary heart disease 178 (5%) 352 (5%) 0.277Uncomplicated diabetes 690 (20%) 1547 (22%) 0.001Complicated diabetes 242 (7%) 352 (5%) 0.001Hypothyroidism 345 (10%) 704 (10%) 0.143Renal failure 483 (14%) 422 (6%) <0.001Liver disease 138 (4%) 141 (2%) <0.001
Laboratory variablesK, mEq/L 4.81 (0.89) 4.96 (0.94) <0.001NA, mEq/L 139.21 (4.25) 138.85 (2.93) <0.001WBC, K/𝜇L 19.79 (13.88) 16.1 (8.13) <0.001RBC, K/𝜇L 4.09 (0.75) 4.15 (0.58) <0.001ALT, IU/L 185.57 (659) 87.54 (372) <0.001AST, IU/L 345.31 (1388) 125.49 (631) <0.001CKPK, IU/L 711.67 (4944) 532.99 (2061) 0.017SCR, mg/dL 2.49 (2.03) 1.8 (1.76) <0.001BUN, mg/dL 56.64 (34.15) 38.68 (26.22) <0.001Glucose, mg/dL 196.91 (85.41) 187.57 (58.71) <0.001PT, seconds 22.97 (15.88) 20.78 (12.69) <0.001INR 3.29 (5.49) 2.49 (2.88) <0.001PTT, seconds 75.79 (47.99) 69.10 (43.64) <0.001BR, mg/dL 2.08 (4.66) 1.09 (2.02) <0.001
MedicationsClass I agents 86 (2.4%) 112 (1.6%) 0.006Class II agents 2481 (72%) 5366 (76%) <0.001Class III agents 153 (4.4%) 781 (11%) <0.001Class IV agents 810 (23%) 1205 (17%) <0.001Class V agents 2255 (65%) 4622 (66%) 0.716

4 Computational and Mathematical Methods in Medicine
function for each tree. The ensemble cumulativehazard function is then obtained by averaging thecumulative hazard functions for all of the grown trees.Nelson-Aalen estimator was also used for comparisonbetween estimated and real cumulative hazard func-tions for the validation dataset.
(7) Prediction error is calculated based on Harrell c-statistics [22] for the ensemble cumulative hazardfunction, with the 𝑏th value being the error rate forthe ensemble computed using the first 𝑏 trees. Themethod to calculate variable importance (VIMP) fora variable 𝑥 is presented in [16].
To demonstrate the effectiveness of the RSF based models,Cox proportional hazards models were then used for com-paring and evaluating the basic association between potentialrisk factors and mortality [23], with Wald tests for signifi-cance testing. Cross validation [24] was employed to validatethe proposed models. In 𝑘-fold cross validation, the originaldataset is randomly divided into 𝑘 equal-size subsets witha single subset as the validation dataset and the remaining𝑘 − 1 subsets as the training datasets. The cross validationprocess is repeated 𝑘 times. The results from the 𝑘 processesare averaged to produce a single estimation. As 10-fold crossvalidation is commonly used in most of situations, it was alsoused in our study to optimize the prediction performance.
All analyses were carried out with R version 3.0.1. RSFwasimplemented based on the “RandomSurvivalForest” package,which can be accessed from the public R software packagesfreely.
2.4. Baseline Characteristics of the Study Cohort. Thebaselinecharacteristics of alive and dead patients one year afterpresenting cardiac arrhythmias of the study cohort are shownin Table 1. During a followup of 1 year for each patient, 3452individuals died, while 7036 were censored. The mean agefor those who died within one year was 75.32 ± 12.84 and71.94 ± 23.6 for patients that remained alive. From Table 1we can see that demographics and clinical risk factors suchas age, BMI, CA, slow arrhythmias, CHF, and stroke weresignificantly different between alive and dead patients. Alllaboratory results were also significantly different betweenalive and dead patients. With the exception of class V agents,all antiarrhythmic agents were significantly different betweenalive and dead patients.
3. Results
3.1. Model Validation. To validate the performance of pro-posed risk models, prediction ability in terms of c-statisticwith 10-fold cross validation was used in our study. The c-statistics for different models (comprehensive model versussimplified model) with different methods (RSF versus CPH)are presented in Table 2. From the table we can see that theRSF can improve the discrimination ability greatly for bothcomprehensive model and simplified model with high signif-icance level (c-statistic of 0.81 versus 0.733 for comprehensivemodel and 0.799 versus 0.718 for simplified model with 10-fold cross validation). In addition, the proposed simplified
Table 2:C-statistics for comprehensivemodel and simplifiedmodelwith different methods.
Model MethodRSF CPH 𝑃 value
Comprehensive model 0.810 0.733<0.01
Simplified model 0.799 0.718
VariablesM
inim
al d
epth
1 2 3 4 5 6 7 8 9 10 11 12 13 14 15 16 1718 19 202122 2324 25
26 27 2829 30 31
3233
34
3536
37
3839
40
15
10
5
0 10 20 30 40
Figure 1: Minimal depth from RSF analysis. Horizontal line isthreshold for separating predictive variables that are below the line.The diameter of each circle is in proportion to the forest-averagednumber of maximal subtrees for that variable: 1: cardiac arrest, 2:log of BUN, 3: log of BMI, 4: log of AST, 5: log of age, 6: log ofSCR, 7: log of BR, 8: log of K, 9: log of WBC, 10: log of ALT, 11:log of NA, 12: log of CKPK, 13: class II agents, 14: log of glucose,15: log of INR, 16: CHF, 17: renal failure, 18: log of RBC, 19: logof PTT, 20: class V agents, 21: log of PT, 22: stroke, 23: sex, 24:AF, 25: class IV agents, 26: myocardial infarction, 27: hypertension,28: uncomplicated diabetes, 29: valvular heart disease, 30: slowarrhythmias, 31: VT, 32: VF, 33: hypothyroidism, 34: complicateddiabetes, 35: class III agents, 36: liver disease, 37: chronic pulmonaryheart disease, 38: acute pulmonary heart disease, 39: class I agents,40: bundle branch block.
model can realize good predictive accuracy with limitedvariables based on a c-statistic of 0.799.
3.2. Comprehensive Risk Model Predicting 1-Year Mortalitywith RSF. From the comprehensive RSF analysis with all 40variables, 14 variables were selected to be predictive for 1-yearmortality, including cardiac arrest, BUN, BMI, AST, age, SCR,BR, K, WBC, ALT, NA, CKPK, class II agents, and glucose(the detailedminimal depths of all variables can be seen fromFigure 1, in which 14 predictive variables were separated fromthe remaining nonpredictive variables by the horizontal line).The 6 variables on the extreme left including cardiac arrest,BUN, BMI, AST, age, and SCR are easily seen to be the mostpredictive variables.
3.3. Simplified Model Development for Clinical Application.In order to improve the availability of the proposed model,we reduced the comprehensive models to include the mostimportant 14 risk factors selected from the comprehensiveRSF analysis and developed a simplified model. The errorrates for ensemble cumulative hazard function and VIMP
Computational and Mathematical Methods in Medicine 5
log glucoselog ALTlog NA
ClsIIlog WBC
log CKPKlog AST
log BRlog SCR
log BUNlog BMI
log Klog age
CA
0.010Variable importance
0.0200Number of trees
Erro
r rat
e
400 800
0.28
0.26
0.24
0.22
0.20
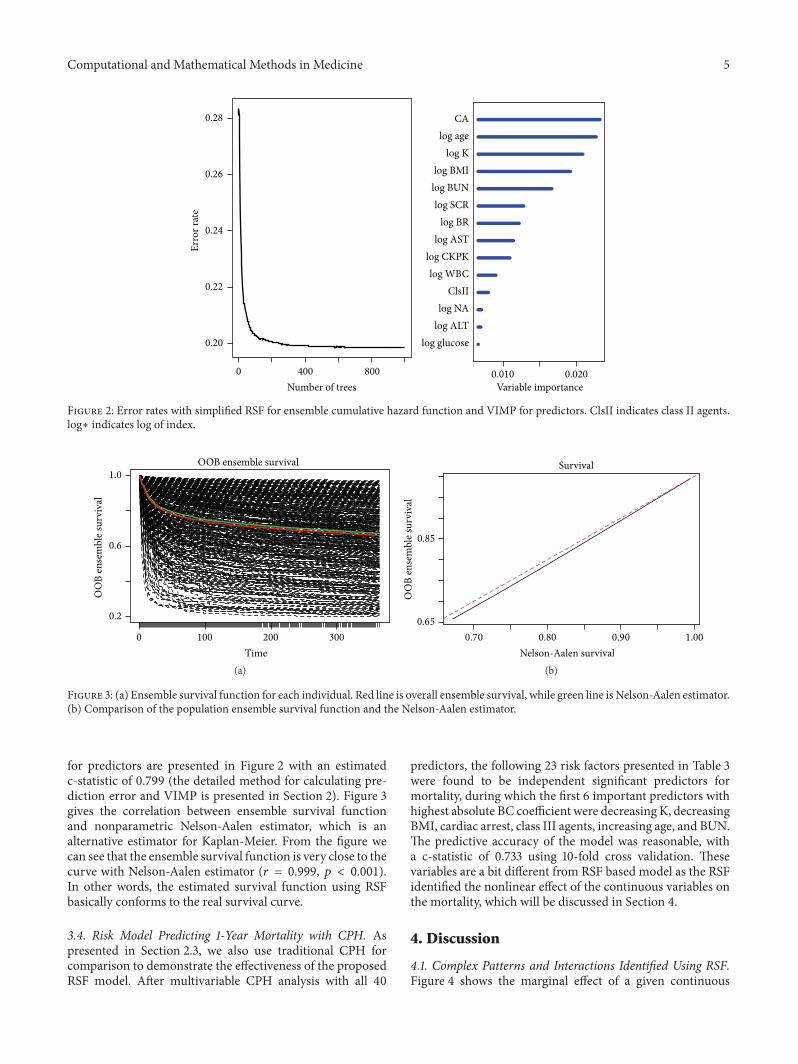
Figure 2: Error rates with simplified RSF for ensemble cumulative hazard function and VIMP for predictors. ClsII indicates class II agents.log∗ indicates log of index.
0 100 200 300Time
OOB ensemble survival
OO
B en
sem
ble s
urvi
val
0.2
0.6
1.0
(a)Nelson-Aalen survival
OO
B en
sem
ble s
urvi
val
Survival
0.65
0.85
0.70 0.80 0.90 1.00
(b)
Figure 3: (a) Ensemble survival function for each individual. Red line is overall ensemble survival, while green line is Nelson-Aalen estimator.(b) Comparison of the population ensemble survival function and the Nelson-Aalen estimator.
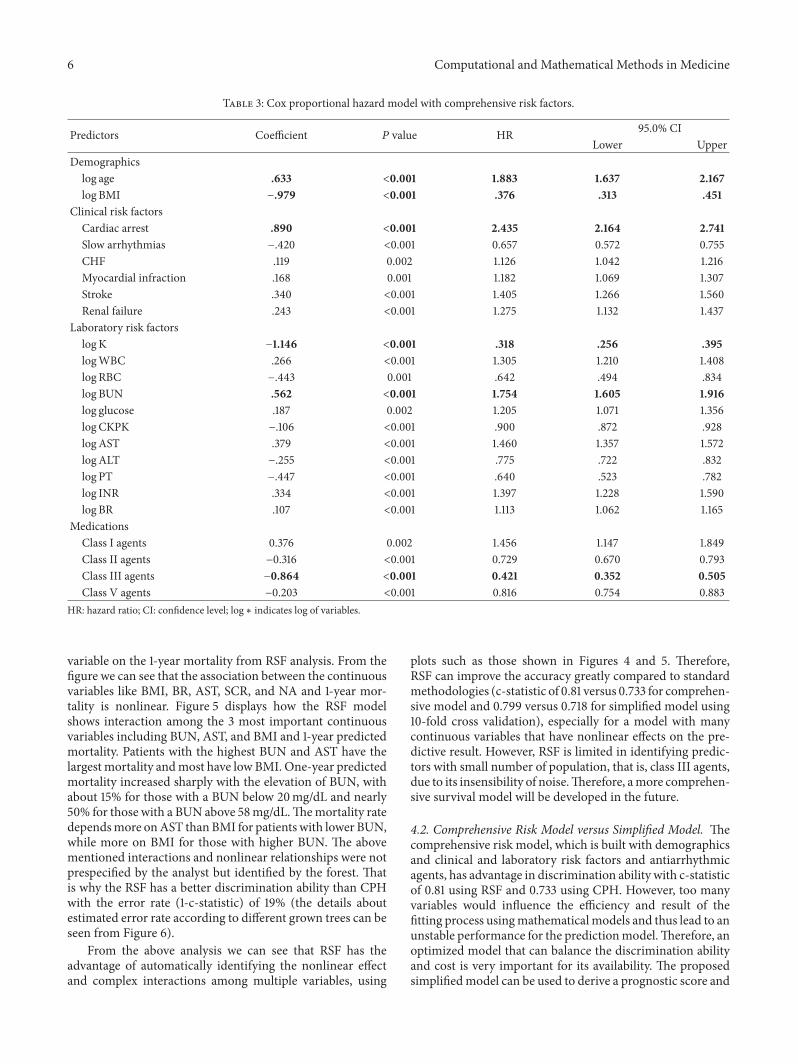
for predictors are presented in Figure 2 with an estimatedc-statistic of 0.799 (the detailed method for calculating pre-diction error and VIMP is presented in Section 2). Figure 3gives the correlation between ensemble survival functionand nonparametric Nelson-Aalen estimator, which is analternative estimator for Kaplan-Meier. From the figure wecan see that the ensemble survival function is very close to thecurve with Nelson-Aalen estimator (𝑟 = 0.999, 𝑝 < 0.001).In other words, the estimated survival function using RSFbasically conforms to the real survival curve.
3.4. Risk Model Predicting 1-Year Mortality with CPH. Aspresented in Section 2.3, we also use traditional CPH forcomparison to demonstrate the effectiveness of the proposedRSF model. After multivariable CPH analysis with all 40
predictors, the following 23 risk factors presented in Table 3were found to be independent significant predictors formortality, during which the first 6 important predictors withhighest absolute BC coefficient were decreasing K, decreasingBMI, cardiac arrest, class III agents, increasing age, and BUN.The predictive accuracy of the model was reasonable, witha c-statistic of 0.733 using 10-fold cross validation. Thesevariables are a bit different from RSF based model as the RSFidentified the nonlinear effect of the continuous variables onthe mortality, which will be discussed in Section 4.
4. Discussion
4.1. Complex Patterns and Interactions Identified Using RSF.Figure 4 shows the marginal effect of a given continuous
6 Computational and Mathematical Methods in Medicine
Table 3: Cox proportional hazard model with comprehensive risk factors.
Predictors Coefficient 𝑃 value HR 95.0% CILower Upper
Demographicslog age .633 <0.001 1.883 1.637 2.167log BMI −.979 <0.001 .376 .313 .451
Clinical risk factorsCardiac arrest .890 <0.001 2.435 2.164 2.741Slow arrhythmias −.420 <0.001 0.657 0.572 0.755CHF .119 0.002 1.126 1.042 1.216Myocardial infraction .168 0.001 1.182 1.069 1.307Stroke .340 <0.001 1.405 1.266 1.560Renal failure .243 <0.001 1.275 1.132 1.437
Laboratory risk factorslogK −1.146 <0.001 .318 .256 .395logWBC .266 <0.001 1.305 1.210 1.408log RBC −.443 0.001 .642 .494 .834log BUN .562 <0.001 1.754 1.605 1.916log glucose .187 0.002 1.205 1.071 1.356logCKPK −.106 <0.001 .900 .872 .928logAST .379 <0.001 1.460 1.357 1.572logALT −.255 <0.001 .775 .722 .832log PT −.447 <0.001 .640 .523 .782log INR .334 <0.001 1.397 1.228 1.590log BR .107 <0.001 1.113 1.062 1.165
MedicationsClass I agents 0.376 0.002 1.456 1.147 1.849Class II agents −0.316 <0.001 0.729 0.670 0.793Class III agents −0.864 <0.001 0.421 0.352 0.505Class V agents −0.203 <0.001 0.816 0.754 0.883
HR: hazard ratio; CI: confidence level; log∗ indicates log of variables.
variable on the 1-year mortality from RSF analysis. From thefigure we can see that the association between the continuousvariables like BMI, BR, AST, SCR, and NA and 1-year mor-tality is nonlinear. Figure 5 displays how the RSF modelshows interaction among the 3 most important continuousvariables including BUN, AST, and BMI and 1-year predictedmortality. Patients with the highest BUN and AST have thelargest mortality andmost have low BMI. One-year predictedmortality increased sharply with the elevation of BUN, withabout 15% for those with a BUN below 20mg/dL and nearly50% for those with a BUN above 58mg/dL.Themortality ratedependsmore onAST thanBMI for patients with lower BUN,while more on BMI for those with higher BUN. The abovementioned interactions and nonlinear relationships were notprespecified by the analyst but identified by the forest. Thatis why the RSF has a better discrimination ability than CPHwith the error rate (1-c-statistic) of 19% (the details aboutestimated error rate according to different grown trees can beseen from Figure 6).
From the above analysis we can see that RSF has theadvantage of automatically identifying the nonlinear effectand complex interactions among multiple variables, using
plots such as those shown in Figures 4 and 5. Therefore,RSF can improve the accuracy greatly compared to standardmethodologies (c-statistic of 0.81 versus 0.733 for comprehen-sive model and 0.799 versus 0.718 for simplified model using10-fold cross validation), especially for a model with manycontinuous variables that have nonlinear effects on the pre-dictive result. However, RSF is limited in identifying predic-tors with small number of population, that is, class III agents,due to its insensibility of noise.Therefore, amore comprehen-sive survival model will be developed in the future.
4.2. Comprehensive Risk Model versus Simplified Model. Thecomprehensive risk model, which is built with demographicsand clinical and laboratory risk factors and antiarrhythmicagents, has advantage in discrimination ability with c-statisticof 0.81 using RSF and 0.733 using CPH. However, too manyvariables would influence the efficiency and result of thefitting process usingmathematicalmodels and thus lead to anunstable performance for the predictionmodel.Therefore, anoptimized model that can balance the discrimination abilityand cost is very important for its availability. The proposedsimplifiedmodel can be used to derive a prognostic score and

Computational and Mathematical Methods in Medicine 7
log BMI
Mor
talit
y
15000
10000
5000
0
2.5 3.0 3.5 4.0
log BUN
Mor
talit
y
15000
10000
5000
0
2 3 4 5
log SCR
Mor
talit
y
15000
10000
5000
0
−1 0 1 2 3
log BR
Mor
talit
y
15000
10000
5000
0
−2 0 1 2 3 4
log AST
Mor
talit
y
15000
10000
5000
0
2 4 6 8 10
log NA
Mor
talit
y
15000
10000
5000
0
4.7 4.9 5.1
Figure 4: Ensemble mortality against given continuous variables. Mortality is presented in terms of total death number. Points colored withblue correspond to events, while black ones correspond to censored observations. log∗ indicates log of index.
to estimate the risk of death with good accuracy (c-statistic of0.799 with 10-fold cross validation) using only 14 risk factorsand thus has great potential to be an optimized risk model ina real-life cohort of ICU patients with cardiac arrhythmias.
4.3. Risk Factors for Mortality in Patients with CardiacArrhythmias. RSF identified cardiac arrest, BUN, BMI, AST,age, SCR, BR, K, WBC, ALT, NA, CKPK, class II agents, andglucose as the 14 predictive factors of survival in the cohort of10,488 ICUpatients with cardiac arrhythmias.These variablesare a bit different from what was found in traditional Coxproportional hazard model analysis, by which SCR and NAare not significant predictors. In fact, both predictors exactnonlinear effects on mortality from the RSF analysis.
For predictors including BR, AST, SCR, and NA, bothsmaller and larger values for the variables would induce highmortality and the same with other continuous predictorssuch as ALT, K, and CKPK. It can be easily understood that
there is a normal range for every laboratory test, too highand too low mean different kinds of abnormal status. Forexample, normal serumNA levels are between approximately135 and 145mEq/L. A serum level of less than 135mEq/Lis generally defined as hyponatremia while it is defined ashypernatremia for more than 145mEq/L. It is demonstrated[25] that the lower the NA level, the higher the risk for themortality. Values above 180mEq/L are demonstrated to beassociated with a high mortality rate, particularly in adults[26]. In addition, we found that the mortality would increasesharply with the elevation of BUN. It was also demonstratedthat elevation BUN is independent predictive for long-termmortality [27] and subsequent mortality in patients withacute coronary syndromes [28].
Predictor BMI exacts complex impact on cardiac arrhyth-mias mortality. From its marginal effect on mortality pre-sented in Figure 4, we can find that mortality decreases in atiny amplitude with an elevation of BMI at lower BMI, andthen with a sharp increase while close to an approximate

8 Computational and Mathematical Methods in Medicine
0.9
0.6
0.3
0.9
0.6
0.3
0.9
0.6
0.3
0.9
0.6
0.3
20 30 40 50 20 30 40 50 20 30 40 50 20
20
30 40 50
BMI (kg/m2) BMI (kg/m2) BMI (kg/m2) BMI (kg/m2)
20 40 60 80
20
40
60
80
AST (IU/L)
BUN
(mg/
dL)
Figure 5: RSF-estimated 1-year mortality as a function of BUN, AST, and BMI. Smoothed curves are computed based on the estimatedmortality for each patient.
point of 25 kg/m2, after which mortality begins to sharplydecrease. It was also demonstrated [29] that, compared tonormal weight (BMI 18–24.9), underweight (BMI < 18)was associated with increased risk of death while overweight(BMI 25–29.9) leads to significantly decreased risk. Inter-estingly, this pattern is highly dependent on BUN levelsfrom their interaction analysis (as presented in Figure 5).For BUN values smaller than 20mg/dL, significantly healthyrenal function, the inflection point pattern is much straighter(subplots on the extreme top side) and becomes sharper andsharper with the elevation of BUN level (subplots from topto bottom). These results validate and add strength to thefindings by Ishwaran et al. [16] using a more important renalfunction index BUN rather than creatinine clearance that therelationship of low BMIwith highmortality depends on renalfunction, and this phenomenon disappeared while the renalfunction improved. In other words, high mortality rate inpatients with low BMI may not due to underweight, but dueto the weight loss accompanied with renal disease.
During five arrhythmias types, cardiac arrest is identifiedas the most important predictor leading to mortality withbothmethods. It is well known that unexpected cardiac arrestcan lead to deathwithinminutes: this is called sudden cardiacdeath (SCD). It was also demonstrated in [30] that suddencardiac arrest exacts a significant mortality with a survival
rate of only 2%. However, ventricular fibrillation, which isconsidered as one of the most emergency arrhythmias andresponsible for nearly 50% of all causes of out-of-hospitalcardiac arrests, is not identified as a predictive variable in ourmodels, perhaps because moderate ventricular fibrillationis reversible if treated in time for ICU patients. It is alsodemonstrated [31] that if patients with in hospital VF weredefibrillated early the survival could be very high.
During five classes of antiarrhythmic agents, class IIagents are identified as the most prevalent medications inarrhythmias patients (nearly 75%) and most effective onprolonging survival times. Even though class I agents are notidentified as predictive in RSF analysis, they would reducesurvival rate in a certain degree from CPH based model.Thisfinding validates the results reported by Echt et al. [32], inwhich class I agents were found to increase mortality insteadof lowering it after myocardial infarction. That is why class Iagents are least used medications (approximately 2% in thedatabase).
5. Conclusion
In this paper, we developed a prognosticmodel that combinesdemographics and clinical and laboratory risk factors andantiarrhythmic agents for predicting the mortality of ICU

Computational and Mathematical Methods in Medicine 9
Number of trees
Erro
r rat
e
0.28
0.24
0.20
0 200 400 600 800 1000
Figure 6: Estimated error rate with comprehensive RSF for differentgrown trees.
patients with cardiac arrhythmias using random survivalforest. The RSF model showed a much better separationof 1-year survivors and nonsurvivors with a c-statistic of0.81 using 10-fold cross validation, compared with 0.733using conventional CPH. In addition, a simplified model wasbuilt based on the most important 14 risk factors and thuspresented to be more applicable in real-life cohort, showinggood separation with c-statistic of 0.799 with RSF and 0.718with CPH. Moreover, several variables that exact nonlineareffects on mortality and with interaction were automaticallyidentified with RSF.Therefore, RSF has been demonstrated tobe a potential effective approach for survival analysis.
The major limitation of our study is that we have notvalidated our models in external cohorts; nevertheless, thereplicability of the result should be sufficient with 10-foldcross validation method. In addition, due to incomplete data,some potential predictors, such as triglyceride (TG) andtotal cholesterol (TC), were not included in the proposedmodel. More comprehensive model can be developed byadding these potential predictors with potentially better dis-crimination performance.
List of Abbreviations
CA: Cardiac arrestVF: Ventricular fibrillationAF: Atrial fibrillationVT: Ventricular tachycardiaK: Potassium [mEq/L] in bloodNA: Sodium [mEq/L] in bloodWBC: Leukocytes [K/𝜇L] in bloodRBC: Erythrocytes [m/𝜇L] in bloodSCR: Creatinine [mg/dL] in serum or plasmaBUN: Urea nitrogen [mg/dL] in serum or plasma
CKPK: Creatine kinase [IU/L] in serum or plasmaAST: Aspartate aminotransferase [IU/L] in
serum or plasmaALT: Alanine aminotransferase [IU/L] in serum
or plasmaPT: Prothrombin time (seconds) in blood by
coagulation assayPTT: Activated partial thromboplastin time (sec-
onds) in blood by coagulation assayINR: International normalized ratio in blood by
coagulation assayGlucose: Glucose [mg/dL] in bloodBR: Total bilirubin [mg/dL] in serum or plasmaBMI: Body mass index (kg/m2)CHF: Congestive heart failureRSF: Random survival forestCPH: Cox proportional hazard model.
Conflict of Interests
The authors declare that they have no conflict of interests.
Acknowledgments
This work was supported in part by the National NaturalScience Foundation of China (no. 61379136), 863 Program(SS2015AA02010), Shenzhen Innovation Funding for Ad-vance Talents (KQCX20130628112914291), the Basic ResearchProgram of Shenzhen (no. JCYJ20130401170306884), and theExternal Cooperation Program of the Chinese Academy ofSciences (GJHZ1212).
References
[1] W. J. Mandel, Ed., Cardiac Arrhythmias: Their Mechanisms,Diagnosis, and Management, Lippincott Williams & Wilkins,3rd edition, 1995.
[2] W. C. Levy, D. Mozaffarian, D. T. Linker et al., “The SeattleHeart Failure Model prediction of survival in heart failure,”Circulation, vol. 113, no. 11, pp. 1424–1433, 2006.
[3] R. Vazquez, A. Bayes-Genis, I. Cygankiewicz et al., “TheMUSIC Risk score: a simple method for predicting mortality inambulatory patients with chronic heart failure,” EuropeanHeartJournal, vol. 30, no. 9, pp. 1088–1096, 2009.
[4] L. Manzano, D. Babalis, M. Roughton et al., “Predictors of clin-ical outcomes in elderly patients with heart failure,” EuropeanJournal of Heart Failure, vol. 13, no. 5, pp. 528–536, 2011.
[5] M. Senni, P. Parrella, R. DeMaria et al., “Predicting heart failureoutcome from cardiac and comorbid conditions: the 3C-HFscore,” International Journal of Cardiology, vol. 163, no. 2, pp.206–211, 2013.
[6] S. J. Pocock, C. A. Ariti, J. J. V. McMurray et al., “Predictingsurvival in heart failure: a risk score based on 39 372 patientsfrom 30 studies,” European Heart Journal, vol. 34, no. 19, pp.1404–1413, 2013.
[7] C. S. Kwok, Y. K. Loke, K.Woo, and P. K.Myint, “Risk predictionmodels for mortality in community-acquired pneumonia: asystematic review,” BioMed Research International, vol. 2013,Article ID 504136, 12 pages, 2013.

10 Computational and Mathematical Methods in Medicine
[8] L. E. Hinkle Jr., H. T.Thaler, D. P.Merke, D. Renier-Berg, andN.E.Morton, “The risk factors for arrhythmic death in a sample ofmen followed for 20 years,” American Journal of Epidemiology,vol. 127, no. 3, pp. 500–515, 1988.
[9] D. R. Cox, “Regression models and life-tables,” Journal of theRoyal Statistical Society. Series B. Methodological, vol. 34, no. 2,pp. 187–220, 1972.
[10] L. Breiman, “Bagging predictors,”Machine Learning, vol. 24, no.2, pp. 123–140, 1996.
[11] L. Breiman, “Heuristics of instability and stabilization in modelselection,”The Annals of Statistics, vol. 24, no. 6, pp. 2350–2383,1996.
[12] S. Uretsky, F. H. Messerli, S. Bangalore et al., “Obesity paradoxin patients with hypertension and coronary artery disease,”American Journal ofMedicine, vol. 120, no. 10, pp. 863–870, 2007.
[13] K. F. Adams, A. Schatzkin, T. B. Harris et al., “Overweight,obesity, and mortality in a large prospective cohort of persons50 to 71 years old,” The New England Journal of Medicine, vol.355, no. 8, pp. 763–778, 2006.
[14] K. M. Flegal, B. I. Graubard, D. F. Williamson, and M. H. Gail,“Cause-specific excess deaths associated with underweight,overweight, and obesity,” The Journal of the American MedicalAssociation, vol. 298, no. 17, pp. 2028–2037, 2007.
[15] K. R. Fontaine, D. T. Redden, C.Wang, A. O.Westfall, and D. B.Allison, “Years of life lost due to obesity,” Journal of theAmericanMedical Association, vol. 289, no. 2, pp. 187–193, 2003.
[16] H. Ishwaran, U. B. Kogalur, E. H. Blackstone, and M. S. Lauer,“Random survival forests,”The Annals of Applied Statistics, vol.2, no. 3, pp. 841–860, 2008.
[17] E. Hsich, E. Z. Gorodeski, E. H. Blackstone, H. Ishwaran, andM. S. Lauer, “Identifying important risk factors for survival inpatientwith systolic heart failure using randomsurvival forests,”Circulation: Cardiovascular Quality and Outcomes, vol. 4, no. 1,pp. 39–45, 2011.
[18] I. K. Omurlu, M. Ture, and F. Tokatli, “The comparisonsof random survival forests and Cox regression analysis withsimulation and an application related to breast cancer,” ExpertSystems with Applications, vol. 36, no. 4, pp. 8582–8588, 2009.
[19] M. Saeed, M. Villarroel, A. T. Reisner et al., “Multiparameterintelligentmonitoring in intensive care II: a public-access inten-sive care unit database,”Critical CareMedicine, vol. 39, no. 5, pp.952–960, 2011.
[20] A. L. Goldberger, L. A. N. Amaral, L. Glass et al., “PhysioBank,PhysioToolkit, and PhysioNet: components of a new researchresource for complex physiologic signals,” Circulation, vol. 101,no. 23, pp. e215–e220, 2000.
[21] E. A. Colosimo, F. F. Ferreira, M. D. Oliveira, and C. B. Sousa,“Empirical comparisons between Kaplan-Meier and Nelson-Aalen survival function estimators,” Journal of Statistical Com-putation and Simulation, vol. 72, no. 4, pp. 299–308, 2002.
[22] H. Uno, T. Cai, M. J. Pencina, R. B. D’Agostino, and L. J. Wei,“On the C-statistics for evaluating overall adequacy of riskprediction procedures with censored survival data,” Statistics inMedicine, vol. 30, no. 10, pp. 1105–1117, 2011.
[23] E. W. Steyerberg, F. E. Harrell Jr., G. J. J. M. Borsboom, M.J. C. Eijkemans, Y. Vergouwe, and J. D. F. Habbema, “Internalvalidation of predictive models: efficiency of some proceduresfor logistic regression analysis,” Journal of Clinical Epidemiology,vol. 54, no. 8, pp. 774–781, 2001.
[24] R. Kohavi, “A study of cross-validation and bootstrap foraccuracy estimation and model selection,” in Proceedings of the
International Joint Conference on Artificial Intelligence, vol. 14,pp. 1137–1145, 1995.
[25] B. Murray, J. Stofan, and E. R. Eichner, “Hyponatremia in ath-letes,” Sports Science, vol. 88, p. 88, 2003.
[26] Y. Ofran, D. Lavi, D. Opher, T. A. Weiss, and E. Elinav, “Fatalvoluntary salt intake resulting in the highest ever documentedsodium plasma level in adults (255 mmol L-1): a disorder linkedto female gender and psychiatric disorders,” Journal of InternalMedicine, vol. 256, no. 6, pp. 525–528, 2004.
[27] K. Beier, S. Eppanapally, H. S. Bazick et al., “Elevation of BUNis predictive of long-term mortality in critically ill patientsindependent of ‘normal’ creatinine,”Critical CareMedicine, vol.39, no. 2, article 305, 2011.
[28] A. J. Kirtane, D. M. Leder, S. S. Waikar et al., “Serum blood ureanitrogen as an independent marker of subsequent mortalityamong patients with acute coronary syndromes and normalto mildly reduced glomerular filtration rates,” Journal of theAmerican College of Cardiology, vol. 45, no. 11, pp. 1781–1786,2005.
[29] H. M. Orpana, J.-M. Berthelot, M. S. Kaplan, D. H. Feeny, B.McFarland, and N. A. Ross, “BMI and mortality: results from anational longitudinal study of canadian adults,” Obesity, vol. 18,no. 1, pp. 214–218, 2010.
[30] B. M. Squibb and A. Trust, “National Institute for Health andClinical Excellence,” 2012.
[31] J. Herlitz, S. Aune, A. Bang et al., “Very high survival amongpatients defibrillated at an early stage after in-hospital ventricu-lar fibrillation on wards with and without monitoring facilities,”Resuscitation, vol. 66, no. 2, pp. 159–166, 2005.
[32] D. S. Echt, P. R. Liebson, L. B. Mitchell et al., “Mortalityand morbidity in patients receiving encainide, flecainide, orplacebo: the Cardiac Arrhythmia Suppression Trial,” The NewEngland Journal of Medicine, vol. 324, no. 12, pp. 781–788, 1991.

Submit your manuscripts athttp://www.hindawi.com
Stem CellsInternational
Hindawi Publishing Corporationhttp://www.hindawi.com Volume 2014
Hindawi Publishing Corporationhttp://www.hindawi.com Volume 2014
MEDIATORSINFLAMMATION
of
Hindawi Publishing Corporationhttp://www.hindawi.com Volume 2014
Behavioural Neurology
EndocrinologyInternational Journal of
Hindawi Publishing Corporationhttp://www.hindawi.com Volume 2014
Hindawi Publishing Corporationhttp://www.hindawi.com Volume 2014
Disease Markers
Hindawi Publishing Corporationhttp://www.hindawi.com Volume 2014
BioMed Research International
OncologyJournal of
Hindawi Publishing Corporationhttp://www.hindawi.com Volume 2014
Hindawi Publishing Corporationhttp://www.hindawi.com Volume 2014
Oxidative Medicine and Cellular Longevity
Hindawi Publishing Corporationhttp://www.hindawi.com Volume 2014
PPAR Research
The Scientific World JournalHindawi Publishing Corporation http://www.hindawi.com Volume 2014
Immunology ResearchHindawi Publishing Corporationhttp://www.hindawi.com Volume 2014
Journal of
ObesityJournal of
Hindawi Publishing Corporationhttp://www.hindawi.com Volume 2014
Hindawi Publishing Corporationhttp://www.hindawi.com Volume 2014
Computational and Mathematical Methods in Medicine
OphthalmologyJournal of
Hindawi Publishing Corporationhttp://www.hindawi.com Volume 2014
Diabetes ResearchJournal of
Hindawi Publishing Corporationhttp://www.hindawi.com Volume 2014
Hindawi Publishing Corporationhttp://www.hindawi.com Volume 2014
Research and TreatmentAIDS
Hindawi Publishing Corporationhttp://www.hindawi.com Volume 2014
Gastroenterology Research and Practice
Hindawi Publishing Corporationhttp://www.hindawi.com Volume 2014
Parkinson’s Disease
Evidence-Based Complementary and Alternative Medicine
Volume 2014Hindawi Publishing Corporationhttp://www.hindawi.com