Research Article Optimization of Ultrasonic Extraction of ...
8
Research Article Optimization of Ultrasonic Extraction of Phenolic Compounds from Epimedium brevicornum Maxim Using Response Surface Methodology and Evaluation of Its Antioxidant Activities In Vitro Yan Zhao, 1 Yingying Hou, 1 Guosheng Tang, 1 Enbo Cai, 1 Shuangli Liu, 1 He Yang, 1 Lianxue Zhang, 1 and Shijie Wang 2 1 College of Chinese Medicinal Materials, Jilin Agricultural University, No. 2888 Xincheng Street, Changchun, Jilin 130118, China 2 College of Traditional Chinese Medicine, Jilin Agricultural Science and Technology University, Jilin 132101, China Correspondence should be addressed to Lianxue Zhang; [email protected] Received 2 July 2014; Revised 7 August 2014; Accepted 15 October 2014; Published 12 November 2014 Academic Editor: Ver´ onica Pino Copyright © 2014 Yan Zhao et al. is is an open access article distributed under the Creative Commons Attribution License, which permits unrestricted use, distribution, and reproduction in any medium, provided the original work is properly cited. e ultrasound-assisted extraction of phenolic compounds from Epimedium brevicornu Maxim was modeled using response surface methodology. A Central Composite Design (CCD) was employed to optimize three extraction variables, including ethanol concentration (X 1 ), extraction time (X 2 ), and ratio of aqueous ethanol to raw material (X 3 ), for the achievement of high extraction yield of the phenolic compounds. e optimized conditions are X 1 of 50% (v/v), X 2 of 27.5 min, and X 3 of 250 mL/g. Under these conditions, the experimental yield is 4.29 ± 0.033% ( = 3). e antioxidant activity was evaluated using the DPPH assay and ferric- reducing antioxidant power (FRAP). And it indicates that the phenolic compounds from Epimedium brevicornu Maxim possess significant antioxidant activity. HPLC analysis reveals that the main phenolic compound in the extract product was identified as gallic acid, catechin (Cianidanol), p-hydroxybenzoic acid, vanillic acid, caffeic acid, ferulaic acid, rutin, benzoic acid, and quercetin. 1. Introduction e Herba Epimedii (family Berberidaceae) is widespread in Asia, Europe, and the Middle and Far East. And it is a famous Chinese herbal medicine, made from the dried aerial parts of Epimedium brevicornum Maxim, Epimedium sagittatum (Sieb. et Zucc.) Maxim, Epimedium pubescens Maxim, Epimedium wushanense T. S. Ying, and Epimedium koreanum Nakai [1]. It has been commonly used in the treatment of cardiovascular diseases and other chronic illness (infertility, amnesia and asthenia, impotence, and senile functional diseases) in China for over 2000 years [2]. Free radicals, chemical reactions, and several redox reac- tions of various compounds may cause protein oxidation, DNA damage, and lipid peroxidation in living cells [3]. Polyphenols, a large class of plant secondary metabolites, are important effective constituents of many natural products from plants and can protect the human body from free radicals and retard the progress of many chronic diseases. Currently, polyphenols have attracted extensive attention due to their various biological and pharmacological activities, including antioxidant, antibacterial, and anticancer activities [4, 5]. Ultrasonic-assisted extraction (UAE) is one of the most inexpensive, simple, rapid, and efficient green extraction techniques compared with conventional extraction [6] and has been applied to extract bioactive compounds from differ- ent materials due to its high reproducibility at shorter time, simplified manipulation, significant reduction in solvent consumption, and temperature, in respect to other classic methods [7, 8]. erefore, the ultrasound technology has been used in some industries, such as food industry, chemical industry, and material industry [9]. Response surface methodology (RSM), an effective sta- tistical technique for modeling and optimization of complex processes, has been used increasingly to optimize processing Hindawi Publishing Corporation Journal of Analytical Methods in Chemistry Volume 2014, Article ID 864654, 7 pages http://dx.doi.org/10.1155/2014/864654
Transcript of Research Article Optimization of Ultrasonic Extraction of ...
Research ArticleOptimization of Ultrasonic Extraction ofPhenolic Compounds from Epimedium brevicornumMaxim Using Response Surface Methodology and Evaluationof Its Antioxidant Activities In Vitro
Yan Zhao,1 Yingying Hou,1 Guosheng Tang,1 Enbo Cai,1 Shuangli Liu,1 He Yang,1
Lianxue Zhang,1 and Shijie Wang2
1 College of Chinese Medicinal Materials, Jilin Agricultural University, No. 2888 Xincheng Street, Changchun, Jilin 130118, China2 College of Traditional Chinese Medicine, Jilin Agricultural Science and Technology University, Jilin 132101, China
Correspondence should be addressed to Lianxue Zhang; [email protected]
Received 2 July 2014; Revised 7 August 2014; Accepted 15 October 2014; Published 12 November 2014
Academic Editor: Veronica Pino
Copyright © 2014 Yan Zhao et al.This is an open access article distributed under theCreative CommonsAttribution License, whichpermits unrestricted use, distribution, and reproduction in any medium, provided the original work is properly cited.
The ultrasound-assisted extraction of phenolic compounds from Epimedium brevicornu Maxim was modeled using responsesurface methodology. A Central Composite Design (CCD) was employed to optimize three extraction variables, including ethanolconcentration (X
1), extraction time (X
2), and ratio of aqueous ethanol to raw material (X
3), for the achievement of high extraction
yield of the phenolic compounds. The optimized conditions are X1of 50% (v/v), X
2of 27.5min, and X
3of 250mL/g. Under these
conditions, the experimental yield is 4.29 ± 0.033% (𝑛 = 3).The antioxidant activity was evaluated using the DPPH assay and ferric-reducing antioxidant power (FRAP). And it indicates that the phenolic compounds from Epimedium brevicornu Maxim possesssignificant antioxidant activity. HPLC analysis reveals that the main phenolic compound in the extract product was identified asgallic acid, catechin (Cianidanol), p-hydroxybenzoic acid, vanillic acid, caffeic acid, ferulaic acid, rutin, benzoic acid, and quercetin.
1. Introduction
The Herba Epimedii (family Berberidaceae) is widespreadin Asia, Europe, and the Middle and Far East. And it isa famous Chinese herbal medicine, made from the driedaerial parts of Epimedium brevicornum Maxim, Epimediumsagittatum (Sieb. et Zucc.) Maxim, Epimedium pubescensMaxim, Epimedium wushanense T. S. Ying, and Epimediumkoreanum Nakai [1]. It has been commonly used in thetreatment of cardiovascular diseases and other chronic illness(infertility, amnesia and asthenia, impotence, and senilefunctional diseases) in China for over 2000 years [2].
Free radicals, chemical reactions, and several redox reac-tions of various compounds may cause protein oxidation,DNA damage, and lipid peroxidation in living cells [3].Polyphenols, a large class of plant secondary metabolites, areimportant effective constituents of many natural productsfrom plants and can protect the human body from free
radicals and retard the progress of many chronic diseases.Currently, polyphenols have attracted extensive attention dueto their various biological and pharmacological activities,including antioxidant, antibacterial, and anticancer activities[4, 5].
Ultrasonic-assisted extraction (UAE) is one of the mostinexpensive, simple, rapid, and efficient green extractiontechniques compared with conventional extraction [6] andhas been applied to extract bioactive compounds from differ-ent materials due to its high reproducibility at shorter time,simplified manipulation, significant reduction in solventconsumption, and temperature, in respect to other classicmethods [7, 8]. Therefore, the ultrasound technology hasbeen used in some industries, such as food industry, chemicalindustry, and material industry [9].
Response surface methodology (RSM), an effective sta-tistical technique for modeling and optimization of complexprocesses, has been used increasingly to optimize processing
Hindawi Publishing CorporationJournal of Analytical Methods in ChemistryVolume 2014, Article ID 864654, 7 pageshttp://dx.doi.org/10.1155/2014/864654

2 Journal of Analytical Methods in Chemistry
parameters owing to more efficient and easier arrangementand interpretation of experiments compared to others [8,10, 11]. The advantage of RSM is the reduced number ofexperimental trials needed to evaluate multiple parametersand their interactions.Therefore, it is widely used in optimiz-ing the extraction parameters, such as polysaccharides [12],anthocyanins [13], phenolic compounds [14], and protein [15]from different materials.
In this work, the aims of the present study were to inves-tigate the extraction variables (ethanol concentration, extrac-tion time, and ratio of aqueous ethanol to raw material);optimize these variables values by RSM for the phenoliccompounds recovery yield maximization; and investigatethe relationship between phenolic content and antioxidantactivity from Epimedium brevicornum Maxim Furthermore,the antioxidant activity of the phenolic compounds was eval-uated by DPPH assay and FRAP.
2. Materials and Methods
2.1. Materials and Reagents. Epimedium brevicornumMaximwas collected from Jilin province (China) and verified byProfessor Lianxue Zhang (Jilin Agriculture University, Jilin,China). Folin-Ciocalteu phenol reagent, sodium carbonate,2,2-diphenyl-1-picrylhydrazyl (DPPH), gallic acid, catechin(Cianidanol), vanillic acid, p-hydroxybenzoic acid, caffeicacid, ferulaic acid, rutin, benzoic acid, quercetin, and vitaminC (Vc) were from Aladdin (Shanghai, China). Methanol(HPLC grade) was purchased from Honeywell Burdick &Jackson (Ulsan, Korea). Ultra-high purifiedwater used in thisstudy was prepared in a Milli-Q Water Purification System(Millipore, Bedford, MA, USA). Other chemicals used wereof analytical grade.
2.2. Extraction of Phenolic Compounds. The process of phe-nolic compounds extraction from Epimedium brevicornumMaxim by ultrasonic-assisted treatment was performed inan ultrasonic generator (250W, 40 kHz, KQ-250B, Kunshan,China). The dry Epimedium brevicornum Maxim was pow-dered by a pulverizer (Fw-200, Beijing, China) and thenpassed through an 80mesh sieve.One gramof theEpimediumbrevicornum Maxim powders was used for each case in abeaker. The beaker was held in the ultrasonic generatorand exposed to extract phenolic compounds for differentextraction time at various ethanol concentrations in differentratios of aqueous ethanol to raw material.
2.3. Total Phenolic Content (TPC)Determination. After ultra-sonic treatment, the extracted slurry was centrifuged at4000 rpm for 15min to collect the supernatant. The contentof total phenols was determined by the Folin-Ciocalteumethod [16]. Briefly, diluted sample (0.50mL) was added to1 : 10 diluted Folin-Ciocalteu reagent (2.5mL). After 4min,saturated sodium carbonate solution (about 75 g/L, 2mL)was added. After 2 h of incubation at room temperature,the absorbance of the reaction mixture was measured at760 nm. Gallic acid was used as a reference standard, andthe results were expressed as milligram gallic acid equivalent(mgGAE)/g dry weight of plantmaterial. All the experiments
were performed in triplicate, and the results were expressed asmean ± SD (standard deviation).The correlation between theantioxidant capacities and total phenolic contents was ana-lyzed using the simple linear regression, and the correlationcoefficient (R2) was calculated.
2.4. Determination of In Vitro Antioxidant Assays
2.4.1. Reducing Ability Assay. The ferric-reducing antioxi-dant power (FRAP) was assessed according to a reportedprocedure with minor modifications [17]. Various concen-trations of Epimedium brevicornum Maxim (5∼1000𝜇g/mL)in sodium phosphate buffer (1.5mL, 0.2M, pH = 6.6) weremixed with potassium ferricyanide (1.5mL, 1%, w/v) andthe mixture was incubated at 50∘C for 20min. After that,trichloroacetic acid (TCA, 1.5mL, 10%, w/v) was added,and the mixture was centrifuged at 3,000 rpm for 15min.The centrifugate (1.5mL) was mixed thoroughly with deion-ized water (1.5mL) and FeCl
3(0.3mL, 0.1%, w/v), and
the absorbance was measured at 700 nm. The increase inabsorbance of the reactionmixture indicated reducing power.The reducing power was expressed as EC
50(𝜇g/mL), which is
the concentration of the sample to cause a 0.5OD at 700 nm.Butylated hydroxyl toluene (BHT) was used as standard.
2.4.2. DPPH Radical Scavenging Assay. DPPH∙ quenchingability of phenolic compoundsfrom Epimedium brevicornumMaxim was measured according to Hanato’s method [18].A methanol DPPH solution (0.15%) was mixed with serialdilutions (5∼1000𝜇g/mL) of Epimedium brevicornumMaximand after 10min, the absorbance was read at 515 nm.The anti-radical activity was expressed as IC
50(𝜇g/mL), the antiradical
dose required to cause a 50% inhibition. Vitamin C was usedas standard. The ability to scavenge the DPPH radical wascalculated using the following equation:
DPPH scavenging effect (%) =(𝐴0− 𝐴1)
𝐴0
× 100, (1)
where 𝐴0is the absorbance of the control at 30min and 𝐴
1
is the absorbance of the sample at 30min. All samples wereanalyzed in triplicate.
2.5. HPLC Analysis. The extract phenolics were analyzedby HPLC method [16] with some modifications. Using aHPLC (CXTH-3000 series, Beijing Tong Heng InnovationTechnology Co., Ltd., China) equipped with a UV detector(LC3000, Beijing Tong Heng) and a C
18column (5 𝜇m,
250mm × 4.6mm, Dalian Jiangshen separating technologyCo., Ltd.). Ultrapure water was used as solvent A and 100%methanol as solvent B (0∼40min, 𝐴: 5%∼60%; 40∼50min,𝐴: 60%∼60%). The solutions of the standards and the extractphenolics were filtered through a 0.45 nm syringe filter.The operating conditions were column temperature, 30∘C;injection volume, 20 𝜇L; detection wavelength, 280 nm; flowrate, 1.0mL/min. The identification and peak assignment ofthe phenolics were based on comparison of retention timesand spectral data with those of the standards. The identifiedphenolics were quantified according to respective standardcalibration curves.

Journal of Analytical Methods in Chemistry 3
Table 1: Independent variables and their levels used in the response surface design.
Factor Notation level−1.682 −1 0 1 1.682
Ethanol concentration (%) (v/v) 𝑋1
20 32.16 50 67.84 80Ultrasonic extraction time (min) 𝑋
25 14.12 27.5 40.88 50
Liquid-solid ratio (mL/g) 𝑋3
50 90.55 150 209.45 250
2.6. Experimental Design. A Central Composite Design(CCD) was employed to determine the best combinationof extraction variables for the phenolic compounds basedon the results of preliminary single-factor-test. Extractiontime (𝑋
1), ethanol concentration (𝑋
2), and ratio of aqueous
ethanol to raw material (𝑋3) were the independent variables,
and their uncoded and coded levels were presented in Table 1.Extraction yield (𝑌) taken as the response for the designexperiment was given in Table S1, Table S2, Table S3, FigureS1a, Figure S1b, Figure S1c, Figure S2, Figure S3, Figure S4,were displayed in Supplementary Material which would beavailable online at http://dx.doi.org/10.1155/2014/864654.
2.7. Statistical Analysis. All the data were determined intriplicate and the results were averaged. SPSS software version18 was used to evaluate the DPPH assay and FRAP. DesignExpert software version 8.0.6.1 (Stat-Ease, Minneapolis) wasemployed for the regression analysis and the optimization.
3. Results and Discussion
3.1. Effect of Ethanol Concentration on Extraction Yield ofPhenolic Compounds. Extraction process was carried outat different ethanol concentrations of 5%, 10%, 20%, 40%,60%, 80%, and 95%, while other parameters were as follows:extraction time 30min and ratio of aqueous ethanol to rawmaterial 300mL/g. The effect of ethanol concentration onextraction yield of phenolic compounds is shown in FigureS1a. The extraction yield was calculated using the followingequation:
Extraction yield (%) =𝐴0
𝐴1
× 100, (2)
where 𝐴0is the content of total phenolic compounds and 𝐴
1
is the quality of Epimedium brevicornumMaxim. All sampleswere analyzed in triplicate.
The variance of extraction yield increases first, thendecreases with the increase of ethanol concentration, andpeaks at 60% (v/v). Ethanol/water was chosen as the uniqueextraction solvent, instead of others, because of low price ofethanol, low toxicity, easiness of recycling (which is goodfrom an environmental point of view), and good polarityto extract the components of interest. It is reported thatwater is acting as the plant swelling agent, while ethanolis believed to disrupt the bonding between the solutes andplant matrices [19]. Moreover, water has a high dielectricconstant, which leads to different ethanol concentrationswith
different polarities [20]. Therefore, the results may be relatedto the solvent polarity and the solubility of polyphenolsin Epimedium brevicornum Maxim, and the ethanol con-centration of 60% (v/v) is good for extracting the phenoliccompounds.
3.2. Effect of Extraction Time on Extraction Yield of Phe-nolic Compounds. Extraction process was carried out usingextraction time from 5 to 50min, while other parameterswere as follows: ethanol concentration 60% (v/v) and ratioof aqueous ethanol to raw material 300mL/g. The effect ofextraction time on extraction yield of phenolic compoundsfrom Epimedium brevicornumMaxim is shown in Figure S1b.When extraction time increases, the variance of extractionyield is relatively rapid and reaches amaximum at 40min andthen decreases as the extraction proceeds, possibly due to thestructural destruction and the decomposition of polyphenolsduring the prolonged extraction time [21]. Therefore, 40minis favorable for extracting the phenolic compounds.
3.3. Effect of Ratio of Aqueous Ethanol to Raw Material onExtraction Yield of Phenolic Compounds. Extraction processwas carried out using ratio of aqueous ethanol to rawmaterialin the range of 20 to 300mL/g, while extraction time andethanol concentration were fixed at 40min and 60% (v/v),respectively. The effect of ratio of aqueous ethanol to rawmaterial on extraction yield of phenolic compounds is shownin Figure S1c. As ratio of aqueous ethanol to raw materialincreases, the extraction yield slowly increases first and amaximum yield is achieved at 250mL/g, and then slightlydecreases after the ratio of aqueous ethanol to raw materialexceeds 250mL/g. This phenomenon may be attributed tothe mass transfer principle and the distribution of ultrasonicenergy density in the extraction solutions [22]. Lower ratioof aqueous ethanol to raw material has higher concentrationgradient, leading to higher diffusion and extraction yield.But when the ratio is over 250mL/g, the decrease of thedistribution of ultrasonic energy density in the extractionsolutions is dominant and has a negative effect on theextraction yield. Therefore, the ratio of aqueous ethanol toraw material of 250mL/g is sufficient for extracting thephenolic compounds.
3.4. Optimization of Extraction Parameters for Phenolic Com-pounds. Table S1 shows the process variables and experimen-tal data of 17 runs containing 3 replicates at center point.By applying multiple regression analysis on the experimentaldata, the model for the response variable could be expressed
4 Journal of Analytical Methods in Chemistry
by the following quadratic polynomial equation in the formof coded values:
𝑌 = −3.72212 + 0.11831 ∗ 𝑋1
+ 0.11269 ∗ 𝑋2+ 0.03147 ∗ 𝑋
3
− 0.00021 ∗ 𝑋1∗ 𝑋1
+ 0.00005 ∗ 𝑋1∗ 𝑋2
+ 0.00004 ∗ 𝑋2∗ 𝑋2
− 0.00126 ∗ 𝑋1∗ 𝑋3
− 0.00165 ∗ 𝑋2∗ 𝑋3
− 0.00008 ∗ 𝑋3∗ 𝑋3.
(3)
Analysis of variance (ANOVA) for the model is shownin Table S2. The determination coefficient (𝑅2 = 0.9905)indicates that only 0.95% of the total variations are notexplained by the model. For a good statistical model, theadjusted determination coefficient (𝑅2 adj) should be closeto 𝑅2. As shown in Table S2, 𝑅2 adj (0.9782) is close to𝑅2. Moreover, 𝑅2 pred (0.9664) is in reasonable agreement
with 𝑅2 adj and confirms that the model is highly significant.The lack of fit test determines whether the selected modelis adequate to explain the experimental data, or whetheranother model should be reselected. The value of lack offit test (0.9720) is higher than 0.05, which is not significantrelative to the pure error and indicates that the fitting modelis adequate to describe the experimental data. An adequateprecision is ameasure of the signal to noise ratio, and the ratioof signal to noise is greater than 4 considered to be desirable[23].The value of adequate precision is 26.402, demonstratingan adequate signal. At the same time, a relatively low value ofcoefficient of variation (CV) (3.25) indicates a better precisionand reliability of the experimental values. Therefore, themodel is adequate for prediction in the range of experimentalvariables.
The significance of each coefficient measured using 𝑃value and 𝐹 value is listed in Table S3. Smaller 𝑃 value andgreater 𝐹 value mean the corresponding variables would bemore significant.The 𝑃 value of the model is less than 0.0001,which indicates that the model is significant and can beused to optimize the extraction variables. The three indepen-dent variables (𝑋
1, 𝑋2, and 𝑋
3) and three quadratic terms
(𝑋1𝑋3, 𝑋2𝑋3, and 𝑋
3𝑋3) significantly affect the extraction
yield within a 99% confidence interval, and the interactionbetween extraction time (𝑋
1) and ethanol concentration
(𝑋2), aswell as extraction time (𝑋1) and extraction time (𝑋
1),
is significant (𝑃 < 0.01). Meanwhile, ratio of aqueous ethanolto raw material (𝑋
3) is the most significant factor affecting
the extraction yield.
3.5. Analysis of Response Surfaces. 2D contour plots and3D response surface are the graphical representations ofregression equation and are very useful to judge the rela-tionship between independent and dependent variables.Different shapes of the contour plots indicate whether the
mutual interactions between the variables are significant ornot. Circular contour plot means the interactions betweenthe corresponding variables are negligible, while ellipticalcontour suggests the interactions between the correspondingvariables are significant. The three-dimensional representa-tion of the response surfaces and two-dimensional contoursgenerated by the model are shown in Figures S2–S4. In thesethree variables, when two variables are depicted in three-dimensional surface plots, the third variable is fixed at zerolevel. It is found in Figures S2–S4 that all the three responsesurfaces are convex in shape, which indicates that the rangesof variables were chosen properly. As shown in Figure S2,extraction yield increases rapidly when ethanol concentra-tion (𝑋
1) and extraction time (𝑋
2) increase in the range
of 20–47.8% (v/v) and 5–32.5min, respectively; but beyond47.8% and 32.5min, extraction yield decreases slightly. Thisdemonstrates that the effect of ethanol concentration (𝑋
1)
and extraction time (𝑋2) on extraction yield is significant and
is in good agreement with the results in Table S3. Moreover,the elliptical contour plots in Figure S2 mean that there isa significant interaction between the two variables, whichalso agrees with the results in Table S3. It is obvious inFigure S3; both ethanol concentration (𝑋
1) and ratio of
aqueous ethanol to raw material (𝑋3) have quadratic effect
on extraction yield. Extraction yield increases at first andthen decreased quicklywith increasing of the two parameters,and a maximum extraction yield is achieved when ethanolconcentration (𝑋
1) and ratio of aqueous ethanol to raw
material (𝑋3) are 49.5% (v/v) and 219.0mL/g, respectively.
It can be seen that the mutual interactions between ethanolconcentration (𝑋
1) and ratio of aqueous ethanol to raw
material (𝑋3) are significant due to the elliptical contour plots
shown in Figure S3, which is also confirmed by the results inTable S3. From Figure S4, both extraction time (𝑋
2) and ratio
of aqueous ethanol to rawmaterial (𝑋3) have quadratic effect
on extraction yield. Extraction yield increases at first and thendecreased quickly with increasing of the two parameters, andamaximumextraction yield is achievedwhen extraction time(𝑋2) and ratio of aqueous ethanol to raw material (𝑋
3) are
34.5min and 220.0mL/g, respectively. It can be seen that themutual interactions between extraction time (𝑋
2) and ratio
of aqueous ethanol to rawmaterial (𝑋3) are significant due to
the elliptical contour plots shown in Figure S4, which is alsoconfirmed by the results in Table S3.
3.6. Verification of the Model. The suitability of the modelequation for predicting the optimum response values istested using the selected optimum conditions. The optimumconditions are ethanol concentration (𝑋
1) of 50.8% (v/v),
extraction time (𝑋2) of 27.9min, and ratio of aqueous
ethanol to raw material (𝑋3) of 250.7mL/g, under which the
predicted yield is 4.28%.However, considering the operabilityin actual production, the optimumconditions aremodified asfollows: ethanol concentration (𝑋
1) of 50% (v/v), extraction
time (𝑋2) of 28min, and ratio of aqueous ethanol to raw
material (𝑋3) of 250mL/g, under which the experimental
yield is 4.29 ± 0.033% (𝑛 = 3), agreeing closely with thepredicted yield and consequently indicating the RSM modelis satisfactory and accurate.

Journal of Analytical Methods in Chemistry 5
Abso
rban
ce100
90
80
70
60
50
40
30
20
10
0
Phenolic compoundsBHT
5 10 50 100 500 1000
Concentration (𝜇g/mL)
(a)
Phenolic compounds
5 10 50 100 500 1000
Concentration (𝜇g/mL)
1009080706050403020100
Vitamin C
Inhi
bito
r (%
)
(b)
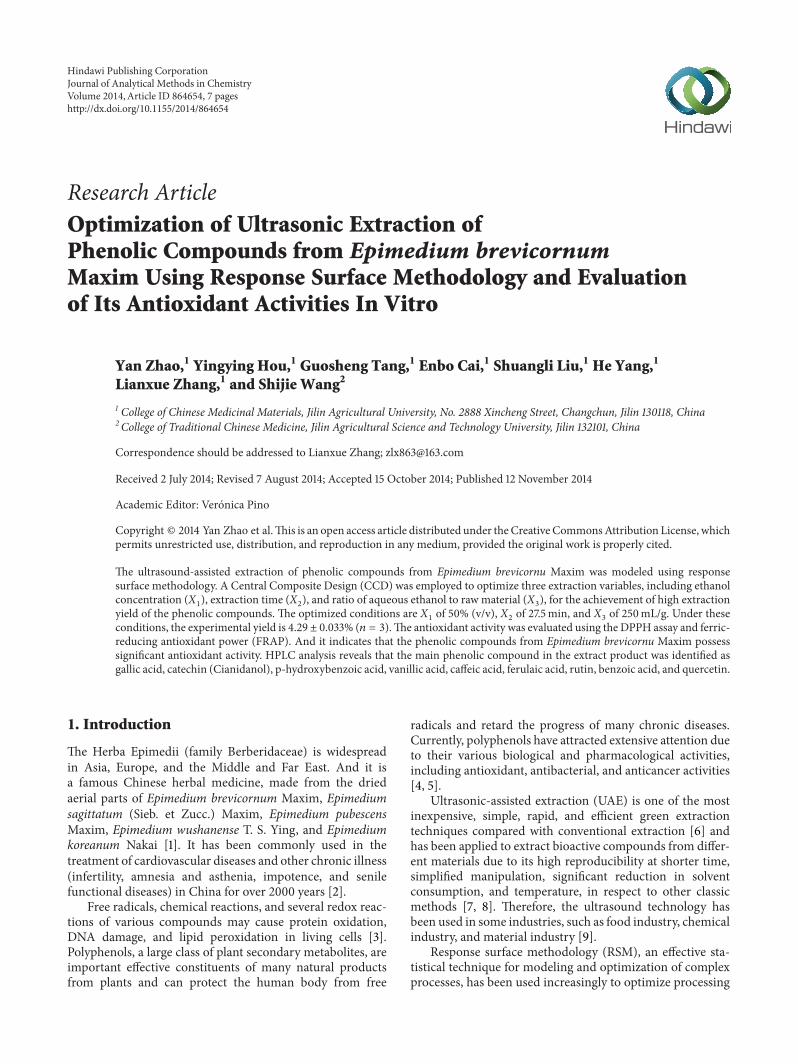
Figure 1: (a) Reductive ability of EFP and BHT. (b) DPPH radical scavenging effect of EFP and vitamin C.
(mV
)
(a)
(b)
160
140
120
100
80
60
40
20
0
−20
−40
(1)(2)
(3)
(4)
(5)(6)
(7)
(8)(9)
4 8 12 16 20 24 28 32 36 40 44 48
(min)
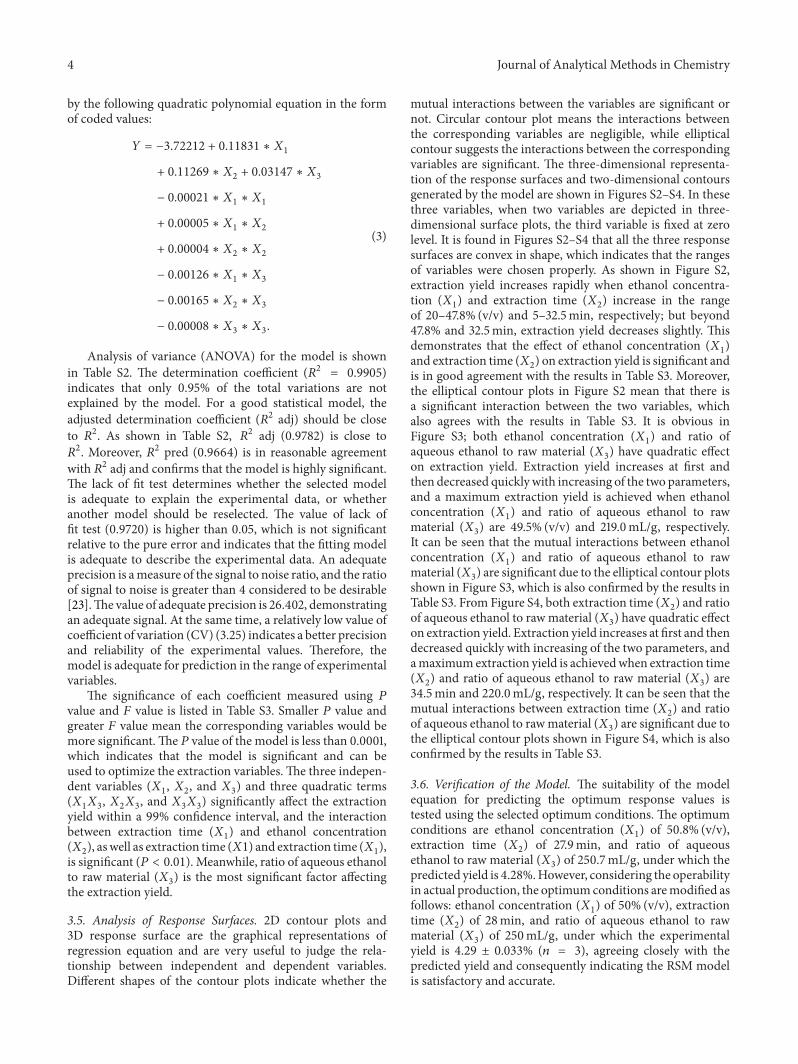
Figure 2: HPLC chromatograms. (a) HPLC chromatograms ofa standard solution ((1) gallic acid = 20 𝜇g/mL, (2) catechin =20 𝜇g/mL, (3) p-hydroxybenzoic acid = 20𝜇g/mL, (4) vanillic acid =22 𝜇g/mL, (5) caffeic acid = 20 𝜇g/mL, (6) ferulaic acid = 19 𝜇g/mL,(7) rutin = 20 𝜇g/mL, (8) benzoic acid = 25 𝜇g/mL, (9) quercetin= 10𝜇g/mL). (b) Typical HPLC chromatogram obtained by directinjection of 20 𝜇L of extract of polyphenols from Epimedium bre-vicornum Maxim by optimized conditions (ethanol concentration50%, extraction time 27.5min, and ratio of aqueous ethanol to rawmaterial 250mL/g).
Table 2: Correlation between total phenolic content (TPC), DPPHradical scavenging ability (DPPH), and ferric-reducing antioxidantpower (FRAP).
DPPH FRAP TPCDPPH 0.812 0.913FRAP 0.812 0.793TPC 0.913 0.793
3.7. Reducing Power of Epimedium brevicornum Maxim. Theresults of Epimedium brevicornum Maxim reducing powerwere showed in Figure 1(a). It shows the reductive capabilitiesof Epimedium brevicornumMaxim compared to the standardBHT; the reducing power of Epimedium brevicornumMaximincreased with increasing quantity of the sample. The EC
50
value of Epimedium brevicornumMaxim and BHTwas 69.2±2.44 𝜇g/mL and 35.7±0.81 𝜇g/mL, respectively.These resultsindicate that the phenolic compounds from Epimedium
brevicornum Maxim showed very high reducing power invitro.
3.8. Scavenging Activity on DPPH Radical. DPPH, a stablenitrogen centered free radical, has been used to evaluatenatural antioxidants for their radical quenching capacities ina relatively short time, compared with other methods [24].The scavenging activities of Epimedium brevicornum Maximon DPPH free radical compared to the standard vitamin Cwere shown in Figure 1(b). Epimedium brevicornum Maximexhibited a significant dose dependent inhibition of DPPHactivity, with a 50% inhibition (IC
50) at a concentration
of 86.40 ± 0.62 𝜇g/mL. The IC50
value of vitamin C was33.59 ± 0.31 𝜇g/mL. These results indicate that the phenoliccompounds from Epimedium brevicornum Maxim have anoticeable effect on scavenging DPPH free radicals.
3.9. The Correlation between Antioxidant Activity and TotalPhenolic Content. The correlation coefficient (𝑅2) betweenthe antioxidant activity and the total phenolic content of theEpimedium brevicornum Maxim was determined (Table 2).The antioxidant activity and the total phenolic contentshowed a good correlation in both the FRAP (𝑅2 = 0.793)and DPPH (𝑅2 = 0.913) extracts. And the FRAP also showeda good correlation in DPPH (𝑅2 = 0.812).
3.10. HPLC Analysis of Extract Composition and PolyphenolContent. Figure 2 shows the chromatograms of the standardmixture and the extracts. The HPLC chromatograms revealthat gallic acid, catechin, p-hydroxybenzoic acid, vanillicacid, caffeic acid, ferulaic acid, rutin, benzoic acid, andquercetin are the major phenolic compounds in Epimediumbrevicornum Maxim. The content of gallic acid, catechin, p-hydroxybenzoic acid, vanillic acid, caffeic acid, ferulaic acid,rutin, benzoic acid, and quercetin in Epimedium brevicornumMaxim is calculated from respective standard calibrationcurves which is shown in Table 3 and the values are 0.14% forgallic acid, 1.50% for catechin, 0.50% for p-hydroxybenzoicacid, 0.13% for vanillic acid, 0.07% for caffeic acid, 0.05%for ferulaic acid, 1.12% for rutin, 0.19% for benzoic acid, and0.14% for quercetin. These results indicate that catechin andrutin may be mainly responsible for the antioxidant activity.

6 Journal of Analytical Methods in Chemistry
Table 3: Summary of HPLC method performance: linear equation, linear ranges, and coefficients of phenolic compounds (𝑛 = 3).
Phenolic compounds Retention time (min) Slope Intercept Linear range (𝜇mol/mL) 𝑅2
Gallic acid 7.23 ± 0.07 1.20 × 10⁹± 0.06 × 10⁹ −1.00 × 10⁴± 0.55 × 10⁴ 0.01–1.18 0.999Catechin 15.51 ± 0.11 1.18 × 10⁸± 0.04 × 10⁸ −5.17 × 10²± 0.14 × 10² 0.01–0.65 0.999p-Hydroxybenzoic acid 17.61 ± 0.11 5.78 × 10⁸± 0.12 × 10⁸ 2.96 × 10³± 1.13 × 10³ 0.01–1.45 0.999Vanillic acid 22.92 ± 0.12 7.34 × 10⁸± 0.23 × 10⁸ −6.89 × 10³± 1.66 × 10³ 0.01–1.31 0.999Caffeic acid 23.94 ± 0.12 1.24 × 10⁹± 0.07 × 10⁹ −1.50 × 10⁴± 0.6 × 10⁴ 0.01–1.11 0.999Ferulaic acid 31.73 ± 0.09 8.15 × 10⁹± 0.25 × 10⁹ −4.15 × 10³± 1.66 × 10³ 0.01–0.20 0.999Rutin 32.34 ± 0.13 8.26 × 10⁸± 0.49 × 10⁸ 1.99 × 10³± 0.40 × 10³ 0.01–0.33 0.999Benzoic acid 34.11 ± 0.14 9.55 × 10⁷± 0.36 × 10⁷ 3.32 × 10³± 0.98 × 10³ 0.02–2.05 0.999Quercetin 45.49 ± 0.15 9.61 × 10⁸± 0.33 × 10⁸ −5.11 × 10³± 1.23 × 10³ 0.01–0.33 0.999
4. Conclusions
In the present study, the conditions for enhanced extractionof polyphenols from Epimedium brevicornumMaxim byUAEwere optimized with a Central Composite Design based onresponse surface methodology.
Based on the single-factor-test, Central CompositeDesign was used to evaluate and ptimize the extractionvariables (ethanol concentration, extraction time, and ratio ofaqueous ethanol to rawmaterial) for the extraction yield.Theoptimized conditions are as follows: ethanol concentration50%, extraction time 27.5min, and ratio of aqueous ethanolto rawmaterial 250mL/g. Under these conditions, the experi-mental yield is 4.29%,which agreed closely with the predictedyield of 4.28%. This optimized extraction has increased thetotal phenolic content yield significantly by 1.68%when com-pared to previous studies conducted by Wong et al. [25]. Theantioxidant activity was evaluated using the DPPH assay andferric-reducing antioxidant power (FRAP). And it indicatesthat the phenolic compounds from Epimedium brevicornumMaxim possess significant antioxidant activity. The HPLCanalysis and the DPPH assay indicate that the extracts arecomposed of gallic acid, catechin, p-hydroxybenzoic acid,vanillic acid, caffeic acid, ferulaic acid, rutin, benzoic acid,and quercetin and have significant antioxidant activity.
Conflict of Interests
The authors declare that there is no conflict of interestsregarding the publication of this paper.
Authors’ Contribution
Yan Zhao, Yingying Hou, and Guosheng Tang contributedequally to this work.
Acknowledgments
This research work was supported by Nature Science Foun-dation of China under Grant no. 31000154; National Sci-ence and Technology Support Program of China underGrant nos. 2011BAI03B01; 2009GJB10031; National NonprofitIndustry Research Special Program of China under Grant no.201303111; Jilin Province Science and Technology Develop-ment Program under Grant nos. 20126046; 20140204013YY;
20130303094; 20140311050YY; Special Program in the Phar-maceutical Industry in Jilin Province under Grant no.YYZX201258.
References
[1] Chinese Pharmacopoeia Commission, “Herba epimedii,” inChinese Pharmacopoeia, Part I, Chinese Pharmacopoeia Com-mission, Ed., pp. 267–268, Chemical Industry Publisher, Bei-jing, China, 2000.
[2] H. Z. Zheng, Z. H. Dong, and Q. She, “Herba epimedii,”in Modern Research and Application of Traditional ChineseMedicine, H. Z. Zheng, Z. H. Dong, and Q. She, Eds., pp. 4225–4254, Xueyan Press, Beijing, China, 1998.
[3] S. Sahreen, M. R. Khan, and R. A. Khan, “Evaluation ofantioxidant activities of various solvent extracts ofCarissa opacafruits,” Food Chemistry, vol. 122, no. 4, pp. 1205–1211, 2010.
[4] H. Falleh, R. Ksouri, K. Chaieb et al., “Phenolic composition ofCynara cardunculus L. organs, and their biological activities,”Comptes Rendus—Biologies, vol. 331, no. 5, pp. 372–379, 2008.
[5] S.-C. Lin, C.-M. J. Chang, and T.-S. Deng, “Enzymatic hotpressurized fluids extraction of polyphenolics fromPinus taiwa-nensis and Pinus morrisonicola,” Journal of the Taiwan Instituteof Chemical Engineers, vol. 40, no. 2, pp. 136–142, 2009.
[6] W. Chen, W.-P. Wang, H.-S. Zhang, and Q. Huang, “Optimiza-tion of ultrasonic-assisted extraction of water-soluble polysac-charides from Boletus edulis mycelia using response surfacemethodology,”Carbohydrate Polymers, vol. 87, no. 1, pp. 614–619,2012.
[7] J.-P. Fan, J. Cao, X.-H. Zhang et al., “Optimization of ionicliquid based ultrasonic assisted extraction of puerarin fromRadix Puerariae Lobatae by response surface methodology,”Food Chemistry, vol. 135, no. 4, pp. 2299–2306, 2012.
[8] Y.-L. Yan, C.-H. Yu, J. Chen, X.-X. Li, W. Wang, and S.-Q. Li,“Ultrasonic-assisted extraction optimized by response surfacemethodology, chemical composition and antioxidant activityof polysaccharides from Tremella mesenterica,” CarbohydratePolymers, vol. 83, no. 1, pp. 217–224, 2011.
[9] C. Leonelli and T. J.Mason, “Microwave and ultrasonic process-ing: now a realistic option for industry,” Chemical Engineeringand Processing: Process Intensification, vol. 49, no. 9, pp. 885–900, 2010.
[10] Z.-L. Sheng, P.-F.Wan, C.-L. Dong, and Y.-H. Li, “Optimizationof total flavonoids content extracted from Flos Populi usingresponse surface methodology,” Industrial Crops and Products,vol. 43, no. 1, pp. 778–786, 2013.
Journal of Analytical Methods in Chemistry 7
[11] M. Stroescu, A. Stoica-Guzun, S. Ghergu, N. Chira, and I. Jipa,“Optimization of fatty acids extraction from Portulaca oleraceaseed using response surface methodology,” Industrial Crops andProducts, vol. 43, no. 1, pp. 405–411, 2013.
[12] C. Zhu and X. Liu, “Optimization of extraction process of crudepolysaccharides from Pomegranate peel by response surfacemethodology,” Carbohydrate Polymers, vol. 92, no. 2, pp. 1197–1202, 2013.
[13] C. Pinho, A. Melo, C. Mansilha, and I. M. P. L. V. O. Ferreira,“Optimization of conditions for anthocyanin hydrolysis fromred wine using response surface methodology (RSM),” Journalof Agricultural and FoodChemistry, vol. 59, no. 1, pp. 50–55, 2011.
[14] X. Wang, Y. Wu, G. Chen, W. Yue, Q. Liang, and Q. Wu,“Optimisation of ultrasound assisted extraction of phenoliccompounds from Sparganii rhizoma with response surfacemethodology,” Ultrasonics Sonochemistry, vol. 20, no. 3, pp.846–854, 2013.
[15] L. Quanhong and F. Caili, “Application of response surfacemethodology for extraction optimization of germinant pump-kin seeds protein,” Food Chemistry, vol. 92, no. 4, pp. 701–706,2005.
[16] Y. Xie, H. Yu, J. F. Wang et al., “Simultaneous determinationof nine phenolic acids in dendranthema morifolium (Ramat)Tzvel. cv. Chuju samples by high performance liquid chro-matography,” Chinese Journal of Analytical Chemistry, vol. 41,no. 3, pp. 383–388, 2013.
[17] W. Liu,H.Wang,X. Pang,W.Yao, andX.Gao, “Characterizationand antioxidant activity of two low-molecular-weight polysac-charides purified from the fruiting bodies of Ganodermalucidum,” International Journal of Biological Macromolecules,vol. 46, no. 4, pp. 451–457, 2010.
[18] T. Hatano, H. Kagawa, T. Yasuhara, and T. Okuda, “Twonew flavonoids and other constituents in licorice root: theirrelative astringency and radical scavenging effects,” Chemicaland Pharmaceutical Bulletin, vol. 36, no. 6, pp. 2090–2097, 1988.
[19] S. Sahin and R. Samli, “Optimization of olive leaf extractobtained by ultrasound-assisted extraction with response sur-face methodology,”Ultrasonics Sonochemistry, vol. 20, no. 1, pp.595–602, 2013.
[20] G. Spigno and D. M. de Faveri, “Microwave-assisted extractionof tea phenols: a phenomenological study,” Journal of FoodEngineering, vol. 93, no. 2, pp. 210–217, 2009.
[21] C. Carrera, A. Ruiz-Rodrıguez, M. Palma, and C. G. Barroso,“Ultrasound assisted extraction of phenolic compounds fromgrapes,” Analytica Chimica Acta, vol. 732, pp. 100–104, 2012.
[22] Z. L. Zeng, G. X. Xi, and X. H. Ge, “Study on comparisonof two extraction methods of polysaccharide from Momordicacharantia L. vines,” Science and Technology of Food Industry, vol.34, pp. 285–308, 2013.
[23] E. V. Canettieri, G. J. D. M. Rocha, J. A. de Carvalho Jr., andJ. B. de Almeida e Silva, “Optimization of acid hydrolysis fromthe hemicellulosic fraction of Eucalyptus grandis residue usingresponse surface methodology,” Bioresource Technology, vol. 98,no. 2, pp. 422–428, 2007.
[24] A. Prathapan, M. K. Singh, S. S. Anusree, S. Kumar, A.Sundaresan, and K. G. Raghu, “Antiperoxidative, free radicalscavenging and metal chelating activities of Boerhaavia diffusaL,” Journal of Food Biochemistry, vol. 35, no. 5, pp. 1548–1554,2011.
[25] C.-C. Wong, H.-B. Li, K.-W. Cheng, and F. Chen, “A systematicsurvey of antioxidant activity of 30 Chinese medicinal plantsusing the ferric reducing antioxidant power assay,” Food Chem-istry, vol. 97, no. 4, pp. 705–711, 2006.

Submit your manuscripts athttp://www.hindawi.com
Hindawi Publishing Corporationhttp://www.hindawi.com Volume 2014
Inorganic ChemistryInternational Journal of
Hindawi Publishing Corporation http://www.hindawi.com Volume 2014
International Journal ofPhotoenergy
Hindawi Publishing Corporationhttp://www.hindawi.com Volume 2014
Carbohydrate Chemistry
International Journal of
Hindawi Publishing Corporationhttp://www.hindawi.com Volume 2014
Journal of
Chemistry
Hindawi Publishing Corporationhttp://www.hindawi.com Volume 2014
Advances in
Physical Chemistry
Hindawi Publishing Corporationhttp://www.hindawi.com
Analytical Methods in Chemistry
Journal of
Volume 2014
Bioinorganic Chemistry and ApplicationsHindawi Publishing Corporationhttp://www.hindawi.com Volume 2014
SpectroscopyInternational Journal of
Hindawi Publishing Corporationhttp://www.hindawi.com Volume 2014
The Scientific World JournalHindawi Publishing Corporation http://www.hindawi.com Volume 2014
Medicinal ChemistryInternational Journal of
Hindawi Publishing Corporationhttp://www.hindawi.com Volume 2014
Chromatography Research International
Hindawi Publishing Corporationhttp://www.hindawi.com Volume 2014
Applied ChemistryJournal of
Hindawi Publishing Corporationhttp://www.hindawi.com Volume 2014
Hindawi Publishing Corporationhttp://www.hindawi.com Volume 2014
Theoretical ChemistryJournal of
Hindawi Publishing Corporationhttp://www.hindawi.com Volume 2014
Journal of
Spectroscopy
Analytical ChemistryInternational Journal of
Hindawi Publishing Corporationhttp://www.hindawi.com Volume 2014
Journal of
Hindawi Publishing Corporationhttp://www.hindawi.com Volume 2014
Quantum Chemistry
Hindawi Publishing Corporationhttp://www.hindawi.com Volume 2014
Organic Chemistry International
ElectrochemistryInternational Journal of
Hindawi Publishing Corporation http://www.hindawi.com Volume 2014
Hindawi Publishing Corporationhttp://www.hindawi.com Volume 2014
CatalystsJournal of