RESEARCH ARTICLE Open Access Quantification of histone ... · RESEARCH ARTICLE Open Access...
12
RESEARCH ARTICLE Open Access Quantification of histone modification ChIP-seq enrichment for data mining and machine learning applications Stephen A Hoang, Xiaojiang Xu and Stefan Bekiranov * Abstract Background: The advent of ChIP-seq technology has made the investigation of epigenetic regulatory networks a computationally tractable problem. Several groups have applied statistical computing methods to ChIP-seq datasets to gain insight into the epigenetic regulation of transcription. However, methods for estimating enrichment levels in ChIP-seq data for these computational studies are understudied and variable. Since the conclusions drawn from these data mining and machine learning applications strongly depend on the enrichment level inputs, a comparison of estimation methods with respect to the performance of statistical models should be made. Results: Various methods were used to estimate the gene-wise ChIP-seq enrichment levels for 20 histone methylations and the histone variant H2A.Z. The Multivariate Adaptive Regression Splines (MARS) algorithm was applied for each estimation method using the estimation of enrichment levels as predictors and gene expression levels as responses. The methods used to estimate enrichment levels included tag counting and model-based methods that were applied to whole genes and specific gene regions. These methods were also applied to various sizes of estimation windows. The MARS model performance was assessed with the Generalized Cross-Validation Score (GCV). We determined that model-based methods of enrichment estimation that spatially weight enrichment based on average patterns provided an improvement over tag counting methods. Also, methods that included information across the entire gene body provided improvement over methods that focus on a specific sub-region of the gene (e.g., the 5’ or 3’ region). Conclusion: The performance of data mining and machine learning methods when applied to histone modification ChIP-seq data can be improved by using data across the entire gene body, and incorporating the spatial distribution of enrichment. Refinement of enrichment estimation ultimately improved accuracy of model predictions. Background Recent advances in high-throughput DNA sequencing technology have facilitated the generation of vast amounts of epigenomic ChIP-seq data. The availability of these datasets has provided the opportunity to utilize the power of statistical computing to model epigenomic networks. Unlike conventional biochemical approaches, the application of machine learning and data mining techniques to ChIP-seq data is capable of providing a broad, network-level view of the epigenetic regulatory system. These strategies can provide insights into mechanisms of genomic control, such as the so-called “histone code [1-3],” by facilitating an integrated analysis of the many histone posttranslational modifications (PTMs) that have been described, as well as other epige- netic chromatin modifications. The histone code is a particularly attractive problem for computational appli- cations, since it has become apparent that histone PTMs are regulated in a network fashion and are depos- ited combinatorially [4-6]. However, a thorough study of the gene-biased quantification of ChIP-seq enrichment for the application of data mining and machine learning techniques has not yet been done. * Correspondence: [email protected] Department of Biochemistry and Molecular Genetics, University of Virginia Health System, Charlottesville, Virginia, USA Hoang et al. BMC Research Notes 2011, 4:288 http://www.biomedcentral.com/1756-0500/4/288 © 2011 Bekiranov et al; licensee BioMed Central Ltd. This is an open access article distributed under the terms of the Creative Commons Attribution License (http://creativecommons.org/licenses/by/2.0), which permits unrestricted use, distribution, and reproduction in any medium, provided the original work is properly cited.
Transcript of RESEARCH ARTICLE Open Access Quantification of histone ... · RESEARCH ARTICLE Open Access...

RESEARCH ARTICLE Open Access
Quantification of histone modification ChIP-seqenrichment for data mining and machinelearning applicationsStephen A Hoang, Xiaojiang Xu and Stefan Bekiranov*
Abstract
Background: The advent of ChIP-seq technology has made the investigation of epigenetic regulatory networks acomputationally tractable problem. Several groups have applied statistical computing methods to ChIP-seqdatasets to gain insight into the epigenetic regulation of transcription. However, methods for estimatingenrichment levels in ChIP-seq data for these computational studies are understudied and variable. Since theconclusions drawn from these data mining and machine learning applications strongly depend on the enrichmentlevel inputs, a comparison of estimation methods with respect to the performance of statistical models should bemade.
Results: Various methods were used to estimate the gene-wise ChIP-seq enrichment levels for 20 histonemethylations and the histone variant H2A.Z. The Multivariate Adaptive Regression Splines (MARS) algorithm wasapplied for each estimation method using the estimation of enrichment levels as predictors and gene expressionlevels as responses. The methods used to estimate enrichment levels included tag counting and model-basedmethods that were applied to whole genes and specific gene regions. These methods were also applied to varioussizes of estimation windows. The MARS model performance was assessed with the Generalized Cross-ValidationScore (GCV). We determined that model-based methods of enrichment estimation that spatially weight enrichmentbased on average patterns provided an improvement over tag counting methods. Also, methods that includedinformation across the entire gene body provided improvement over methods that focus on a specific sub-regionof the gene (e.g., the 5’ or 3’ region).
Conclusion: The performance of data mining and machine learning methods when applied to histonemodification ChIP-seq data can be improved by using data across the entire gene body, and incorporating thespatial distribution of enrichment. Refinement of enrichment estimation ultimately improved accuracy of modelpredictions.
BackgroundRecent advances in high-throughput DNA sequencingtechnology have facilitated the generation of vastamounts of epigenomic ChIP-seq data. The availabilityof these datasets has provided the opportunity to utilizethe power of statistical computing to model epigenomicnetworks. Unlike conventional biochemical approaches,the application of machine learning and data miningtechniques to ChIP-seq data is capable of providing abroad, network-level view of the epigenetic regulatory
system. These strategies can provide insights intomechanisms of genomic control, such as the so-called“histone code [1-3],” by facilitating an integrated analysisof the many histone posttranslational modifications(PTMs) that have been described, as well as other epige-netic chromatin modifications. The histone code is aparticularly attractive problem for computational appli-cations, since it has become apparent that histonePTMs are regulated in a network fashion and are depos-ited combinatorially [4-6]. However, a thorough study ofthe gene-biased quantification of ChIP-seq enrichmentfor the application of data mining and machine learningtechniques has not yet been done.
* Correspondence: [email protected] of Biochemistry and Molecular Genetics, University of VirginiaHealth System, Charlottesville, Virginia, USA
Hoang et al. BMC Research Notes 2011, 4:288http://www.biomedcentral.com/1756-0500/4/288
© 2011 Bekiranov et al; licensee BioMed Central Ltd. This is an open access article distributed under the terms of the CreativeCommons Attribution License (http://creativecommons.org/licenses/by/2.0), which permits unrestricted use, distribution, andreproduction in any medium, provided the original work is properly cited.

Several groups have applied various data mining andmachine learning techniques to epigenomic ChIP-seqdata in a gene-biased fashion, including Bayesian net-works [7,8], support vector machines and regression [8],linear [6,8,9] and nonlinear regressions [6]. These mod-els have focused on histone modifications due in part totheir known role in transcriptional regulation [10-12]and the availability of rich datasets exhibiting a widevariety of types of histone modifications [10]. Thesemodels have been built using individual genes as obser-vations, ChIP-seq enrichments as predictors, and geneexpression as responses in the case of supervised learn-ing methods. In these models the predictors are histonemodification/variant ChIP-seq enrichment levels forindividual genes, so model quality is highly dependenton the accuracy of enrichment estimation. Since ChIP-seq enrichment levels are strongly dependent on geno-mic coordinate, providing a gene-wise estimate of ChIP-seq enrichment that accurately captures the relevantenrichment information across all genes–which vary inlength over four orders of magnitude–is a challengingtask.The most straightforward way to estimate per-gene
ChIP-seq enrichment is to simply count the number ofsequence reads associated with a given gene. Indeed,counting the number of reads in the promoter region ofeach gene was an approach taken in some previous stu-dies [7,9]; however, this method has several limitations.First, tag-counting methods equally weight every posi-tion within the counting window, and thus ignore thespatial component of the enrichment data. Second, notevery histone modification is 5’ biased. Several modifica-tions have greater enrichment into the body of genes,such as H3K36me3 [10,12,13]. This modification high-lights the pitfalls associated with 5’ biased enrichmentestimation. It has greater enrichment in the bodies ofgenes, is indeed 3’ biased, and has a proclivity forenrichment in exons [13,14]. H3K36me3 also has astrong correlation with transcriptional elongation asdetermined by various biochemical studies [10,14-16]. Itis worth noting that a machine learning study by Yu etal. used a 5’ tag counting method and found little corre-lation between H3K36me3 enrichment and gene expres-sion [7]. The consequence for models that use 5’proximal enrichment estimation methods is that theeffects of histone modifications with gene body or 3’biased enrichment are underestimated or greatlyobscured.Histone methylations tend to have unique average
spatial deposition patterns [10]. For example, in contrastto H3K36me3, H3K4me3 has high enrichment aroundthe transcription start site, with depletion in the nucleo-some-free region. Some modifications seem to be depos-ited in a specific genic region with respect to the
absolute positions of nucleosomes relative to geneboundaries, while the patterns of others seem to scalewith gene length. These effects can be attributed, atleast in part, to the recruitment of histone methyltrans-ferases that are dependent on the phosphorylation stateof the C-terminal domain of Pol II before and duringthe elongation process [13,16-18]. Estimating ChIP-seqenrichment is complicated by the different modes of his-tone PTM deposition coupled with the wide variabilityin gene lengths. Part of the information content asso-ciated with a given histone modification is encodedwithin the spatial distribution of the enrichment data,and so it should also be considered when estimatingenrichment levels.The selection of a genomic window used for the cal-
culation of enrichment levels is important in capturingrelevant enrichment data, since enrichment informationmay be 5’ or 3’ proximal, intergenic, or intragenic [8].Choosing a window size that extends too far outside ofgene boundaries may incorporate data from neighboringregions, and selecting a window size that is too smallmay exclude useful data. The goal in window selectionis to maximize useful information content and minimizethe incorporation of noise, while being generalizableacross a variety of marks.Since the quality of a statistical model is largely
dependent on the quality of the observation data usedto build it, refining enrichment estimation methods isimportant for future statistical analyses of ChIP-seqdata. To resolve some of the issues involved withenrichment estimation, we compared the performanceof models built using a ChIP-seq dataset of histonemethylations/variant in CD4+ T-cells generated byBarski et al. [10]. This dataset has been used in severalother machine learning and data mining studies [6,7,9].We applied the Multivariate Adaptive Regression Splines(MARS) algorithm [19,20] to build nonlinear regressionmodels using enrichment levels of 20 histone lysine andarginine methylations plus histone variant H2A.Z. Giventhat gene expression levels have been shown to behighly dependent on histone modification levels, weused the Generalized Cross-Validation (GCV) [19] andR2 metrics to assess the quality of MARS model fits andrank enrichment estimation methods.Several different strategies were employed for estimat-
ing gene-wise enrichment levels, including tag countingand model-based approaches, which use average enrich-ment patterns to spatially weight enrichment of indivi-dual genes in a set of genomic windows. We alsoinvestigated the selection of window sizes for our gene-wise enrichment estimation methods. By comparingmodels using GCV and R2 values, we demonstrate thatthe performance of regression models using histonemodification enrichment levels as predictors can be
Hoang et al. BMC Research Notes 2011, 4:288http://www.biomedcentral.com/1756-0500/4/288
Page 2 of 12

greatly affected by the chosen enrichment estimationmethod. We conclude that methods that incorporate thespatial distribution of ChIP-seq enrichment offer animprovement in a regression fit over tag counting meth-ods. We also observe that whole-gene estimation win-dows produce superior results relative to estimationsrestricted to specific genic regions. Indeed, incorporatingdata across the entire body of the gene was the mostimportant factor in improving the fit of our models.These improvements of gene-wise ChIP-seq enrichmentestimation can improve the sensitivity and specificity ofthe predictions derived from data mining and machinelearning models.
MethodsGene selectionA list of gene transcript annotations was downloadedfrom the NCBI36 Homo sapiens database, Ensembl 54(June 24, 2009), which was then filtered to only includetranscripts that had Ensembl, UCSC, and RefSeq IDs.Genes that did not have corresponding expression dataassociated with them were removed from the list. Manyof the transcripts within this list contain multiple anno-tated start and stop sites. Using the same proceduredescribed by Xu et al. [6], we select a single Transcrip-tion Start Site (TSS) and Transcription End Site (TES)for each gene.Some of the enrichment estimation methods described
in this study calculate enrichment within a windowaround the TSSs and TESs, the largest of which weemployed was ±3000 bp around each site. To avoidoverlap between windows where the enrichment esti-mate was a combination of estimates from both ends ofthe genes, the gene list was further filtered to onlyinclude transcripts of length 6002 bp or greater.Although not all enrichment estimation strategies havethis limitation, the filtered list was used for each enrich-ment estimation method to allow a fair comparison ofthe final models. After implementing each of the afore-mentioned filters, the final gene list totaled 9882 genes.
Tag Repeat FilterPCR sequence artifacts or phenomena inherent to thesequencing technology may cause repeat sequences tobe produced. These artifacts manifest as large numbersof tags that map to precisely the same genomic coordi-nates. With the exception of H3K79 methylations, maxi-mum repeats ranged from 231 for H3K4me2 to 4231for H3K9me3. H3K79me1/2/3 had far fewer repeatswith maximums of 23, 26, and 42, respectively. Weidentified these tag “pile-ups” by searching for multipletags that mapped to the genome with precisely the samestart and stop coordinates (or for differing tag lengths,within the margin of the difference in length). A cutoff
of 75 repeats was chosen empirically for the modifica-tion H3K4me3 (max repeats = 1166) to filter repeat arti-facts from H3K4me3 data. We assumed that the typicalnumber of tags in these piles for a given mark crudelyscaled with the total number of tags. Thus, the cutoffwas scaled for other modifications by the total tag countrelative to H3K4me3, and ranged from 21 (H3K79me2)to 75 (H3K4me3). H3K4me3 was chosen to determinethe cutoff because it had the largest total tag count, andits tendency to form large localized peaks relative to theother modifications. This helped ensure that our cutoffwas not overly stringent and was only sensitive toextreme outliers.Using this filtering scheme H3K79me1/2/3 had data
removal percentages of 0%, 0.001%, and 0.004%, respec-tively. H4K20me3, which had relatively large numbers ofreads that mapped to repeat sequences, had 5% of alldata removed. All other marks ranged from 0.01%(H3K4me1) to 0.5% (H3K9me3) of data removed. Thus,we removed extreme outliers while minimally affectingthe overall data set.
Tag countingTag counting is the summation of ChIP-seq readswithin a genomic window. Any part of a read fallingwithin a window was included in our tag counts. Fol-lowing previous studies using tag counting methods, tagcount enrichments were calculated in ±500 bp, ±1000bp, ±2000 bp, and ±3000 bp windows relative to boththe annotated Transcription Start Sites (TSS) and theTranscription End Sites (TES). While evaluating whichgenic sub-regions to include in tag counting methods,we assessed how the inclusion of tag counts withinexons as a genic sub-region category improved modelperformance and found their contribution was negligible(Additional file 1). We therefore did not consider tagcounts solely within exons further. For clarity, exonswere not excluded from other counting methods.Another set (one for each window size) of gene-wisecount-based enrichment estimates were produced bysumming the TSS counts with the TES counts multi-plied by a scaling factor for each of the 21 histonemarks:
Ejk = CTSSjk + αkC
TESjk (1)
Where j is the gene, k is the modification type, E isenrichment estimate, C is the tag count in the window,and a is a scaling factor. The purpose of the scaling fac-tor, a, is to effectively weight the contribution of the 5’and 3’ ends with respect to gene expression. The scalingfactor was calculated for each modification by optimiz-ing the absolute value of the correlation between thesum of the two tag count values and gene expression:
Hoang et al. BMC Research Notes 2011, 4:288http://www.biomedcentral.com/1756-0500/4/288
Page 3 of 12

∣∣Cor (Y,CTSS
k + αCTESk
)∣∣ =
∣∣∣∣∣∣∣Cov
(Y,CTSS
k + αCTESk
)√Var (Y)Var
(CTSSk + αCTES
k
)
∣∣∣∣∣∣∣(2)
where Y is gene expression level. The correlation wasoptimized numerically with respect to a, for each modi-fication type, k.A set of whole-gene tag count enrichments was calcu-
lated within a window defined by the gene boundariesplus flanking intergenic regions immediately adjacent tothe annotated gene boundaries. Counts were normalizedby dividing by the length of the counting window. Sets ofnormalized counts were calculated for the gene bodiesplus 0 bp, 500 bp, 1000 bp, 2000 bp, and 3000 bp over-hangs up and downstream of the gene boundaries.
Iterative model-based enrichment estimationUsing a strategy similar to the one described by Xu etal. [6], we create a “template” tik for each mark k. Thetemplate is the normalized average enrichment profilefor a given mark, within a window relative to gene coor-dinates, i:
tik =1N
N∑j=1
cijk (3)
where cijk is the enrichment of a mark k for a gene j atgenomic coordinate i and N is the total number ofgenes. Templates were normalized by a constant suchthat:
1N
∑i
tnik = 1 (4)
where tnik is the normalized template, and N is thenumber of bins. We assume that the enrichment profileof a given gene can be approximated by a template tikmultiplied by an enrichment level estimate Xjk of a markk for a given gene j. The least squares difference Qjk
between the estimated enrichment profile Xjktik and theactual data is given by:
Qjk =∑i
(cijk − Xjktik
)2(5)
By minimizing Qjk with respect to the enrichment esti-mate Xjk and applying the normalization constraintgiven by equation 4 we arrive at the following enrich-ment estimate equation:
Xjk =
∑itnikcijk
∑itnik
2 (6)
In addition to using a non-weighted average templateas shown in equation 3, we minimized Qjk with respectto the template tik to arrive at the following enrichmentestimate weighted tag count template equation:
tik =
∑jXjkcijk
∑jX2jk
(7)
Equations 6 and 7 can be solved iteratively, subject tothe template normalization constraint given by equation4. An iterative solution of these equations minimizes theleast squares difference between the modeled enrich-ment data Xjktnik and the actual data cijk. In the case ofthe iterative solution, the template is the enrichmentestimate weighted average tag count across genomiccoordinate, i. The value of Xjk is ultimately a weightedaverage of enrichment across a genomic window, pro-viding a single-value estimate of enrichment that incor-porates information from the spatial distribution of theenrichment data. For our calculations the iterative pro-cess continued until the average difference between thenth and the (n+1)th set of enrichment estimations con-verged to less than 5% of the nth set values.Using this iterative model-based strategy, enrichment
levels were estimated around both the TSS and TES in±500 bp, ±1000 bp, ±2000 bp, and ±3000 bp windows,with single base pair resolution (i.e., i corresponds to asingle base pair in the window). Enrichment estimateswere also made with templates consisting of the TSSand TES windows combined (calculated as a single tem-plate) using the same four window sizes. In summary, aset of 5’, 3’, and 5’+3’ enrichment estimations weremade for each of the window sizes.In another set of enrichment estimates, genes were
scaled to correspond to a fixed number of bins. Thescaling procedure described by Xu et al. [6] was usedwith bin number equal to 33,346–the median genelength in the filtered gene list. The template procedurewas applied to the scaled genes plus an intergenic over-hang of 0 bp, 500 bp, 1000 bp, 2000 bp, and 3000 bpbeyond the TSS and TES. The resolution of the genes isequal to gene length divided by bin number, while theoverhang regions have base-pair resolution.
Non-iterative model-based enrichment estimateThe process of iteratively solving equations 4, 6, and 7 iscomputationally expensive. A non-iterative enrichmentestimation can be made with equation 6 using the non-weighted average template shown in equations 3 and 4.To examine the trade off between computational effi-ciency and template optimization, we produced one set
Hoang et al. BMC Research Notes 2011, 4:288http://www.biomedcentral.com/1756-0500/4/288
Page 4 of 12

of enrichment estimates calculated non-iteratively forevery set calculated using the iterative method.
Evaluation of template modelsFollowing Xu et al. [6], we used the coefficient of varia-tion of the root mean square deviation CV(RMSD) toevaluate the fit of our templates:
CVjk (RMSD) = X−1jk
√√√√√n∑i
(cijk − Xjktik
)2
n
(8)
where n is the number of indices in the template. Thismetric was used to compare the fit of iterative and non-iterative template models.
MARS model construction and evaluationMARS models were built with each set of enrichmentestimations (51 in total) using the earth package in Rhttp://cran.r-project.org/web/packages/earth/index.html.Following Xu et al., each model was allowed terms withup to 3 degrees of interaction. The quality of eachmodel was evaluated using R2 values and GCV scores.The GCV score evaluates the fit of the model whilepenalizing model complexity, whereas the R2 only con-siders the fit of the model to the data. A description ofthe MARS algorithm and GCV scores can be found inthe ‘Methods’ section of Xu et al. [6].
Results and discussionOverview of model constructionA total of 51 enrichment level estimates were made for21 marks for 9882 Ensembl genes, corresponding to 51different MARS models. Figure 1 shows a summary ofeach enrichment estimation method. The responses ofthe models are gene expression data in CD4+ T cellsgathered from the SymAtlas database [21]. In caseswhere multiple Affymetrix probe sets interrogated a sin-gle gene, additional observations were included in themodel corresponding to each independent expressionmeasurement with redundant enrichment data, resultingin 15,148 observations and 21 predictors per model.
Template model error analysisTo assess the fit of our template-based enrichmentmodels to the enrichment data we used the CV(RMSD),as described in the Methods section. The CV(RMSD)was calculated and averaged for all genes above the 95th
percentile in enrichment estimations. Table 1 shows theCV(RMSD) for whole gene templates plus a 2000 bpintergenic overhang, for both non-iterative and iterativemethods. In 13 of the 21 marks the iterative procedureimproved the CV(RMSD); however, the iterative enrich-ment model performs more poorly than the correspond-ing non-iterative model for 8 marks.The iterative and non-iterative H4K20me3 template
models had the worst CV(RMSD)s (8.11 and 5.87,
Figure 1 Illustration of enrichment estimation methods. Summary of the methods used to make single-value estimates of gene-wise ChIP-seq enrichment. The first column lists the enrichment estimation methods. The second column lists the window sizes for which each method isapplied. The last column shows a graphical representation of the estimation region for each method/window size combination relative to thetranscription start sites (TSS) and transcription end sites (TES) of genes.
Hoang et al. BMC Research Notes 2011, 4:288http://www.biomedcentral.com/1756-0500/4/288
Page 5 of 12

respectively). Moreover, the iterative template performedmuch more poorly than the non-iterative. In this case,H4K20me3 is highly enriched in members of the zinc-finger (ZNF) gene family, and at low levels with a differ-ent enrichment profile across the genes in the rest ofthe genome [10,22]. Thus, for H4K20me3, there are atleast two classes of enrichment profiles across genes.The iterative template is weighted by enrichment, andhence biased toward the ZNF genes. Thus it yields apoor CV(RMSD) for the majority of genes in the gen-ome that have a different profile and have relatively lowlevels of H4K20me3 across their bodies. One way ofresolving this problem is to apply clustering analysis tothe H4K20me3 enrichment profiles across genes andidentify the two or three dominant deposition profilesand apply the appropriate template to each subset ofgenes. Nevertheless, the iterative template methodrequired significantly more computational resourcesthan the non-iterative method and only marginalimprovements in the CV(RMSD) of 13 of the 21 marks,and in MARS model performance (as discussed in the
“Enrichment estimation and model performance” sec-tion). This suggests that the non-iterative templateapproach may be preferable to the iterative enrichmentestimation method for many applications.
Enrichment estimation and model performanceWe found a clear trend in model performance withrespect to the enrichment estimation procedure used tocalculate the model predictors. GCV scores range from2.656 to 3.564 and R2 values range from 0.517 to 0.339across the 51 models. Figure 2 contains a summary ofall models and their statistics. As expected, 3’ estimatesusing small estimation windows yielded models with thepoorest performance. Except for the whole gene esti-mates with no intergenic overhang, for equal windowsizes, models based on tag counting estimates werealways outperformed by either iterative or non-iterativetemplate-based estimates, as measured by GCV score.With the exception of 2 (whole gene tag counts with 0and 500 bp intergenic overhangs) out of the 17 tagcount-based models, both the iterative and non-iterativetemplate-based models outperformed the tag count-based models for the same window size. Models basedon whole-gene estimates outperformed all other models.The iterative enrichment estimation method was
intended to improve the fit of the template to the data;however, this does not mean that the estimated enrich-ment level produces a final MARS model with a betterfit. Indeed, we found this to be true in our models. Ofthe 17 pairs of iterative and non-iterative template-based enrichment estimations, 10 produced models inwhich the iterative method was superior, and 7 in whichthe non-iterative method was superior. However, bothmethods produced models with similar statistics (Figure1). A possible explanation for this result is that theiterative method yields a template that is an estimation-weighted average of enrichment across genomic coordi-nates. Thus, genes with large outlier enrichment valuesfor a given mark could be driving the shape of the itera-tive template. For H4K20me3, which produced thepoorest CV(RMSD)s and a largest increase in CV(RMSD) in the iterative estimate relative to the non-iterative estimate, outliers did drive poor performance.As previously discussed ZNF repeats are highly enrichedfor this mark while most non-ZNF genes have an extre-mely modest enrichment. The genes that had the largestabsolute deviation between iterative and non-iterativeenrichment estimates were indeed ZNF genes. This sug-gests that datasets with extreme outliers may be poorlyrepresented by the iterative enrichment estimate. Incor-porating robust estimation procedures (e.g., trim mean)into template and enrichment estimation calculationsmay improve the results of the iterative enrichment esti-mation method.
Table 1 CV(RMSD) for whole gene templates plus a 2000bp intergenic overhang
Mark CV(RMSD)
Non-Iterative Iterative
H2AZ 3.382 4.442
H2BK5me1 1.940 1.957
H3K27me1 1.973 1.970
H3K27me2 2.960 2.957
H3K27me3 2.599 2.601
H3K36me1 2.919 2.913
H3K36me3 1.793 1.838
H3K4me1 2.007 1.943
H3K4me2 2.366 2.310
H3K4me3 2.955 3.189
H3K79me1 1.812 1.806
H3K79me2 1.820 1.802
H3K79me3 1.798 1.795
H3K9me1 1.861 1.810
H3K9me2 3.046 3.055
H3K9me3 4.114 4.550
H3R2me1 2.524 2.521
H3R2me2 3.581 3.575
H4K20me1 1.497 1.489
H4K20me3 5.871 8.112
H4R3me2 3.175 3.174
The CV(RMSD) shows the fit of template models to the enrichment data. Thefirst column shows the mark. The second column shows the CV(RMSD) for thenon-iterative template. The third column shows the CV(RMSD) for the iterativetemplate. The CV(RMSD) is improved (lowered) by the iterative template overthe non-iterative template in 13 of the 21 marks.
Hoang et al. BMC Research Notes 2011, 4:288http://www.biomedcentral.com/1756-0500/4/288
Page 6 of 12

Selection of window size was also a factor in modelperformance. For the window sizes considered, largerwindow sizes always yielded improved model fits for any5’ and/or 3’-focused method. Not surprisingly, anincrease in the amount of data used to calculate the pre-dictors generally improved the performance of the mod-els. However, this does not hold true for the whole-genetag counting and scaled-gene methods. For these meth-ods, the size of the overhang region is a relatively small
fraction of the total genomic coverage used in the per-gene enrichment estimation.The estimate method with the best performance based
on GCV score was the whole-gene, non-iterative, tem-plate-based method with a 2000 bp intergenic overhang,which achieved a GCV score of 2.656. The whole-genemethod that received the poorest GCV score was thetag count with 3000 bp intergenic overhangs, which hada GCV score of 2.696. The difference in model GCV
Figure 2 Comparison of enrichment estimation methods by MARS model statistics. Plots of (A) GCV and (B) R-squared values for MARSmodels built with each enrichment estimation method. GCV scores are sorted in descending order; small GCV scores are indicative of superiormodel fit. R-squared values are sorted in ascending order; large R-squared values are indicative of superior model fit. Models based on whole-gene enrichment estimates group together as the best models by both metrics.
Hoang et al. BMC Research Notes 2011, 4:288http://www.biomedcentral.com/1756-0500/4/288
Page 7 of 12
score between the best and worst whole-gene enrich-ment estimation methods was only 0.04, correspondingto 1.5% difference in GCV score; the associated p-value< 0.001. Significance was assessed by randomly permut-ing mark amplitudes with respect to genes. MARS wasthen applied to the randomly permuted data and GVCscores were calculated for the best and worst whole-gene enrichment estimation method as well as the per-cent difference in GCV score. A null distribution andcorresponding p-value were calculated by repeating thisprocedure 1000 times. The worst whole-gene estimationmethod had a GCV score, which was 0.129 (4.6%) belowthat of the best method based on specific genic regions(5’+3’ iterative template with 3000 bp intergenic over-hang). The associated p-value < 0.001 based on thesame random permutation procedure described above.This suggests that the most important factor when esti-mating gene-wise ChIP-seq enrichment is the inclusionof data across the entire length of gene bodies. Addi-tionally, unlike the methods based on localized regions,the whole-gene methods do not show a strong correla-tion between model performance and window size;further suggesting that the enrichment data in the bodyof the gene contains the majority of the informationcontent for a given gene.The Spearman correlation between the iterative and
non-iterative template-based (2000 bp intergenic over-hang) enrichment estimates was 0.994 or better acrossall marks. As expected, the largest deviations betweenthe methods were in estimates of H4K20me3 in theZNF genes. Correlations of enrichment estimationsbetween whole-gene tag counting and template-basedmethods (2000 bp intergenic overhang) had a medianvalue of 0.983, and exceeded 0.925 for all marks exceptfor H2A.Z and H3K4me3. The correlations between thetag counting method and the iterative and non-iterativemethods for H2A.Z were 0.659 and 0.675 respectively,and 0.775 and 0.771 for H3K4me3. These relatively lowcorrelations can be attributed to the fact that on averagethese two marks have extremely high enrichment withina few hundred base pairs of the TSS, which rapidly fallsto nearly zero beyond 2000 bp into the gene body. Noother marks show such a dramatic difference betweenthe gene body and TSS region. For extremely largegenes, this means an underestimation of the enrichmentusing the length-normalized tag count. Indeed, many ofthe largest deviations between the estimation methodsfor these marks were for genes that were on the mega-base scale in length (Additional file 2). Large deviationsalso occurred when few tags were observed within theestimation window. In these cases, differences betweenenrichment estimation methods can be attributed tocoordinate-dependent differences in weighting. In somecases of 5’ proximal marks, genes that were not enriched
for the mark were flanked by genes that were (Addi-tional file 3). The 5’ enrichment of the neighbor wouldsometimes bleed into the 3’ region of the non-enrichedgene, causing a large enrichment estimate using the tagcounting method relative to the template-based meth-ods. Since the template-based methods are a weightingscheme based on the average enrichment pattern, theintruding enrichment is down-weighted. The template-based methods are subsequently able to deconvolveenrichment signals of genes that are close neighbors,and therefore represent an advantage of these methodsover tag counting.The accuracy and precision of amplitude estimation
for all of the methods considered could be improved bysubtracting background read levels and applying appro-priate noise filtering. High throughput sequence analysisof input DNA samples revealed that chromatin structureaffects shearing and other aspects of ChIP sample pre-paration, and hence introduces biases in ChIP-seq data[23]. This together with sequence dependent biasescoming from PCR amplification of ChIP samples arguesfor methods that assume an inhomogeneous back-ground. One approach would be to use input DNA orother control samples to estimate inhomogeneous back-ground levels; however, an accurate method, which per-forms this analysis remains to be developed. Indeed arecent comparison of ChIP-chip and ChIP-seq data [24]showed that using Input-seq data as background froman unmatched sample can remove GC-content biasesbetter than use of a matched Input-seq sample. Thus,accurate background estimation and subtraction is stillan area of active research. One ChIP-seq peak findingmethod, SICER [25], which is designed to identify signif-icantly enriched domains in histone modification datacan also be applied as a background noise filter. SICERperforms the filtering based on significance. The gen-ome is segmented into windows and those that are notmembers of significantly enriched islands are filteredout (i.e., set to zero). However, a significance-based fil-tering approach is not ideal for amplitude estimationand statistical learning applications because accurateestimates of even low, albeit insignificant, enrichmentsare important. High frequency noise could be removedby applying low pass filters using wavelets. Indeed,wavelet analysis has been applied to genomic tiling arrayChIP-chip data to denoise the data [26] and could begeneralized for ChIP-seq noise filtering.
Enrichment profile and gene lengthThe superlative performance of the scaled-gene enrich-ment estimation methods was unexpected consideringmany of the histone modifications in this study appearto have TSS-focused enrichment [10]. It was initiallyunclear as to whether scaling genes to calculate the
Hoang et al. BMC Research Notes 2011, 4:288http://www.biomedcentral.com/1756-0500/4/288
Page 8 of 12
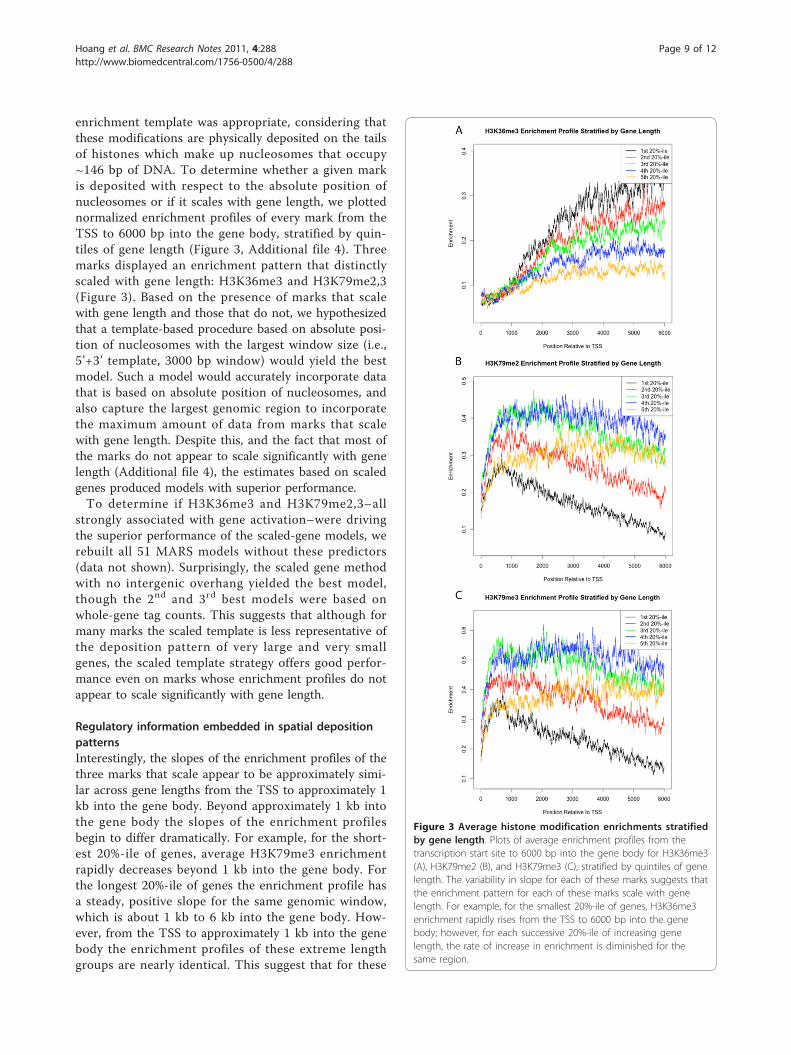
enrichment template was appropriate, considering thatthese modifications are physically deposited on the tailsof histones which make up nucleosomes that occupy~146 bp of DNA. To determine whether a given markis deposited with respect to the absolute position ofnucleosomes or if it scales with gene length, we plottednormalized enrichment profiles of every mark from theTSS to 6000 bp into the gene body, stratified by quin-tiles of gene length (Figure 3, Additional file 4). Threemarks displayed an enrichment pattern that distinctlyscaled with gene length: H3K36me3 and H3K79me2,3(Figure 3). Based on the presence of marks that scalewith gene length and those that do not, we hypothesizedthat a template-based procedure based on absolute posi-tion of nucleosomes with the largest window size (i.e.,5’+3’ template, 3000 bp window) would yield the bestmodel. Such a model would accurately incorporate datathat is based on absolute position of nucleosomes, andalso capture the largest genomic region to incorporatethe maximum amount of data from marks that scalewith gene length. Despite this, and the fact that most ofthe marks do not appear to scale significantly with genelength (Additional file 4), the estimates based on scaledgenes produced models with superior performance.To determine if H3K36me3 and H3K79me2,3–all
strongly associated with gene activation–were drivingthe superior performance of the scaled-gene models, werebuilt all 51 MARS models without these predictors(data not shown). Surprisingly, the scaled gene methodwith no intergenic overhang yielded the best model,though the 2nd and 3rd best models were based onwhole-gene tag counts. This suggests that although formany marks the scaled template is less representative ofthe deposition pattern of very large and very smallgenes, the scaled template strategy offers good perfor-mance even on marks whose enrichment profiles do notappear to scale significantly with gene length.
Regulatory information embedded in spatial depositionpatternsInterestingly, the slopes of the enrichment profiles of thethree marks that scale appear to be approximately simi-lar across gene lengths from the TSS to approximately 1kb into the gene body. Beyond approximately 1 kb intothe gene body the slopes of the enrichment profilesbegin to differ dramatically. For example, for the short-est 20%-ile of genes, average H3K79me3 enrichmentrapidly decreases beyond 1 kb into the gene body. Forthe longest 20%-ile of genes the enrichment profile hasa steady, positive slope for the same genomic window,which is about 1 kb to 6 kb into the gene body. How-ever, from the TSS to approximately 1 kb into the genebody the enrichment profiles of these extreme lengthgroups are nearly identical. This suggest that for these
Figure 3 Average histone modification enrichments stratifiedby gene length. Plots of average enrichment profiles from thetranscription start site to 6000 bp into the gene body for H3K36me3(A), H3K79me2 (B), and H3K79me3 (C), stratified by quintiles of genelength. The variability in slope for each of these marks suggests thatthe enrichment pattern for each of these marks scale with genelength. For example, for the smallest 20%-ile of genes, H3K36me3enrichment rapidly rises from the TSS to 6000 bp into the genebody; however, for each successive 20%-ile of increasing genelength, the rate of increase in enrichment is diminished for thesame region.
Hoang et al. BMC Research Notes 2011, 4:288http://www.biomedcentral.com/1756-0500/4/288
Page 9 of 12

scaling marks, there is a region near the TSS, which isapproximately 1 kb in size, where these modificationsare deposited in a length-independent manner, butbeyond which the modifications are deposited in alength-dependent fashion.Of the non-scaling marks, all but four of the modifica-
tions in this study show differences in absolute enrich-ment levels across gene lengths (Additional file 4).Those that do not are H3K27me2, H3R2me2,H4R3me2, and H4K20me3. The greatest differencesappear in the longest 20%-ile, which has relatively lowenrichment for marks that are explicitly known to beassociated with gene activation, and relatively highenrichment for genes associated with gene repression,suggesting a global reduction of transcription in largegenes relative to small genes. Indeed, we find that thegenes in the largest 20%-ile of gene length show signifi-cantly lower gene expression than other genes (Addi-tional file 5). For methods that did not use the wholegene to arrive at enrichment estimates, we rebuilt mod-els with gene length included as a predictor to deter-mine if the superior performance of the whole-geneestimation methods were driven by the gene length bias.The best performing model of this set was the 5’+3’non-iterative template with a 3000 bp window, whichhad a GCV score of 2.831. The best model based onestimates in a specific genic region and without genelength as a predictor had a GCV score of 2.824. Thelack of improvement after including gene length as apredictor suggests that the performance of the whole-gene enrichment estimation methods was not driven bythe gene length bias.In addition to revealing information about transcrip-
tional regulation, templates and enrichment estimatesmay also provide information on co-regulation of PTMs.For example, H4K20me1 and H3K9me1 are known tobe preferentially deposited on the same nucleosomes invivo [27]. The correlation (Spearman) between the tem-plates of these two marks was 0.716, and the correlationbetween their enrichment estimates across genes was0.876. These strongly positive correlations of templatesand enrichment estimates of marks known to co-occursuggest that co-regulatory information can be gleanedfrom spatial distribution and magnitude of the enrich-ment data (see Additional files 6 and 7 for all enrich-ment and template correlations). For example, our datashow enrichment correlations of 0.889, 0.762, and 0.761between H2BK5me1 and H3K79me1/2/3, respectively.Template correlations between H2BK5me1 andH3K79me1/2/3 were 0.956, 0.910, and 0.924, respec-tively. The high correlation between H2BK5me1 andH3K79 methylation deposition patterns and levels acrossthe genome suggest that there may be a mechanisticlink (e.g., the enzymes that deposit these marks could be
on the same complex) between these histone PTMs thathas not yet been reported in biochemical studies. This isone of many cases where both the correlation betweentwo marks’ spatial profiles and enrichment levels acrossgenes is high (see Additional files 6 and 7 for all enrich-ment and template correlations). Using both enrichmentlevel and spatial deposition patterns across genomescould prove to be powerful at identifying biologicallyrelevant synergies between histone modifications, whichmake up the “histone code” [1-4].
ConclusionsGeneralizing a method for estimating ChIP-seq enrich-ment for multiple histone modifications is complicatedby the variability in the way different modifications aredeposited. This variability ultimately creates differentgene-wise ChIP-seq enrichment patterns, some of whichscale with gene length and some which do not. Tagcounting methods can yield high quality predictors forregression modeling, but ultimately some of the infor-mation content coded in the spatial distribution of thedata is lost. Although many modifications are highlyenriched at the 5’ end of genes, much of the useful dataassociated with a given gene is encoded in the body ofthe gene. Many previous studies have attempted to esti-mate enrichment by only focusing on the promoterregion, and in doing so, have forgone much of the rele-vant data.Using the MARS regression algorithm to build regres-
sion models with enrichment levels as predictors andgene expression as responses, we compared various stra-tegies for estimating gene-wise ChIP-seq enrichment for20 histone methylations and histone variant H2A.Z inhuman CD4+ T cells [10]. Enrichment estimation meth-ods were assessed and ranked by the quality of the mod-els produced, which was measured by GCV scores. Wehave demonstrated that, with respect to the cis-regula-tory role that the histone modifications/variant surveyedin this study play in controlling gene expression, themajority of the significant enrichment data lies withingene boundaries. Also, the incorporation of data acrosswhole genes, as well as spatially weighting enrichmentfor single-value estimations of gene-wise ChIP-seqenrichment can provide significant improvement overstrategies that focus on specific genic regions. Improvingmethods for the quantification of ChIP-seq data for sta-tistical modeling serves to sharpen the resolution of themodels and ultimately improves the conclusions thatcan be drawn from them.ChIP-seq technology facilitates the computational
interrogation of genomic control networks, and the con-clusions drawn by this study can serve to increase depthat which we can probe these networks using this tech-nology. The methods outlined in this work can be
Hoang et al. BMC Research Notes 2011, 4:288http://www.biomedcentral.com/1756-0500/4/288
Page 10 of 12
applied to almost any machine learning or data miningapplication that uses gene-wise ChIP-seq enrichment aspredictors or responses.
Additional material
Additional file 1: Supplemental Table 1. Screening of exons forinclusion as an independent genic region for further analysis. R2
values for MARS models built with one mark as a predictor and geneexpression as a response. The columns correspond to models that werebuilt with tag counts from the Transcription Start Site (TSS), TranscriptionTermination Site (TTS), exons, or sums of two or more of the values.From this analysis we determined that the contributions of exons alonewere relatively small, and would not be considered as an independentregion for further analysis.
Additional file 2: Supplemental Figure 1. Example of a highlyenriched 5’ region on a large gene. Enrichment of H3K4me3 and H2A.Z on ULK4 is highly 5’ localized. Since ULK4 is over 700 kb in length,length-normalized enrichment estimates for these marks on this genewould be underestimated relative to most genes.
Additional file 3: Supplemental Figure 2. Histone modifications atlocus where a 5’ mark on one gene overlaps with the 3’ region ofanother. Five prime enrichment of H3K4me3 and H2A.Z on C12orf62bleeds into the estimation window of GPD1, which is not enriched at its5’ end for either mark. A tag counting procedure would yield a largeenrichment estimate of GPD1 relative to a template-based enrichmentestimate since 3’ enrichment is down-weighted for these marks usingthe template based procedure. Thus, for this and similar cases, thetemplate-based enrichment estimates are better able to deconvolveneighboring ChIP-seq signals.
Additional file 4: Supplemental Figure 3. Average histonemodification enrichments stratified by gene length. Plots of averageenrichment profiles from the transcription start site to 6000 bp into thegene body, stratified by quintiles of gene length. All marks are includedexcept for H3K36me3, H3K79me2 and H3K79me3, which can be found inFigure 3. Most activating marks show decreased enrichment in longergenes, while repressive marks generally show increased enrichment inlonger genes, suggesting decreased average gene expression in longergenes.
Additional file 5: Supplemental Figure 4. Gene expression stratifiedby gene length. Box plots of gene expression stratified by quintiles ofgene length. There is a significant decrease in expression in the longest20%-ile of genes. Along with the observation that longer genes haverelatively high enrichment of repressive marks, and low enrichment ofactivating marks, this suggests that lower gene expression in longergenes is mediated by epigenetic mechanisms.
Additional file 6: Supplemental Table 2. Spearman’s rankcorrelation coefficients for all pairwise comparisons of enrichmentestimates. All pair-wise correlations between enrichment estimatescalculated using the scaled-gene non-iterative estimation procedure witha 2000 bp intergenic overhang.
Additional file 7: Supplemental Table 3: Spearman’s rankcorrelation coefficients for all pairwise comparisons of marktemplates. All pair-wise correlations between scaled-gene non-iterativetemplates with a 2000 bp intergenic overhang.
List of abbreviationsPTM: Posttranslational Modification; MARS: Multivariate Adaptive RegressionSplines; GCV: Generalized Cross-Validation; CV(RMSD): Coefficient of Variationof the Root Mean Square Deviation.
AcknowledgementsThis work was supported in part by the National Institutes of Health grantCA104397 from the National Cancer Institute (NCI). SAH was supported by
the University of Virginia Cancer Training Grant from the NCI(5T32CA009109).
Authors’ contributionsSAH calculated enrichment estimates, performed the MARS and CV(RMSD)analysis, drafted the manuscript and helped conceive the study. XXcalculated correlations of enrichment estimates and templates, and helpeddraft the manuscript. SB helped conceive the study, draft the manuscript,and guided the analysis. All authors read and approved the final manuscript.
Competing interestsThe authors declare that they have no competing interests.
Received: 24 May 2011 Accepted: 11 August 2011Published: 11 August 2011
References1. Strahl BD, Allis CD: The language of covalent histone modifications.
Nature 2000, 403(6765):41-45.2. Jenuwein T, Allis CD: Translating the histone code. Science 2001,
293(5532):1074-1080.3. Goldberg AD, Allis CD, Bernstein E: Epigenetics: a landscape takes shape.
Cell 2007, 128(4):635-638.4. Latham JA, Dent SY: Cross-regulation of histone modifications. Nat Struct
Mol Biol 2007, 14(11):1017-1024.5. Wang Z, Zang C, Rosenfeld JA, Schones DE, Barski A, Cuddapah S, Cui K,
Roh TY, Peng W, Zhang MQ, et al: Combinatorial patterns of histoneacetylations and methylations in the human genome. Nat Genet 2008,40(7):897-903.
6. Xu X, Hoang S, Mayo MW, Bekiranov S: Application of machine learningmethods to histone methylation ChIP-Seq data reveals H4R3me2globally represses gene expression. BMC Bioinformatics 11:396.
7. Yu H, Zhu S, Zhou B, Xue H, Han JD: Inferring causal relationships amongdifferent histone modifications and gene expression. Genome Res 2008,18(8):1314-1324.
8. Cheng C, Yan KK, Yip KY, Rozowsky J, Alexander R, Shou C, Gerstein M: Astatistical framework for modeling gene expression using chromatinfeatures and application to modENCODE datasets. Genome Biol 12(2):R15.
9. Karlic R, Chung HR, Lasserre J, Vlahovicek K, Vingron M: Histonemodification levels are predictive for gene expression. Proc Natl Acad SciUSA 107(7):2926-2931.
10. Barski A, Cuddapah S, Cui K, Roh TY, Schones DE, Wang Z, Wei G,Chepelev I, Zhao K: High-resolution profiling of histone methylations inthe human genome. Cell 2007, 129(4):823-837.
11. Kouzarides T: Histone methylation in transcriptional control. Curr OpinGenet Dev 2002, 12(2):198-209.
12. Campos EI, Reinberg D: Histones: annotating chromatin. Annu Rev Genet2009, 43:559-599.
13. Hon GC, Hawkins RD, Ren B: Predictive chromatin signatures in themammalian genome. Hum Mol Genet 2009, 18(R2):R195-201.
14. Kolasinska-Zwierz P, Down T, Latorre I, Liu T, Liu XS, Ahringer J: Differentialchromatin marking of introns and expressed exons by H3K36me3. NatGenet 2009, 41(3):376-381.
15. Bannister AJ, Schneider R, Myers FA, Thorne AW, Crane-Robinson C,Kouzarides T: Spatial distribution of di- and tri-methyl lysine 36 ofhistone H3 at active genes. J Biol Chem 2005, 280(18):17732-17736.
16. Krogan NJ, Kim M, Tong A, Golshani A, Cagney G, Canadien V, Richards DP,Beattie BK, Emili A, Boone C, et al: Methylation of histone H3 by Set2 inSaccharomyces cerevisiae is linked to transcriptional elongation by RNApolymerase II. Mol Cell Biol 2003, 23(12):4207-4218.
17. Komarnitsky P, Cho EJ, Buratowski S: Different phosphorylated forms ofRNA polymerase II and associated mRNA processing factors duringtranscription. Genes Dev 2000, 14(19):2452-2460.
18. Ng HH, Robert F, Young RA, Struhl K: Targeted recruitment of Set1histone methylase by elongating Pol II provides a localized mark andmemory of recent transcriptional activity. Mol Cell 2003, 11(3):709-719.
19. Friedman JH: Multivariate Adaptive Regression Splines. Annals of Statistics1991, 19(1):1-67.
20. Friedman JH: Multivariate Adaptive Regression Splines - Rejoinder. Annalsof Statistics 1991, 19(1):123-141.
Hoang et al. BMC Research Notes 2011, 4:288http://www.biomedcentral.com/1756-0500/4/288
Page 11 of 12
21. Su AI, Wiltshire T, Batalov S, Lapp H, Ching KA, Block D, Zhang J, Soden R,Hayakawa M, Kreiman G, et al: A gene atlas of the mouse and humanprotein-encoding transcriptomes. Proc Natl Acad Sci USA 2004,101(16):6062-6067.
22. Ernst J, Kellis M: Discovery and characterization of chromatin states forsystematic annotation of the human genome. Nat Biotechnol28(8):817-825.
23. Teytelman L, Ozaydin B, Zill O, Lefrancois P, Snyder M, Rine J, Eisen MB:Impact of chromatin structures on DNA processing for genomicanalyses. PLoS One 2009, 4(8):e6700.
24. Ho JW, Bishop E, Karchenko PV, Negre N, White KP, Park PJ: ChIP-chipversus ChIP-seq: lessons for experimental design and data analysis. BMCGenomics 12:134.
25. Zang C, Schones DE, Zeng C, Cui K, Zhao K, Peng W: A clusteringapproach for identification of enriched domains from histonemodification ChIP-Seq data. Bioinformatics 2009, 25(15):1952-1958.
26. Karpikov A, Rozowsky J, Gerstein M: Tiling array data analysis: a multiscaleapproach using wavelets. BMC Bioinformatics 12:57.
27. Sims JK, Houston SI, Magazinnik T, Rice JC: A trans-tail histone codedefined by monomethylated H4 Lys-20 and H3 Lys-9 demarcatesdistinct regions of silent chromatin. J Biol Chem 2006,281(18):12760-12766.
doi:10.1186/1756-0500-4-288Cite this article as: Hoang et al.: Quantification of histone modificationChIP-seq enrichment for data mining and machine learningapplications. BMC Research Notes 2011 4:288.
Submit your next manuscript to BioMed Centraland take full advantage of:
• Convenient online submission
• Thorough peer review
• No space constraints or color figure charges
• Immediate publication on acceptance
• Inclusion in PubMed, CAS, Scopus and Google Scholar
• Research which is freely available for redistribution
Submit your manuscript at www.biomedcentral.com/submit
Hoang et al. BMC Research Notes 2011, 4:288http://www.biomedcentral.com/1756-0500/4/288
Page 12 of 12