RESEARCH ARTICLE Open Access Evolutionarily consistent ... · RESEARCH ARTICLE Open Access...
10
RESEARCH ARTICLE Open Access Evolutionarily consistent families in SCOP: sequence, structure and function Ralph B Pethica 1* , Michael Levitt 2 and Julian Gough 1 Abstract Background: SCOP is a hierarchical domain classification system for proteins of known structure. The superfamily level has a clear definition: Protein domains belong to the same superfamily if there is structural, functional and sequence evidence for a common evolutionary ancestor. Superfamilies are sub-classified into families, however, there is not such a clear basis for the family level groupings. Do SCOP families group together domains with sequence similarity, do they group domains with similar structure or by common function? It is these questions we answer, but most importantly, whether each family represents a distinct phylogenetic group within a superfamily. Results: Several phylogenetic trees were generated for each superfamily: one derived from a multiple sequence alignment, one based on structural distances, and the final two from presence/absence of GO terms or EC numbers assigned to domains. The topologies of the resulting trees and confidence values were compared to the SCOP family classification. Conclusions: We show that SCOP family groupings are evolutionarily consistent to a very high degree with respect to classical sequence phylogenetics. The trees built from (automatically generated) structural distances correlate well, but are not always consistent with SCOP (hand annotated) groupings. Trees derived from functional data are less consistent with the family level than those from structure or sequence, though the majority still agree. Much of GO and EC annotation applies directly to one family or subset of the family; relatively few terms apply at the superfamily level. Maximum sequence diversity within a family is on average 22% but close to zero for superfamilies. Background Proteins are made up of domains. Protein domains in this context can be regarded as the building blocks of proteins, and the smallest units of protein evolution. A small protein may consist of a single domain, larger pro- teins maybe contain multiple domains. A domain can be defined as a protein unit which is seen in nature either on its own or in combination with other different domains. Detecting the evolutionary relationship between two or more domains using sequence information alone is often not possible, as sequences often diverge beyond the point of detection by comparison methods. Lack of sequence information does not necessarily show that there is no relationship between domains. If the three di- mensional structure of the domains is known, evolutionary relationships can usually be recognised. The Structural Classification of Proteins (SCOP) [1-3], is a hierarchical classification system of proteins for which atomic reso- lution three dimensional structures are known; units in SCOP are protein domains. The SCOP classification takes protein structures published in the Protein Data Bank (PDB) [4] as the primary data source from which the do- main classification is derived. The classification of do- mains is based on both manual curation and automatic methods, the balance of which has resulted in a classifi- cation system which is regarded as the ‘ gold standard’ , and is an essential bioinformatics resource. Levels of classification in SCOP from the top down are: class, fold, superfamily, family. A class is just a con- venient grouping, e.g. domains containing only alpha- helices. Folds and superfamilies have a clear and precise definition of what they are supposed to represent: a fold groups together domains which have the same topo- logical arrangement of secondary structure; a superfamily * Correspondence: [email protected] 1 Department of Computer Science, University of Bristol, The Merchant Venturers Building, Room 3.16, Woodland Road, Bristol, UK Full list of author information is available at the end of the article © 2012 Pethica et al.; licensee BioMed Central Ltd. This is an Open Access article distributed under the terms of the Creative Commons Attribution License (http://creativecommons.org/licenses/by/2.0), which permits unrestricted use, distribution, and reproduction in any medium, provided the original work is properly cited. Pethica et al. BMC Structural Biology 2012, 12:27 http://www.biomedcentral.com/1472-6807/12/27
Transcript of RESEARCH ARTICLE Open Access Evolutionarily consistent ... · RESEARCH ARTICLE Open Access...
Pethica et al. BMC Structural Biology 2012, 12:27http://www.biomedcentral.com/1472-6807/12/27
RESEARCH ARTICLE Open Access
Evolutionarily consistent families in SCOP:sequence, structure and functionRalph B Pethica1*, Michael Levitt2 and Julian Gough1
Abstract
Background: SCOP is a hierarchical domain classification system for proteins of known structure. The superfamilylevel has a clear definition: Protein domains belong to the same superfamily if there is structural, functional andsequence evidence for a common evolutionary ancestor. Superfamilies are sub-classified into families, however,there is not such a clear basis for the family level groupings. Do SCOP families group together domains withsequence similarity, do they group domains with similar structure or by common function? It is these questions weanswer, but most importantly, whether each family represents a distinct phylogenetic group within a superfamily.
Results: Several phylogenetic trees were generated for each superfamily: one derived from a multiple sequencealignment, one based on structural distances, and the final two from presence/absence of GO terms or EC numbersassigned to domains. The topologies of the resulting trees and confidence values were compared to the SCOPfamily classification.
Conclusions: We show that SCOP family groupings are evolutionarily consistent to a very high degree with respectto classical sequence phylogenetics. The trees built from (automatically generated) structural distances correlatewell, but are not always consistent with SCOP (hand annotated) groupings. Trees derived from functional data areless consistent with the family level than those from structure or sequence, though the majority still agree. Much ofGO and EC annotation applies directly to one family or subset of the family; relatively few terms apply at thesuperfamily level. Maximum sequence diversity within a family is on average 22% but close to zero forsuperfamilies.
BackgroundProteins are made up of domains. Protein domains inthis context can be regarded as the building blocks ofproteins, and the smallest units of protein evolution. Asmall protein may consist of a single domain, larger pro-teins maybe contain multiple domains. A domain can bedefined as a protein unit which is seen in nature eitheron its own or in combination with other different domains.Detecting the evolutionary relationship between two
or more domains using sequence information alone isoften not possible, as sequences often diverge beyondthe point of detection by comparison methods. Lack ofsequence information does not necessarily show thatthere is no relationship between domains. If the three di-mensional structure of the domains is known, evolutionary
* Correspondence: [email protected] of Computer Science, University of Bristol, The MerchantVenturers Building, Room 3.16, Woodland Road, Bristol, UKFull list of author information is available at the end of the article
© 2012 Pethica et al.; licensee BioMed CentralCommons Attribution License (http://creativecreproduction in any medium, provided the or
relationships can usually be recognised. The StructuralClassification of Proteins (SCOP) [1-3], is a hierarchicalclassification system of proteins for which atomic reso-lution three dimensional structures are known; units inSCOP are protein domains. The SCOP classification takesprotein structures published in the Protein Data Bank(PDB) [4] as the primary data source from which the do-main classification is derived. The classification of do-mains is based on both manual curation and automaticmethods, the balance of which has resulted in a classifi-cation system which is regarded as the ‘gold standard’,and is an essential bioinformatics resource.Levels of classification in SCOP from the top down
are: class, fold, superfamily, family. A class is just a con-venient grouping, e.g. domains containing only alpha-helices. Folds and superfamilies have a clear and precisedefinition of what they are supposed to represent: a foldgroups together domains which have the same topo-logical arrangement of secondary structure; a superfamily
Ltd. This is an Open Access article distributed under the terms of the Creativeommons.org/licenses/by/2.0), which permits unrestricted use, distribution, andiginal work is properly cited.

Pethica et al. BMC Structural Biology 2012, 12:27 Page 2 of 10http://www.biomedcentral.com/1472-6807/12/27
groups together domains which share a common evolu-tionary ancestor. The family level sub-groups domainswithin a superfamily, but unlike the other levels lacks aprecise definition. The first SCOP paper [1] states 30%sequence identity between members of a superfamily assignificant support for a family grouping. However, in thefirst release of SCOP there were far fewer protein struc-tures available (a total of 13073 domains), and selectingan arbitrary sequence identity cutoff was possible. Thereare now nearly ten times the number of domains (110800as of SCOP 1.75). The family level of the classificationfurther draws on structure and functional information inthe absence of strong sequence similarity, but the mean-ing and the properties of the family object in SCOPremains unclear.Many projects have been based on the SCOP classifi-
cation leading to several thousand citations [5-8]. Mostof these projects make use of the clear evolutionary def-inition of a domain, and of a superfamily, so a betterunderstanding of the family level will add value to futurework which makes use of SCOP, and enable new researchquestions to be addressed. The research presented in thispaper was carried out in order to elucidate the meaningand significance of the SCOP family level, in particularwith regard to sequence, structure and function and theirrelationships to family classification.We also draw on protein functional information taken
from gene ontology (GO) terms [9]. GO is a standar-dised vocabulary for depicting gene products in threebiological concepts: Biological Process, Molecular Func-tion and Cellular Component. Since many proteins areenzymes Enzyme Commission (EC) [10] numbers canalso aid in the understanding of protein function.
Results and discussionTo understand the meaning of a family, we comparedthe groupings of domains in SCOP to determine thesimilarity to automatically generated groupings based in-dependently on the three aspects we wished to investi-gate: sequence, structure and function. Since we beginwithout a pre-conceived idea of the granularity or size/depth of the groupings it is necessary to generate theautomatic groupings at every possible level. This is repre-sented by a tree which is the result of hierarchical clus-tering of the domains based on one of the three sourcesof information: sequence similarity, structural similarity,functional labels (in the forms of Gene Ontology and En-zyme Classification). The level of agreement between onetype of information and the grouping of a SCOP familycan be assessed by asking whether each edge in the treedivides domains into family groups, or splits a family,grouping together domains from different families.The ROC curve Figure 1 shows the number of
disagreements/agreements of the trees produced from
sequence, structure and functional data with the SCOPfamily classification for varying confidence values. For se-quence, confidence is ranked by bootstrap percentages,for structural data the confidence is based on the struc-tural distance scores, and for function, confidence isbased on the total number of terms which suggest a par-ticular clade in the trees. See materials and methods fordetails of a web resource providing all data and trees.
SequenceWithin the literature there is variation in suggested lev-els for the minimum informative bootstrap confidence[11,12], with most suggesting about 70-80% required forconfidence. We found that from 2046 families across428 superfamilies, 99.6% of the phylogenetic trees agreewith the SCOP groupings for bootstrap values above80%. We also found that, although less reliable, there isuseful information which can be acquired from the treesfor bootstrap values down to 60%. These results showthat, to the extent to which sequence information can re-liably determine evolutionary relationships, SCOP familygroupings are evolutionarily consistent. Classical sequencephylogenetics are quite reliable for high bootstrap values,but are limited in the evolutionary distance over whichthey can resolve relationships. There are plenty of SCOPfamily groupings which sequence-based phylogeneticsalone is unable to determine with high confidence - thelow confidence parts of the tree. Although the classicalphylogenetic analysis cannot inform us directly about theevolutionary consistency of many family groupings, thefact that there is such strong agreement with those that itcan, gives a strong suggestion that the others (classifiedindependently from this information) are also likely to beevolutionarily consistent.The top 13 edges which conflicted with the sequence
trees were examined. These are shown in a table inFigure 2, along with an example of each type of disagree-ment. The most frequent disagreement was from familieswhich were classified not long after the creation of SCOP.These families were classified at a time when PFAM [13]sequence data was not available, and therefore did notprovide evidence in the curation of SCOP families. Se-quence information from PFAM is now a contributingfactor of data used to guide the classification. An ex-ample is shown in Example 1. We also find examplessuch as that shown in Example 2, where a family hasbeen decided in SCOP based on function. Trees based onboth sequence and structure place the single domainPancreatic carboxypeptidases family between domainsfor a different family causing a disagreement of the treeswith SCOP families. In this case the classification of a do-main into a new family of its own was likely based on afunctional signal, however the tree based on functionplaces the domain in a similar way to that of structure

Figure 1 The number of superfamily agreements/disagreements with SCOP for varying confidence values. A ROC curve showing thenumber of superfamilies containing agreements against the number containing disagreements of trees with SCOP's groupings, for confidencevalues decreasing from left to right. For sequence trees, confidence is based on the bootstrap value assigned to an edge. Structures are rankedusing the total structural distance, and function is ranked by the total number of GO terms or EC numbers which support an edge.
Pethica et al. BMC Structural Biology 2012, 12:27 Page 3 of 10http://www.biomedcentral.com/1472-6807/12/27
and sequence suggesting the domain should probably be-long to the surrounding family. Our method classes'nested families' as inconsistent with evolution (shown inExample 3), whereby one family grows from another inthe tree. In some sense this is more a reflection of thelimited number of levels in the hierarchy, suggesting thatthere are some families that actually represent a 'sub'family of another. We also find a small number of otherartefacts, where is a family classification based on thesource species. This is can happen with proteins found inviruses. We also see cases such as duplications of do-mains grouped within the same family, an illustration ofthis is shown in Example 4.A potential factor which contributes to the disagree-
ments seen in trees calculated from sequence data com-pared to those from the other data sources is also worthnoting. Diverse superfamilies with very low sequenceidentity between member domains may provide an unre-liable multiple sequence alignment thereby creating a re-sult tree with limited accuracy. Anomalies introducedfrom this effect are more likely to be seen in very largesuperfamilies with a great deal of structural variation.
StructureThe trees built from automatically generated structuraldistances largely agree, but are not always consistent withSCOP’s hand annotated groupings. The hand classification
of structures in SCOP at the superfamily and fold levelsis often referred to as the gold standard in the field, andclearly surpasses any fully automatic method. Since de-tectable structural similarity remains long after se-quences have diverged beyond the point of recognition,the structurally-derived trees are able to resolve deeperedges of the tree with higher confidence than the sequence-based ones (the intersection of the red and blue lines inFigure 1). That the trees are largely in agreement withthe family classification indicates that SCOP is also evo-lutionarily consistent at greater divergence distances. Thedifferences we see could either be cases where SCOP hasgrouped domains based on some criterion other thanevolution (e.g. common function), or may be due to geo-metric structural distance being in some cases a poormeasure of divergence. For some proteins, changes tothe structure of a binding site may be the best indicationof evolutionary divergence, but these changes make arelatively small contribution to the automatic superpos-ition of the whole body. Conversely, movements of sec-ondary structures relative to each other, e.g. a change ofangle between beta-sheets [15], can cause dramatic changesin superposable structural distance which mask the truerelationships. In this way structural geometric distancedoes not always equate to evolutionary distance.Examining high ranking disagreements between the
SCOP family classification and structural trees can mostly
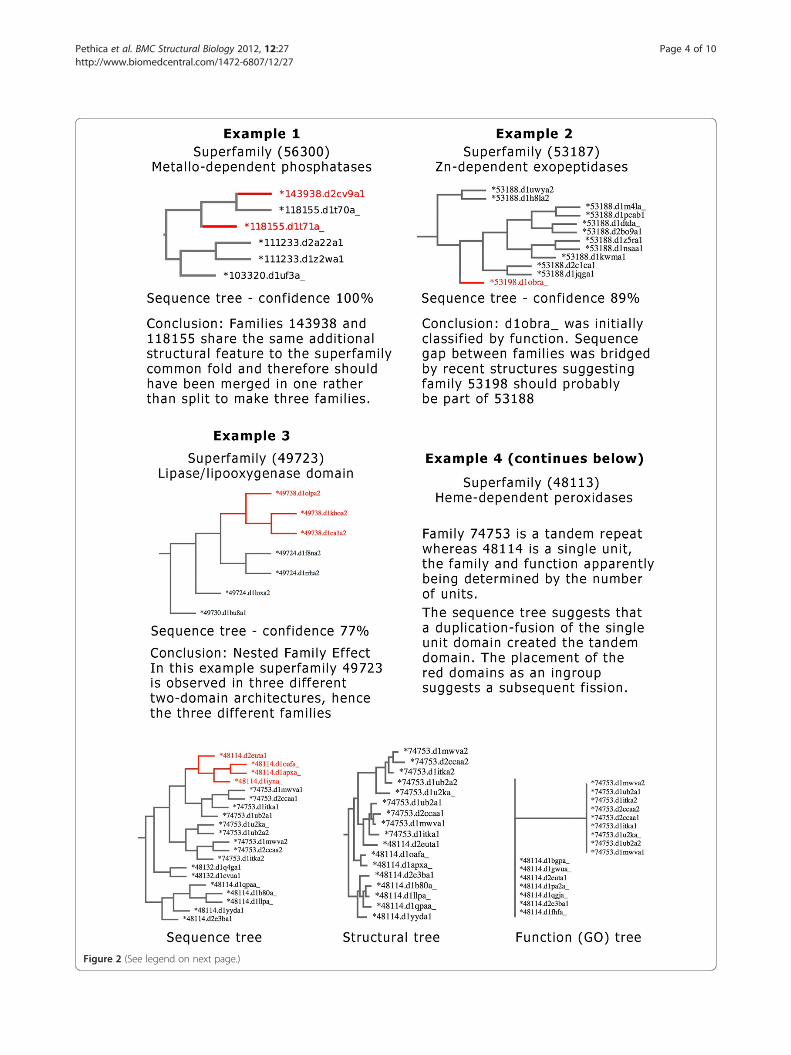
Figure 2 (See legend on next page.)
Pethica et al. BMC Structural Biology 2012, 12:27 Page 4 of 10http://www.biomedcentral.com/1472-6807/12/27
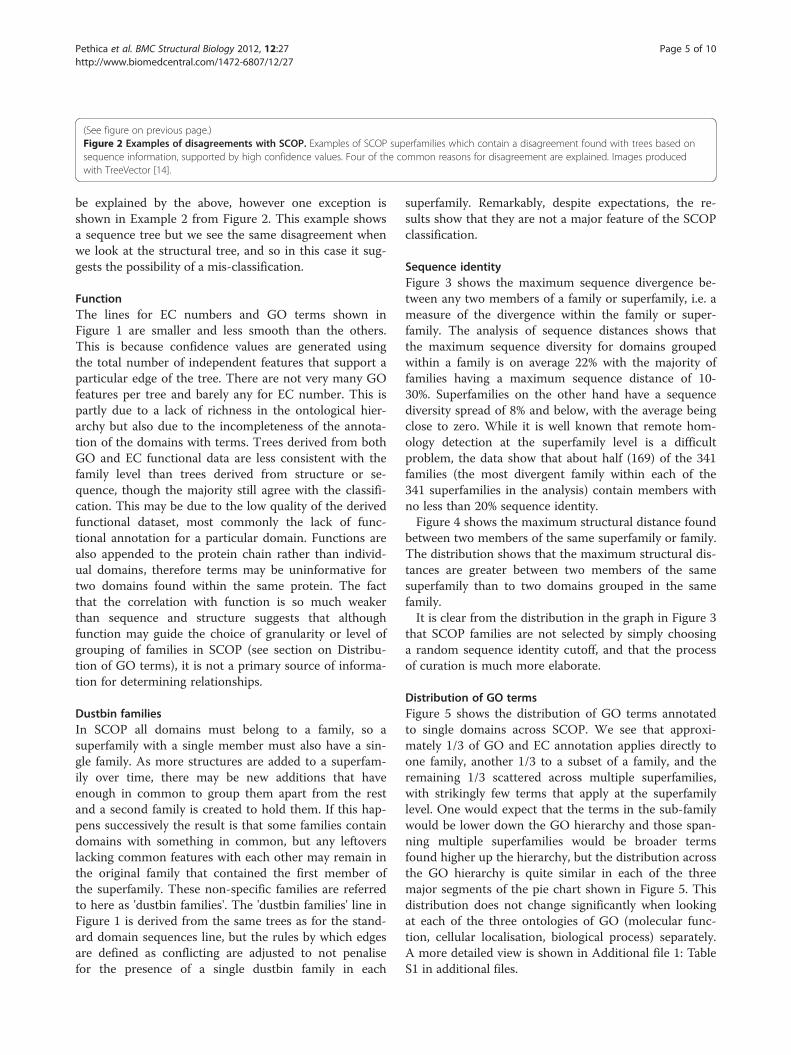
(See figure on previous page.)Figure 2 Examples of disagreements with SCOP. Examples of SCOP superfamilies which contain a disagreement found with trees based onsequence information, supported by high confidence values. Four of the common reasons for disagreement are explained. Images producedwith TreeVector [14].
Pethica et al. BMC Structural Biology 2012, 12:27 Page 5 of 10http://www.biomedcentral.com/1472-6807/12/27
be explained by the above, however one exception isshown in Example 2 from Figure 2. This example showsa sequence tree but we see the same disagreement whenwe look at the structural tree, and so in this case it sug-gests the possibility of a mis-classification.
FunctionThe lines for EC numbers and GO terms shown inFigure 1 are smaller and less smooth than the others.This is because confidence values are generated usingthe total number of independent features that support aparticular edge of the tree. There are not very many GOfeatures per tree and barely any for EC number. This ispartly due to a lack of richness in the ontological hier-archy but also due to the incompleteness of the annota-tion of the domains with terms. Trees derived from bothGO and EC functional data are less consistent with thefamily level than trees derived from structure or se-quence, though the majority still agree with the classifi-cation. This may be due to the low quality of the derivedfunctional dataset, most commonly the lack of func-tional annotation for a particular domain. Functions arealso appended to the protein chain rather than individ-ual domains, therefore terms may be uninformative fortwo domains found within the same protein. The factthat the correlation with function is so much weakerthan sequence and structure suggests that althoughfunction may guide the choice of granularity or level ofgrouping of families in SCOP (see section on Distribu-tion of GO terms), it is not a primary source of informa-tion for determining relationships.
Dustbin familiesIn SCOP all domains must belong to a family, so asuperfamily with a single member must also have a sin-gle family. As more structures are added to a superfam-ily over time, there may be new additions that haveenough in common to group them apart from the restand a second family is created to hold them. If this hap-pens successively the result is that some families containdomains with something in common, but any leftoverslacking common features with each other may remain inthe original family that contained the first member ofthe superfamily. These non-specific families are referredto here as 'dustbin families'. The 'dustbin families' line inFigure 1 is derived from the same trees as for the stand-ard domain sequences line, but the rules by which edgesare defined as conflicting are adjusted to not penalisefor the presence of a single dustbin family in each
superfamily. Remarkably, despite expectations, the re-sults show that they are not a major feature of the SCOPclassification.
Sequence identityFigure 3 shows the maximum sequence divergence be-tween any two members of a family or superfamily, i.e. ameasure of the divergence within the family or super-family. The analysis of sequence distances shows thatthe maximum sequence diversity for domains groupedwithin a family is on average 22% with the majority offamilies having a maximum sequence distance of 10-30%. Superfamilies on the other hand have a sequencediversity spread of 8% and below, with the average beingclose to zero. While it is well known that remote hom-ology detection at the superfamily level is a difficultproblem, the data show that about half (169) of the 341families (the most divergent family within each of the341 superfamilies in the analysis) contain members withno less than 20% sequence identity.Figure 4 shows the maximum structural distance found
between two members of the same superfamily or family.The distribution shows that the maximum structural dis-tances are greater between two members of the samesuperfamily than to two domains grouped in the samefamily.It is clear from the distribution in the graph in Figure 3
that SCOP families are not selected by simply choosinga random sequence identity cutoff, and that the processof curation is much more elaborate.
Distribution of GO termsFigure 5 shows the distribution of GO terms annotatedto single domains across SCOP. We see that approxi-mately 1/3 of GO and EC annotation applies directly toone family, another 1/3 to a subset of a family, and theremaining 1/3 scattered across multiple superfamilies,with strikingly few terms that apply at the superfamilylevel. One would expect that the terms in the sub-familywould be lower down the GO hierarchy and those span-ning multiple superfamilies would be broader termsfound higher up the hierarchy, but the distribution acrossthe GO hierarchy is quite similar in each of the threemajor segments of the pie chart shown in Figure 5. Thisdistribution does not change significantly when lookingat each of the three ontologies of GO (molecular func-tion, cellular localisation, biological process) separately.A more detailed view is shown in Additional file 1: TableS1 in additional files.

Figure 3 Sequence divergence in families and superfamilies. Graph shows the maximum sequence diversity between two members of thesame superfamily (or family) in SCOP. Domains which continue to diverge beyond detectable sequence identity have their distribution collapsedto the far left side of the graph; the large number with zero percent sequence identity represent those cases in which BLAST was unable to findalignment.
Pethica et al. BMC Structural Biology 2012, 12:27 Page 6 of 10http://www.biomedcentral.com/1472-6807/12/27
Despite the weak link between SCOP family classifica-tion and the edges of trees representing functional data,we see a very large proportion of functional terms corre-sponding to exactly one family, and almost none close tothe superfamily level. This suggests that the relationshipsbetween members of a superfamily and their distanceapart is evolutionary, having been based on evidencefrom structure and sequence (not function), but thegranularity at which to divide the members of a super-family is decided by function. I.e. domains are not groupedbased on their function, but the number of groups relatesto the number of functions.
ConclusionsSequence information contributes to the classification ofdomains into families, but alone is not enough. To clas-sify a family evolutionarily: it must be consistent with se-quence phylogenetics, will likely draw on structuraldistance, and will often coincide with a particular func-tion. Sequence diversity between families (within asuperfamily) is considerably greater than within a family.Sequence phylogenetics do not give a strong enough sig-nal at the superfamily level to classify families, but wherethere is a signal it is consistent with the SCOP classifica-tion. Structural information is necessary for identifying
evolutionary relationships of families in a superfamilywhere sequence identity is low. We see that althoughfunction does not determine the relationships, i.e. edges,it is used to guide the level at which the tree is cut tomake a family, i.e. the choice of node from which to de-rive a clade (granularity).The families in SCOP represent a level at which se-
quence, structure, function plus other information on ashared peculiarity must all be taken into account. A bal-ance of the strengths of signals available is used to es-tablish the evolutionary relationships and resolve thegroupings.
MethodsThe data for all trees used to generate Figure 2 are avail-able as a web resource at http://supfam2.cs.bris.ac.uk/pethica/scopresults. The data may be ranked on each ofthe confidence scores separately or together. For everysuperfamily there are tree images for sequence, structureand function annotated with the PDB domain and SCOPfamily ID as shown in Figure 2. The tree data can add-itionally be downloaded in Newick format [16]. Alsoavailable are all the matrices of Structal [17] data used togenerate the structural distance trees.

Figure 4 Structural divergence in families and superfamilies. Graph shows the maximum structural diversity between two members of thesame superfamily (or family) in SCOP. Structural distances used are the scores produce by Structal for the alignment of two domains.
Pethica et al. BMC Structural Biology 2012, 12:27 Page 7 of 10http://www.biomedcentral.com/1472-6807/12/27
Sequence based phylogenyDomain sequences for SCOP version 1.73, filtered to95% sequence identity were obtained from ASTRAL [18].The complete set of sequences was filtered to removesuperfamilies for which SCOP's family level classificationcould not be contested. These cases included superfam-ilies containing a single family, those where each familycontained only one member, and any superfamily madeup of three or less domains. A detailed breakdown of thenumber of domains, families, and superfamilies used inthe analysis can be found in Additional file 2: Table S2.For each superfamily in the classification the sequences
of assigned domains were used to produce an align-ment using MUSCLE [19]. Alignments were convertedto Stockholm format using sreformat which is part ofthe HMMER package [20]. Quicktree [21], a fast imple-mentation of the neighbour joining algorithm was usedto produce runs of both 300 and 600 bootstrap replicatetrees from the sequence alignments. Phylip Consensewas used to create a single consensus tree from the setsof replicate trees. In this process, the number of occur-rences of a particular edge from the replicate trees wasconverted to a single confidence score giving the finaltree confidence values for each edge.A second set was also produced where domain se-
quences were padded with homologue sequences fromthe SUPERFAMILY database. These were aligned, and
trees created as with the original set. A script was usedto remove the homologues from the trees leaving onlythe original domain sequences, but preserving all phylo-genetic relationships. The dataset calculated withouthomologues, with 300 replicates was chosen as very littledifference was seen between the two replicate sets, andthe addition of homologues sequences created largeralignments which were handled badly by the phylogen-etic algorithms.
Structural phylogenyPDB style protein three dimensional structures for thesame filtered SCOP 1.73 set of domains were taken fromASTRAL. The same filtered set of SCOP 1.73 domainsas for sequence was used. Structal [17] was used to com-pare the 3D structures of every domain against everyother in a superfamily, for all superfamilies in the set ina computationally expensive process of around 1.5 mil-lion structural comparisons. The Structal software waschosen from the large number of other structural com-parison methods due to its balance of speed and accur-acy for a computation of this kind. The Structal SASscores (100*RMS/Number of positions matched) for eachdomain were used to create a matrix of structural dis-tances for each superfamily. The neighbour joining algo-rithm in the PAUP [22] package was used to computephylogenetic trees from the distance matrices.

Figure 5 Level in SCOP of all single domain proteins associated with a specific GO term. Figure shows the level in SCOP at which all singledomains associated with a particular GO term are found. I.e. if the group represents a family or superfamily. These are also broken down into thethree main ontologies of GO terms.
Pethica et al. BMC Structural Biology 2012, 12:27 Page 8 of 10http://www.biomedcentral.com/1472-6807/12/27
Functional phylogenyGene ontology (GO) data from EBI GOA [23] was usedto annotate domains with functional terms using thesame set of domains that was used for the sequence andstructure trees. For each superfamily, a binary presence/absence matrix was generated of all GO terms versus alldomains in the superfamily. The terms were treated
Figure 6 An overview of the algorithm used to determine agreementof a tree built from domain sequences in a SCOP superfamily, and illustratewith SCOP's family level grouping.
independently of the hierarchy, but uninformative terms(present in all or present in only one domain) were ig-nored. For each superfamily the presence/absence matrixwas used to generate a phylogenetic tree using PAUPneighbour joining. An additional set of functional treeswas also generated using the same technique, but withfunctional data from Enzyme Commission (EC) numbers.
s/disagreements of trees with SCOP's groupings. Figure shows parts the algorithm involved in establishing if the tree agrees or disagrees

Pethica et al. BMC Structural Biology 2012, 12:27 Page 9 of 10http://www.biomedcentral.com/1472-6807/12/27
Testing against SCOP familiesPhylogenetic trees of domains in each superfamily pro-duced by each method could then be compared with thegroupings at the SCOP family level. An algorithm wasproduced to traverse the trees and identify if a particularedge agreed, disagreed or was uninformative with regardto SCOP families:
� An edge of the tree is said to agree with SCOP ifone side contains the full set of domains for acertain family and no members of another family.
� An edge disagrees with SCOP when domains from acertain family are found on both sides along withdomains from a different family.
� A neutral or uninformative edge is where one sidecontains only members from a certain family, butnot the complete set. i.e. more are found on theother side of the edge.
An overview of the algorithm used is shown in Figure 6.
Sequence divergence of domains in superfamiliesand familiesSequences for domains in SCOP 1.73 superfamilies wereacquired from ASTRAL. Superfamilies containing a singledomain only were removed. For each superfamily group-ing, sequence identities were sequentially calculatedwith Washington University BLAST [24], the highest se-quence identity members being removed until only thetwo most distant sequences remained. This process wasrepeated for domains grouped in families to give se-quence distance scores for all relevant families and su-perfamilies in SCOP.
Functional divergence across SCOPFor each GO term in the EBI GOA dataset a list of sin-gle domain proteins with the particular annotation wasgenerated. The sequence identity of the two most distantsequences in the set was determined. The distribution ofdomains across the SCOP classification and level in thehierarchy for a specific functional annotation was alsocalculated. e.g. All domains contained within a specificfamily or superfamily.
Additional files
Additional file 1: Table S1. An Extended View of the Levels at whichAll Single Domain Proteins Associated With a Specific GO Term areFound in SCOP. Table shows an extended version of the level in SCOP atwhich all single domains associated with a particular GO term are found.The different levels shown are designed to illustrate the level at whichGO terms fall, independently to the SCOP hierarchy. The distribution ofGO terms assigned to domains is broken down into the followingcategories: • Sub Family: GO terms are found in some, but not allmembers of a family. • Family Equivalent: Exactly fits a family, i.e. found in
all members of a family, but not in other families. • Multi Family: Found inall members of more than one family, but not in all families in thesuperfamily. • Partial Family: Completes one or more families, is absentfrom one or more families and is incomplete from exactly one family of aspecific superfamily. • Scattered Families: May or may not complete onefamily, more than one incomplete family, and at least one empty familyper superfamily. • Scattered in Superfamily: Present in, but does notcomplete, all families in a superfamily. • Almost Superfamily: Present in allfamilies, competes some of them. • Superfamily Equivalent: Present forevery domain of just one superfamily. • Multi Superfamilies: Present inevery domain in more than one superfamily. • Partial Superfamilies:Completes at least one superfamily; partially completes exactly one othersuperfamily. • Scattered Superfamilies: May or may not complete onesuperfamily; present but not completing at least one other superfamily.
Additional file 2: Table S2. Statistics for the number of domains usedin the phylogenetic analysis. Statistics for domains in raw SCOP 1.73 andafter filtering to 95% sequence identity and removal of trivially solvablecases.
Competing interestsThe author(s) declare that they have no competing interests.
Authors' contributionsBoth JG and RP designed the study, ML advised at a later stage of the study.RP carried out most of the work, ML carried out modifications to STRUCTAL.RP and JG were involved in the preparation of the manuscript. All authorsread and approved the final manuscript. ML is supported by NIH GM063817and is the RW and VKC Professor of Cancer Research. JG is supportedby BBSRC grant (BB/G022771/1).
AcknowledgementsWe express our gratitude to Cyrus Chothia for his help and input on thiswork, to Martin Madera for technical assistance and to Alexey Murzin for hisresponses to questions about the SCOP classification.
Author details1Department of Computer Science, University of Bristol, The MerchantVenturers Building, Room 3.16, Woodland Road, Bristol, UK. 2Department ofStructural Biology, Stanford University School of Medicine, Stanford 94305CA, USA.
Received: 1 April 2012 Accepted: 3 October 2012Published: 18 October 2012
References1. Murzin AG, Brenner SE, Hubbard T, Chothia C: SCOP: A structural
classification of proteins database for the investigation of sequencesand structures. J Mol Biol 1995, 247:536–540.
2. Andreeva A, Howorth D, Brenner SE, Hubbard TJ, Chothia C, Murzin AG:SCOP database in 2004: refinements integrate structure and sequencefamily data. Nucleic Acids Res 2004, 32:226–229.
3. Andreeva A, Howorth D, Chandonia JM, Brenner SE, Hubbard TJP, ChothiaC, Murzin AG: Data growth and its impact on the SCOP database: newdevelopments. Nucleic Acid Res 2008, 36:419–425.
4. Berman HM, Westbrook J, Feng Z, Gilliland G, Bhat TN, et al: The ProteinData Bank. Nucleic Acids Res 2000, 28:235–242.
5. Gough J, Chothia C: SUPERFAMILY: HMMs representing all proteins ofknown structure. SCOP sequence searches, alignments and genomeassignments. Nucleic Acids Res 2002, 30:268–272.
6. Chothia C, Gough J, Vogel C, Teichmann SA: Evolution of the proteinrepertoire. Science 2003, 300:1701–1703.
7. Holm L, Sander C: Mapping the protein universe. Science 1996,273:595–602.
8. Overington JP, Al-Lazikani B, Hopkins AL: How many drug targets arethere? Nature 1996, 5:993–996.
9. Ashburner M, Ball CA, Blake JA, Botstein D, Butler H: Gene ontology: toolfor the unification of biology. Nat Genet 2000, 25:25–29.
10. Hill DP, Davis AP, Richardson JE, Corradi JP, Ringwald M, et al: Programdescription: strategies for biological annotation of mammalian systems:

Pethica et al. BMC Structural Biology 2012, 12:27 Page 10 of 10http://www.biomedcentral.com/1472-6807/12/27
implementing gene ontologies in mouse genome informatics. Genomics2001, 74:121–128.
11. Rokas A, Williams BL, King N, Carroll SB: Genome-scale approaches toresolving incongruence in molecular phylogenies. Nature 2003,425:798–804.
12. Hillis DM, Bull JJ: An empirical test of bootstrapping as a method forassessing confidence in phylogenetic analysis. Syst Biol 1993, 42:182–192.
13. Finn RD, Mistry J, Tate J, Coggill P, Heger A, et al: The Pfam proteinfamilies database. Nucleic Acids Res 2010, 38:D211–D222.
14. Pethica R, Barker G, Kovacs T, Gough J: TreeVector: scalable, interactive,phylogenetic trees for the web. PLoS One 2010, 5(1):e8934.
15. Gough J, Chothia C: The linked conservation of structure and function ina family of high diversity: the monomeric cupredoxins. Structure 2004,12:917–925.
16. Olsen G: "Newick's 8:45" Tree Format Standard. 1990. Available from:http:// evolution.genetics.washington.edu/phylip/newick_doc.html.
17. Levitt M, Gerstein M: A unified statistical framework for sequencecomparison and structure comparison. Proc Natl Acad Sci 1998,95:5913–5920.
18. Brenner SE, Koehl P, Levitt M: The ASTRAL compendium for sequence andstructure analysis. Nucleic Acids Res 2000, 28:254–256.
19. Edgar RC: MUSCLE: multiple sequence alignment with high accuracy andhigh throughput. Nucleic Acids Res 2004, 32:1792–1797.
20. Eddy SR: A new generation of homology search tools based onprobabilistic inference. Genome Inform 2009, 23:205–211.
21. Howe K, Bateman A, Durbin R: QuickTree: building huge neighbour-joining trees of protein sequences. Bioinformatics 2002, 18:1546–1547.
22. Swofford DL: PAUP*. Phylogenetic Analysis Using Parsimony (*and OtherMethods). Version 4.0b10. Sunderland, Massachusetts: Sinauer Associates;2003.
23. Barrell D, Dimmer E, Huntley RP, Binns D, O’Donovan C, Apweiler R:The GOA database in 2009–an integrated gene ontology annotationresource. Nucleic Acids Res 2009, 37:396–403.
24. Altschul SF, Gish W, Miller W, Myers EW, Lipman DJ: Basic local alignmentsearch tool. J Mol Biol 1990, 2155:403–410.
doi:10.1186/1472-6807-12-27Cite this article as: Pethica et al.: Evolutionarily consistent families inSCOP: sequence, structure and function. BMC Structural Biology 201212:27.
Submit your next manuscript to BioMed Centraland take full advantage of:
• Convenient online submission
• Thorough peer review
• No space constraints or color figure charges
• Immediate publication on acceptance
• Inclusion in PubMed, CAS, Scopus and Google Scholar
• Research which is freely available for redistribution
Submit your manuscript at www.biomedcentral.com/submit