
RESEARCH ARTICLE Open Access Clustered ChIP-Seq-defined ...
18
RESEARCH ARTICLE Open Access Clustered ChIP-Seq-defined transcription factor binding sites and histone modifications map distinct classes of regulatory elements Morten Rye 1* , Pål Sætrom 1,2 , Tony Håndstad 1 and Finn Drabløs 1 Abstract Background: Transcription factor binding to DNA requires both an appropriate binding element and suitably open chromatin, which together help to define regulatory elements within the genome. Current methods of identifying regulatory elements, such as promoters or enhancers, typically rely on sequence conservation, existing gene annotations or specific marks, such as histone modifications and p300 binding methods, each of which has its own biases. Results: Herein we show that an approach based on clustering of transcription factor peaks from high-throughput sequencing coupled with chromatin immunoprecipitation (Chip-Seq) can be used to evaluate markers for regulatory elements. We used 67 data sets for 54 unique transcription factors distributed over two cell lines to create regulatory element clusters. By integrating the clusters from our approach with histone modifications and data for open chromatin, we identified general methylation of lysine 4 on histone H3 (H3K4me) as the most specific marker for transcription factor clusters. Clusters mapping to annotated genes showed distinct patterns in cluster composition related to gene expression and histone modifications. Clusters mapping to intergenic regions fall into two groups either directly involved in transcription, including miRNAs and long noncoding RNAs, or facilitating transcription by long-range interactions. The latter clusters were specifically enriched with H3K4me1, but less with acetylation of lysine 27 on histone 3 or p300 binding. Conclusion: By integrating genomewide data of transcription factor binding and chromatin structure and using our data-driven approach, we pinpointed the chromatin marks that best explain transcription factor association with different regulatory elements. Our results also indicate that a modest selection of transcription factors may be sufficient to map most regulatory elements in the human genome. Keywords: transcription factor, ChIP-Seq, histone modification, chromatin Background Transcription factors are DNA-binding proteins that regulate gene expression by binding to promoter regions proximal to gene transcription start sites (TSSs) or to more distal enhancer regions that regulate expression through long-range interactions [1-3]. Transcription fac- tor binding varies between cell types, and one major fac- tor contributing to this cell type-specific binding is chromatin structure. Chromatin consists of DNA wrapped around nucleosomes, and chains of nucleo- somes linked by DNA are organised structurally into different domains of accessible (open) and inaccessible (closed) chromatin [4-7]. Chromatin accessibility is regulated by DNA methylation and posttranslational modifications in the N-terminal tails of the nucleosomal histone proteins. Although there are no known combi- nations of modifications that delineate accessible and closed chromatins, histone acetylation and mono-, di- and trimethylation of lysine 4 on histone H3 (H3K4me1, H3K4me2 and H3K4me3, respectively) are generally associated with accessible chromatin, whereas H3K9me3 and H3K27me3 are associated with closed chromatin. * Correspondence: [email protected] 1 Department of Cancer Research and Molecular Medicine Laboratory Center, Faculty of Medicine, Norwegian University of Science and Technology, Erling Skjalgssons Gate 1, NO-7491 Trondheim, Norway Full list of author information is available at the end of the article Rye et al. BMC Biology 2011, 9:80 http://www.biomedcentral.com/1741-7007/9/80 © 2011 Rye et al; licensee BioMed Central Ltd. This is an Open Access article distributed under the terms of the Creative Commons Attribution License (http://creativecommons.org/licenses/by/2.0), which permits unrestricted use, distribution, and reproduction in any medium, provided the original work is properly cited.
Transcript of RESEARCH ARTICLE Open Access Clustered ChIP-Seq-defined ...

RESEARCH ARTICLE Open Access
Clustered ChIP-Seq-defined transcription factorbinding sites and histone modifications mapdistinct classes of regulatory elementsMorten Rye1*, Pål Sætrom1,2, Tony Håndstad1 and Finn Drabløs1
Abstract
Background: Transcription factor binding to DNA requires both an appropriate binding element and suitably openchromatin, which together help to define regulatory elements within the genome. Current methods of identifyingregulatory elements, such as promoters or enhancers, typically rely on sequence conservation, existing geneannotations or specific marks, such as histone modifications and p300 binding methods, each of which has its ownbiases.
Results: Herein we show that an approach based on clustering of transcription factor peaks from high-throughputsequencing coupled with chromatin immunoprecipitation (Chip-Seq) can be used to evaluate markers forregulatory elements. We used 67 data sets for 54 unique transcription factors distributed over two cell lines tocreate regulatory element clusters. By integrating the clusters from our approach with histone modifications anddata for open chromatin, we identified general methylation of lysine 4 on histone H3 (H3K4me) as the mostspecific marker for transcription factor clusters. Clusters mapping to annotated genes showed distinct patterns incluster composition related to gene expression and histone modifications. Clusters mapping to intergenic regionsfall into two groups either directly involved in transcription, including miRNAs and long noncoding RNAs, orfacilitating transcription by long-range interactions. The latter clusters were specifically enriched with H3K4me1, butless with acetylation of lysine 27 on histone 3 or p300 binding.
Conclusion: By integrating genomewide data of transcription factor binding and chromatin structure and usingour data-driven approach, we pinpointed the chromatin marks that best explain transcription factor associationwith different regulatory elements. Our results also indicate that a modest selection of transcription factors may besufficient to map most regulatory elements in the human genome.
Keywords: transcription factor, ChIP-Seq, histone modification, chromatin
BackgroundTranscription factors are DNA-binding proteins thatregulate gene expression by binding to promoter regionsproximal to gene transcription start sites (TSSs) or tomore distal enhancer regions that regulate expressionthrough long-range interactions [1-3]. Transcription fac-tor binding varies between cell types, and one major fac-tor contributing to this cell type-specific binding ischromatin structure. Chromatin consists of DNA
wrapped around nucleosomes, and chains of nucleo-somes linked by DNA are organised structurally intodifferent domains of accessible (open) and inaccessible(closed) chromatin [4-7]. Chromatin accessibility isregulated by DNA methylation and posttranslationalmodifications in the N-terminal tails of the nucleosomalhistone proteins. Although there are no known combi-nations of modifications that delineate accessible andclosed chromatins, histone acetylation and mono-, di-and trimethylation of lysine 4 on histone H3 (H3K4me1,H3K4me2 and H3K4me3, respectively) are generallyassociated with accessible chromatin, whereas H3K9me3and H3K27me3 are associated with closed chromatin.
* Correspondence: [email protected] of Cancer Research and Molecular Medicine Laboratory Center,Faculty of Medicine, Norwegian University of Science and Technology, ErlingSkjalgssons Gate 1, NO-7491 Trondheim, NorwayFull list of author information is available at the end of the article
Rye et al. BMC Biology 2011, 9:80http://www.biomedcentral.com/1741-7007/9/80
© 2011 Rye et al; licensee BioMed Central Ltd. This is an Open Access article distributed under the terms of the Creative CommonsAttribution License (http://creativecommons.org/licenses/by/2.0), which permits unrestricted use, distribution, and reproduction inany medium, provided the original work is properly cited.

Several other modifications coexist with these marksover different domains [4], but these modifications aregenerally less characterised.Although the interplay between chromatin environ-
ments and transcription factor binding is not straight-forward, accessible chromatin generally facilitatesassociation of transcription factors to DNA. Some tran-scription factors, however, can modify the chromatinlandscape around their binding site, which may recruitnew transcription factors and chromatin-modifying fac-tors to the region [1,4]. Changes brought on by suchevents are the foundation for cell differentiation,whereby chromatin domains and transcription factorbinding can be used as markers for cell type-specificregulation. Recent advances in high-throughput sequen-cing coupled with chromatin immunoprecipitation(ChIP-Seq) [8,9] have enabled genomewide mapping ofsuch domains. Though several studies have used ChIP-Seq to analyse large sets of transcription factors in dif-ferent organisms [10,11] or the interplay between sets ofhistone modifications [7,12-20], few studies have investi-gated the relationship between large sets of transcriptionfactors and histone modifications [18,21,22]. One reasonfor this is that such a data set would require consider-able resources to produce. However, the joint efforts ofresearchers in the laboratories participating in theENCODE project [23] are now making such studies pos-sible in a few selected cell lines.The goal of this study was twofold. First, we wanted to
investigate whether genomic regions enriched withbound transcription factors can be used to improve theidentification of regulatory elements in the human gen-ome. Specifically, we investigated whether such enrichedregions concurred with existing genome annotationsand data for histone modifications. Furthermore, weused the enriched regions to identify chromatin markersthat best correlated with the binding of transcriptionfactors and to evaluate previously used markers for reg-ulatory regions. Second, we wanted to investigatewhether the combination of transcription factors asso-ciated with the enriched regions differed depending onthe type of regulatory element to which the enrichedregion mapped. Specifically, we wondered whether thetranscription factor composition differed betweenenhancers and TSS proximal promoter elements.Our analysis was based on ChIP-Seq reads for tran-
scription factors from two cell lines: K562 andGm12878. Totals of 39 and 28 factors, respectively, weremapped in each cell line, and 13 factors were mapped inboth cell lines. We used clusters of colocalised tran-scription factor-binding events as identifiers for regula-tory elements involving transcription factors and verifiedthat these clusters generally overlapped with regions ofactive chromatin. We then used two different strategies
to identify four groups of transcription factor clusterswith potentially different regulatory roles. First, weexamined clusters mapping to previously annotatedgenes and promoters and separated these into (1) clus-ters mapping to annotated promoter regions (promoterclusters) and (2) clusters mapping to annotated genesbut outside the promoter region (gene clusters). Second,we performed an alternative cluster separation indepen-dent of annotations, where clusters mapping to histonemodifications closely associated with active transcription(H3K4me3, H3K36me3 and RNA polymerase II (Pol II)binding: transcript clusters) were separated from clusterswith potentially distal regulatory function with respectto transcription (enhancer clusters). This definitionrepresents an additional separation of the regulatory ele-ments normally referred to as ‘enhancers’ [24] into ele-ments that produce transcripts and those that do not.The clusters associated with transcripts also correlatedwith actual transcription levels from high throughputRNA sequencing (RNA-Seq) data. When comparingclusters in these groups, we observed that the clustersdiffered in their composition of transcription factors andassociation with specific histone modifications. Espe-cially, we found that the identified enhancer clusterscorrelated well with the histone modification H3K4me1,a marker previously used for enhancers, but less wellwith acetylation of lysine 27 on histone 3 (H3K27ac) orbinding of the histone acetyltransferase p300, two othercommonly used markers for enhancers. We also investi-gated whether our selection of transcription factors gavegood coverage of all cell type-specific regulatory ele-ments in the human genome and found that a relativelymodest selection of factors was sufficient to cover 90%of the annotated promoters for transcribed genes.
ResultsChIP-Seq peaks for different transcription factors clusteralong the genomeBinding sites for transcription factors tend to cluster inregulatory modules [25-27], and recent studies in Dro-sophila [18] and mouse [10,22] have also shown thatpeaks from a set of transcription factors identified byChIP-Seq and related methodologies tend to clusteralong the genome. To investigate whether human tran-scription factor ChIP-Seq peaks also display clusteringproperties, we identified overlaps between ChIP-Seqpeaks for 39 factors in K562 and for 28 factors inGm12878 (see Methods). These overlaps were com-pared with overlaps obtained by randomly shufflingpeak positions within each chromosome. For the 39factors in K562, a total of 151,624 individual ChIP-Seqpeaks were identified. When identifying overlaps, thesepeaks condensed into 71,311 nonoverlapping regions,where 30,934 regions contained more than one peak.
Rye et al. BMC Biology 2011, 9:80http://www.biomedcentral.com/1741-7007/9/80
Page 2 of 18

The same procedure for the randomly shuffled peaksproduced 132,615 regions, where only 15,373 con-tained more than one peak. We defined each regioncontaining more than one peak as a transcription fac-tor cluster, and this definition was used throughoutthe rest of this study. The relative number of real tran-scription factor clusters compared to random clustersstrongly increased with the number of transcriptionfactors mapping to the cluster (Figures 1A and 1B).We also observed an increase in the average length ofthe random clusters compared to transcription factorclusters as more peaks associated with the cluster (Fig-ure 1C). The latter indicates that peaks within eachcluster locate to more similar genomic positions thanwould be expected by chance. The results were similarfor the 28 factors analysed in Gm12878 (Figures 1D
and 1F), where 126,238 peaks produced 61,209 nono-verlapping regions, and 23,491 regions contained morethan one peak. The corresponding numbers for therandom shuffle were 114,157 and 10,148. On the basisof these results, we conclude that human ChIP-Seqpeaks from different transcription factors have a strongtendency to form clusters along the genome. We alsocalculated the overlap between transcription factorclusters in both cell types and found 8,320 overlappingclusters (one-third to one-fourth of all clusters). Acomprehensive comparison between cell types will bethe topic of a future study (T Håndstad, M B Rye, FDrabløs and P Sætrom, unpublished data). Herein wefocus on the cluster patterns within each cell type indi-vidually but compare general trends between the celllines.
Figure 1 High-throughput sequencing coupled with chromatin immunoprecipitation (ChIP-Seq) peaks from multiple transcriptionfactors form clusters within the genome. Number of ChIP-Seq peak clusters compared to the number of clusters produced after a randomshuffle of peak positions for K562 (A) and (B) and Gm12878 (D) and (E). The maximum numbers of peaks found in the peak clusters were 17 forK562 and 18 for Gm12878 compared to 7 and 6, respectively, for the random shuffle. (C) and (F) show average cluster lengths in kilobase pairswith increasing numbers of peaks in the clusters. A smaller increase in peak lengths is observed for the peak clusters, indicating a higher degreeof clustering. TF, transcription factor.
Rye et al. BMC Biology 2011, 9:80http://www.biomedcentral.com/1741-7007/9/80
Page 3 of 18

Histone H3 lysine 4 methylation is the chromatin markbest associated with transcription factor bindingPresumably, transcription factors require open chroma-tin for DNA binding, but it is unclear whether openchromatin by itself is a good predictor of transcriptionfactor binding. To address this question, we investigatedthe overlap between transcription factor clusters andexperimentally defined open chromatin regions (OCRs)(see Methods) or regions containing different histonemarks associated with open or closed chromatin. Ourfirst observation was the abundance of OCRs comparedto regions showing mono-, di- or trimethylation ofH3K4, histone modificationstypically associated withaccessible chromatin [6,7]. Although the number ofregions enriched with H3K4me comprised less than halfthe number of experimentally defined OCRs (Figure2A), 54 of 67 transcription factor data sets had overlapwith H3K4me similar to or better than that with OCRs(Additional file 1, Figure S1). Exceptions were the pairCTCF/Rad21, which mapped better to OCRs than toH3K4me, and a few other factors, such as NRSF andSETDB1, which mapped to neither H3K4me nor OCRs.When CTCF/Rad21 was excluded, 90% and 92% of theclusters, respectively, mapped to H3K4me compared to92% and 93% that mapped to OCRs for K562 andGm12878, respectively (Figures 2B and 2C), despite themuch smaller number of H3K4me regions. Only a fewclusters (4% in K562 and 3% in Gm12878) mapped toregions without H3K4me, OCRs or H3K27ac and/orH3K9ac. We therefore conclude that H3K4me andOCRs mark somewhat different types of accessible chro-matin most visible in the overlap with CTCF/Rad21
elements, but that H3K4me is a more specific signaturethan OCRs for the binding of most other transcriptionfactors.Different transcription factors showed a preference for
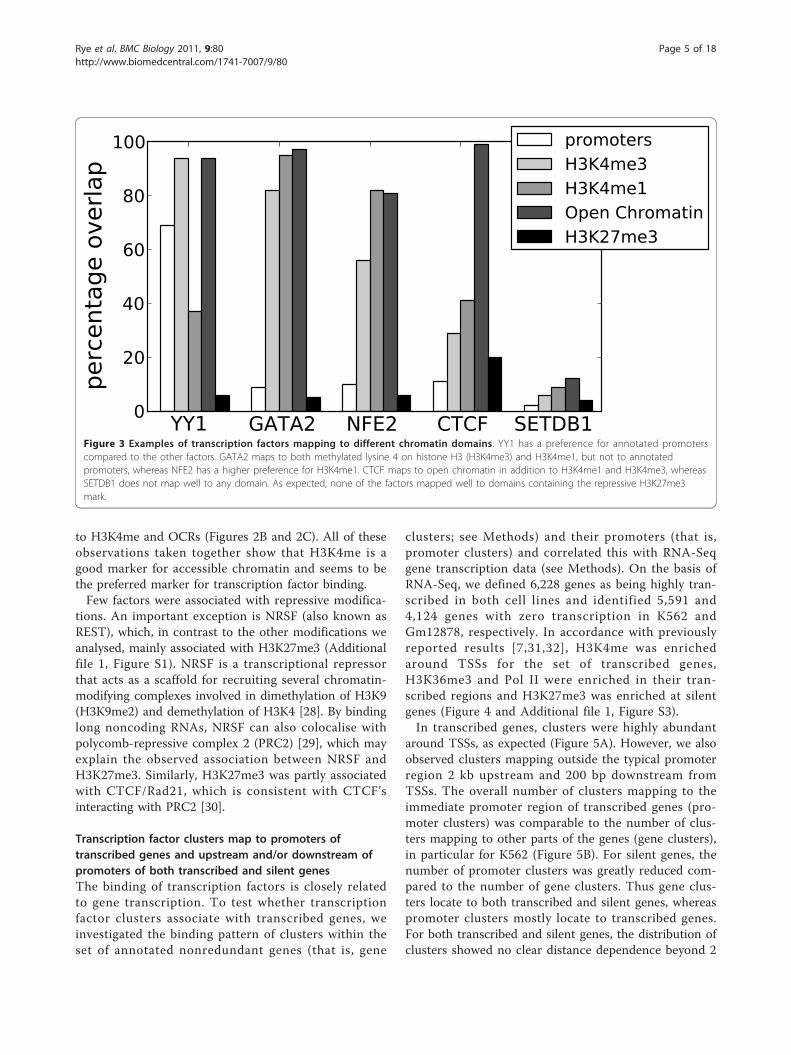
different general chromatin signatures (Figure 3 andAdditional file 1, Figure S1). Factors enriched at anno-tated promoters (for example, YY1) generally mapped toH3K4me3, whereas other factors (for example, GATA2and NFE2) preferentially mapped to H3K4me1, whichmay indicate their association with enhancers. Exceptfor a few factors not mapping specifically to any chro-matin mark, all factors analysed in this study preferen-tially mapped to known marks for accessible chromatin.This shows that regions enriched with transcription fac-tors can generally be used as an alternative to histonemodifications and other markers (such as DNase hyper-sensitivity) to identify genomic regions involved in generegulation. We also found that data for histone modifi-cations associated with accessible chromatin were highlyredundant. Regions marked by acetylation (H3K9ac andH3K27ac) were almost totally contained within H3K4me(97% and 98% of combined H3K27ac and H3K9ac over-lapped with H3K4me in K562 and Gm12878, respec-tively), and regions marked by H3K4 mono-, di- and tri-methylation were also highly overlapping (Additional file1, Figure S2). In addition, H3K27ac and H3K9ac regionswhere highly overlapping in K562 (83% and 89% over-lap, respectively), whereas in Gm12878, H3K9ac regions(92% overlap) covered a subset of H3K27ac regions(69% overlap). Though H3K27ac and H3K9ac correlatedwell with other marks for accessible chromatin, theseregions showed a weaker overlap with clusters compared
K562 Gm128780
20
40
60
80
100
perc
. of
tota
l
AOCR and H3K4me
Open Chromatin (OCR)
shared OCR/H3K4me
H3K4me
K562 Gm128780
20
40
60
80
100
perc
. overl
ap
BAll clusters
H3K27ac+H3K9ac
K562 Gm128780
20
40
60
80
100
perc
. overl
ap
Cclusters wo CTCF/Rad21
Figure 2 Methylation of lysine 4 on histone H3 (H3K4me) is a more specific marker of transcription factor clusters than is openchromatin (OCR). (A) Relative numbers of unique and shared regions for OCR and H3K4me. To compensate for the smaller region lengths inOCR compared to H3K4me, all unique OCR regions within 600 bp of each other were merged. Still, there are about threefold more unique OCRregions (black) than unique H3K4me regions (white). Thus H3K4me is a more precise marker than OCR when comparable fractions oftranscription factor (TF) clusters overlap with these regions. (B) Percentage of TF clusters that overlap with H3K4me, OCR and combinedacetylated lysine 27 on histone 3 (H3K27ac) and H3K9ac. (C) Same as graph (B), but with CTCF and Rad21 removed from the clusters. CTCF/Rad21 was the most frequent TF pair encountered in K562. We did not have high-throughput sequencing coupled with chromatinimmunoprecipitation data for Rad21 in Gm12878, resulting in more singleton peaks for CTCF in Gm12878, which is the reason for the improvedoverlap observed in (B) for Gm12878.
Rye et al. BMC Biology 2011, 9:80http://www.biomedcentral.com/1741-7007/9/80
Page 4 of 18
to H3K4me and OCRs (Figures 2B and 2C). All of theseobservations taken together show that H3K4me is agood marker for accessible chromatin and seems to bethe preferred marker for transcription factor binding.Few factors were associated with repressive modifica-
tions. An important exception is NRSF (also known asREST), which, in contrast to the other modifications weanalysed, mainly associated with H3K27me3 (Additionalfile 1, Figure S1). NRSF is a transcriptional repressorthat acts as a scaffold for recruiting several chromatin-modifying complexes involved in dimethylation of H3K9(H3K9me2) and demethylation of H3K4 [28]. By bindinglong noncoding RNAs, NRSF can also colocalise withpolycomb-repressive complex 2 (PRC2) [29], which mayexplain the observed association between NRSF andH3K27me3. Similarly, H3K27me3 was partly associatedwith CTCF/Rad21, which is consistent with CTCF’sinteracting with PRC2 [30].
Transcription factor clusters map to promoters oftranscribed genes and upstream and/or downstream ofpromoters of both transcribed and silent genesThe binding of transcription factors is closely relatedto gene transcription. To test whether transcriptionfactor clusters associate with transcribed genes, weinvestigated the binding pattern of clusters within theset of annotated nonredundant genes (that is, gene
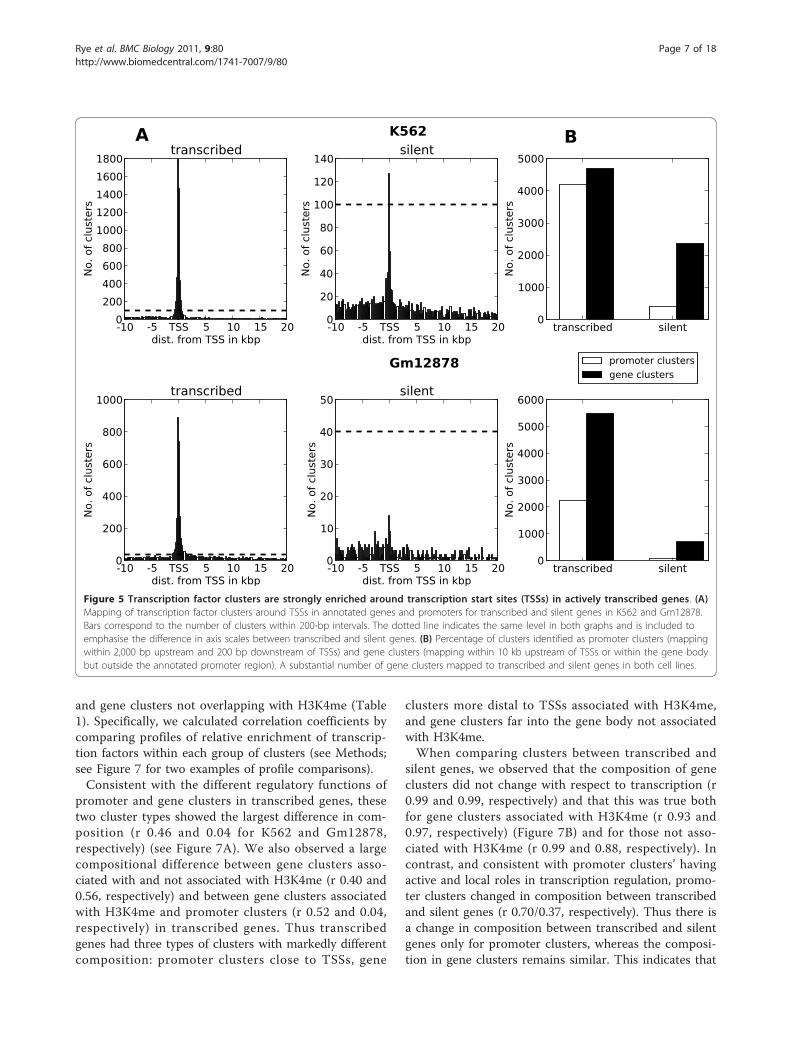
clusters; see Methods) and their promoters (that is,promoter clusters) and correlated this with RNA-Seqgene transcription data (see Methods). On the basis ofRNA-Seq, we defined 6,228 genes as being highly tran-scribed in both cell lines and identified 5,591 and4,124 genes with zero transcription in K562 andGm12878, respectively. In accordance with previouslyreported results [7,31,32], H3K4me was enrichedaround TSSs for the set of transcribed genes,H3K36me3 and Pol II were enriched in their tran-scribed regions and H3K27me3 was enriched at silentgenes (Figure 4 and Additional file 1, Figure S3).In transcribed genes, clusters were highly abundant
around TSSs, as expected (Figure 5A). However, we alsoobserved clusters mapping outside the typical promoterregion 2 kb upstream and 200 bp downstream fromTSSs. The overall number of clusters mapping to theimmediate promoter region of transcribed genes (pro-moter clusters) was comparable to the number of clus-ters mapping to other parts of the genes (gene clusters),in particular for K562 (Figure 5B). For silent genes, thenumber of promoter clusters was greatly reduced com-pared to the number of gene clusters. Thus gene clus-ters locate to both transcribed and silent genes, whereaspromoter clusters mostly locate to transcribed genes.For both transcribed and silent genes, the distribution ofclusters showed no clear distance dependence beyond 2
YY1 GATA2 NFE2 CTCF SETDB10
20
40
60
80
100
perc
enta
ge o
verl
ap
promoters
H3K4me3
H3K4me1
Open Chromatin
H3K27me3
Figure 3 Examples of transcription factors mapping to different chromatin domains. YY1 has a preference for annotated promoterscompared to the other factors. GATA2 maps to both methylated lysine 4 on histone H3 (H3K4me3) and H3K4me1, but not to annotatedpromoters, whereas NFE2 has a higher preference for H3K4me1. CTCF maps to open chromatin in addition to H3K4me1 and H3K4me3, whereasSETDB1 does not map well to any domain. As expected, none of the factors mapped well to domains containing the repressive H3K27me3mark.
Rye et al. BMC Biology 2011, 9:80http://www.biomedcentral.com/1741-7007/9/80
Page 5 of 18

kb from TSSs. This likely reflects promoter clusters’direct regulation of local RNA polymerase recruitmentor assembly, whereas gene clusters are involved in long-range regulation.
Composition of gene clusters correlates with H3K4meand differs from promoter clusters of transcribed genesTo further investigate differences in function betweenpromoter and gene clusters, we asked whether the
groups differ in their use of transcription factors.Furthermore, when correlating the locations of tran-scription factor clusters to histone modifications, weobserved that the gene clusters could be further sepa-rated into two groups, depending on their associationwith H3K4me (Figure 6). We therefore used correlationcoefficients (r, Pearson’s correlation) to measure the dif-ference in transcription factor composition between pro-moter clusters, gene clusters overlapping with H3K4me
-20 -15 -10 -5 TSS 5 10 15 20 25
1000
3000
5000
7000H3K4me3
transcribed
silent
-20 -15 -10 -5 TSS 5 10 15 20 25
1000
3000
5000
7000H3K4me
-20 -15 -10 -5 TSS 5 10 15 20 25
500
1500
2500
No.
of
genes e
nri
ched w
ith m
odific
ati
on
H3K27me3
-20 -15 -10 -5 TSS 5 10 15 20 25
1000
3000
5000
H3K36me3
-20 -15 -10 -5 TSS 5 10 15 20 25
dist. from TSS in kbp
1000
3000
5000
7000Pol2
Figure 4 Histone modifications and RNA polymerase II (Pol II) have distinct profiles around transcription start sites (TSSs) oftranscribed and silent genes. The plots are derived from the K562 cell line. Methylated lysine 4 on histone H3 (H3K4me3) is enriched aroundTSSs in transcribed genes, H3K36me3 is enriched in gene bodies of transcribed genes and Pol II is enriched at both TSSs and gene bodies oftranscribed genes, whereas H3K27me3 is enriched at silent genes. Some H3K4me enrichment was also observed for silent genes. Similar profilesfor Gm12878 are shown in Additional file 1, Figure S3.
Rye et al. BMC Biology 2011, 9:80http://www.biomedcentral.com/1741-7007/9/80
Page 6 of 18
and gene clusters not overlapping with H3K4me (Table1). Specifically, we calculated correlation coefficients bycomparing profiles of relative enrichment of transcrip-tion factors within each group of clusters (see Methods;see Figure 7 for two examples of profile comparisons).Consistent with the different regulatory functions of
promoter and gene clusters in transcribed genes, thesetwo cluster types showed the largest difference in com-position (r 0.46 and 0.04 for K562 and Gm12878,respectively) (see Figure 7A). We also observed a largecompositional difference between gene clusters asso-ciated with and not associated with H3K4me (r 0.40 and0.56, respectively) and between gene clusters associatedwith H3K4me and promoter clusters (r 0.52 and 0.04,respectively) in transcribed genes. Thus transcribedgenes had three types of clusters with markedly differentcomposition: promoter clusters close to TSSs, gene
clusters more distal to TSSs associated with H3K4me,and gene clusters far into the gene body not associatedwith H3K4me.When comparing clusters between transcribed and
silent genes, we observed that the composition of geneclusters did not change with respect to transcription (r0.99 and 0.99, respectively) and that this was true bothfor gene clusters associated with H3K4me (r 0.93 and0.97, respectively) (Figure 7B) and for those not asso-ciated with H3K4me (r 0.99 and 0.88, respectively). Incontrast, and consistent with promoter clusters’ havingactive and local roles in transcription regulation, promo-ter clusters changed in composition between transcribedand silent genes (r 0.70/0.37, respectively). Thus there isa change in composition between transcribed and silentgenes only for promoter clusters, whereas the composi-tion in gene clusters remains similar. This indicates that
-10 -5 TSS 5 10 15 20dist. from TSS in kbp
0
200
400
600
800
1000
1200
1400
1600
1800
No. of
clu
ste
rs
Atranscribed
-10 -5 TSS 5 10 15 20dist. from TSS in kbp
0
20
40
60
80
100
120
140
No. of
clu
ste
rs
K562
silent
transcribed silent0
1000
2000
3000
4000
5000
No. of
clu
ste
rs
B
promoter clusters
gene clusters
-10 -5 TSS 5 10 15 20dist. from TSS in kbp
0
200
400
600
800
1000
No. of
clu
ste
rs
transcribed
-10 -5 TSS 5 10 15 20dist. from TSS in kbp
0
10
20
30
40
50
No. of
clu
ste
rs
Gm12878
silent
transcribed silent0
1000
2000
3000
4000
5000
6000
No. of
clu
ste
rs
Figure 5 Transcription factor clusters are strongly enriched around transcription start sites (TSSs) in actively transcribed genes. (A)Mapping of transcription factor clusters around TSSs in annotated genes and promoters for transcribed and silent genes in K562 and Gm12878.Bars correspond to the number of clusters within 200-bp intervals. The dotted line indicates the same level in both graphs and is included toemphasise the difference in axis scales between transcribed and silent genes. (B) Percentage of clusters identified as promoter clusters (mappingwithin 2,000 bp upstream and 200 bp downstream of TSSs) and gene clusters (mapping within 10 kb upstream of TSSs or within the gene bodybut outside the annotated promoter region). A substantial number of gene clusters mapped to transcribed and silent genes in both cell lines.
Rye et al. BMC Biology 2011, 9:80http://www.biomedcentral.com/1741-7007/9/80
Page 7 of 18

long-range regulatory interactions are present in bothtranscribed and silent genes. Further supporting thisconclusion, CTCF, which facilitates long-range interac-tions [3], was among the most abundant transcriptionfactors in all regions except for promoters of transcribedgenes (Additional file 1, Table S4).For silent genes, the compositional differences
between the three types of clusters showed some discre-pancies between the two cell lines. Especially for K562,the composition of gene clusters associated withH3K4me mostly resembled the composition of promoter
clusters (r 0.89), whereas the closest resemblance wasobserved with gene clusters not associated withH3K4me in Gm12878 (r 0.81) (see Discussion).The enrichment of individual transcription factors in pro-
moters and genes did not always reflect the composition ofthe different cluster groups. Most factors were present inseveral groups, but the relative enrichment of each factor ineach group was sometimes very different (Figure 7 andAdditional file 1, Table S4). For example, in transcribedgenes, a higher number of promoter clusters contained thefactor c-Jun (831) compared to gene clusters (583), but thepercentage of clusters containing c-Jun was slightly higherin gene clusters (24%) than in promoter clusters (16%).Thus c-Jun may have a more important regulatory role ingene clusters, even though more ChIP-Seq peaks for thisfactor mapped to promoter clusters than to gene clusters.Generally, the 11,041 c-Jun peaks mapped better to TSSdistal markers, such as H3K4me1 (Additional file 1, FigureS1a) than to promoters, which indicates the involvement ofc-Jun in long-range regulatory interactions.We also noted some H3K4me and Pol II enrichment
at promoters of silent genes. However, this enrichmentwas not transformed into transcriptional output, as evi-denced by the zero RNA-Seq expression and low enrich-ment of H3K36me3 for these genes (Figure 4 andAdditional file 1, Figure S3). The increased enrichmentof these transcript-related features may explain thehigher concentration of transcription factor clustersaround TSSs for silent genes in K562 compared toGm12878 (Figure 5A).
Figure 6 The genomic region around transcription start sites (TSSs) can be divided into subregions. This illustration shows promotercluster locations (dark grey), gene clusters associating with methylated lysine 4 on histone H3 (H3K4me3) (medium grey) and gene clusters notassociated with H3K4me (light grey) relative to the TSS. The three cluster types showed clear differences in transcription factor composition.
Table 1 Correlation coefficients for compositiondifferences in transcription factor clusters mapping toannotated genes and promoters
Composition correlation K562 Gm12878
prom-h - gene-any-h 0.46 0.04
prom-z - gene-any-z 0.75 0.32
prom-h - prom-z 0.70 0.37
gene-any-h - gene-any-z 0.99 0.99
gene-any-h - prom-z 0.75 0.32
gene-pos-h - gene-neg-h 0.40 0.56
gene-pos-z - gene-neg-z 0.66 0.81
gene-pos-h - prom-h 0.52 0.04
gene-pos-z - prom-z 0.89 0.39
gene-pos-h - gene-pos-z 0.93 0.97
gene-neg-h - gene-neg-z 0.99 0.88
prom, promoter clusters; gene-any, gene clusters; gene-pos, gene clustersoverlapping with H3K4me; gene-neg, gene clusters not overlapping withH3K4me; h, genes with high expression; z, genes with zero expression.
Rye et al. BMC Biology 2011, 9:80http://www.biomedcentral.com/1741-7007/9/80
Page 8 of 18

H3K4me3, H3K36me3 and Pol II identify clustersoverlapping with transcriptsIn addition to annotated promoters and genes, weexpected a proportion of the transcription factor clustersto associate with transcripts and enhancers outsideannotated regions. To separate clusters located to pro-moters or to the body of transcripts (transcript clusters,including possibly unannotated transcripts) from clus-ters not associated with promoters or transcript bodies(enhancer clusters), we used associations with histonemodifications H3K36me3 and H3K4me3, together withenrichment of Pol II, as described by Mikkelsen et al.[31]. Because of the special regulatory function ofCTCF/Rad21, these two factors were left out of the ana-lysis at this stage. Clusters overlapping with eitherH3K36me3 or Pol II were classified as transcript clus-ters. In addition, clusters overlapping with H3K4me3were classified as transcript clusters if the region of
H3K4me3 enrichment overlapped with eitherH3K36me3 or Pol II. The last criterion separated iso-lated regions of H3K4me3 from regions of H3K4me3that involved the other two transcription markers. Weused independent data for Pol III to identify additionaltranscript clusters not transcribed by Pol II.Three points must be mentioned with respect to the
classification of transcript and enhancer clusters. First,we have used the term ‘enhancer clusters’ to describeclusters which do not contain the histone modificationsand polymerase signatures characteristic of transcriptionand have indicated that these are more likely to beinvolved in long-range interactions. However, a recentstudy [33] showed that a subset of enhancers involvedin long-range interactions also produce short noncodingtranscripts. Since such enhancers also recruit Pol II andshow enrichment of H3K36me3 [34], these regulatoryelements are classified among the transcript clusters
atf3
bdp1
brf1
brf2
cfo
scju
ncm
yc
jund
ctc
fe2f4
e2f6
egr1
gabp
gata
1gata
2gtf2
bhey1
max
nelfe
nfe
2nfy
anfy
bnrs
fpu1
rad21
rpc155
setd
b1
sin
3ak20
sirt6
six
5srf
taf1
tfiiictr4usf1
xrc
c4
yy1
znf2
63
znf2
74
0
10
20
30
40
50
60
70
80
perc
enta
ge o
verl
ap
A
0 10 20 30 40 50 60 70 80promoter clusters
0
5
10
15
20
25
30
35
40
gene c
luste
rs
atf3
bdp1
brf1
brf2
cfo
scju
ncm
yc
jund
ctc
fe2f4
e2f6
egr1
gabp
gata
1gata
2gtf2
bhey1
max
nelfe
nfe
2nfy
anfy
bnrs
fpu1
rad21
rpc155
setd
b1
sin
3ak20
sirt6
six
5srf
taf1
tfiiictr4usf1
xrc
c4
yy1
znf2
63
znf2
74
0
5
10
15
20
25
30
35
40
perc
enta
ge o
verl
ap
B
0 5 10 15 20 25 30 35 40transcribed genes
0
5
10
15
20
25
30
35
40silent
genes
Figure 7 The composition of transcription factor clusters is correlated between cluster types. The correlations shown are based on theenrichment of each factor in each cluster type. (A) Promoter cluster (black) and gene clusters (white) in transcribed genes (0.46, weakcorrelation). (B) Gene clusters associated with methylated lysine 4 on histone H3 in transcribed (black) and silent (white) genes (0.93, strongcorrelation). The plots are based on data derived from K562 cells.
Rye et al. BMC Biology 2011, 9:80http://www.biomedcentral.com/1741-7007/9/80
Page 9 of 18
according to the definition given above. Second, a subsetof enhancer clusters may represent elements that arenot involved in direct gene regulation [35,36]. Third,when we compared this data-driven classification withour previous annotation-based analysis, we observedsome transcript clusters in promoters and gene bodiesof silent genes, especially in K562. The set of silentgenes showed a small enrichment of Pol II andH3K4me3 (but not H3K36me3) around their TSSs (Fig-ure 4 and Additional file 1, Figure S3), but this enrich-ment did not result in detectable transcription. We stillchose to classify clusters in these silent gene regions astranscript clusters, as these signatures were most likely aresult of stalled transcription [37] and not related tolong-range interactions. So, though there may be differ-ent and possibly overlapping functions between the twoclasses of regulatory elements, we continue to use thenotion of transcript clusters as mainly transcript-produ-cing and enhancer clusters as mainly involved in long-range interactions throughout the rest of the text.In K562 and Gm12878, we identified 17,836 and
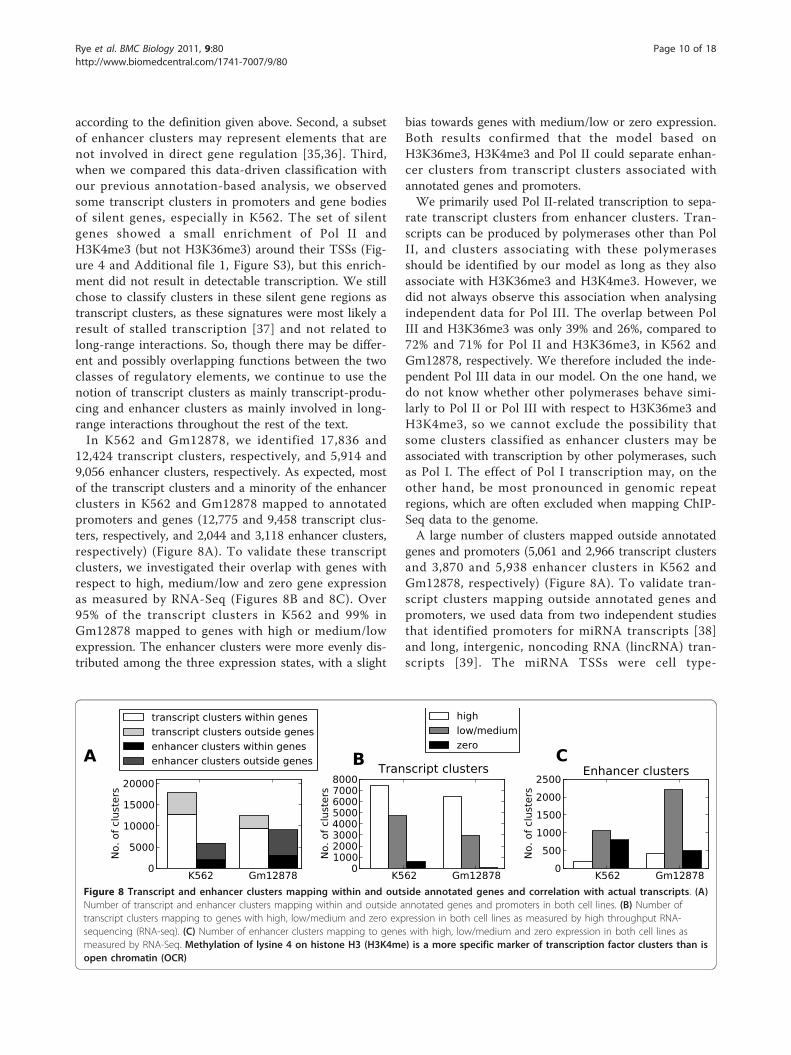
12,424 transcript clusters, respectively, and 5,914 and9,056 enhancer clusters, respectively. As expected, mostof the transcript clusters and a minority of the enhancerclusters in K562 and Gm12878 mapped to annotatedpromoters and genes (12,775 and 9,458 transcript clus-ters, respectively, and 2,044 and 3,118 enhancer clusters,respectively) (Figure 8A). To validate these transcriptclusters, we investigated their overlap with genes withrespect to high, medium/low and zero gene expressionas measured by RNA-Seq (Figures 8B and 8C). Over95% of the transcript clusters in K562 and 99% inGm12878 mapped to genes with high or medium/lowexpression. The enhancer clusters were more evenly dis-tributed among the three expression states, with a slight
bias towards genes with medium/low or zero expression.Both results confirmed that the model based onH3K36me3, H3K4me3 and Pol II could separate enhan-cer clusters from transcript clusters associated withannotated genes and promoters.We primarily used Pol II-related transcription to sepa-
rate transcript clusters from enhancer clusters. Tran-scripts can be produced by polymerases other than PolII, and clusters associating with these polymerasesshould be identified by our model as long as they alsoassociate with H3K36me3 and H3K4me3. However, wedid not always observe this association when analysingindependent data for Pol III. The overlap between PolIII and H3K36me3 was only 39% and 26%, compared to72% and 71% for Pol II and H3K36me3, in K562 andGm12878, respectively. We therefore included the inde-pendent Pol III data in our model. On the one hand, wedo not know whether other polymerases behave simi-larly to Pol II or Pol III with respect to H3K36me3 andH3K4me3, so we cannot exclude the possibility thatsome clusters classified as enhancer clusters may beassociated with transcription by other polymerases, suchas Pol I. The effect of Pol I transcription may, on theother hand, be most pronounced in genomic repeatregions, which are often excluded when mapping ChIP-Seq data to the genome.A large number of clusters mapped outside annotated
genes and promoters (5,061 and 2,966 transcript clustersand 3,870 and 5,938 enhancer clusters in K562 andGm12878, respectively) (Figure 8A). To validate tran-script clusters mapping outside annotated genes andpromoters, we used data from two independent studiesthat identified promoters for miRNA transcripts [38]and long, intergenic, noncoding RNA (lincRNA) tran-scripts [39]. The miRNA TSSs were cell type-
K562 Gm128780
5000
10000
15000
20000
No.
of
clu
ste
rs
A
transcript clusters within genes
transcript clusters outside genes
enhancer clusters within genes
enhancer clusters outside genes
K562 Gm128780
10002000300040005000600070008000
No.
of
clu
ste
rs
BTranscript clusters
high
low/medium
zero
K562 Gm128780
500
1000
1500
2000
2500
No.
of
clu
ste
rs
CEnhancer clusters
Figure 8 Transcript and enhancer clusters mapping within and outside annotated genes and correlation with actual transcripts. (A)Number of transcript and enhancer clusters mapping within and outside annotated genes and promoters in both cell lines. (B) Number oftranscript clusters mapping to genes with high, low/medium and zero expression in both cell lines as measured by high throughput RNA-sequencing (RNA-seq). (C) Number of enhancer clusters mapping to genes with high, low/medium and zero expression in both cell lines asmeasured by RNA-Seq. Methylation of lysine 4 on histone H3 (H3K4me) is a more specific marker of transcription factor clusters than isopen chromatin (OCR)
Rye et al. BMC Biology 2011, 9:80http://www.biomedcentral.com/1741-7007/9/80
Page 10 of 18
independent, whereas the lincRNAs were mapped inanother cell line. We found an increased overlapbetween these noncoding RNA transcripts and our tran-script clusters compared to enhancer clusters and over-laps expected by chance (Table 2). Though theindependent data covered only a small part of the tran-script clusters outside annotated genes and promoters,the good correspondence between transcript clustersand data from RNA-Seq, miRNA and lincRNA lead usto conclude that the transcript clusters did representtranscript-related regulatory elements. Conversely, weconcluded that the enhancer clusters were enriched withlong-range regulatory elements.
H3K4me1 is a better marker for enhancer clusters thanp300 or H3K27acThough attempts have been made to annotate enhancers[20,21,40-42], the general impression is that enhancersremain poorly annotated in the human genome. Themost likely transcription factor clusters associated withenhancers are clusters that lack the histone modificationmarks characteristic of transcription (H3K4me3,H3K36me3 and Pol II; see previous section). We there-fore wondered whether these clusters, which we termed‘enhancer clusters’, showed marks previously associatedwith enhancer regions. We focused our analysis onenhancer clusters mapping outside annotated genes andpromoters. There were 3,870 clusters of this type inK562 and 5,938 in Gm12878. We then investigated theoverlap of these clusters with respect to three recentlyused marks for enhancers: histone modificationsH3K4me1 and H3K27ac and binding of the histoneacetyltransferase p300 (Figure 9 and Additional file 1,Figure S5). Several studies have suggested thatH3K4me1 is an enhancer marker [16,20,21,32,43], andwe also observed an enrichment of H3K4me1 relative toother histone modifications within our enhancer clus-ters. Our results thus confirm H3K4me1 as a good mar-ker for enhancers in both cell lines.Another marker commonly used for enhancer identifi-
cation is the transcription factor and histone acetyltrans-ferase p300 [16,20,21,40,43,44]. However, we did notobserve a good correspondence between this factor andenhancer clusters in Gm12878. Only 8% of the
enhancer-related clusters were covered by this factor(data for p300 in K562 were not available). In fact, weidentified ten factors in Gm12878 with better coverageof the enhancer clusters than p300, the best ones beingBATF (51%), IRF4 (45%) and PU1 (41%). The latter fac-tors also showed a preference for H3K4me1 (Additionalfile 1, Figure S1B), whereas p300 also mapped well toH3K4me3 and transcript clusters.Although we saw poor correspondence between p300
and regulatory elements in Gm12878, p300 could be abetter marker in other cell lines [40]. Only approximately1,500 p300 peaks were identified by the ChIP-Seq analy-sis, which is one reason for the low coverage inGm12878. In addition, the identified peaks did not seemto map specifically to enhancers. We did not observe anytranscription factors with specificity only towards theenhancer related clusters, and all factors with a highoverlap with these clusters also overlapped well withtranscript clusters (Additional file 1, Figure S5).H3K27ac has also recently been used as an identifier
for enhancer regions [36,45], but it showed a weakeroverlap with enhancer clusters compared to H3K4me1(Figure 9). In addition, all enhancer clusters containingH3K27ac also contained H3K4me1. Still, H3K27ac hasbeen shown to be a useful marker for separating activefrom weak enhancers [34,36] and might provide valuableinformation on subclasses of enhancers and enhanceractivity in addition to the H3K4me1 mark. The notionthat H3K27ac marks specifically active regulatory ele-ments is reinforced by the observation that H3K27ac ispresent at nearly all active genes (Figure 9). We alsoobserved that H3K9ac shows a mapping pattern similarto that of H3K27ac, especially in K562 (not shown). Thepercentage overlap of H3K27ac was also similar to thatof H3K4me3 (Figure 9); however, these two modifica-tions mark somewhat different enhancer clusters. OCRsalso showed good overlap with enhancer clusters, but anOCR in itself was a less specific marker for enhancerclusters because of the large number of OCRs not map-ping to any transcription factors (see Discussion). Thusthe overall conclusion is that, in our enhancer clustersbound by transcription factors, H3K4me1 was a superiorindividual marker compared to H3K27ac, p300 andOCRs.
Table 2 Overlap between independent miRNA and lincRNA transcripts and transcript and enhancer clusters outsideannotated genes and promoters
Cell type Transcript Number of transcripts Average length Overlap with transcript clustersa Overlap with enhancer clustersa
K562 miRNA 227 862 27 (2) 4 (1)
Gm12878 miRNA 230 853 18 (1) 2 (2)
K562 lincRNA 592 24,502 97 (22) 29 (18)
Gm12878 lincRNA 586 24,536 53 (11) 33 (26)aNumber of overlaps expected by chance are shown in parentheses.
Rye et al. BMC Biology 2011, 9:80http://www.biomedcentral.com/1741-7007/9/80
Page 11 of 18

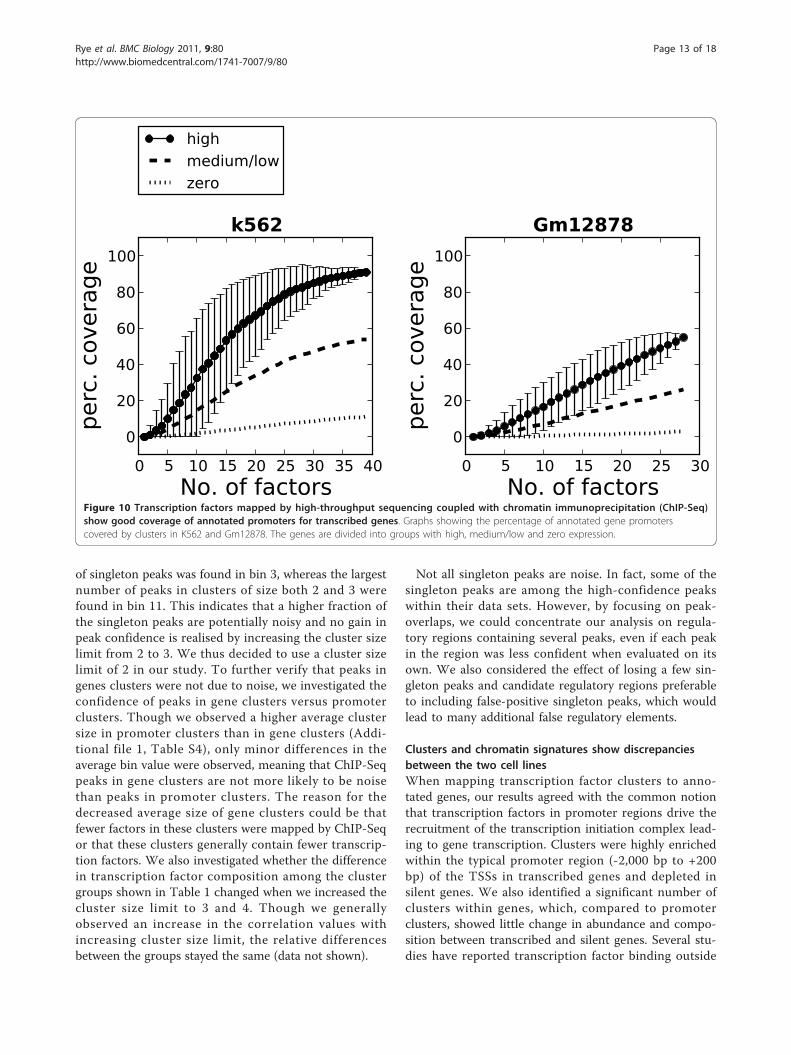
Mapped transcription factors cover a high percentage ofpromoters in highly transcribed genesThere are 1,500 to 2,000 known transcription factorsbinding to DNA in humans [46,47]. Because not all fac-tors are expressed in each cell type and since factorsgenerally bind to DNA in a combinatorial fashion, weinvestigated whether our selected clusters were sufficientto cover regulatory regions in a specific cell type. Weinvestigated the ability to cover annotated promoters forgenes with high, medium/low and zero expression inboth cell lines (Figure 10). The coverage estimate wasbased on an average of 100 calculations whereby theorder in which the transcription factors were selectedwas randomly shuffled between each calculation. Asmore transcription factors are added, the percentage ofregulatory elements covered by clusters increases. Forpromoters of highly expressed genes, the coveragereaches 91% for K562 and 55% for Gm12878 when alltranscription factors are added. The coverage was lowerin promoters of genes with medium/low and zeroexpression, which is consistent with these genes’ havinglow or no transcription in the two cell types. To investi-gate whether the inclusion of singletons would increasethe coverage further, we repeated the analysis, but nowalso including singleton peaks in addition to clusters(Additional file 1, Figure S6). When singletons wereincluded, the coverage increased to 96% for K562 and
80% for Gm12878. An interesting observation regardingK562 is that when the number of factors exceeds 30, theincrease in coverage of highly transcribed genes by add-ing a new factor is only marginal. This trend was alsoobserved when we investigated coverage of the identifiedtranscript and enhancer clusters by the same procedure(Additional file 1, Figure S6). Thus, despite the largenumber of existing human transcription factors, theresults derived from the coverage analysis indicate that arelatively modest number of factors may be sufficient tomap regulatory elements in a specific cell line.
DiscussionObserved cluster differences are not due to noisy ChIP-Seq peaksChIP-Seq data are potentially noisy [48-50], so it wasimportant to separate noisy peaks from true bindingevents in our study. Given the clustering properties oftranscription factors, we regarded overlapping peaks asmore confident than singleton peaks, which led us tofocus on peak clusters rather than individual peaks whendefining regulatory transcription factor elements. Wevalidated this approach (that is, using peaks in clusters)by sorting peaks for each of the 67 transcription factordata sets into 20 bins according to increasing ChIP-Seqtag intensity so that the most intense peaks were asso-ciated with the highest bin number. The largest number
H3K4m
e3
H3K4m
e2
H3K4m
e1
H3K4m
e
H3K27ac
OCR
0
20
40
60
80
100
perc
enta
ge o
verl
ap
K562
clusters in transcribed annotated genes/promoters
transcript clusters outside annotated genes/promoters
enhancer clusters outside annotated genes/promoters
H3K4m
e3
H3K4m
e2
H3K4m
e1
H3K4m
e
H3K27ac
OCR
p300
0
20
40
60
80
100
perc
enta
ge o
verl
ap
Gm12878
Figure 9 Transcript and enhancer clusters show different overlap with histone modifications and open chromatin (OCR). Transcriptclusters generally show a good overlap with all modification marks for accessible chromatin together with OCR, whereas enhancer clusters havea preference for methylated lysine 4 on histone H3 (H3K4me1) over H3K4me3 and acetylated lysine 27 on histone 3 (H3K27ac). Theacetyltransferase p300 did not show a strong preference for enhancer clusters in Gm12878.
Rye et al. BMC Biology 2011, 9:80http://www.biomedcentral.com/1741-7007/9/80
Page 12 of 18
of singleton peaks was found in bin 3, whereas the largestnumber of peaks in clusters of size both 2 and 3 werefound in bin 11. This indicates that a higher fraction ofthe singleton peaks are potentially noisy and no gain inpeak confidence is realised by increasing the cluster sizelimit from 2 to 3. We thus decided to use a cluster sizelimit of 2 in our study. To further verify that peaks ingenes clusters were not due to noise, we investigated theconfidence of peaks in gene clusters versus promoterclusters. Though we observed a higher average clustersize in promoter clusters than in gene clusters (Addi-tional file 1, Table S4), only minor differences in theaverage bin value were observed, meaning that ChIP-Seqpeaks in gene clusters are not more likely to be noisethan peaks in promoter clusters. The reason for thedecreased average size of gene clusters could be thatfewer factors in these clusters were mapped by ChIP-Seqor that these clusters generally contain fewer transcrip-tion factors. We also investigated whether the differencein transcription factor composition among the clustergroups shown in Table 1 changed when we increased thecluster size limit to 3 and 4. Though we generallyobserved an increase in the correlation values withincreasing cluster size limit, the relative differencesbetween the groups stayed the same (data not shown).
Not all singleton peaks are noise. In fact, some of thesingleton peaks are among the high-confidence peakswithin their data sets. However, by focusing on peak-overlaps, we could concentrate our analysis on regula-tory regions containing several peaks, even if each peakin the region was less confident when evaluated on itsown. We also considered the effect of losing a few sin-gleton peaks and candidate regulatory regions preferableto including false-positive singleton peaks, which wouldlead to many additional false regulatory elements.
Clusters and chromatin signatures show discrepanciesbetween the two cell linesWhen mapping transcription factor clusters to anno-tated genes, our results agreed with the common notionthat transcription factors in promoter regions drive therecruitment of the transcription initiation complex lead-ing to gene transcription. Clusters were highly enrichedwithin the typical promoter region (-2,000 bp to +200bp) of the TSSs in transcribed genes and depleted insilent genes. We also identified a significant number ofclusters within genes, which, compared to promoterclusters, showed little change in abundance and compo-sition between transcribed and silent genes. Several stu-dies have reported transcription factor binding outside
0 5 10 15 20 25 30 35 40
No. of factors
0
20
40
60
80
100
perc
. covera
ge
k562
high
medium/low
zero
0 5 10 15 20 25 30
No. of factors
0
20
40
60
80
100
perc
. covera
ge
Gm12878
Figure 10 Transcription factors mapped by high-throughput sequencing coupled with chromatin immunoprecipitation (ChIP-Seq)show good coverage of annotated promoters for transcribed genes. Graphs showing the percentage of annotated gene promoterscovered by clusters in K562 and Gm12878. The genes are divided into groups with high, medium/low and zero expression.
Rye et al. BMC Biology 2011, 9:80http://www.biomedcentral.com/1741-7007/9/80
Page 13 of 18

the typical promoter region [51,52], but the extent andbiological significance of such binding events have gen-erally been studied less often. Some of the regulatoryroles of transcription factors in these TSS distal clusterscould be to modulate the chromatin environmentaround genes, to work as enhancer elements directedtowards their own gene or distant genes, or to regulateindividual transcription of noncoding RNA within thegene body. The correlation in composition betweensome of these clusters and H3K4me should indicate arole in chromatin modulation. The total number of geneclusters was higher in transcribed genes than in silentgenes (Figure 5B). Studies of three-dimensional chromo-some organisation inside the nucleus [53] have revealedthat accessible and closed chromatin tend to compart-mentalise, with the consequence that transcribed genesassociated with accessible chromatin have a higher prob-ability of being spatially close to other transcribed genesthan to silent genes associated with closed chromatin. Ahigh degree of dynamic intra- and interchromosomalinteractions are often observed in the accessible com-partment, which may explain the higher frequency ofgene clusters in transcribed genes than in silent genes.Our observation that CTCF was one of the factors mostenriched in gene clusters (Figure 7 and Additional file 1,Table S4) may also point in this direction, since CTCFis involved in higher-order organisation and modulationof chromatin domains [3,54,55].The discrepancies observed when we compared cluster
composition in the two cell lines may have severalexplanations. The difference in similarity between pro-moter clusters in transcribed and silent genes for thetwo cell lines (r 0.70 in K562 vs 0.37 in Gm12878) maypartly be explained by the somewhat higher enrichmentof Pol II at silent promoters in K562 (compare Figure 4with Additional file 1, Figure S3). When we removedPol II-associated promoter clusters from silent genes inK562, the correlation dropped from 0.70 to 0.42, whichis more similar to Gm12878. It is thus likely that pro-moter clusters at silent genes in K562 are more enrichedin factors directly involved in transcription, leading tothe increased composition similarity with promoter clus-ters of transcribed genes. Additional observations indi-cate that transcription factors mapped in K562 aregenerally more promoter-specific and directly related totranscription than the factors mapped in Gm12878.First, the number of gene clusters relative to promoterclusters is higher in Gm12878 than in K562 (Figure 5and Additional file 1, Table S4). Second, when we inves-tigated the transcription factor composition differencesbetween enhancer clusters and clusters mapping toannotated promoters in transcribed genes, we observeda larger difference for K562 (r 0.65) than for Gm12878(r 0.91). Third, the higher influence of singletons for
Gm12878 in the coverage analysis also indicates thatGm12878 promoters are less mapped by transcriptionfactors than promoters in K562. The latter differencecould also be reinforced by the smaller number of fac-tors mapped in Gm12878 (28) compared to K562 (39).
More transcript clusters mapped to silent genes in K562(625) compared to Gm12878 (56)Further examination of the 625 transcript clusters map-ping to silent genes in K562 revealed that 100 clusterscontained H3K36me3, which may indicate transcriptionalevents not captured by RNA-Seq. Another 188 clusterscontained the silent histone modification H3K27me3 inaddition to the active marks, which relates these clustersto bivalent domains [37,56]. In promoters of bivalentgenes the transcriptional machinery, including Pol II, isrecruited, but transcription elongation is stalled and notranscriptional output is produced. We could not findthe exact cause for the association of the other 337 tran-script clusters to silent genes. Another source of the celltype-specific discrepancies is the selection of transcrip-tion factors mapped by ChIP-Seq in each cell line. Of the39 factors mapped in K562 and the 28 mapped inGm12878, only 13 factors were common to both celllines. The selected transcription factors can thus bebiased towards specific types of clusters, leading toinconsistent results when the composition profiles arecompared. We cannot rule out effects of possible celltype-specific regulation mechanisms, which have beenobserved in recent studies [43,57].
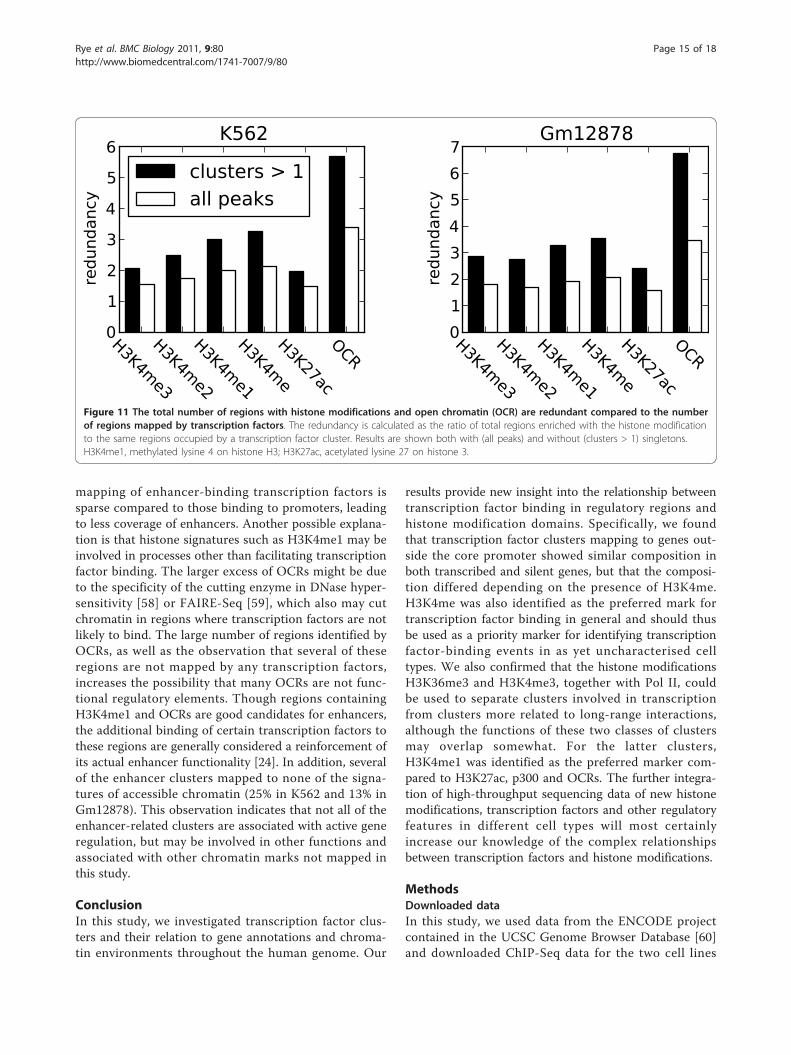
Many regions enriched with H3K4me and open chromatinregions are not mapped by any transcription factorsWe generally observed that clusters associated with bothH3K4me and OCRs. However, large parts of the genomeare enriched with H3K4me and OCRs without beingassociated with clusters (Figure 11). H3K4me1, for exam-ple, is enriched in about three times as many regions asthose mapped by clusters, whereas the correspondingoverrepresentation of OCRs regions is about six times.When singletons are included, the corresponding enrich-ment ratios are about 2 and 3.5 for H3K4me1 and OCRs,respectively. If H3K4me1 is regarded as a good markerfor enhancers, there is a discrepancy between the cover-age of clusters observed at annotated promoters (90%and 70% in K562 and Gm12878, respectively) comparedto the cluster coverage of regions enriched withH3K4me1 (50%). If the 90% and 70% (in K562 andGm12878, respectively) coverage of clusters observed inpromoters of active genes is representative of the cover-age of regulatory elements in general, one would expectthe percentage of H3K4me1 regions containing transcrip-tion factors to be much larger than the observed 50%.One reason for this discrepancy could be that the
Rye et al. BMC Biology 2011, 9:80http://www.biomedcentral.com/1741-7007/9/80
Page 14 of 18
mapping of enhancer-binding transcription factors issparse compared to those binding to promoters, leadingto less coverage of enhancers. Another possible explana-tion is that histone signatures such as H3K4me1 may beinvolved in processes other than facilitating transcriptionfactor binding. The larger excess of OCRs might be dueto the specificity of the cutting enzyme in DNase hyper-sensitivity [58] or FAIRE-Seq [59], which also may cutchromatin in regions where transcription factors are notlikely to bind. The large number of regions identified byOCRs, as well as the observation that several of theseregions are not mapped by any transcription factors,increases the possibility that many OCRs are not func-tional regulatory elements. Though regions containingH3K4me1 and OCRs are good candidates for enhancers,the additional binding of certain transcription factors tothese regions are generally considered a reinforcement ofits actual enhancer functionality [24]. In addition, severalof the enhancer clusters mapped to none of the signa-tures of accessible chromatin (25% in K562 and 13% inGm12878). This observation indicates that not all of theenhancer-related clusters are associated with active generegulation, but may be involved in other functions andassociated with other chromatin marks not mapped inthis study.
ConclusionIn this study, we investigated transcription factor clus-ters and their relation to gene annotations and chroma-tin environments throughout the human genome. Our
results provide new insight into the relationship betweentranscription factor binding in regulatory regions andhistone modification domains. Specifically, we foundthat transcription factor clusters mapping to genes out-side the core promoter showed similar composition inboth transcribed and silent genes, but that the composi-tion differed depending on the presence of H3K4me.H3K4me was also identified as the preferred mark fortranscription factor binding in general and should thusbe used as a priority marker for identifying transcriptionfactor-binding events in as yet uncharacterised celltypes. We also confirmed that the histone modificationsH3K36me3 and H3K4me3, together with Pol II, couldbe used to separate clusters involved in transcriptionfrom clusters more related to long-range interactions,although the functions of these two classes of clustersmay overlap somewhat. For the latter clusters,H3K4me1 was identified as the preferred marker com-pared to H3K27ac, p300 and OCRs. The further integra-tion of high-throughput sequencing data of new histonemodifications, transcription factors and other regulatoryfeatures in different cell types will most certainlyincrease our knowledge of the complex relationshipsbetween transcription factors and histone modifications.
MethodsDownloaded dataIn this study, we used data from the ENCODE projectcontained in the UCSC Genome Browser Database [60]and downloaded ChIP-Seq data for the two cell lines
H3K4m
e3
H3K4m
e2
H3K4m
e1
H3K4m
e
H3K27ac
OCR
0
1
2
3
4
5
6
redundancy
K562
clusters > 1
all peaks
H3K4m
e3
H3K4m
e2
H3K4m
e1
H3K4m
e
H3K27ac
OCR
0
1
2
3
4
5
6
7
redundancy
Gm12878
Figure 11 The total number of regions with histone modifications and open chromatin (OCR) are redundant compared to the numberof regions mapped by transcription factors. The redundancy is calculated as the ratio of total regions enriched with the histone modificationto the same regions occupied by a transcription factor cluster. Results are shown both with (all peaks) and without (clusters > 1) singletons.H3K4me1, methylated lysine 4 on histone H3; H3K27ac, acetylated lysine 27 on histone 3.
Rye et al. BMC Biology 2011, 9:80http://www.biomedcentral.com/1741-7007/9/80
Page 15 of 18

K562 and Gm12878. The data consisted of ChIP-Seqreads for 67 transcription factors (26 unique in K562, 15unique in Gm12878 and 13 mapped in both cell lines)and 9 histone modifications mapped in both cell lines.In addition, we downloaded accessible chromatin tracksanalysed by DNase hypersensitivity and FAIRE-Seq(OCR), expression data analysed by RNA-Seq for thesame cell lines and gene annotations from UCSCrefGene. An overview of all data downloaded fromENCODE database in the UCSC Genome Browser isgiven in Additional file 1, Table S7. In addition, wedownloaded transcript data for miRNA [38] andlincRNA (lincRNA pipeline based on the paper by Gutt-man et al. [39]) from other sources to evaluate clusterclassifications outside annotated genes and promoters.The liftOver tool was used to convert the hg19 to thehg18 version of the human genome assembly on both ofthese data sets using the Galaxy web-based platform(http://main.g2.bx.psu.edu/) for miRNA and the UCSCGenome Browser Database for lincRNA.
Identification of clustersConfident ChIP-Seq peaks for each transcription factorwere identified by using an in-house method [48] basedon output from the programs MACS [61] and SISSRs[62]. To make sure that peaks belonging to the sameregulatory element were identified in the same cluster,we extended each peak to 2,000 bp to emulate the com-mon standard used for promoter regulatory elements(2,000 bp upstream and 200 bp downstream fromTSSs). Peaks overlapping within the 2,000 bp extensionwere identified as belonging to the same cluster.
Identification of random clustersWithin each chromosome, all peak starts were randomlyshuffled. Because the full chromosome cannot bemapped by ChIP-Seq, the length of the chromosomewas adjusted by the mappability factor in MACS (0.88for 25-bp tag lengths). Each peak was then extended to2,000 bp, and overlaps were identified by using the sameprocedure as that used for the true peaks.
Identification of domains of histone modificationsChIP-Seq data for histone modification data and Pol IIwere analysed by using the program SICER version 1.03[63]. The gap size parameters were set to 200 forH3K4me3 and to 600 for other histone modifications asrecommended [63]. For Pol II, we used a larger gap sizeof 1,000 to capture longer domains of Pol II bindingrather than local Pol II peaks. ChIP-Seq data sets for thesame modification were combined, resulting in a singletrack for each modification in each cell line. To accountfor the difference in domain size of histone modifica-tions, we split each domain into regions with a
maximum length of 5,000 bp and used these regionsthroughout most of the study. The full-length regionswere used only during the identification of transcriptclusters by H3K36me3, H3K4me3 and Pol II.
Gene expression and promotersGene expression was measured by the average RNA-Seqintensity based on tags mapped to exons for each gene.Nonredundant genes were selected by grouping allgenes with overlapping subsets of exons transcribedfrom the same strand, then only the gene with the high-est expression was selected from each group. Fromamong the downloaded list of 30,399 genes, 18,682 non-redundant genes were identified by using this approach.A set of transcribed genes was chosen as the top thirdof all redundant genes when sorted by expression level,whereas a set of silent genes was chosen as all geneswith zero expression. This resulted in 6,228 transcribedgenes (both cell lines) and 5,591 and 4,124 silent genesin K562 and Gm12878, respectively. Promoters weredefined as extending 2,000 bp upstream and 200 bpdownstream of TSSs.
Composition correlationsCorrelation of transcription factor composition betweentwo types of clusters was calculated in the followingway. For both cluster types, the percentage of clustersoccupied by each factor was calculated, giving a vectorof enrichment for each factor in each cluster type. ThePearson’s r correlation between the vector for each clus-ter type was then calculated by using the corrcoef func-tion in Numpy (http://numpy.scipy.org/).
Additional material
Additional file 1: Supplementary figures and Tables S1 to S7.
AbbreviationsmiRNA: microRNA; OCR: open chromatin region; TSS: transcription start site;ChIP-Seq: chromatin immunoprecipitation coupled with high-throughputsequencing.
AcknowledgementsThis work was supported by the Functional Genomics Program (FUGE) ofthe Norwegian Research Council.
Author details1Department of Cancer Research and Molecular Medicine Laboratory Center,Faculty of Medicine, Norwegian University of Science and Technology, ErlingSkjalgssons Gate 1, NO-7491 Trondheim, Norway. 2Department of Computerand Information Science, Sem Sælands Vei 7-9, Norwegian University ofScience and Technology, NO-7491 Trondheim, Norway.
Authors’ contributionsMBR, PS, FD and TH conceived the study, and MBR designed the study. MBRanalysed the data. TH and PS contributed to data analysis. MBR, PS and FDwrote the manuscript. All authors read and approved the final manuscript.
Rye et al. BMC Biology 2011, 9:80http://www.biomedcentral.com/1741-7007/9/80
Page 16 of 18

Received: 11 November 2011 Accepted: 24 November 2011Published: 24 November 2011
References1. Farnham PJ: Insights from genomic profiling of transcription factors. Nat
Rev Genet 2009, 10:605-616.2. Kagey MH, Newman JJ, Bilodeau S, Zhan Y, Orlando DA, van Berkum NL,
Ebmeier CC, Goossens J, Rahl PB, Levine SS, Taatjes DJ, Dekker J, Young RA:Mediator and cohesin connect gene expression and chromatinarchitecture. Nature 2010, 467:430-435.
3. Phillips JE, Corces VG: CTCF: master weaver of the genome. Cell 2009,137:1194-1211.
4. Kouzarides T: Chromatin modifications and their function. Cell 2007,128:693-705.
5. Li B, Carey M, Workman JL: The role of chromatin during transcription.Cell 2007, 128:707-719.
6. Bernstein BE, Meissner A, Lander ES: The mammalian epigenome. Cell2007, 128:669-681.
7. Barski A, Cuddapah S, Cui K, Roh TY, Schones DE, Wang Z, Wei G,Chepelev I, Zhao K: High-resolution profiling of histone methylations inthe human genome. Cell 2007, 129:823-837.
8. Johnson DS, Mortazavi A, Myers RM, Wold B: Genome-wide mapping of invivo protein-DNA interactions. Science 2007, 316:1497-1502.
9. Park PJ: ChIP-seq: advantages and challenges of a maturing technology.Nat Rev Genet 2009, 10:669-680.
10. Chen X, Xu H, Yuan P, Fang F, Huss M, Vega VB, Wong E, Orlov YL,Zhang W, Jiang J, Loh YH, Yeo HC, Yeo ZX, Narang V, Govindarajan KR,Leong B, Shahab A, Ruan Y, Bourque G, Sung WK, Clarke ND, Wei CL,Ng HH: Integration of external signaling pathways with the coretranscriptional network in embryonic stem cells. Cell 2008, 133:1106-1117.
11. Niu W, Lu ZJ, Zhong M, Sarov M, Murray JI, Brdlik CM, Janette J, Chen C,Alves P, Preston E, Slightham C, Jiang L, Hyman AA, Kim SK, Waterston RH,Gerstein M, Snyder M, Reinke V: Diverse transcription factor bindingfeatures revealed by genome-wide ChIP-seq in C. elegans. Genome Res2011, 21:245-254.
12. Hon G, Wang W, Ren B: Discovery and annotation of functionalchromatin signatures in the human genome. PLoS Comput Biol 2009, 5:e1000566.
13. Wang Z, Zang C, Rosenfeld JA, Schones DE, Barski A, Cuddapah S, Cui K,Roh TY, Peng W, Zhang MQ, Zhao K: Combinatorial patterns of histoneacetylations and methylations in the human genome. Nat Genet 2008,40:897-903.
14. Ernst J, Kellis M: Discovery and characterization of chromatin states forsystematic annotation of the human genome. Nat Biotechnol 2010,28:817-825.
15. Hon G, Ren B, Wang W: ChromaSig: a probabilistic approach to findingcommon chromatin signatures in the human genome. PLoS Comput Biol2008, 4:e1000201.
16. Heintzman ND, Stuart RK, Hon G, Fu Y, Ching CW, Hawkins RD, Barrera LO,Van Calcar S, Qu C, Ching KA, Wang W, Weng Z, Green RD, Crawford GE,Ren B: Distinct and predictive chromatin signatures of transcriptionalpromoters and enhancers in the human genome. Nat Genet 2007,39:311-318.
17. Yu H, Zhu S, Zhou B, Xue H, Han JD: Inferring causal relationships amongdifferent histone modifications and gene expression. Genome Res 2008,18:1314-1324.
18. modENCODE Consortium, Roy S, Ernst J, Kharchenko PV, Kheradpour P,Negre N, Eaton ML, Landolin JM, Bristow CA, Ma L, Lin MF, Washietl S,Arshinoff BI, Ay F, Meyer PE, Robine N, Washington NL, Di Stefano L,Berezikov E, Brown CD, Candeias R, Carlson JW, Carr A, Jungreis I,Marbach D, Sealfon R, Tolstorukov MY, Will S, Alekseyenko AA, Artieri C,Booth BW, et al: Identification of functional elements and regulatorycircuits by Drosophila modENCODE. Science 2010, 330:1787-1797.
19. Kharchenko PV, Alekseyenko AA, Schwartz YB, Minoda A, Riddle NC, Ernst J,Sabo PJ, Larschan E, Gorchakov AA, Gu T, Linder-Basso D, Plachetka A,Shanower G, Tolstorukov MY, Luquette LJ, Xi R, Jung YL, Park RW,Bishop EP, Canfield TK, Sandstrom R, Thurman RE, MacAlpine DM,Stamatoyannopoulos JA, Kellis M, Elgin SC, Kuroda MI, Pirrotta V,Karpen GH, Park PJ: Comprehensive analysis of the chromatin landscapein Drosophila melanogaster. Nature 2011, 471:480-485.
20. Won KJ, Chepelev I, Ren B, Wang W: Prediction of regulatory elements inmammalian genomes using chromatin signatures. BMC Bioinformatics2008, 9:547.
21. Won KJ, Ren B, Wang W: Genome-wide prediction of transcription factorbinding sites using an integrated model. Genome Biol 2010, 11:R7.
22. Kim J, Chu J, Shen X, Wang J, Orkin SH: An extended transcriptionalnetwork for pluripotency of embryonic stem cells. Cell 2008,132:1049-1061.
23. ENCODE Project Consortium, Birney E, Stamatoyannopoulos JA, Dutta A,Guigó R, Gingeras TR, Margulies EH, Weng Z, Snyder M, Dermitzakis ET,Thurman RE, Kuehn MS, Taylor CM, Neph S, Koch CM, Asthana S,Malhotra A, Adzhubei I, Greenbaum JA, Andrews RM, Flicek P, Boyle PJ,Cao H, Carter NP, Clelland GK, Davis S, Day N, Dhami P, Dillon SC,Dorschner MO, Fiegler H, et al: Identification and analysis of functionalelements in 1% of the human genome by the ENCODE pilot project.Nature 2007, 447:799-816.
24. Bulger M, Groudine M: Functional and mechanistic diversity of distaltranscription enhancers. Cell 2011, 144:327-339.
25. Blanchette M, Bataille AR, Chen X, Poitras C, Laganière J, Lefèbvre C,Deblois G, Giguère V, Ferretti V, Bergeron D, Coulombe B, Robert F:Genome-wide computational prediction of transcriptional regulatorymodules reveals new insights into human gene expression. Genome Res2006, 16:656-668.
26. Gupta M, Liu JS: De novo cis-regulatory module elicitation for eukaryoticgenomes. Proc Natl Acad Sci USA 2005, 102:7079-7084.
27. Zhou Q, Wong WH: CisModule: de novo discovery of cis-regulatorymodules by hierarchical mixture modeling. Proc Natl Acad Sci USA 2004,101:12114-12119.
28. Ooi L, Wood IC: Chromatin crosstalk in development and disease: lessonsfrom REST. Nat Rev Genet 2007, 8:544-554.
29. Tsai MC, Manor O, Wan Y, Mosammaparast N, Wang JK, Lan F, Shi Y,Segal E, Chang HY: Long noncoding RNA as modular scaffold of histonemodification complexes. Science 2010, 329:689-693.
30. Li T, Hu JF, Qiu X, Ling J, Chen H, Wang S, Hou A, Vu TH, Hoffman AR:CTCF regulates allelic expression of Igf2 by orchestrating a promoter-polycomb repressive complex 2 intrachromosomal loop. Mol Cell Biol2008, 28:6473-6482.
31. Mikkelsen TS, Ku M, Jaffe DB, Issac B, Lieberman E, Giannoukos G, Alvarez P,Brockman W, Kim TK, Koche RP, Lee W, Mendenhall E, O’Donovan A,Presser A, Russ C, Xie X, Meissner A, Wernig M, Jaenisch R, Nusbaum C,Lander ES, Bernstein BE: Genome-wide maps of chromatin state inpluripotent and lineage-committed cells. Nature 2007, 448:553-560.
32. Koch CM, Andrews RM, Flicek P, Dillon SC, Karaöz U, Clelland GK, Wilcox S,Beare DM, Fowler JC, Couttet P, James KD, Lefebvre GC, Bruce AW,Dovey OM, Ellis PD, Dhami P, Langford CF, Weng Z, Birney E, Carter NP,Vetrie D, Dunham I: The landscape of histone modifications across 1% ofthe human genome in five human cell lines. Genome Res 2007,17:691-707.
33. Kim TK, Hemberg M, Gray JM, Costa AM, Bear DM, Wu J, Harmin DA,Laptewicz M, Barbara-Haley K, Kuersten S, Markenscoff-Papadimitriou E,Kuhl D, Bito H, Worley PF, Kreiman G, Greenberg ME: Widespreadtranscription at neuronal activity-regulated enhancers. Nature 2010,465:182-187.
34. Zentner GE, Tesar PJ, Scacheri PC: Epigenetic signatures distinguishmultiple classes of enhancers with distinct cellular functions. Genome Res2011, 21:1273-1283.
35. MacQuarrie KL, Fong AP, Morse RH, Tapscott SJ: Genome-widetranscription factor binding: beyond direct target regulation. TrendsGenet 2011, 27:141-148.
36. Creyghton MP, Cheng AW, Welstead GG, Kooistra T, Carey BW, Steine EJ,Hanna J, Lodato MA, Frampton GM, Sharp PA, Boyer LA, Young RA,Jaenisch R: Histone H3K27ac separates active from poised enhancers andpredicts developmental state. Proc Natl Acad Sci USA 2010,107:21931-21936.
37. Kanhere A, Viiri K, Araújo CC, Rasaiyaah J, Bouwman RD, Whyte WA,Pereira CF, Brookes E, Walker K, Bell GW, Pombo A, Fisher AG, Young RA,Jenner RG: Short RNAs are transcribed from repressed polycomb targetgenes and interact with polycomb repressive complex-2. Mol Cell 2010,38:675-688.
38. Marson A, Levine SS, Cole MF, Frampton GM, Brambrink T, Johnstone S,Guenther MG, Johnston WK, Wernig M, Newman J, Calabrese JM,
Rye et al. BMC Biology 2011, 9:80http://www.biomedcentral.com/1741-7007/9/80
Page 17 of 18

Dennis LM, Volkert TL, Gupta S, Love J, Hannett N, Sharp PA, Bartel DP,Jaenisch R, Young RA: Connecting microRNA genes to the coretranscriptional regulatory circuitry of embryonic stem cells. Cell 2008,134:521-533.
39. Guttman M, Amit I, Garber M, French C, Lin MF, Feldser D, Huarte M, Zuk O,Carey BW, Cassady JP, Cabili MN, Jaenisch R, Mikkelsen TS, Jacks T,Hacohen N, Bernstein BE, Kellis M, Regev A, Rinn JL, Lander ES: Chromatinsignature reveals over a thousand highly conserved large non-codingRNAs in mammals. Nature 2009, 458:223-227.
40. Visel A, Blow MJ, Li Z, Zhang T, Akiyama JA, Holt A, Plajzer-Frick I,Shoukry M, Wright C, Chen F, Afzal V, Ren B, Rubin EM, Pennacchio LA:ChIP-seq accurately predicts tissue-specific activity of enhancers. Nature2009, 457:854-858.
41. Pennacchio LA, Ahituv N, Moses AM, Prabhakar S, Nobrega MA, Shoukry M,Minovitsky S, Dubchak I, Holt A, Lewis KD, Plajzer-Frick I, Akiyama J, DeVal S, Afzal V, Black BL, Couronne O, Eisen MB, Visel A, Rubin EM: In vivoenhancer analysis of human conserved non-coding sequences. Nature2006, 444:499-502.
42. Nobrega MA, Ovcharenko I, Afzal V, Rubin EM: Scanning human genedeserts for long-range enhancers. Science 2003, 302:413.
43. Heintzman ND, Hon GC, Hawkins RD, Kheradpour P, Stark A, Harp LF, Ye Z,Lee LK, Stuart RK, Ching CW, Ching KA, Antosiewicz-Bourget JE, Liu H,Zhang X, Green RD, Lobanenkov VV, Stewart R, Thomson JA, Crawford GE,Kellis M, Ren B: Histone modifications at human enhancers reflect globalcell-type-specific gene expression. Nature 2009, 459:108-112.
44. Gotea V, Visel A, Westlund JM, Nobrega MA, Pennacchio LA, Ovcharenko I:Homotypic clusters of transcription factor binding sites are a keycomponent of human promoters and enhancers. Genome Res 2010,20:565-577.
45. Rada-Iglesias A, Bajpai R, Swigut T, Brugmann SA, Flynn RA, Wysocka J: Aunique chromatin signature uncovers early developmental enhancers inhumans. Nature 2011, 470:279-283.
46. Ravasi T, Suzuki H, Cannistraci CV, Katayama S, Bajic VB, Tan K, Akalin A,Schmeier S, Kanamori-Katayama M, Bertin N, Carninci P, Daub CO,Forrest AR, Gough J, Grimmond S, Han JH, Hashimoto T, Hide W,Hofmann O, Kamburov A, Kaur M, Kawaji H, Kubosaki A, Lassmann T, vanNimwegen E, MacPherson CR, Ogawa C, Radovanovic A, Schwartz A,Teasdale RD, et al: An atlas of combinatorial transcriptional regulation inmouse and man. Cell 2010, 140:744-752.
47. Vaquerizas JM, Kummerfeld SK, Teichmann SA, Luscombe NM: A census ofhuman transcription factors: function, expression and evolution. Nat RevGenet 2009, 10:252-263.
48. Rye MB, Sætrom P, Drabløs F: A manually curated ChIP-seq benchmarkdemonstrates room for improvement in current peak-finder programs.Nucleic Acids Res 2011, 39:e25.
49. Kharchenko PV, Tolstorukov MY, Park PJ: Design and analysis of ChIP-seqexperiments for DNA-binding proteins. Nat Biotechnol 2008, 26:1351-1359.
50. Xu H, Handoko L, Wei XL, Ye CP, Sheng JP, Wei CL, Lin F, Sung WK: Asignal-noise model for significance analysis of ChIP-seq with negativecontrol. Bioinformatics 2010, 26:1199-1204.
51. Wallerman O, Motallebipour M, Enroth S, Patra K, Bysani MS, Komorowski J,Wadelius C: Molecular interactions between HNF4a, FOXA2 and GABPidentified at regulatory DNA elements through ChIP-sequencing. NucleicAcids Res 2009, 37:7498-7508.
52. Wray GA, Hahn MW, Abouheif E, Balhoff JP, Pizer M, Rockman MV,Romano LA: The evolution of transcriptional regulation in eukaryotes.Mol Biol Evol 2003, 20:1377-1419.
53. Lieberman-Aiden E, van Berkum NL, Williams L, Imakaev M, Ragoczy T,Telling A, Amit I, Lajoie BR, Sabo PJ, Dorschner MO, Sandstrom R,Bernstein B, Bender MA, Groudine M, Gnirke A, Stamatoyannopoulos J,Mirny LA, Lander ES, Dekker J: Comprehensive mapping of long-rangeinteractions reveals folding principles of the human genome. Science2009, 326:289-293.
54. Cuddapah S, Jothi R, Schones DE, Roh TY, Cui K, Zhao K: Global analysis ofthe insulator binding protein CTCF in chromatin barrier regions revealsdemarcation of active and repressive domains. Genome Res 2009,19:24-32.
55. Kim TH, Abdullaev ZK, Smith AD, Ching KA, Loukinov DI, Green RD,Zhang MQ, Lobanenkov VV, Ren B: Analysis of the vertebrate insulatorprotein CTCF-binding sites in the human genome. Cell 2007,128:1231-1245.
56. Bernstein BE, Mikkelsen TS, Xie X, Kamal M, Huebert DJ, Cuff J, Fry B,Meissner A, Wernig M, Plath K, Jaenisch R, Wagschal A, Feil R, Schreiber SL,Lander ES: A bivalent chromatin structure marks key developmentalgenes in embryonic stem cells. Cell 2006, 125:315-326.
57. Pekowska A, Benoukraf T, Ferrier P, Spicuglia S: A unique H3K4me2 profilemarks tissue-specific gene regulation. Genome Res 2010, 20:1493-1502.
58. Boyle AP, Davis S, Shulha HP, Meltzer P, Margulies EH, Weng Z, Furey TS,Crawford GE: High-resolution mapping and characterization of openchromatin across the genome. Cell 2008, 132:311-322.
59. Gaulton KJ, Nammo T, Pasquali L, Simon JM, Giresi PG, Fogarty MP,Panhuis TM, Mieczkowski P, Secchi A, Bosco D, Berney T, Montanya E,Mohlke KL, Lieb JD, Ferrer J: A map of open chromatin in humanpancreatic islets. Nat Genet 2010, 42:255-259.
60. Karolchik D, Baertsch R, Diekhans M, Furey TS, Hinrichs A, Lu YT, Roskin KM,Schwartz M, Sugnet CW, Thomas DJ, Weber RJ, Haussler D, Kent WJ,University of California Santa Cruz: The UCSC Genome Browser Database.Nucleic Acids Res 2003, 31:51-54.
61. Zhang Y, Liu T, Meyer CA, Eeckhoute J, Johnson DS, Bernstein BE,Nusbaum C, Myers RM, Brown M, Li W, Liu XS: Model-based analysis ofChIP-Seq (MACS). Genome Biol 2008, 9:R137.
62. Jothi R, Cuddapah S, Barski A, Cui K, Zhao K: Genome-wide identificationof in vivo protein-DNA binding sites from ChIP-Seq data. Nucleic Acids Res2008, 36:5221-5231.
63. Zang CZ, Schones DE, Zeng C, Cui KR, Zhao KJ, Peng WQ: A clusteringapproach for identification of enriched domains from histonemodification ChIP-Seq data. Bioinformatics 2009, 25:1952-1958.
doi:10.1186/1741-7007-9-80Cite this article as: Rye et al.: Clustered ChIP-Seq-defined transcriptionfactor binding sites and histone modifications map distinct classes ofregulatory elements. BMC Biology 2011 9:80.
Submit your next manuscript to BioMed Centraland take full advantage of:
• Convenient online submission
• Thorough peer review
• No space constraints or color figure charges
• Immediate publication on acceptance
• Inclusion in PubMed, CAS, Scopus and Google Scholar
• Research which is freely available for redistribution
Submit your manuscript at www.biomedcentral.com/submit
Rye et al. BMC Biology 2011, 9:80http://www.biomedcentral.com/1741-7007/9/80
Page 18 of 18


