Research Article Nanostructural Deformation Analysis of ...
7
Research Article Nanostructural Deformation Analysis of Calcium Silicate Hydrate in Portland Cement Paste by Atomic Pair Distribution Function Hiroshi Suzuki, 1 Sungchul Bae, 2 and Manabu Kanematsu 3 1 Materials Sciences Research Center, Japan Atomic Energy Agency, 2-4 Shirakata, Tokai, Naka, Ibaraki 319-1195, Japan 2 Division of Architectural Engineering, Hanyang University, Seoul 04763, Republic of Korea 3 Department of Architecture and Building Engineering, Faculty of Science and Technology, Tokyo University of Science, 2641 Yamazaki, Noda, Chiba 278-8510, Japan Correspondence should be addressed to Sungchul Bae; [email protected] Received 15 November 2015; Accepted 3 March 2016 Academic Editor: Jozef Bednarcik Copyright © 2016 Hiroshi Suzuki et al. is is an open access article distributed under the Creative Commons Attribution License, which permits unrestricted use, distribution, and reproduction in any medium, provided the original work is properly cited. e deformation of nanostructure of calcium silicate hydrate (C-S-H) in Portland cement (PC) paste under compression was characterized by the atomic pair distribution function (PDF), measured using synchrotron X-ray diffraction. e PDF of the PC paste exhibited a unique deformation behavior for a short-range order below 2.0 nm, close to the size of the C-S-H globule, while the deformation for a long-range order was similar to that of a calcium hydroxide phase measured by Bragg peak shiſt. e compressive deformation of the C-S-H nanostructure was comprised of three stages with different interactions between globules. is behavior would originate from the granular nature of C-S-H, which deforms with increasing packing density by slipping the interfaces between globules, rearranging the overall C-S-H nanostructure. is new approach will lead to increasing applications of the PDF technique to understand the deformation mechanism of C-S-H in PC-based materials. 1. Introduction Portland cement (PC) paste is composed of various hydra- tion products, such as calcium hydroxide (CH), ettringite, monosulphate, and calcium silicate hydrate (C-S-H), as well as several anhydrous PC clinker phases [1]. C-S-H, a primary binding phase in PC paste, has predominant influences on its mechanical and chemical properties. It is, therefore, crucial to understand the role of the C-S-H phase in the deformation behavior of PC paste. In previous studies, various discussions on the mesoscale structure of C-S-H have been made regarding the basis of physical properties such as specific surface area, pore size, and density measured by a number of observation techniques [2–4]. Jennings, accordingly, suggested that the basic model for the nanostructure of C-S-H to represent these physical parameters, which is a particle-packing model with nanoscale globules, is known as the colloid model [5, 6]. is is a useful model for understanding the physical and mechanical prop- erties of C-S-H as in the case of Constantinides and Ulm [7] discovering the unique nanogranular behavior of C-S-H, driven by particle-to-particle contact forces, from the results of the mapping of the indentation modulus. Although there are various deformation studies on PC paste on the basis of CH phase behavior measured using neu- tron and X-ray diffraction techniques [8–10], there is a lack of studies on the deformation of C-S-H itself due to its unique nanostructure. Meanwhile, the atomic pair distribution func- tion (PDF) technique is well known as a method to evaluate nanoscale structures of materials with no or less crystal peri- odicity. For instance, using the PDF technique, Skinner et al. suggested that the size of the C-S-H nanoparticle is estimated to be approximately 3.5 nm in diameter [11]. Furthermore, this technique has been successfully applied to quantita- tive evaluation of the deformation behavior of amorphous metallic glasses by directly measuring displacement between Hindawi Publishing Corporation Advances in Materials Science and Engineering Volume 2016, Article ID 8936084, 6 pages http://dx.doi.org/10.1155/2016/8936084
Transcript of Research Article Nanostructural Deformation Analysis of ...
Research ArticleNanostructural Deformation Analysis ofCalcium Silicate Hydrate in Portland Cement Paste byAtomic Pair Distribution Function
Hiroshi Suzuki,1 Sungchul Bae,2 and Manabu Kanematsu3
1Materials Sciences Research Center, Japan Atomic Energy Agency, 2-4 Shirakata, Tokai, Naka, Ibaraki 319-1195, Japan2Division of Architectural Engineering, Hanyang University, Seoul 04763, Republic of Korea3Department of Architecture and Building Engineering, Faculty of Science and Technology, Tokyo University of Science,2641 Yamazaki, Noda, Chiba 278-8510, Japan
Correspondence should be addressed to Sungchul Bae; [email protected]
Received 15 November 2015; Accepted 3 March 2016
Academic Editor: Jozef Bednarcik
Copyright © 2016 Hiroshi Suzuki et al.This is an open access article distributed under the Creative Commons Attribution License,which permits unrestricted use, distribution, and reproduction in any medium, provided the original work is properly cited.
The deformation of nanostructure of calcium silicate hydrate (C-S-H) in Portland cement (PC) paste under compression wascharacterized by the atomic pair distribution function (PDF), measured using synchrotron X-ray diffraction. The PDF of the PCpaste exhibited a unique deformation behavior for a short-range order below 2.0 nm, close to the size of the C-S-H globule, while thedeformation for a long-range order was similar to that of a calcium hydroxide phasemeasured by Bragg peak shift.The compressivedeformation of the C-S-H nanostructure was comprised of three stages with different interactions between globules. This behaviorwould originate from the granular nature of C-S-H, which deforms with increasing packing density by slipping the interfacesbetween globules, rearranging the overall C-S-H nanostructure. This new approach will lead to increasing applications of the PDFtechnique to understand the deformation mechanism of C-S-H in PC-based materials.
1. Introduction
Portland cement (PC) paste is composed of various hydra-tion products, such as calcium hydroxide (CH), ettringite,monosulphate, and calcium silicate hydrate (C-S-H), as wellas several anhydrous PC clinker phases [1]. C-S-H, a primarybinding phase in PC paste, has predominant influences on itsmechanical and chemical properties. It is, therefore, crucial tounderstand the role of the C-S-H phase in the deformationbehavior of PC paste.
In previous studies, various discussions on the mesoscalestructure of C-S-H have been made regarding the basis ofphysical properties such as specific surface area, pore size,and densitymeasured by a number of observation techniques[2–4]. Jennings, accordingly, suggested that the basic modelfor the nanostructure of C-S-H to represent these physicalparameters, which is a particle-packingmodelwith nanoscaleglobules, is known as the colloid model [5, 6]. This is a useful
model for understanding the physical and mechanical prop-erties of C-S-H as in the case of Constantinides and Ulm[7] discovering the unique nanogranular behavior of C-S-H,driven by particle-to-particle contact forces, from the resultsof the mapping of the indentation modulus.
Although there are various deformation studies on PCpaste on the basis of CH phase behavior measured using neu-tron and X-ray diffraction techniques [8–10], there is a lack ofstudies on the deformation of C-S-H itself due to its uniquenanostructure.Meanwhile, the atomic pair distribution func-tion (PDF) technique is well known as a method to evaluatenanoscale structures of materials with no or less crystal peri-odicity. For instance, using the PDF technique, Skinner et al.suggested that the size of the C-S-H nanoparticle is estimatedto be approximately 3.5 nm in diameter [11]. Furthermore,this technique has been successfully applied to quantita-tive evaluation of the deformation behavior of amorphousmetallic glasses by directly measuring displacement between
Hindawi Publishing CorporationAdvances in Materials Science and EngineeringVolume 2016, Article ID 8936084, 6 pageshttp://dx.doi.org/10.1155/2016/8936084

2 Advances in Materials Science and Engineering
10 30 50 70 90 110 130 1500
5
10
15
20
Inte
nsity
(a.u
.)
Q (nm−1)
(a)
0
0.5
1
1.5
0 1 2 3 4 5 6r (nm)
−0.5
−1
G(r
) (nm
−2)
(×10−2)
(b)
Figure 1: (a) X-ray diffraction pattern of PC paste measured at the detector position of 300mm and (b) the PDF data derived from thediffraction pattern shown in (a).
neighbor atoms [12]. In this study, the deformation behaviorof the C-S-H phase in PC paste is discussed by applyingthe PDF technique to access a quantitative evaluation of thelocal strains occurring in the C-S-H nanostructure.
2. Material and Methods
PC for research containing fewer impurities wasmixedwith awater-to-cement ratio of 0.5.The paste was cured for a total of73 days, that is, demolded after 24 hours, cured in water for 28days, and stored for 45 days under ambient conditions at 20∘Cand 60% RH. The rectangular specimen, with a dimensionof 5 × 5 × 10mm3, was obtained from the PC paste withdimensions of 50 × 50 × 92mm3.
The X-ray diffraction experiments were carried out usinghigh-energy X-rays of 69.8 keV at BL22XU in SPring-8, Japan[13].The specimenmounted on the load frame was set on thediffractometer and was irradiated by an incident beam witha size of 0.3 × 0.3mm2. The diffraction from the specimenwas measured by an imaging plate (IP) with exposure timeof 20 seconds. The pixel size of the IP was approximately0.1mm. The distances from the IP to the specimen were setto be 300mm and 700mm. Each distance was determinedto obtain a longer 𝑄-range for the PDF and higher angu-lar resolution for the strain analysis by Bragg peak shift,respectively. Adiffraction pattern in the loading directionwasobtained by circumferentially integrating the range of ±30∘ ofthe diffraction ring. The compressive loadings were appliedto the specimen with the constant displacement mode untilapproximately 40MPa. Since the applied stress was graduallyreleased due to creep while stopping the displacement, theaverage stress during measurement was defined to be appliedstress. The scattering vector was parallel to the axis of theapplied compressive load.
3. Results
Figure 1(a) presents a diffraction pattern measured by theIP placed at 300mm. A number of diffraction peaks canbe observed, which are derived from hydration productsand anhydrous clinker phases. Although most diffractionpeaks are difficult to identify because of their complex crystalstructures, CH peaks can be extracted from the diffractionpattern since it is a simple trigonal structure. In contrast,the C-S-H nanostructure might appear as a halo patternoverlapped with the diffraction pattern. Figure 1(b) shows thePDF produced by the PDFgetX3 program [14] with a𝑄-rangeof Fourier transformation from 14 to 140 nm−1. The radius,𝑟, in the horizontal axis in Figure 1(b) is the distance from anaverage atom located at the origin. This is mixed nanostruc-tural information of all composed phases, including C-S-H,weighted by the volume fraction, and shows similar trendsregarding the PDF of the hydrated tricalcium silicate pasteshown in the previous study [11].
Figure 2 shows a change in strains as a function of theapplied stress, derived from the Bragg peak shift. The elasticstrain, 𝜀
𝑏, is obtained by a change in the lattice spacing, 𝑑, for
ℎ𝑘𝑙 reflection in the sample from reference lattice spacing,𝑑𝑛0, in an initial step of loading; 𝜀
𝑏= (𝑑𝑛− 𝑑𝑛0)/𝑑𝑛0. The
deformation of the CH phase (hereafter “CH-strain”) wascalculated by averaging strains of 36 reflections related to theCH phase using the following equation:
𝜀𝑏Avg=
1
𝑛
∑𝜀𝑏𝑛
=
1
𝑛
∑
𝑑𝑛− 𝑑𝑛0
𝑑𝑛0
, (1)
where 𝑛 indicates the number of reflections used for the straincalculation. In contrast, the average deformation of othercomposed crystalline phases, that is, hydration productsexcept C-S-H andCHphases, was calculated by averaging the

Advances in Materials Science and Engineering 3
0
0.0002
0 10 20 30 40
Stra
in
Applied compressive stress (MPa)
CH phase(CH-strain)
Other composedphases’ average
−0.0002
−0.0004
−0.0006
−0.0008
−0.001
−0.0012
E = 32GPa
E = 52GPa
Figure 2: Strain change of the CH phase and the average strain of the other composed phases as a function of the applied compressive stress.The strains are derived from the Bragg peak shift.The average error bars are±3.4×10⁻⁵ and±2.1×10⁻⁴, respectively.The lineally approximatedlines are presented in solid lines.
strains of the remaining 22 reflections. The CH phase showsa linear deformation, but we can see a slight change in gra-dient at 14MPa of compressive loading by carefully looking.Assuming it is linear, Young’s modulus of the CH phase iscalculated to be approximately 32GPa, which is smaller thanthat of other composed phases, approximately 52GPa.
The PDF shown in Figure 1(b) represents a mixed atomicdistribution derived from all composed phases includingC-S-H, weighted by the volume fraction of each phase. Itis, therefore, challenging to extract only C-S-H structuralinformation from the measured PDF. In this study, weattempted to characterize the deformation behavior of C-S-H by using the feature that the intensity damping of the PDFis correlated to the damping of the structural coherence in thecrystalline grain, meaning the grain size [15]. The PDF in theshort range could be dominated by C-S-H since its volumefraction is typically known to be approximately 50% or more[16]. In contrast, the structural information of C-S-H in thePDF decreases with an increase of 𝑟 since the discrete PDFderived from C-S-H with the size of a few nanometers mightbe damping immediately.
In the PDF technique, the atomic strain, 𝜀𝑎, is obtained
by a change of the peak position, 𝑟, from a reference radius,𝑟𝑛0, in an initial step of loading; 𝜀
𝑎= (𝑟𝑛− 𝑟𝑛0)/𝑟𝑛0. Figure 3
shows the atomic strain behaviors that averaged at intervalsof 0.5 nm or 1.0 nm in 𝑟, calculated by the following equation:
𝜀𝑎Avg=
1
𝑛
∑𝜀𝑎𝑛
=
1
𝑛
∑
𝑟𝑛− 𝑟𝑛0
𝑟𝑛0
, (2)
where 𝑛 indicates the number of peaks used for the straincalculation.The change in the atomic strain in the short rangebelow 1.0 nm shows the S-curve and shifts the trend to belinear gradually with an increase in 𝑟. With exceeding 2.0 nmin 𝑟, the atomic strains change linearly along the CH-strainmeasured by the Bragg peak shift but do not always agreewith the CH-strain beyond 3.0 nm in 𝑟. According to theresult shown in Figure 3, 2.0 nm in the PDF seems to be acritical size in the transition of deformation. Considering the
typical globule size of C-S-H, ∼5.0 nm, suggested by varioustechniques in previous studies [4–6, 11, 17], the deformationbehavior below 2.0 nm in 𝑟 might be predominantly charac-terized by the C-S-H nanostructure. Figure 4 shows a changein atomic strains averaged in the ranges from 0 nm to 2.0 nmand from 2.0 nm to 6.0 nm, compared with the CH-strain.In the local structural deformation below 2.0 nm in 𝑟, theplateau region can be observed from 14 to 24MPa of appliedstress in compression. On the other hand, the deformationin the longer range between 2.0 nm and 6.0 nm shows aslightly similar trend to the local structural deformation, butit rather corresponds to the CH-strain. This means that thedeformation above 2.0 nm in 𝑟 predominantly represents thedeformation of the CH phase.
4. Discussion
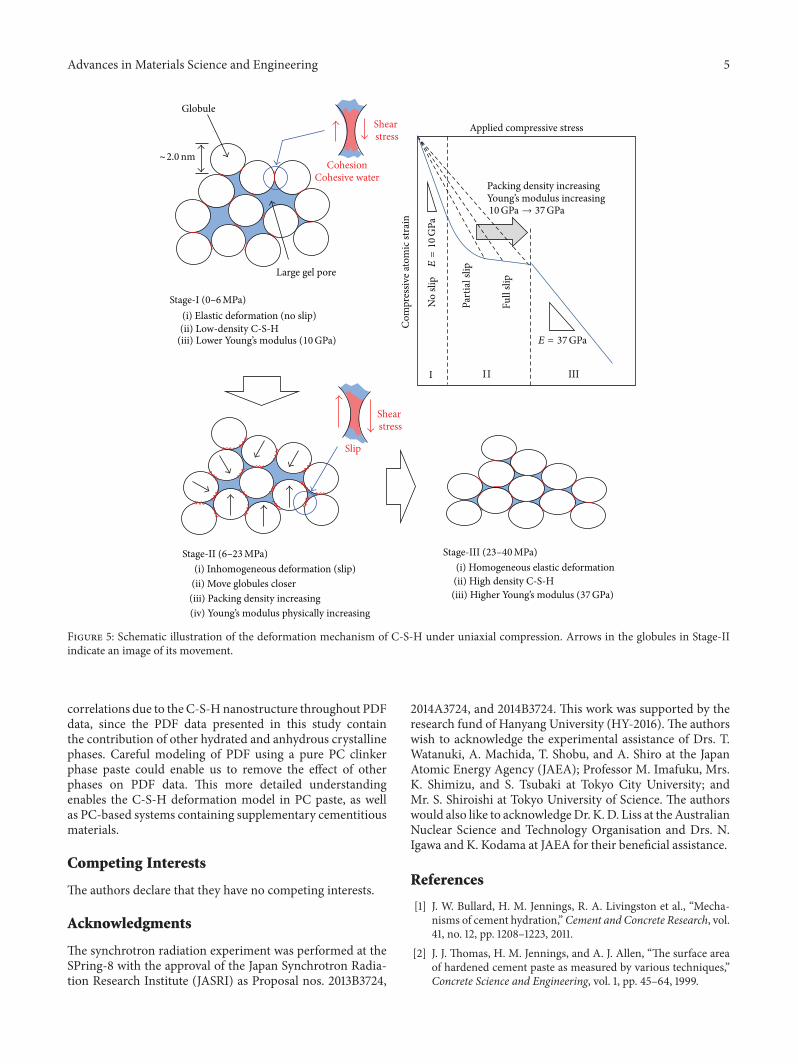
As shown in Figure 4, the deformation behavior of the short-range structure in the range from 0 nm to 2 nmwould consistof three stages with different trends as follows. The lineardeformation behavior with 10GPa of Young’s modulus isobserved first in Stage-I, and then the deformation becomessmaller in Stage-II. After that, the compressive strain linearlyincreases again with 37GPa of Young’s modulus in Stage-III.Here, it is appropriate to apply the colloid model [5, 6] toexplain the unique deformation behavior of the short-rangestructure within 2.0 nm in 𝑟 on the basis of the nanogranularnature.
Figure 5 shows the schematic idea regarding the defor-mation mechanism of C-S-H under compression. Assumingthat C-S-H acts as a granular material, the force transmissionbetween globules follows the principle of the force chain net-work [18]. Considering an initial structure of C-S-H in Stage-I, low-density C-S-H with large gel pores decreases Young’smodulus since the small contact area, that is, the small load-bearing area, between globules enhances deformation in C-S-H. Furthermore, there would be no slip between globules inStage-I. In Stage-II, on the other hand, the interface filled

4 Advances in Materials Science and Engineering
0
0.0003
0 10 20 30 40
Stra
in
Applied compressive stress (MPa)
CH-strain
−0.0003
−0.0006
−0.0009
−0.0015
−0.0018
−0.0012
r = 0-1nmr = 1–1.5nmr = 1.5–2nm
r = 2–2.5nm
(a)
0 10 20 30 40Applied compressive stress (MPa)
0
0.0003
Stra
in
−0.0003
−0.0006
−0.0009
−0.0015
−0.0018
−0.0012
CH-strainr = 2.5–3nmr = 3-4nmr = 4-5nm
r = 5-6nm
(b)
Figure 3: The atomic strains that averaged at intervals of 0.5 nm or 1.0 nm in 𝑟, compared with the strain of the CH phase derived from theBragg peak shift. The average error bars are ±22 × 10−5 (𝑟 = 0-1 nm), ±9.5 × 10⁻⁵ (𝑟 = 1–1.5 nm), ±6.1 × 10⁻⁵ (𝑟 = 1.5–2 nm), ±6.3 × 10⁻⁵ (𝑟 =2–2.5 nm), ±4.0 × 10⁻⁵ (𝑟 = 2.5–3 nm), ±3.2 × 10⁻⁵ (𝑟 = 3-4 nm), ±2.5 × 10⁻⁵ (𝑟 = 4-5 nm), and ±1.8 × 10⁻⁵ (𝑟 = 5-6 nm).
CH-strain
0 10 20 30 40Applied compressive stress (MPa)
0
0.0003
Stra
in
−0.0003
−0.0006
−0.0009
−0.0015
−0.0018
−0.0012
r = 0–2nmr = 2–6nm
Figure 4: Change in the atomic strains that averaged in the rangesfrom 0 nm to 2.0 nm in 𝑟 and from 2.0 nm to 6.0 nm in 𝑟, comparedwith a change in the strain of the CH phase derived from the Braggpeak shift. The average error bars are ±1.0 × 10⁻⁴ and ±1.5 × 10⁻⁵,respectively.
by cohesive water between globules might start to slip sinceshear stress exceeds the critical strength of the interface,resulting in an increase in the packing density in C-S-H andthen starting inhomogeneous deformation. While increasingthe packing density in Stage-II, Young’s modulus in C-S-His physically increasing with an increase in the load-bearingarea between globules, and the strain in C-S-H decreases byfollowingHooke’s law even if there is no change in the applied
loading. This implies that the strain in C-S-H can be relaxedby physical increasing in Young’s modulus of C-S-H duringdeformation. In the first half of Stage-II, a partial slip occursbetween globules in the C-S-H structure, and Young’s modu-lus slightly increases with an increase of the solid-phase den-sity. Following an increase in the applied stress, a slip occursall over the C-S-H structure, resulting in a large increasein Young’s modulus and apparently showing small increasein strain, a plateau, in the second half of Stage-II. Afterfull packing of globules in C-S-H, the C-S-H phase deformshomogeneously in Stage-III with 37GPa of Young’s modulus.Thedifference inYoung’smodulus between Stage-I and Stage-II indicates changes in the nanostructure, with an increase indensity and a decrease in gel pores in C-S-H by compressivedeformation. In accordance with the reference [7], the self-consistent model indicates that the indentation modulus ofC-S-H can also increase more than threefold by an increasein the packing density of about 20%. Therefore, it is nowonder that this large difference in Young’s modulus appearsbetween Stage-I and Stage-III.
5. Conclusions
In this study, the deformation behavior of the C-S-H nanos-tructure was quantitatively characterized by the PDF tech-nique, taking the feature of intensity damping in the PDF,which is correlated to the damping of the structural coherencein the crystalline grain size. The compressive deformation ofthe C-S-H nanostructure would consist of three stages withdifferent interactions between globules. It would originatefrom the granular nature of C-S-H which deforms withincreasing the packing density by slipping the interlayerbetween globules, rearranging the overall C-S-H nanostruc-ture. However, it is necessary to isolate specific atom-atom
Advances in Materials Science and Engineering 5
(i) Inhomogeneous deformation (slip)(ii) Move globules closer(iii) Packing density increasing(iv) Young’s modulus physically increasing
Large gel pore
Shear stress
Slip
CohesionCohesive water
Shear stress
Packing density increasingYoung’s modulus increasing
I II III
Applied compressive stress
Com
pres
sive a
tom
ic st
rain
Globule
Full
slip
Part
ial s
lip
No
slip
10GPa → 37GPa
E=10
GPa
E = 37GPa
∼2.0nm
(i) Elastic deformation (no slip)(ii) Low-density C-S-H
(iii) Lower Young’s modulus (10GPa)
(i) Homogeneous elastic deformation(ii) High density C-S-H(iii) Higher Young’s modulus (37GPa)
Stage-I (0–6MPa)
Stage-II (6–23MPa) Stage-III (23–40MPa)
Figure 5: Schematic illustration of the deformation mechanism of C-S-H under uniaxial compression. Arrows in the globules in Stage-IIindicate an image of its movement.
correlations due to the C-S-Hnanostructure throughout PDFdata, since the PDF data presented in this study containthe contribution of other hydrated and anhydrous crystallinephases. Careful modeling of PDF using a pure PC clinkerphase paste could enable us to remove the effect of otherphases on PDF data. This more detailed understandingenables the C-S-H deformation model in PC paste, as wellas PC-based systems containing supplementary cementitiousmaterials.
Competing Interests
The authors declare that they have no competing interests.
Acknowledgments
The synchrotron radiation experiment was performed at theSPring-8 with the approval of the Japan Synchrotron Radia-tion Research Institute (JASRI) as Proposal nos. 2013B3724,
2014A3724, and 2014B3724. This work was supported by theresearch fund of Hanyang University (HY-2016). The authorswish to acknowledge the experimental assistance of Drs. T.Watanuki, A. Machida, T. Shobu, and A. Shiro at the JapanAtomic Energy Agency (JAEA); Professor M. Imafuku, Mrs.K. Shimizu, and S. Tsubaki at Tokyo City University; andMr. S. Shiroishi at Tokyo University of Science. The authorswould also like to acknowledgeDr. K.D. Liss at theAustralianNuclear Science and Technology Organisation and Drs. N.Igawa and K. Kodama at JAEA for their beneficial assistance.
References
[1] J. W. Bullard, H. M. Jennings, R. A. Livingston et al., “Mecha-nisms of cement hydration,”Cement and Concrete Research, vol.41, no. 12, pp. 1208–1223, 2011.
[2] J. J. Thomas, H. M. Jennings, and A. J. Allen, “The surface areaof hardened cement paste as measured by various techniques,”Concrete Science and Engineering, vol. 1, pp. 45–64, 1999.
6 Advances in Materials Science and Engineering
[3] W. P. Halperin, J.-Y. Jehng, and Y.-Q. Song, “Application of spin-spin relaxation to measurement of surface area and pore sizedistributions in a hydrating cement paste,”Magnetic ResonanceImaging, vol. 12, no. 2, pp. 169–173, 1994.
[4] A. J. Allen, J. J. Thomas, and H. M. Jennings, “Compositionand density of nanoscale calcium-silicate-hydrate in cement,”Nature Materials, vol. 6, no. 4, pp. 311–316, 2007.
[5] H. M. Jennings, “A model for the microstructure of calciumsilicate hydrate in cement paste,”Cement and Concrete Research,vol. 30, no. 1, pp. 101–116, 2000.
[6] H. M. Jennings, “Refinements to colloid model of C-S-H incement: CM-II,” Cement and Concrete Research, vol. 38, no. 3,pp. 275–289, 2008.
[7] G. Constantinides and F.-J. Ulm, “The nanogranular nature ofC-S-H,” Journal of the Mechanics and Physics of Solids, vol. 55,no. 1, pp. 64–90, 2007.
[8] S. E. Mikel, J. J. Biernacki, and T. Gnapel-Herold, “A neutrondiffraction-based technique for determining phase resolvedstrains in Portland cement,” ACI Journal, vol. 106, pp. 455–460,2009.
[9] J. J. Biernacki, C. J. Parnham, T. R. Watkins, C. R. Hubbard, andJ. Bai, “Phase-resolved strain measurements in hydrated ordi-nary portland cement using synchrotron X-rays,” Journal of theAmerican Ceramic Society, vol. 89, no. 9, pp. 2853–2859, 2006.
[10] E. M. Schulson, I. P. Swainson, and T. M. Holden, “Internalstress within hardened cement paste induced through thermalmismatch: calcium hydroxide versus calcium silicate hydrate,”Cement and Concrete Research, vol. 31, no. 12, pp. 1785–1791,2001.
[11] L. B. Skinner, S. R. Chae, C. J. Benmore, H. R. Wenk, and P.J. M. Monteiro, “Nanostructure of calcium silicate hydrates incements,” Physical Review Letters, vol. 104, no. 19, Article ID195502, 2010.
[12] H. F. Poulsen, J. A. Wert, J. Neuefeind, V. Honkimaki, and M.Daymond, “Measuring strain distributions in amorphousmate-rials,” Nature Materials, vol. 4, no. 1, pp. 33–36, 2005.
[13] T. Watanuki, A. MacHida, T. Ikeda et al., “Development of asingle-crystal X-ray diffraction system for hydrostatic-pressureand low-temperature structural measurement and its applica-tion to the phase study of quasicrystals,”PhilosophicalMagazine,vol. 87, no. 18-21, pp. 2905–2911, 2007.
[14] P. Juhas, T. Davis, C. L. Farrow, and S. J. L. Billinge, “PDFgetX3:a rapid and highly automatable program for processing powderdiffraction data into total scattering pair distribution functions,”Journal of Applied Crystallography, vol. 46, no. 2, pp. 560–566,2013.
[15] K. Kodama, S. Iikubo, T. Taguchi, and S.-I. Shamoto, “Finitesize effects of nanoparticles on the atomic pair distributionfunctions,” Acta Crystallographica Section A, vol. 62, no. 6, pp.444–453, 2006.
[16] D. P. Bentz, “Three-dimensional computer simulation of port-land cement hydration and microstructure development,” Jour-nal of the American Ceramic Society, vol. 80, no. 1, pp. 3–21, 1997.
[17] Z. Xu and D. Viehland, “Observation of mesostructure incalcium silicate hydrate gels of portlad cement,” Physical ReviewLetters, vol. 77, pp. 952–955, 1996.
[18] J. F. Peters, M. Muthuswamy, J. Wibowo, and A. Tordesillas,“Characterization of force chains in granular material,” PhysicalReview E, vol. 72, no. 4, Article ID 041307, 2005.

Submit your manuscripts athttp://www.hindawi.com
ScientificaHindawi Publishing Corporationhttp://www.hindawi.com Volume 2014
CorrosionInternational Journal of
Hindawi Publishing Corporationhttp://www.hindawi.com Volume 2014
Polymer ScienceInternational Journal of
Hindawi Publishing Corporationhttp://www.hindawi.com Volume 2014
Hindawi Publishing Corporationhttp://www.hindawi.com Volume 2014
CeramicsJournal of
Hindawi Publishing Corporationhttp://www.hindawi.com Volume 2014
CompositesJournal of
NanoparticlesJournal of
Hindawi Publishing Corporationhttp://www.hindawi.com Volume 2014
Hindawi Publishing Corporationhttp://www.hindawi.com Volume 2014
International Journal of
Biomaterials
Hindawi Publishing Corporationhttp://www.hindawi.com Volume 2014
NanoscienceJournal of
TextilesHindawi Publishing Corporation http://www.hindawi.com Volume 2014
Journal of
NanotechnologyHindawi Publishing Corporationhttp://www.hindawi.com Volume 2014
Journal of
CrystallographyJournal of
Hindawi Publishing Corporationhttp://www.hindawi.com Volume 2014
The Scientific World JournalHindawi Publishing Corporation http://www.hindawi.com Volume 2014
Hindawi Publishing Corporationhttp://www.hindawi.com Volume 2014
CoatingsJournal of
Advances in
Materials Science and EngineeringHindawi Publishing Corporationhttp://www.hindawi.com Volume 2014
Smart Materials Research
Hindawi Publishing Corporationhttp://www.hindawi.com Volume 2014
Hindawi Publishing Corporationhttp://www.hindawi.com Volume 2014
MetallurgyJournal of
Hindawi Publishing Corporationhttp://www.hindawi.com Volume 2014
BioMed Research International
MaterialsJournal of
Hindawi Publishing Corporationhttp://www.hindawi.com Volume 2014
Nano
materials
Hindawi Publishing Corporationhttp://www.hindawi.com Volume 2014
Journal ofNanomaterials


![DEFORMATION QUANTIZATION - Uniandes M - Draft.pdfIntroduction Since the seminal article by Bayen, Flato, Fr¿nsdal, Lichnerowicz et Stern-heimer in 1978 [7] deformation quantization](https://static.fdocuments.net/doc/165x107/5e6c183643879e66d50ec611/deformation-quantization-uniandes-m-draftpdf-introduction-since-the-seminal.jpg)