Research Article Life-Cycle Monitoring of Long-Span PSC...
15
Research Article Life-Cycle Monitoring of Long-Span PSC Box Girder Bridges through Distributed Sensor Network: Strategies, Methods, and Applications Zheheng Chen, 1 Tong Guo, 1 and Shengyou Yan 2 1 Key Laboratory of Concrete and Prestressed Concrete Structure, School of Civil Engineering, Ministry of Education, Southeast University, Nanjing 210096, China 2 Jiangsu Province Communications Planning and Design Institute, Nanjing 210005, China Correspondence should be addressed to Tong Guo; [email protected] Received 1 August 2014; Accepted 20 September 2014 Academic Editor: Ting-Hua Yi Copyright © 2015 Zheheng Chen et al. is is an open access article distributed under the Creative Commons Attribution License, which permits unrestricted use, distribution, and reproduction in any medium, provided the original work is properly cited. Structural health monitoring (SHM) has attracted much attention in recent years, which enables early warnings of structural failure, condition assessments, and rational maintenance/repair strategies. In the context of bridges, many long-span steel bridges in China have been installed with the SHM systems; however, the applications of the SHM in prestressed concrete (PSC) bridges are still rather limited. On the other hand, the PSC box girder bridges are extensively used in highway and railway systems and premature damage of these bridges is oſten reported, resulting in considerable maintenance and/or replacement costs. First, this paper presents a state-of-art review on the SHM of long-span PSC bridges. Monitoring strategies, methods, and previous applications for these bridges are summarized and discussed. In order to well capture the behavior of the bridge during its whole life and to maximize the use of sensors, a life-cycle monitoring strategy is proposed, in which the sensor layout is determined according to requirements for construction monitoring, completion test, and in-service monitoring. A case study is made on a three-span PSC box girder bridge in China. e system configuration, sensor layout, and data communications, and so forth, are presented. e up-to-date monitored structural responses are analyzed and compared with the design values. 1. Introduction Structural health monitoring (SHM) through distributed sensor network has attracted much attention in recent years [1–5], which enables early warnings of structural failure, con- dition assessments, and rational maintenance/repair strate- gies. In the context of bridges, many long-span steel bridges in China as well as in other parts of the world have been installed with the SHM systems; however, applications of the SHM in prestressed concrete (PSC) bridges are still rather limited. On the other hand, the PSC box girder bridges are extensively used in highway and railway systems, and premature damage of these bridges is oſten reported (i.e., cracks and excessive long-term deflections, etc.), resulting in considerable main- tenance and/or replacement costs. erefore, it is of great importance to develop a specific SHM system for the PSC bridges. However, as compared with long-span steel bridges, there are several significant differences in the monitoring systems of the PSC bridges. First, the long-span steel bridges usually have longer main spans and are cable-supported; as a result, they are sensitive to vibration. Moreover, higher safety margin is oſten adopted in the design of supper long-span bridges, considering the catastrophic results or tremendous losses due to collapse. Besides, these bridges usually have high construc- tion budget. For example, the Sutong Bridge [6], with a main span of 1,088 m, costs about 1,450 million USD. Accordingly, it allows a more flexible budget on the SHM system, which is only a very small part of the total cost of the bridge. erefore, a total number of 1,440 various sensors, that is, anemometers, accelerometers, strain gauges, displacement gauges, GPS, thermistors, humidity meter, clinometers, and corrosion gauges, and so forth, could be installed on the long- span steel bridges. Hindawi Publishing Corporation Shock and Vibration Volume 2015, Article ID 497159, 14 pages http://dx.doi.org/10.1155/2015/497159
Transcript of Research Article Life-Cycle Monitoring of Long-Span PSC...

Research ArticleLife-Cycle Monitoring of Long-Span PSC Box GirderBridges through Distributed Sensor Network: Strategies,Methods, and Applications
Zheheng Chen,1 Tong Guo,1 and Shengyou Yan2
1Key Laboratory of Concrete and Prestressed Concrete Structure, School of Civil Engineering, Ministry of Education,Southeast University, Nanjing 210096, China2Jiangsu Province Communications Planning and Design Institute, Nanjing 210005, China
Correspondence should be addressed to Tong Guo; [email protected]
Received 1 August 2014; Accepted 20 September 2014
Academic Editor: Ting-Hua Yi
Copyright © 2015 Zheheng Chen et al. This is an open access article distributed under the Creative Commons Attribution License,which permits unrestricted use, distribution, and reproduction in any medium, provided the original work is properly cited.
Structural healthmonitoring (SHM) has attractedmuch attention in recent years, which enables early warnings of structural failure,condition assessments, and rational maintenance/repair strategies. In the context of bridges, many long-span steel bridges in Chinahave been installed with the SHM systems; however, the applications of the SHM in prestressed concrete (PSC) bridges are stillrather limited. On the other hand, the PSC box girder bridges are extensively used in highway and railway systems and prematuredamage of these bridges is often reported, resulting in considerablemaintenance and/or replacement costs. First, this paper presentsa state-of-art review on the SHM of long-span PSC bridges. Monitoring strategies, methods, and previous applications for thesebridges are summarized and discussed. In order to well capture the behavior of the bridge during its whole life and to maximizethe use of sensors, a life-cycle monitoring strategy is proposed, in which the sensor layout is determined according to requirementsfor construction monitoring, completion test, and in-service monitoring. A case study is made on a three-span PSC box girderbridge in China. The system configuration, sensor layout, and data communications, and so forth, are presented. The up-to-datemonitored structural responses are analyzed and compared with the design values.
1. Introduction
Structural health monitoring (SHM) through distributedsensor network has attracted much attention in recent years[1–5], which enables early warnings of structural failure, con-dition assessments, and rational maintenance/repair strate-gies. In the context of bridges,many long-span steel bridges inChina aswell as in other parts of theworld have been installedwith the SHM systems; however, applications of the SHM inprestressed concrete (PSC) bridges are still rather limited. Onthe other hand, the PSC box girder bridges are extensivelyused in highway and railway systems, and premature damageof these bridges is often reported (i.e., cracks and excessivelong-term deflections, etc.), resulting in considerable main-tenance and/or replacement costs. Therefore, it is of greatimportance to develop a specific SHM system for the PSCbridges.
However, as compared with long-span steel bridges, thereare several significant differences in the monitoring systemsof the PSC bridges. First, the long-span steel bridges usuallyhave longer main spans and are cable-supported; as a result,they are sensitive to vibration.Moreover, higher safetymarginis often adopted in the design of supper long-span bridges,considering the catastrophic results or tremendous losses dueto collapse. Besides, these bridges usually have high construc-tion budget. For example, the Sutong Bridge [6], with a mainspan of 1,088m, costs about 1,450 million USD. Accordingly,it allows a more flexible budget on the SHM system, whichis only a very small part of the total cost of the bridge.Therefore, a total number of 1,440 various sensors, that is,anemometers, accelerometers, strain gauges, displacementgauges, GPS, thermistors, humidity meter, clinometers, andcorrosion gauges, and so forth, could be installed on the long-span steel bridges.
Hindawi Publishing CorporationShock and VibrationVolume 2015, Article ID 497159, 14 pageshttp://dx.doi.org/10.1155/2015/497159

2 Shock and Vibration
As to the PSC bridges, they are usually shorter in spans(i.e., ranging from 50m to 250m). Larger structural stiffnessmakes them much less sensitive to vibration. However,some time-dependent behaviors, including shrinkage andcreep of concrete and stress relaxation of steel tendons,are important features of the PSC bridges, which result inthe loss in prestress of tendons and increase in deflection.Besides, temperature gradient has a significant influence onthe behavior of the PSC bridges. However, due to the limit onthe construction budget and difficulties in monitoring, onlya limited number of items could be monitored.
This paper reports the recent investigation on the SHMsystems of long-span (i.e., with themain span of 100 to 300m)PSC bridges, and discussion is made on the monitoringstrategies, methods, and existing applications. A life-cyclemonitoring strategy is proposed, which covers the construc-tion stage, completion test, and the service stage, so as tobetter capture the behavior of the bridge during its wholelife and to maximize the use of sensors. A case study inChina is provided to further demonstrate the feasibility of theproposed system.
2. Monitoring Strategies,Methods, and Applications
2.1. Monitoring Strategies. A brief summary of the moni-toring items of PSC bridges all over the world in recentyears [4–21] is provided in Table 1, where it is observedthat the monitoring items vary due to different investigationpurposes, bridge types, and budgets, and so forth. Forexample, according to the visual inspection on the FerribyRoad Bridge [12], a three-span skew reinforced concreteslab bridge, several defects were noted which may requiremaintenance in the future. Therefore, inclinometers wereused on elastomeric bearings, and displacement transducerswere installed across cracks on the soffit of the slab, whichprovide basis for the maintenance activities. After the famouscollapse accident of the old I35W Bridge, the new I35WBridge [7] was built, which consists of two prestressedconcrete box girders in each traffic direction. To monitor thebehavior of the new bridge, a large number of sensors wereinstalled, including vibrating-wire strain gauges, thermistors,linear potentiometers, accelerometers, corrosion sensors,long-gauge fiber, and topography instruments, which mon-itor the local static strain, temperature, joint and bearingsmovements, vibrations, corrosion current, average strains,and global deformations, respectively. These sensors providegood data base for the study of long-term performance ofthe PSC bridges, such as creep, shrinkage, prestress loss,and long-term deflections. In 2008, the Federal HighwayAdministration (FHWA) launched the Long-Term BridgePerformance (LTBP) program [8], which intended to collectscientific-quality data from the Nation’s highway bridgesthrough aminimum20-year research effort. In theUtah State,several pilot bridges were selected, and sensors includingvelocity transducers, foil strain gauges, vibrating wire straingauges, tilt meters, thermocouples, weather station, andtraffic camera were installed. According to Table 1, deflectionand temperature are the twomost frequentmonitoring items,
followed by the strain, acceleration, and so forth. Althoughcracks, corrosion, and prestress loss are also important to PSCbridges, they are difficult to bemonitored.Therefore, they arenot frequently adopted as monitoring items. In general, themonitoring strategies should be determined according to themonitoring purpose, budget, and the feasibility ofmonitoringtechnologies. However, deflection and temperature are twobasic monitoring items and should be included.
In addition to the in-service monitoring, monitoring andcontrol on the construction stage and completion tests arealso frequently conducted for large bridges, which providevaluable information of the bridges in various stages. How-ever, in real practice, the monitoring in construction stage,completion tests, and service stage are usually separatelyconductedwithout sharing of sensors and information,whichis waste of construction investment. On the other hand, thesensors used for construction monitoring and control maybe well used in the subsequent stages (i.e., completion testand in-service monitoring). Monitored data (i.e., deflection,stress, etc.) in the construction stage and completion testsdescribe the initial status of the in-service monitoring. Theloads in the completion tests are known so that the resultsof completion tests can be used to determine the majorstructural parameters and update the baseline finite element(FE) model, providing basis for health monitoring anddamage identification in the service stage. Therefore, a life-cycle monitoring strategy is proposed, as shown in Figure 1,in which it is required that the monitoring in constructionstage, completion tests, and service stage should be combinedto minimize the monitoring costs and maximize the datautilization. In Figure 1, sharing of sensors, data, and conditionparameters are illustrated through red, blue, and green lines,respectively.
2.2. Monitoring Methods. As shown in Table 1, deflection isone important monitoring item. Periodical measurement onthe bridge through topography is an acceptable choice, but itis not continuous and costly. In the new I35W Bridge, long-gauge fiber optic sensors were used to measure the straindistribution and thus to obtain the average curvature anddeformed shape. However, this method requires the fibersto be adhered to the soffit of the girder, which is somewhatdifficult in practice. Breakage of fibers and the long-termdurability are also concerns of such a method.
On the Jiangjin Yangtze River Highway Bridge with amain span of 240m, laser video deflection measurementsystem (LVDMS) was used to monitor the long-term deflec-tion [20]. As deflection at the measuring point occurs, thelight spots projected to the projection target move in theopposite direction; see Figure 2(a). The spots shot by thecamera can thus be digitalized and be input to the computerto calculate the displacement relative to the fixed point.However, when there are a number of measuring points,multiple laser transmitters must be installed at multiple fixedpoints of the bridge while it is usually difficult to find somany appropriate installation positions in practice. Similarapplication was made on the Alwen Bridge [21], where thenoncontact Weighted-Stretched-Wire System (NWSWS) wasadopted for deflection monitoring. As shown in Figure 2(b),

Shock and Vibration 3
Table 1: Summary of monitoring items on PSC bridges.
Bridge nameMonitoring Items
Strain Deflectionor rotation
Supportdisplacement
Accelerationor velocity Corrosion Crack Prestress
lossTrafficcamera Temperature Weather
stationFerriby RoadBridge (UK) √ √
PI-57 Bridge(France) √ √
Lezıria Bridge(Portugal) √ √ √ √
401 SouthboundBridge (USA) √ √ √ √ √
California PilotBridge (USA) √ √ √ √ √
Utah Pilot Bridge(USA) √ √ √ √ √ √
Kishwaukee Bridge(USA) √ √ √ √
New I35W Bridge(USA) √ √ √ √ √ √
KamikazueViaduct (USA) √
A curved bridge(USA) √ √ √
West StreetOn-ramp Bridge(USA)
√
North HalawaValley Viaduct(USA)
√ √
Zhaoqing XijiangBridge (China) √ √
ChongqingShibanpo Bridge(China)
√ √ √
Xushuigou Bridge(China) √ √ √
Jiangjin YangtzeRiver HighwayBridge (China)
√ √ √ √
Anwen Bridge(China) √ √
Monitored items intotal 9 12 4 7 1 2 2 2 12 1
the camera fixed on the bridge moves as deflection occurs, sothat the projection of the stretched-wire changes correspond-ingly. The deflection can thus be obtained by recording andanalyzing such movements. Due to that the elevations of thesoffits at midspan and piers of long-span PSC bridges varyconsiderably, installation and maintenance of such systemsmay be difficult.
On the Jinghang Canal Bridge, as to be presented indetail, a vertical displacement transducer (DT) was adoptedto measure the long-term deflection of bridge, based ona hydrostatic leveling system and the application of thecommunicating vessels principle to an internal hydraulic
system, filled with antifreeze fluid, which is installed alongthe bridge and reaches the relevant points where the relativevertical displacement is going to be measured. As shownin Figures 2(c) and 2(d), this hydraulic system, in hydro-static equilibrium, allows the monitoring of the structure’sdeformed shape through themeasuring of the apparent liquidlevel height at given points and comparing it with referencepoints where the vertical displacement can be neglected. Toavoid the evaporation of the fluid, silicon oil was placedon its surface. The resolution and measurement precisionare 0.01mm and 0.1mm, respectively. Similar displacementmonitoring system has been used on the Lezıria Bridge [9].

4 Shock and Vibration
FE analysis ofconstruction
process
Design ofconstruction
control
Collection and processing of offline data
Constructioncontrol
Initial shape
Initial stresses
Collection and collationof basic data
Ambienttemperature
Environmenthumidity
Forward analysisLayout of
displacement andstrain sensorsBackward analysis
Layout oftemperaturesensors, etc.
Constructionmonitoringand control
Controlledload test
FE simulationanalysis
Design of loadtest
Layout ofsensors
Loadcases
EnvironmentalexcitationStatic load Dynamic
excitation
Driving test Bump testBrake test
Design ofstatic load
Design ofdynamic load
Displacement sensors
Acceleration sensor
Other sensors
Collection and processingof offline (online) data
Assessment of bridgestate and performance
Visual inspection andassessment
Stiffness assessment
Strength and bearingcapacity assessment
Dynamic characteristicsassessment
Modelupdating
Long-termmonitoring
Baselinefinite
elementmodel
Sensor layoutfor service
stage
Systemintegration and
debugging
Collectionand
processing ofonline data
Datamanagementand storage
Integration ofdisplacementmonitoring
points
Integration ofstrain and
temperaturemonitoring points
Integration ofweighing
system
Integration ofvideo monitoring
system, etc.Integration of
hardware system
Integration ofsoftware system
Early warningsystem
Remote real-time displayand control
Video warning
Strain warningManual
inspection
Design ofsensor layout
Determination of initialstate upon completion
Condition assessmentand residual
life prediction
Damageidentification
Maintenanceand repair
Strength and elasticmodulus, etc.
Deflection warning
Figure 1: Life-cycle monitoring of PSC bridges.
As to themonitoring of prestress loss,most existing appli-cations are for the external tendons. The most commonlyused method to measure the posttensioning tendon stressis by attaching strain gages to the strands that form thetendons. However, this method is not applicable when theepoxy-coated strands are used for tendons. For the unbondedtendons, load cell at the ends of anchorage is also an efficientway tomonitor the forces. On the US 401 Southbound Bridge[10], which utilized prestressed high performance concrete(HPC) girders, load cells were adopted at the anchorage endsto measure the time-dependent tendon forces; however, theforces at certain points of the tendon cannot be measuredusing this method. In recent years, the elastomagnetic (EM)sensing has been developed as a nondestructive testingtechnology, which is based on the elastomagnetic effect offerromagnetic materials. Subject to external forces, strains orstresses develop in the ferromagnetic material, resulting inthe change in magnetic permeability. Thus, the variation intendon forces can be measured through the measurement onmagnetic permeability, as shown in Figure 3. The beneficialfeatures of the EM sensors include (1) noncontact measure-ment so that the influence on the structure is minimized; (2)rapid response, desirable precision, and reliability; (3) long-term and long-distance monitoring, and (4) monitoring onbonded tendons at multiple cross sections. Pilot study was
made on the Kishwaukee River Bridge [11] (with unbondedtendons) and some bridges in China (with bonded tendons).
Monitoring on cracks is also an important measureto know the evolution of such defects on bridges. Twolinear potentiometric displacement transducers (LPDTs) areusually used for such measurements. One of the LPDTs isplaced across a crack on the deck soffit and the other is placedacross an uncracked region of concrete for temperaturecompensation [12]. However, this method is only applicableto existing cracks, and only one point could be measured.Recently developed optical fiber based technologies, however,bring possibility to the distributed monitoring by placing thefibers along the concerned area. Existingmethods include theBOTDR, the BOTDA (or the PPP-BOTDA), and the long-gauge FBG sensors. Higher resolution and better durabilityare required for these methods to be applied in real monitor-ing projects rather than laboratory tests and pilot studies.
Considering that themonitoring of PSC bridges is usuallysubjected to limited budget, an efficient data collecting andtransportation way is required. In this regard, wireless net-work is more appealing than traditional wire-basedmethods,as shown in Figure 4. However, the amount of data is alsolimited. Therefore, data are usually collected and sent ina static or quasistatic way with a relatively low frequency,ranging from 1/60Hz to 1/600Hz. In addition, there is not

Shock and Vibration 5
Computer
Digital cameraLight filtering material
Laser emitter
Imaging target
(a) The LVDMS
Laser emitter
Digital camera
Stretched Wire
Light spot
Projection screen
Fixed pulleyLight
Heavy weight
Computer
Data cable
Fixed bolt
(b) The NWSWS
Displacementtransducer
Buoy
Reference point (fixed)Connected pipe
Measurement point
Anti-freeze fluid(with silicon oilon its surface)
(c) Schematic representation of the hydrostatic leveling system (d) Field installation
Figure 2: Several deflection monitoring systems.
Tendon
Temperature sensor Primary coil
Secondary coil
(a) Schematic representation of the EM sensor (b) Field installation
Figure 3: Prestress monitoring using EM sensors.
usually a specific monitoring room near these bridges forpower supply. Batteries or solar panels are often used instead.However, it is also a good choice to utilize the power from theroad lighting system.
Other monitoring items, such as strain, temperature,acceleration, support displacements and corrosion, have beenextensively applied and therefore are not repeated here.
3. Case Study
3.1. Bridge under Investigation. The Jinghang Canal Bridge(JCB) is a three-span PSC bridge in Suzhou, China. It has onemain span of 150m and two side spans of 85m, respectively,
Data loggerSIM card
and mobile netservice
Telecommunications
Monitoring roomNetwork
Solar panel or road lighting systemDeflection
transducer
EM sensor
Temperaturesensor
Othersensors
Figure 4: Configuration of the monitoring system using wirelessnetwork.

6 Shock and Vibration
Z1
Z1
A0
A0
(a) Photograph of the bridge at completion280
500 × 300
27002700
730073003600
600
50032003600 500 3200
5003200500 3200
3300
320
R600
1500 × 320
(b) Z1 section
730073003600
900
90028003600 900 2800
9002800900 2800
9000
600
280
2.00%
200
R800
500 × 300
27002700
(c) A0 cross section
Segment No. 0
1 2 3 4 5 6 7 8 9 10 11 12 13 14 15 16 17 18
Inspection passage
123456789101112131415161718
Closure segmentClosure segment
Piers
Piers
(d) Serial number of segments
Figure 5: Profile and cross sections of the Jinghang Canal Bridge (dimensions in mm).
as shown in Figures 5(a), 5(b), and 5(c).The bridge consists oftwo separated single-cell box girders in two traffic directions.The top slab of the girder has a total width of 14.6m andthe length of its cantilever is 3.6m. The width of the bottomflange is 7.4m and its thickness varies from 90 cm at thesupports to 32 cm at the midspan. The height of box girderranges from 9.0m at the supports to 3.3m at the midspan.The web thickness ranges in steps from 90 cm at the supportsto 50 cm at the midspan. The main structure was completedon October 29, 2013 and the pavement construction wasadded by December 15, 2013. The bridge was open to trafficin January, 2014. Figure 5(d) shows the arrangement of thebox girder and the Table 2 shows the detailed constructionprocess of the bridge.
According to the monitoring strategy depicted in Sec-tion 2, the sensor layout for the monitoring in construction,completion test, and service stages is determined, as shownin Figure 6. In the construction stage, the stresses, andelevations are the emphasis. The construction process ofsuperstructure, as listed in Table 2, lasted for about 237 days.As shown in Figure 6, the across sections with relatively largelongitudinal stresses were selected for monitoring, where
sections A1 to A4 are at the end of the segment number0, sections B1 and B2 are at the middle of the side spans,and sections Z1, Z2, and Z3 are at the midspan and 1/4span of the main span, respectively. During the completiontests, the stresses sensors for construction monitoring wereused, and acceleration sensors were installed to measure thedynamic responses. As to the long-term monitoring, theitems include the temperature, strain of reinforcement, anddeflections, as shown in Figure 6. In order to minimize thecost of the system, long-termmonitoring of temperature andstrains utilized some sensors embedded in the bridge forconstruction monitoring. These sensors are vibrating stringgauges with built-in temperature couples, so that strain andtemperature can bemeasured at the same time.The data werecollected automatically through the JMBV-8A acquisitionmodule, as shown in Figure 7, and each module has eightchannels. The data were collected with a 10min interval, thatis, a sampling rate of 1/600Hz.
The long-termdeflectionmonitoring used the hydrostaticleveling system, as shown in Figures 2(c), 2(d), and 7(b). Sixcross sections were selected for monitoring, including themidspan and 1/4 span of the main span and the side span,

Shock and Vibration 7
B1
B1
Z1
A1Z2
A1A2
Z2
Z1
Z3
A4
Z3
A3A4
B2
B2
A3
Section Z1
Section C1 Sections B1 and B2
Sections A1 to A4Sections Z2 and Z3
A2
C1
C1
DTStrain gauge for short and long-term monitoringStrain gauge for construction stage and load test Monitored cross-section
Acceleration sensor for load tests
Temperature sensor for long-term monitoring
Elevation monitoring points during construction
Figure 6: Configuration of the monitoring system.
(a) JMZX-215 strain gauge
Temperaturesensor
DT
(b) Temperature and deflec-tion sensors
Wireless data acquisition module
Storage battery
Signal lightning protection
Switch
Socket
Integrated acquisition module
(c) Data logger
Figure 7: Sensors for long-term monitoring.
and two reference cross sections at the piers of main span andside span. Considering the longitudinal slope of this bridgeis high (4%), it is not possible to place all the six measuringpoints at the same elevation. Therefore, two separate systemswere adopted. Measuring points at the midspan and 1/4 spanof the main span and its support are of the same elevation,while points at the midspan and 1/4 span of the side span andits support are of the same elevation. Each DT was installedon the inner surface of the web of the box girder, as shown inFigure 6. All the measuring points, however, were collectedin series through one power cable and one signal cable, andthey are finally collected to the bus interface module. All thedata were finally sent to themonitoring room at the SoutheastUniversity hundreds kilometers away from the bridge site ina wireless way, as shown in Figure 4. The power of the SHMsystem is supplied by the road lighting system.The total SHM
system is very cheap as compared with those on the long-span steel bridges. Not including the sensors for constructionmonitoring, the total cost is only about 30 thousand USdollars.
3.2. Monitoring in the Construction Stage. According toFigures 8(a) and 8(b), the monitored stresses agree with thedesign values. The largest difference between the stresses inthe top plates at the upstream side and the design valuesis 2.23MPa, which occurred when the segment number 14was cast, while the largest difference at the downstreamside is 2.05MPa, which occurred as the segment number7 was cast. The largest differences between the stresses atthe bottom plates and the design values are 1.92MPa and2.06MPa, respectively, which occurred during the closureof bridge at midspan. After the completion of main girder,

8 Shock and Vibration
10 20 30 40 50 60
0St
ress
(MPa
)
Construction stage
Measured, section A2, downstream side Measured, section A3, downstream side Measured, section A2, upstream side Measured, section A3, upstream side Design
−12
−16
−8
−4
(a) Top plates, segment number 0
10 20 30 40 50 60
0
Stre
ss (M
Pa)
Construction stage
Measured, section A2, downstream side Measured, section A3, downstream side Measured, section A2, upstream side Measured, section A3, upstream side Design
−12
−8
−4
(b) Bottom plates, segment number 0
30 35 40 45 50 55 60 65
0
Stre
ss (M
Pa)
Construction stage
Measured, section Z2, downstream side Measured, section Z3, downstream side Measured, section Z2, upstream side Measured, section Z3, upstream side Design
−12
−8
−4
(c) Top plates, at 1/4 span of main span
30 35 40 45 50 55 60 65
0St
ress
(MPa
)
Construction stage
Measured, section Z2, downstream side Measured, section Z3, downstream side Measured, section Z2, upstream side Measured, section Z3, upstream sideDesign
−8
−4
(d) Bottom plates, at midspan of main span
35 40 45 50 55 60 65
0
Stre
ss (M
Pa)
Construction stage
Measured, section B1, downstream side Measured, section B2, downstream side Measured, section B1, upstream side Measured, section B2, upstream side Design
−10
−6
−8
−4
−2
(e) Top plates, at midspan of side span
35 40 45 50 55 60 65
0
Stre
ss (M
Pa)
Construction stage
Measured, section B1, downstream side Measured, section B2, downstream side Measured, section B1, upstream side Measured, section B2, upstream side Design
−8
−4
(f) Bottom plates, at midspan of side span
Figure 8: Stresses in various construction stages.

Shock and Vibration 9
Table 2: Construction process of superstructure of the Jinghang Canal Bridge.
Construction stage Construction contents Duration (day) Cumulatedtime (day)
1 Concrete casting of segment number 0 11 112 Jacking of tendons in segment number 0 1 12
3 Temporary consolidation and installation of hangingbaskets 3 15
4 Concrete casting of segment number 1 7 225 Jacking of tendons in segment number 1 1 236 Moving forward of hanging baskets 1 247 Concrete casting of segment number 2 7 318 Jacking of tendons in segment number 2 1 329 Moving forward of hanging baskets 1 3310 Concrete casting of segment number 3 7 4011 Jacking of tendons in segment number 3 1 4112 to 54 Concrete casting of segments number 4 to number 17 12 per segment 16055 Concrete casting of segment number 18 7 16756 Jacking of tendons in segment number 18 1 168
57 Concrete casting of straight segments in both side spansusing brackets 1 170
58 Converting hanging baskets into hoisting baskets inside spans 2 172
59 Counterweight of water tank in both side spans andcentral span, and installation of stiff steel framework. 1 173
60 Casting of closure segments in side spans and removalof counterweight 7 180
61 Jacking of closure tendons in side spans 3 183
62 Removal of brackets in side spans and temporaryconsolidation 4 187
63 Converting hanging baskets into hoisting baskets inmain spans 2 191
64 Concrete casting of closure segment in main span andremoval of counterweight 7 198
65 Jacking of closure tendons in central span 3 201
66 Removal of hoisting baskets in both side and mainspans 1 202
67 Construction of bridge deck pavement 35 237
the cross sections have relatively large compressive stresses,which provide desirable conditions for the bridge service.
Figures 8(c) and 8(d) show the monitored stresses at the1/4 spans of the main span. The largest differences betweenmonitored stress and design values are 1.77MPa and 1.98MPafor top plates at upstream and downstream sides, respectively,which both occurred as the tendons in segment number17 were jacked. The stress differences in bottom plates atthe upstream and downstream sides are within 1MPa. Ingeneral, the top plates have larger compressive stresses thanthe bottom plates.
As to the midspan cross section of the side spans, thecomparison between monitored data and calculation is illus-trated in Figures 8(e) and 8(f). The largest differences of thestress in the top plates at the upstream and downstream sidesare 1.24MPa and 1.14MPa, which occurred at the jacking of
tendons in segment number 15 and the closure of the bridge,respectively. For the bottom plates, the largest differences are1.15MPa and 1.44MPa, respectively, which both occurred atthe closure of the bridge.
The alignment control of the bridge is an important jobwhich is conducted by controlling the elevations of segmentsdynamically during the construction process. As shown inFigure 6, there are threemonitoring points at the top and bot-tom plates, respectively, to monitor the deflections, and twomonitoring points at two slabs to control the torsion duringthe construction. For each segment, elevation monitoring isconducted during the installation of form work, before andafter concrete casting, before and after jacking of tendons.Through error analysis, the elevation of the next segment isdetermined. Figure 9 shows the differences in monitored anddesign elevations upon closure of the bridge, where the largest

10 Shock and Vibration
Table 3: Description of load cases.
Load test Truck positions Illustration
Case 1 Nine trucks, symmetrically loaded at the side span in 2lines and 3 rows Piers at
side span
41.85m
Case 2Nine trucks, loaded near the middle of main span in 2lines and 3 rows; another truck, loaded in theemergency vehicle lane
Piers atmain span
62.75m
Case 3 Nine trucks, loaded near the 1/4 of main span in 2 linesand 3 rows Piers at
main span
36m
Case 4 Nine trucks, loaded at the midspan of main span in 2lines and 3 rows Piers at
main span
75m
Table 4: Stress analysis of test results (upstream).
Load test Monitoredsection Position Total stress
(MPa)Elastic stress
(MPa)
Theoreticalstress(MPa)
Residualstress(MPa)
Checkcoefficient
Relative residualstress (%)
Case 1 B1 Top flange −1.00 −0.96 −1.90 −0.04 0.51 4.26Bottom flange 1.64 1.5 2.60 0.14 0.58 8.53
Case 2 A1 Top flange 0.22 0.2 1.40 0.02 0.14 7.42Bottom flange −1.21 −1.08 −1.50 −0.13 0.72 10.40
Case 3 Z1 Top flange −0.56 −0.48 −0.90 −0.08 0.53 14.65Bottom flange 0.67 0.62 1.10 0.05 0.56 7.51
Case 4 Z2 Top flange −2.93 −2.76 −2.90 −0.17 0.95 5.79Bottom flange 3.20 3.09 4.60 0.11 0.67 3.41
0 50 100 150 200 250 300
0204060
Main span Side spanSide span
Diff
eren
ce (m
m)
Distance from the left end of the bridge (m)
Downstream side Upstream side
−20
Figure 9: Differences between monitored and design elevations.
difference is 28mm, which is within themaximum permittederror of L/5000 (i.e., 30mm) [22].
3.3. Monitoring in the Completion Tests. The completion testswere conducted on January 14th, 2014, in which both staticload tests and dynamic tests were made. In the static tests,there were four load cases, as shown in Table 3, where nine orten trucks, each with a weight of 350 kN, were adopted. Thefront axle weight and the two rear axle weights of the trucks
are 70 kN and 140 kN, respectively; and the axle spacing is350 cm and 135 cm, respectively.
Taking the test results of the upstream girder as examples,the stress and deflection responses are illustrated in Tables 4and 5, respectively. Both the check coefficients [22] of stressand deflection are all less than 1, indicating that the structurehas required bearing capacity and the vertical stiffness. Inaddition, the relative residual strain and deformation afterunloading are less than 20%, indicating that the box girderhas desirable restoring ability subjected to the test loads, andthe structure basically behaved linear elastically during thetests.
Dynamic load test used the typical pulse method [23];that is, through collecting microvibration of bridge caused byambient excitation, the dynamic characteristics of structure,such as vibration frequency, vibration mode, and dampingratio, are obtained. The layout of acceleration sensors isillustrated in Figure 6. Figure 10 shows two typical vibrationmodes with the corresponding frequencies of 1.11 Hz and1.58Hz, respectively, which are, however, slightly larger thanthe design values (i.e., 1.02Hz and 1.37Hz), indicating that theactual stiffness is larger than expected so that the analyticalmodel should be updated accordingly.

Shock and Vibration 11
Table 5: Deflection analysis of test results (upstream side).
Load test Monitoredsection
Totaldeflection(mm)
Elasticdeflection(mm)
Theoreticaldeflection(mm)
Residualdeflection(mm)
Checkcoefficient
Relative residualdeformation (%)
Case 1 B1 −16.75 −15.34 −21.7 −1.41 0.71 8.42Case 3 Z1 −18.41 −15.86 −18.4 −2.55 0.86 13.85Case 4 Z2 −45.63 −42.13 −58.5 −3.50 0.72 7.67
Table 6: Measured DAFs in different tests.
Test Speed Amplitude(mm)
Static deflection(mm)
Impact factorMeasured value Design value
Running10 km/h 0.054 1.001
1.05
30 km/h 0.108 1.01650 km/h 0.143 1.021
Braking10 km/h 0.117 6.7 1.01730 km/h 0.095 1.01450 km/h 0.165 1.025
Jumping 30 km/h 0.460 —
0 50 100 150 200 250 300
0.000.250.500.75
Valu
e
Distance to the south bound (mm)
1st symmetrical vertical bending 2nd antisymmetrical vertical bending
−0.50−0.25
Figure 10: Typical tested bending modes.
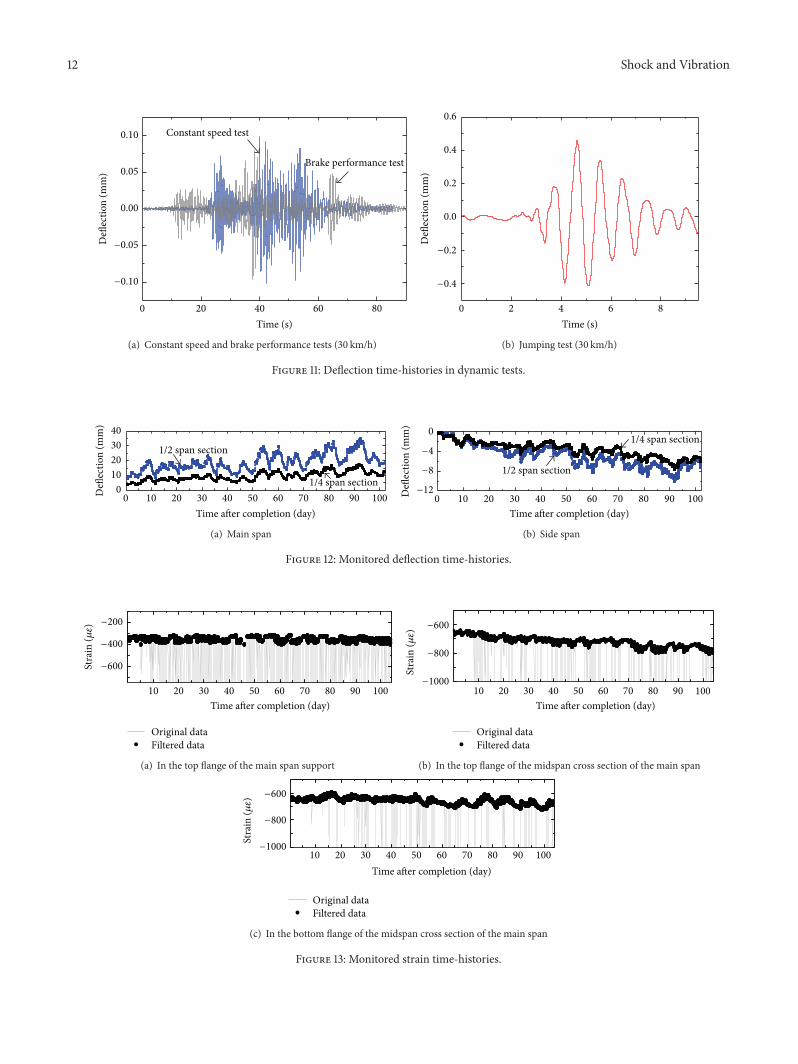
The dynamic amplification factor (DAF) is anotherimportant parameter in bridge design, which was testedunder different test circumstances. First, a truckwith aweightof 350 kN runs across the bridge at various constant speeds,and the deflection time-history at the midspan was recorded,as shown in Figure 11(a), in which the truck runs at a speedof 30 km/h. In the brake performance test, the same truckran at the same speed but braked at the midspan. Accordingto Figure 11(a), the deflection time-history is similar to thatof the running test. Table 6 further shows that the DAFs inrunning tests are basically the same with the braking tests,and they changed little with the increase of vehicle speed.Themaximum value of impact factor is 1.04, which was in thejumping condition, as shown in Figure 11(b). However, it isstill less than the design value of 1.05. In general, the dynamicdeflection under vehicle moving deflection is small, showingthe desirable dynamic deflection performance.
3.4. Monitoring during the Service Stage. Up to May, 2014,the SHM system of the bridge has been working for morethan four and a half months. Figure 12 illustrates the time-dependent deflections at different measuring points after thepavements were constructed. Note that the pavements wereadded to the decks about 1.5 months after the completion of
the main structure. It is observed that from Figure 12(a) thatthe deflection fluctuates within a day [24], which is mainlydue to the temperature changes in the day and night. Besides,the deflection in general becomes larger as time goes by,which is mainly due to shrinkage and creep of concrete. Thedeflections ofmidspan cross section of themain span increaseby 15.10mm and 26.73mm, 3 month and 6 month after thecompletion of construction, respectively. On the midspanand 1/4 cross sections of side span, as shown in Figure 12(b),the chambers are observed to increase with time, though theyare much less than the deflections in Figure 12(a) because theside spans are significantly shorter than the main span.
Figure 13 illustrates the strain time-histories of the rein-forcements at different locations of the bridge. Due to theelectromagnetic noise (i.e., the noise inherent in typicaldata acquisition), there are a number of abnormal signals;however, when these data are filtered, the time-dependentchanges could still be observed. According to Figure 13, thereare still some daily fluctuations in strain data at all locations,which is probably due to the change in ambient temperature.For the reinforcing bar in the top flange of the main spansupport, as shown in Figure 13(a), the strain increment isinsignificant indicating that concrete shrinkage or creep is notsignificant in this region, which is possibly due to the largereinforcement ratio and the stress condition at the bridgesupport. However, there is a mild increase in strain of thereinforcing bar in top flange of midspan section of the mainspan, as shown in Figure 13(b), showing that the creep effectmight bemore significant in this region. In general, due to theshort monitoring period, the strain increments are not largeat all monitoring points [25].
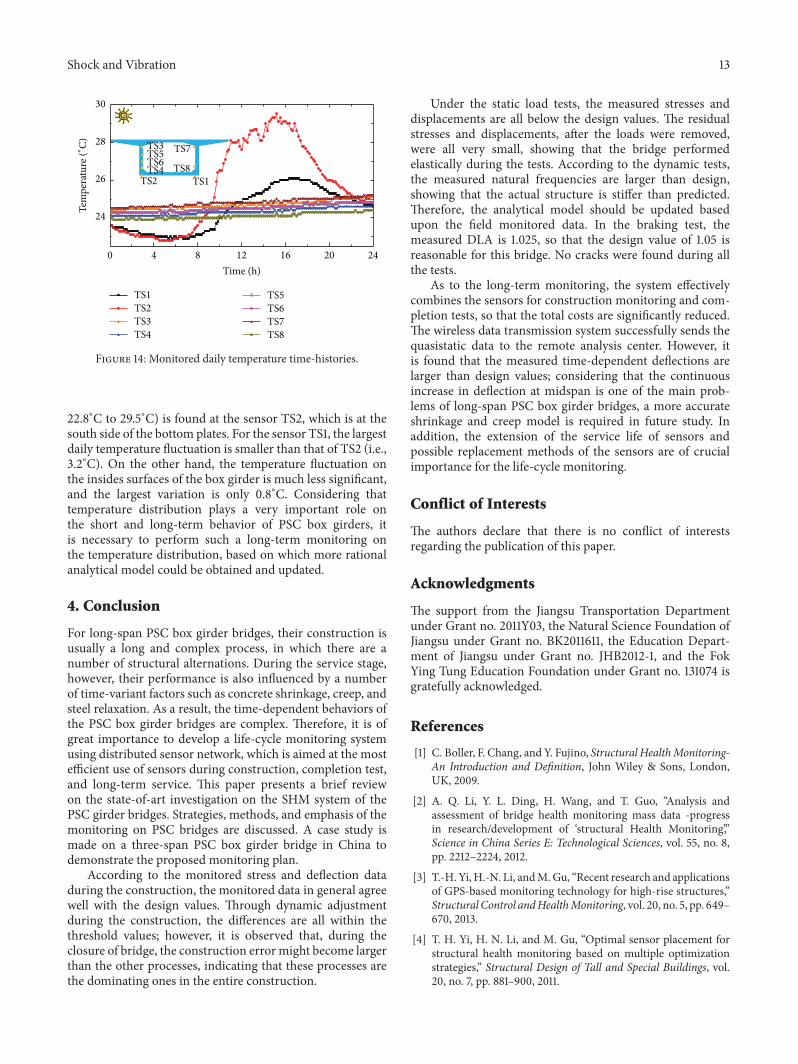
Shown in Figure 14 are the monitored temperature time-histories on June 29th, 2014, where the S-shape curvesare observed and the temperatures also vary at differentlocations. The largest daily temperature fluctuation (from
12 Shock and Vibration
0 20 40 60 80
0.00
0.05
0.10
Brake performance test
Defl
ectio
n (m
m)
Time (s)
Constant speed test
−0.10
−0.05
(a) Constant speed and brake performance tests (30 km/h)
0 2 4 6 8
0.0
0.2
0.4
0.6
Defl
ectio
n (m
m)
Time (s)
−0.4
−0.2
(b) Jumping test (30 km/h)
Figure 11: Deflection time-histories in dynamic tests.
10090807060504030201000
10203040
1/4 span section
Defl
ectio
n (m
m)
Time after completion (day)
1/2 span section
(a) Main span
−12
−8
−4
1009080706050403020100
01/4 span section
Defl
ectio
n (m
m)
Time after completion (day)
1/2 span section
(b) Side span
Figure 12: Monitored deflection time-histories.
Time after completion (day)
Original data Filtered data
100908070605040302010
−600
−400
−200
Stra
in (𝜇
𝜀)
(a) In the top flange of the main span support
Time after completion (day)
Original data Filtered data
100908070605040302010−1000
−800
−600
Stra
in (𝜇
𝜀)
(b) In the top flange of the midspan cross section of the main span
Time after completion (day)
Original data Filtered data
100908070605040302010−1000
−800
−600
Stra
in (𝜇
𝜀)
(c) In the bottom flange of the midspan cross section of the main span
Figure 13: Monitored strain time-histories.
Shock and Vibration 13
0 4 8 12 16 20 24
24
26
28
30
Time (h)
TS1 TS2 TS3 TS4
TS5 TS6 TS7 TS8
TS1TS2
TS3
TS4TS5TS6
TS7
TS8
Tem
pera
ture
(∘C)
Figure 14: Monitored daily temperature time-histories.
22.8∘C to 29.5∘C) is found at the sensor TS2, which is at thesouth side of the bottom plates. For the sensor TS1, the largestdaily temperature fluctuation is smaller than that of TS2 (i.e.,3.2∘C). On the other hand, the temperature fluctuation onthe insides surfaces of the box girder is much less significant,and the largest variation is only 0.8∘C. Considering thattemperature distribution plays a very important role onthe short and long-term behavior of PSC box girders, itis necessary to perform such a long-term monitoring onthe temperature distribution, based on which more rationalanalytical model could be obtained and updated.
4. Conclusion
For long-span PSC box girder bridges, their construction isusually a long and complex process, in which there are anumber of structural alternations. During the service stage,however, their performance is also influenced by a numberof time-variant factors such as concrete shrinkage, creep, andsteel relaxation. As a result, the time-dependent behaviors ofthe PSC box girder bridges are complex. Therefore, it is ofgreat importance to develop a life-cycle monitoring systemusing distributed sensor network, which is aimed at the mostefficient use of sensors during construction, completion test,and long-term service. This paper presents a brief reviewon the state-of-art investigation on the SHM system of thePSC girder bridges. Strategies, methods, and emphasis of themonitoring on PSC bridges are discussed. A case study ismade on a three-span PSC box girder bridge in China todemonstrate the proposed monitoring plan.
According to the monitored stress and deflection dataduring the construction, the monitored data in general agreewell with the design values. Through dynamic adjustmentduring the construction, the differences are all within thethreshold values; however, it is observed that, during theclosure of bridge, the construction error might become largerthan the other processes, indicating that these processes arethe dominating ones in the entire construction.
Under the static load tests, the measured stresses anddisplacements are all below the design values. The residualstresses and displacements, after the loads were removed,were all very small, showing that the bridge performedelastically during the tests. According to the dynamic tests,the measured natural frequencies are larger than design,showing that the actual structure is stiffer than predicted.Therefore, the analytical model should be updated basedupon the field monitored data. In the braking test, themeasured DLA is 1.025, so that the design value of 1.05 isreasonable for this bridge. No cracks were found during allthe tests.
As to the long-term monitoring, the system effectivelycombines the sensors for construction monitoring and com-pletion tests, so that the total costs are significantly reduced.The wireless data transmission system successfully sends thequasistatic data to the remote analysis center. However, itis found that the measured time-dependent deflections arelarger than design values; considering that the continuousincrease in deflection at midspan is one of the main prob-lems of long-span PSC box girder bridges, a more accurateshrinkage and creep model is required in future study. Inaddition, the extension of the service life of sensors andpossible replacement methods of the sensors are of crucialimportance for the life-cycle monitoring.
Conflict of Interests
The authors declare that there is no conflict of interestsregarding the publication of this paper.
Acknowledgments
The support from the Jiangsu Transportation Departmentunder Grant no. 2011Y03, the Natural Science Foundation ofJiangsu under Grant no. BK2011611, the Education Depart-ment of Jiangsu under Grant no. JHB2012-1, and the FokYing Tung Education Foundation under Grant no. 131074 isgratefully acknowledged.
References
[1] C. Boller, F. Chang, and Y. Fujino, Structural HealthMonitoring-An Introduction and Definition, John Wiley & Sons, London,UK, 2009.
[2] A. Q. Li, Y. L. Ding, H. Wang, and T. Guo, “Analysis andassessment of bridge health monitoring mass data -progressin research/development of ‘structural Health Monitoring’,”Science in China Series E: Technological Sciences, vol. 55, no. 8,pp. 2212–2224, 2012.
[3] T.-H. Yi, H.-N. Li, andM.Gu, “Recent research and applicationsof GPS-based monitoring technology for high-rise structures,”Structural Control andHealthMonitoring, vol. 20, no. 5, pp. 649–670, 2013.
[4] T. H. Yi, H. N. Li, and M. Gu, “Optimal sensor placement forstructural health monitoring based on multiple optimizationstrategies,” Structural Design of Tall and Special Buildings, vol.20, no. 7, pp. 881–900, 2011.

14 Shock and Vibration
[5] T.-H. Yi, H.-N. Li, and M. Gu, “Experimental assessment ofhigh-rate GPS receivers for deformation monitoring of bridge,”Measurement, vol. 46, no. 1, pp. 420–432, 2013.
[6] J. F. Liu and Q. W. Zhang, “Dynamic characteristics ofa thousands-meter scale cable-stayed bridge,” in Sensorsand Smart Structures Technologies for Civil, Mechanical, andAerospace Systems, vol. 7647 of Proceedings of SPIE, April 2010.
[7] D. Inaudi, “Long-term static structural health monitoring,” inProceedings of the Structures Congress, pp. 566–577, Orlando,Fla, USA, May 2010.
[8] S. M. Petroff, M. W. Halling, and P. J. Barr, “Monitoring oflong term bridge performance (LTBP) program bridges,” inProceedings of the Structures Congress, pp. 65–76, 2011.
[9] C. Rodrigues, C. Felix, A. Lage, and J. Figueiras, “Developmentof a long-termmonitoring systembased onFBG sensors appliedto concrete bridges,” Engineering Structures, vol. 32, no. 8, pp.1993–2002, 2010.
[10] H. M. Dwairi, M. C. Wagner, M. J. Kowalsky, and P. Zia,“Behavior of instrumented prestressed high performance con-crete bridge girders,” Construction and Building Materials, vol.24, no. 11, pp. 2294–2311, 2010.
[11] M. L. Wang, “Long term health monitoring of post-tensioningbox girder bridges,” Smart Structures and Systems, vol. 4, no. 6,pp. 711–726, 2008.
[12] N. A. Hoult, P. R. A. Fidler, P. G. Hill, and C. R. Middleton,“Long-term wireless structural health monitoring of the ferribyroad bridge,” Journal of Bridge Engineering, vol. 15, no. 2, pp. 153–159, 2010.
[13] A. Cury, C. Cremona, and J. Dumoulin, “Long-term monitor-ing of a PSC box girder bridge: operational modal analysis,data normalization and structural modification assessment,”Mechanical Systems and Signal Processing, vol. 33, pp. 13–37,2012.
[14] H. Sousa, J. Bento, and J. Figueiras, “Construction assessmentand long-term prediction of prestressed concrete bridges basedon monitoring data,” Engineering Structures, vol. 52, pp. 26–37,2013.
[15] H. C. Gomez, P. J. Fanning,M. Q. Feng, and S. Lee, “Testing andlong-term monitoring of a curved concrete box girder bridge,”Engineering Structures, vol. 33, no. 10, pp. 2861–2869, 2011.
[16] W. Chung, S. Kim, N.-S. Kim, and H.-U. Lee, “Deflectionestimation of a full scale prestressed concrete girder using long-gauge fiber optic sensors,” Construction and Building Materials,vol. 22, no. 3, pp. 394–401, 2008.
[17] I. N. Robertson, “Prediction of vertical deflections for a long-span prestressed concrete bridge structure,” Engineering Struc-tures, vol. 27, no. 12, pp. 1820–1827, 2005.
[18] Y. H. Li, Performance Analysis and Evolution of ContinuousRigid Frame Bridge Based on Long-Term Health Monitoring,South China University Technology, Guangzhou, China, 2012(Chinese).
[19] G. Liu, Condition Assessment Research to Large-Span BridgesBased on Long-Term Static Monitoring Data, College of CivilEngineering of Chongqing University, Chongqing, China, 2010(Chinese).
[20] Y. B. Huang, Study on practical health monitoring systemand safety evaluation standard of long-span continuous rigid-frame bridge [M.S. thesis], Chongqing Jiaotong University,Chongqing, China, 2012, (Chinese).
[21] Z. L. Lan, J. T. Zhou, and Z. X. Zhou, “Research of onlinemonitoring system of box girder bridge deflections,” Journal ofChongqing Jiaotong University, vol. 27, no. 4, pp. 525–528, 2008.
[22] The Ministry of Communications of the People’s Republic ofChina, Quality Inspection and Evaluation Standard of HighwayEngineering, China Communications Press, Beijing, China,2004.
[23] W.-X. Ren, X.-L. Peng, and Y.-Q. Lin, “Experimental andanalytical studies on dynamic characteristics of a large spancable-stayed bridge,” Engineering Structures, vol. 27, no. 4, pp.535–548, 2005.
[24] L. Sun, X. W. Hao, and D. L. Tan, “Health monitoring andassessment system design for large span continuous rigid framebridges,” Journal of Guangxi University, vol. 35, no. 4, pp. 621–626, 2010.
[25] J. Wang and Z. Fang, “Analysis and field measurement ofconcrete box girder bridges for shrinkage and creep effects,”China Civil Engineering Journal, vol. 41, no. 1, pp. 70–81, 2008.

International Journal of
AerospaceEngineeringHindawi Publishing Corporationhttp://www.hindawi.com Volume 2014
RoboticsJournal of
Hindawi Publishing Corporationhttp://www.hindawi.com Volume 2014
Hindawi Publishing Corporationhttp://www.hindawi.com Volume 2014
Active and Passive Electronic Components
Control Scienceand Engineering
Journal of
Hindawi Publishing Corporationhttp://www.hindawi.com Volume 2014
International Journal of
RotatingMachinery
Hindawi Publishing Corporationhttp://www.hindawi.com Volume 2014
Hindawi Publishing Corporation http://www.hindawi.com
Journal ofEngineeringVolume 2014
Submit your manuscripts athttp://www.hindawi.com
VLSI Design
Hindawi Publishing Corporationhttp://www.hindawi.com Volume 2014
Hindawi Publishing Corporationhttp://www.hindawi.com Volume 2014
Shock and Vibration
Hindawi Publishing Corporationhttp://www.hindawi.com Volume 2014
Civil EngineeringAdvances in
Acoustics and VibrationAdvances in
Hindawi Publishing Corporationhttp://www.hindawi.com Volume 2014
Hindawi Publishing Corporationhttp://www.hindawi.com Volume 2014
Electrical and Computer Engineering
Journal of
Advances inOptoElectronics
Hindawi Publishing Corporation http://www.hindawi.com
Volume 2014
The Scientific World JournalHindawi Publishing Corporation http://www.hindawi.com Volume 2014
SensorsJournal of
Hindawi Publishing Corporationhttp://www.hindawi.com Volume 2014
Modelling & Simulation in EngineeringHindawi Publishing Corporation http://www.hindawi.com Volume 2014
Hindawi Publishing Corporationhttp://www.hindawi.com Volume 2014
Chemical EngineeringInternational Journal of Antennas and
Propagation
International Journal of
Hindawi Publishing Corporationhttp://www.hindawi.com Volume 2014
Hindawi Publishing Corporationhttp://www.hindawi.com Volume 2014
Navigation and Observation
International Journal of
Hindawi Publishing Corporationhttp://www.hindawi.com Volume 2014
DistributedSensor Networks
International Journal of