
Research Article - JESTR
8
Journal of Engineering Science and Technology Review 12 (2) (2019) 119 - 126 Research Article Effect of Residual Chlorine on Copper Pipes in Drinking Water Systems F. García-Ávila 1,* , L. Flores del Pino 2 , G. Bonifaz-Barba 1 , C. Zhindón-Arévalo 3 , L. Ramos-Fernández 4 , D. García-Altamirano 5 , S. Vázquez-García 6 and C. Sánchez- Alvarracín 1 1 Facultad de Ciencias Químicas, Universidad de Cuenca, Ecuador 2 Departamento Académico de Química, Facultad de Ciencias, Universidad Nacional Agraria La Molina, Perú 3 Unidad Académica de Salud y Bienestar, Universidad Católica de Cuenca, Sede Azogues, Ecuador 4 Departamento Académico de Recursos Hídricos, Universidad Nacional Agraria La Molina, Perú 5 Departamento de Control de Calidad, UCEM, Ecuador 6 Dirección de Recursos Hídricos, SENAGUA, Ecuador Received 5 February 2019; Accepted 13 April 2019 ___________________________________________________________________________________________ Abstract Copper pipes corrosion that transport potable water can deteriorate water quality within a distribution system, releasing high copper amounts, exceeding the maximum concentration copper for potable water standards. This study examines the influence of free chlorine on the leaching of copper in the pipes used for the distribution of drinking water. A series of tests was carried out using corrosion test coupons extractable constructed of copper material. The coupons were installed in units containing filtered water (without chlorine, 0 mg/L) and water treated with an average residual chlorine concentration of 0.85 mg/L in the water treatment plant in Azogues city, Ecuador. A corrosion test rack was also installed in a house with an average residual chlorine concentration of 0.37 mg/L. Coupons in these sites were exposed in duplicate for one, two, three and six months. The corrosion coupons were then extracted and weighed to establish the corrosion rate by gravimetric technique. Additional tests were performed in static immersion laboratory tests using drinking water with chlorine concentrations ranging from 0.25 to 5 mg/L for one month. The weight loss tests indicated that an increase in free chlorine concentration, the greater release of copper and therefore a higher corrosion rate. Keywords: Coupon tests; Corrosion; Disinfectant; Pipelines; Water quality. ____________________________________________________________________________________________ 1. Introduction The drinking water quality can be affected during its distribution, due to various factors, such as the erosion of the material with which the pipes are built, the sediments accumulation, the biofilms formation [1, 2]. For many years, research has been carried out to reduce or mitigate these problems that affect water quality [2]. Researchers have focused on the variables that favour or inhibit the distribution system deterioration and its direct relationship with the pipe material wear [1, 3, 4]. Corrosive processes in new (newly installed) and old metal pipes with several years of operation have been reported by numerous studies on water supply worldwide [5, 6]. The characteristics of the tap water can vary depending on the conditions of the pipes through which it flows [7]. Water quality distributed in the buildings is governed by disinfection treatments, which includes the chlorine addition, which allows the presence of residual chlorine [8]. Chlorine is widely used for its strong oxidizing action as a disinfectant to inactivate microbial contaminants in water purification processes [9, 10]. Water supply systems aim to maintain at least a minimum level of residual chlorine, in order to prevent a possible microbial regrowth and the spread of waterborne diseases [11]. However, the presence of disinfectant excessive levels can cause negative effects to the consumers health and be an important factor that accelerates the pipes corrosion [12, 13, 14]. Nowadays copper is widely used for various uses, among them for the pipes manufacture to transport drinking water [15, 16] due to its excellent properties, such as thermal and electrical conductivity, good resistance to corrosion and antimicrobial activity, as well as their formability [17, 18, 19]. However, Atlas et al. (1982) [20] showed that free chlorine is the main cause for copper pipes corrosion in chlorinated domestic water supplies. Poor water quality, caused by the high chlorine content and low pH level, causes accelerated pitting corrosion in copper pipes that induce a chemical attack that forms cuprite, sulphates and chlorides scales [21]. Corrosion caused by poor water quality or high levels of residual chlorine produces a decrease in the strength of the pipe structure and consequently a subsequent failure [22]. Copper corrosion caused by water chemistry results in the release of copper into drinking water [23]. High levels of dissolved oxygen in the water contribute to the corrosion pits increase in the pipes [24]. Chemical deficiency of water can cause the release of certain heavy metals (for example, Pb, As, Cu, Fe, Mn) putting the health of consumers at risk [9, 10, 25] Development of passivation or solid phase immobilization on the surfaces of copper pipes, depends mainly on the water chemistry [2, 26]. The formation of JOURNAL OF Engineering Science and Technology Review www.jestr.org Jestr ______________ *E-mail address: [email protected] ISSN: 1791-2377 © 2019 Eastern Macedonia and Thrace Institute of Technology. All rights reserved. doi:10.25103/jestr.122.17
Transcript of Research Article - JESTR

Journal of Engineering Science and Technology Review 12 (2) (2019) 119 - 126
Research Article
Effect of Residual Chlorine on Copper Pipes in Drinking Water Systems
F. García-Ávila1,*, L. Flores del Pino2, G. Bonifaz-Barba1, C. Zhindón-Arévalo3, L. Ramos-Fernández4, D. García-Altamirano5, S. Vázquez-García6 and C. Sánchez- Alvarracín1
1Facultad de Ciencias Químicas, Universidad de Cuenca, Ecuador
2 Departamento Académico de Química, Facultad de Ciencias, Universidad Nacional Agraria La Molina, Perú
3 Unidad Académica de Salud y Bienestar, Universidad Católica de Cuenca, Sede Azogues, Ecuador 4 Departamento Académico de Recursos Hídricos, Universidad Nacional Agraria La Molina, Perú
5 Departamento de Control de Calidad, UCEM, Ecuador
6 Dirección de Recursos Hídricos, SENAGUA, Ecuador
Received 5 February 2019; Accepted 13 April 2019
___________________________________________________________________________________________ Abstract
Copper pipes corrosion that transport potable water can deteriorate water quality within a distribution system, releasing high copper amounts, exceeding the maximum concentration copper for potable water standards. This study examines the influence of free chlorine on the leaching of copper in the pipes used for the distribution of drinking water. A series of tests was carried out using corrosion test coupons extractable constructed of copper material. The coupons were installed in units containing filtered water (without chlorine, 0 mg/L) and water treated with an average residual chlorine concentration of 0.85 mg/L in the water treatment plant in Azogues city, Ecuador. A corrosion test rack was also installed in a house with an average residual chlorine concentration of 0.37 mg/L. Coupons in these sites were exposed in duplicate for one, two, three and six months. The corrosion coupons were then extracted and weighed to establish the corrosion rate by gravimetric technique. Additional tests were performed in static immersion laboratory tests using drinking water with chlorine concentrations ranging from 0.25 to 5 mg/L for one month. The weight loss tests indicated that an increase in free chlorine concentration, the greater release of copper and therefore a higher corrosion rate. Keywords: Coupon tests; Corrosion; Disinfectant; Pipelines; Water quality. ____________________________________________________________________________________________
1. Introduction The drinking water quality can be affected during its distribution, due to various factors, such as the erosion of the material with which the pipes are built, the sediments accumulation, the biofilms formation [1, 2]. For many years, research has been carried out to reduce or mitigate these problems that affect water quality [2]. Researchers have focused on the variables that favour or inhibit the distribution system deterioration and its direct relationship with the pipe material wear [1, 3, 4]. Corrosive processes in new (newly installed) and old metal pipes with several years of operation have been reported by numerous studies on water supply worldwide [5, 6]. The characteristics of the tap water can vary depending on the conditions of the pipes through which it flows [7]. Water quality distributed in the buildings is governed by disinfection treatments, which includes the chlorine addition, which allows the presence of residual chlorine [8]. Chlorine is widely used for its strong oxidizing action as a disinfectant to inactivate microbial contaminants in water purification processes [9, 10]. Water supply systems aim to maintain at least a minimum level of residual chlorine, in order to prevent a possible microbial regrowth and the spread of waterborne diseases [11].
However, the presence of disinfectant excessive levels can cause negative effects to the consumers health and be an important factor that accelerates the pipes corrosion [12, 13, 14]. Nowadays copper is widely used for various uses, among them for the pipes manufacture to transport drinking water [15, 16] due to its excellent properties, such as thermal and electrical conductivity, good resistance to corrosion and antimicrobial activity, as well as their formability [17, 18, 19]. However, Atlas et al. (1982) [20] showed that free chlorine is the main cause for copper pipes corrosion in chlorinated domestic water supplies. Poor water quality, caused by the high chlorine content and low pH level, causes accelerated pitting corrosion in copper pipes that induce a chemical attack that forms cuprite, sulphates and chlorides scales [21]. Corrosion caused by poor water quality or high levels of residual chlorine produces a decrease in the strength of the pipe structure and consequently a subsequent failure [22]. Copper corrosion caused by water chemistry results in the release of copper into drinking water [23]. High levels of dissolved oxygen in the water contribute to the corrosion pits increase in the pipes [24]. Chemical deficiency of water can cause the release of certain heavy metals (for example, Pb, As, Cu, Fe, Mn) putting the health of consumers at risk [9, 10, 25] Development of passivation or solid phase immobilization on the surfaces of copper pipes, depends mainly on the water chemistry [2, 26]. The formation of
JOURNAL OF Engineering Science and Technology Review
www.jestr.org
Jestr
______________ *E-mail address: [email protected] ISSN: 1791-2377 © 2019 Eastern Macedonia and Thrace Institute of Technology. All rights reserved. doi:10.25103/jestr.122.17

F. García-Ávila, L. Flores del Pino, G. Bonifaz-Barba, C. Zhindón-Arévalo, L. Ramos-Fernández, D. García-Altamirano, S. Vázquez-García and C. Sánchez- Alvarracín/Journal of Engineering Science and Technology Review 12 (2) (2019) 119 - 126
120
copper oxide (I) layer on the surface of the tube is important to cope with the pipe corrosion in hot synthetic water, due the copper is less soluble at elevated temperatures [27, 28]. Corrosion that occurs in the pipes that transport potable water can cause adverse effects on water quality and serious failures in the infrastructure of the supply network [29]. The 'superchlorination' can corrode the new metallic pipes rapidly, causing a high copper release in the water and a rapid reduction of the residual chlorine levels [30]. The considerable costs associated with water losses and eliminating faults have prompted research into corrosion processes and causes [31]. Coupons provide a viable technique to determine the corrosion rate caused by water in supply networks without affecting the system integrity [32]. Coupons can be installed directly into distribution system for a specific time to later evaluate the corrosion rate related to a metal under study; this technique allows to obtain a good level of corrosion estimation, at the same time it allows to visualize metal morphology [33, 34]. When coupons are used, the corrosion rate is evaluated by determining the mass loss per unit area of the coupon, once it has been left installed in the water supply line for a fixed time [35]. It is suggested that the minimum duration of any corrosion test study is six months, this will allow development corrosion scales [36]. Slavickova et al. (2013) [37] found that using corrosion coupons to monitor corrosive processes during the treatment and supply of drinking water allowed optimal water conditions and residual chlorine levels adequate to be established, so that measures can be taken to stop the corrosive process [38]. The tests to evaluate the corrosion rate using coupons, is a simple technique quite used, has its principle in the accurate measurement of the mass decrease of the metal coupons of interest [39, 40]. These tests can be carried out by installing coupons on a corrosion test rack (dynamic immersion) or a laboratory (static immersion); after a certain time, the mass loss provides data to establish the corrosion rate of metal. The corrosion rate can be expressed in English units as mils per year (mpy) or SI units as millimeters per year (mm/y). There are several standards for such tests, but the most used methods are those recommended by ASTM (2003) [41]. The exposure times most commonly used in this type of tests is one, two or three months [42], whereas Finsgar (2013) [43], Galik et al. (2015) [34] and Fateh et al. (2017) [38] suggest that the exposure time of the coupons into water should be six months. During the first hours or days of metal exposure to water, the corrosion rate is very high, with the passage of
time, this corrosion decreases until the metal surface acquires passivation [44]. The aggressiveness of the water in Azogues, Ecuador was defined using the Langelier, Ryznar Puckorius indexes [45, 46]. In the calculation of these indices, other parameters that can also influence the corrosive processes were not included. This work aims to investigate the influence of residual chlorine concentration in the copper pipe corrosion mechanisms that transport drinking water in the homes of Azogues. 2. Materials and methods 2.1 Study area description Three corrosion tests were performed: (i) coupon addition at the water treatment plant administered by the Municipal Company EMAPAL in Azogues, Republic of Ecuador, located at 2°44'22’ S, 78°50'54’ W. (ii) a corrosion test rack implementation in a house, to determine the corrosion of copper caused by water with a lower chlorine concentration than that presented in the treatment plant. (iii) static immersion in stagnant water at the EMAPAL treatment plant laboratory, with different concentrations of chlorine. The free chlorine concentration was in the treatment plant (filtration 0 mg/L and storage tanks 0.85 mg/L); in the house (corrosion test rack 0.37 mg/L). The water used for all the trials was the same drinking water that is distributed in the Azogues city, whose physicochemical characteristics were presented by [45]. 2.2 Preparation of corrosion coupons, corrosion coupon holder and corrosion test rack The corrosion surface coupons were prepared in accordance with ASTM G1-03 and NACE TM 0169-2000 (33). Copper coupons of 8-cm length, 1.2-cm width, 1-mm thickness and containing a 5-mm diameter hole for support, as shown in Fig. 1a. The coupon holder (Fig. 1b, Fig. 1c) was made from 1.25 cm diameter semi-crystalline polyamide materials and was 7.62 cm long to hold the coupon installed on the corrosion test rack. The corrosion test rack was used for the aforementioned test ii. The copper coupon was fastened by means of a nut and screws made of Grilon to avoid galvanic effects (ASTM, 2012) [47]. The corrosion test rack was made of PVC piping with horizontal sections of 40 cm and a vertical section of 10 cm (Fig. 1d). The test rack was installed directly to the distribution system in the house so the use of water was constant (Eisnor y Gagnon, 2003) [36].
Fig. 1. (a) copper coupon, (b) coupon holder, (c) coupon holder with coupon, and (d) corrosion test racks
F. García-Ávila, L. Flores del Pino, G. Bonifaz-Barba, C. Zhindón-Arévalo, L. Ramos-Fernández, D. García-Altamirano, S. Vázquez-García and C. Sánchez- Alvarracín/Journal of Engineering Science and Technology Review 12 (2) (2019) 119 - 126
121
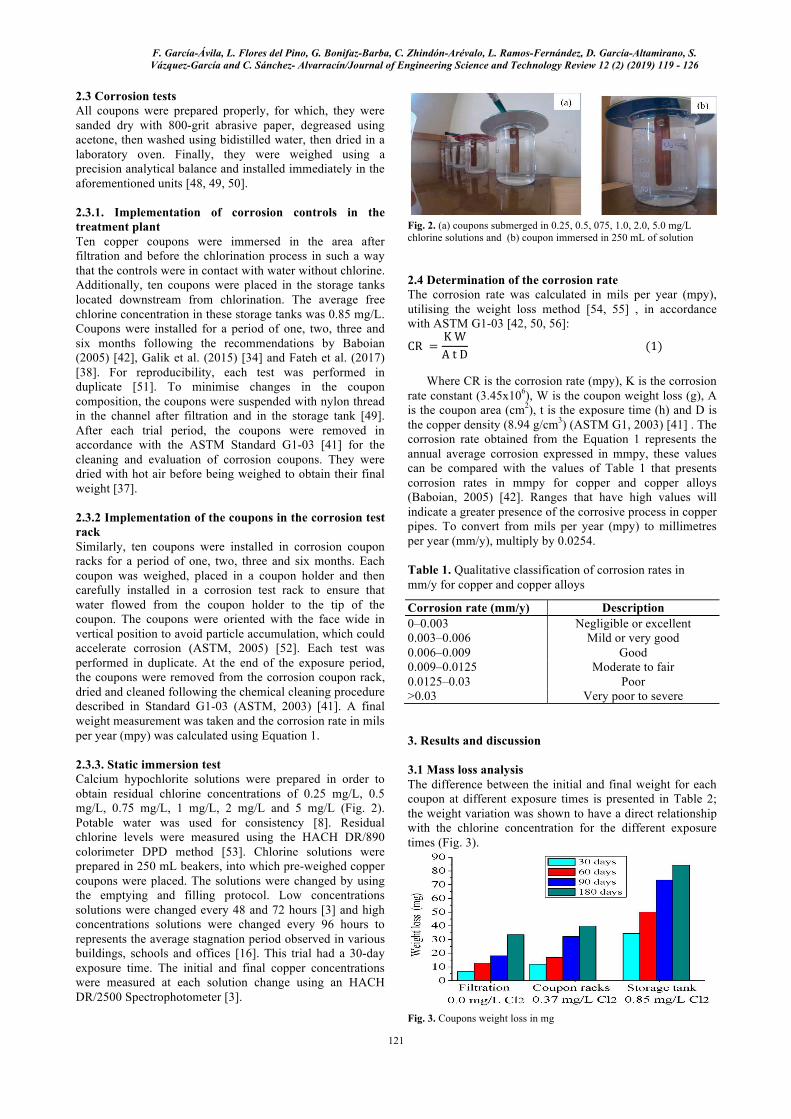
2.3 Corrosion tests All coupons were prepared properly, for which, they were sanded dry with 800-grit abrasive paper, degreased using acetone, then washed using bidistilled water, then dried in a laboratory oven. Finally, they were weighed using a precision analytical balance and installed immediately in the aforementioned units [48, 49, 50]. 2.3.1. Implementation of corrosion controls in the treatment plant Ten copper coupons were immersed in the area after filtration and before the chlorination process in such a way that the controls were in contact with water without chlorine. Additionally, ten coupons were placed in the storage tanks located downstream from chlorination. The average free chlorine concentration in these storage tanks was 0.85 mg/L. Coupons were installed for a period of one, two, three and six months following the recommendations by Baboian (2005) [42], Galik et al. (2015) [34] and Fateh et al. (2017) [38]. For reproducibility, each test was performed in duplicate [51]. To minimise changes in the coupon composition, the coupons were suspended with nylon thread in the channel after filtration and in the storage tank [49]. After each trial period, the coupons were removed in accordance with the ASTM Standard G1-03 [41] for the cleaning and evaluation of corrosion coupons. They were dried with hot air before being weighed to obtain their final weight [37]. 2.3.2 Implementation of the coupons in the corrosion test rack Similarly, ten coupons were installed in corrosion coupon racks for a period of one, two, three and six months. Each coupon was weighed, placed in a coupon holder and then carefully installed in a corrosion test rack to ensure that water flowed from the coupon holder to the tip of the coupon. The coupons were oriented with the face wide in vertical position to avoid particle accumulation, which could accelerate corrosion (ASTM, 2005) [52]. Each test was performed in duplicate. At the end of the exposure period, the coupons were removed from the corrosion coupon rack, dried and cleaned following the chemical cleaning procedure described in Standard G1-03 (ASTM, 2003) [41]. A final weight measurement was taken and the corrosion rate in mils per year (mpy) was calculated using Equation 1. 2.3.3. Static immersion test Calcium hypochlorite solutions were prepared in order to obtain residual chlorine concentrations of 0.25 mg/L, 0.5 mg/L, 0.75 mg/L, 1 mg/L, 2 mg/L and 5 mg/L (Fig. 2). Potable water was used for consistency [8]. Residual chlorine levels were measured using the HACH DR/890 colorimeter DPD method [53]. Chlorine solutions were prepared in 250 mL beakers, into which pre-weighed copper coupons were placed. The solutions were changed by using the emptying and filling protocol. Low concentrations solutions were changed every 48 and 72 hours [3] and high concentrations solutions were changed every 96 hours to represents the average stagnation period observed in various buildings, schools and offices [16]. This trial had a 30-day exposure time. The initial and final copper concentrations were measured at each solution change using an HACH DR/2500 Spectrophotometer [3].
Fig. 2. (a) coupons submerged in 0.25, 0.5, 075, 1.0, 2.0, 5.0 mg/L chlorine solutions and (b) coupon immersed in 250 mL of solution 2.4 Determination of the corrosion rate The corrosion rate was calculated in mils per year (mpy), utilising the weight loss method [54, 55] , in accordance with ASTM G1-03 [42, 50, 56]:
CR =K WA t D (1)
Where CR is the corrosion rate (mpy), K is the corrosion rate constant (3.45x10⁶), W is the coupon weight loss (g), A is the coupon area (cm2), t is the exposure time (h) and D is the copper density (8.94 g/cm3) (ASTM G1, 2003) [41] . The corrosion rate obtained from the Equation 1 represents the annual average corrosion expressed in mmpy, these values can be compared with the values of Table 1 that presents corrosion rates in mmpy for copper and copper alloys (Baboian, 2005) [42]. Ranges that have high values will indicate a greater presence of the corrosive process in copper pipes. To convert from mils per year (mpy) to millimetres per year (mm/y), multiply by 0.0254. Table 1. Qualitative classification of corrosion rates in mm/y for copper and copper alloys
Corrosion rate (mm/y) Description 0–0.003 Negligible or excellent 0.003–0.006 Mild or very good 0.006–0.009 Good 0.009–0.0125 Moderate to fair 0.0125–0.03 Poor >0.03 Very poor to severe 3. Results and discussion 3.1 Mass loss analysis The difference between the initial and final weight for each coupon at different exposure times is presented in Table 2; the weight variation was shown to have a direct relationship with the chlorine concentration for the different exposure times (Fig. 3).
Fig. 3. Coupons weight loss in mg

F. García-Ávila, L. Flores del Pino, G. Bonifaz-Barba, C. Zhindón-Arévalo, L. Ramos-Fernández, D. García-Altamirano, S. Vázquez-García and C. Sánchez- Alvarracín/Journal of Engineering Science and Technology Review 12 (2) (2019) 119 - 126
122
Coupons tended to lose more weight when placed in water with higher chlorine concentrations. An analysis of
variance was carried out using the F test (α= 0.05). The Fcalculate was much higher than the Ftable value so the null hypothesis is rejected; thus, the weight loss is greater in the coupons exposed to higher residual chlorine levels.
Table 2. Coupon weight loss in mg/L on the concentration of residual chlorine and exposure time Site Cl2 residual (mg/L) 30 days 60 days 90 days 180 days Filtration 0 6 .80 12.9 18.25 33.60 Corrosion test racks 0.37 12.00 16.9 32.10 39.95 Storage tank 0.85 34.65 50.1 73.30 84.30 These results are consistent with those obtained by other authors. Higher concentrations of free chlorine have been shown to produce greater copper dissolution, especially at low pH [20]. Copper by-product release was higher in buildings with high levels of Cl2 [57]. Furthermore, high chlorine concentrations were shown to correlate with an increase in the release of copper by-products [3].
3.2 Effect of chlorine on the corrosion rate The effect of chlorine on the corrosion rate was studied by weight loss method in the range of 0.25 to 5 mg/L Cl2 in static immersion tests and in the range from 0.0 to 0.85 mg/L Cl2 in dynamic tests with continuous flow of water. The corrosion rate for each exposition period, calculated via Equation 1 using the weight loss of the coupons, is presented in Table 3.
Table 3. Corrosion rate in mpy depending on the concentration of chlorine and exposure time Site Cl2
(mg/L) 30 days 60 days 90 days 180 days
Filtration (WDTP) 0 0.17 0.16 0.15 0.14 Corrosion coupon racks (domicile) 0.37 0.30 0.21 0.27 0.17 Storage tank 0.85 0.88 0.63 0.62 0.36 As shown in Fig. 4, the corrosion rate for each exposure time was minimal at 0 mg/L of chlorine in water; in the storage tank, which has a Cl2 concentration of 0.85 mg/L, the corrosion rate was higher. Thus, an increased chlorine concentration leads to an increase in the rate of corrosion. Additionally, the copper coupons experienced a higher corrosion rate in the first 30 days of exposure for all chlorine concentrations. As the exposure time increased, the corrosion rate decreased. Therefore, at a steady Cl2 concentration, the corrosion rate decreases as the exposure time increases. The coupons were placed in the coupon racks from the month of April, removing the coupons in July corresponding to the 90 days. According to García et al. (2018) [46] in the month of July decreases the levels of certain parameters such as pH, alkalinity, hardness, which increases corrosion. Therefore, the increase in corrosion rate at 90 days compared to 60 days is due to the water quality conditions mentioned above [46]. Additionally, it should be mentioned that the concentration of residual chlorine in the domicile was an average value (0.37 mg/L), presenting Cl2 values slightly above average during the third month of the trial. The decrease in the corrosion rate in the storage tank after 180 days may be due to the passivation occurring, forming a protective surface layer, presenting resistance to corrosion. The weight loss in the coupon at 180 days compared to 90 days is not very large, which used in equation 1 and with a double time of contact of the metal with water, a small corrosion rate is obtained. Performance of an F test (a = 0.05) analysis of variance revealed that the Fcalculated was much higher than the Ftable value and the p value obtained was < 0.05. Thus, increased free chlorine concentration in water increased the corrosion rate in the copper coupons. These results are consistent with those obtained by other authors, including [8, 21, 58, 59]. Baboian (2005) [42] found that corrosion rates of copper and copper-based alloys above 0.013 mm/y (0.5 mpy) is unsafe.
Thus, the pipes studied here were not subject to an excessive corrosion rate. However, during their first year of operation, new pipes can be affected if they are exposed to a residual chlorine concentration close to 0.8 mg/L, in this case, the houses next to the distribution tanks.
Fig. 4. Copper corrosion rate versus free chlorine concentration The corrosion rate variation over time is shown in Fig. 5. At chlorine concentrations of 0 and 0.37 mg/L, the corrosion rate remained nearly constant after 180 days of exposure. As the exposure time increased, the corrosion rate became more constant; this can be attributed to the formation of a protective film on the material surface, giving rise to metal passivation. The passivation process has been related to the formation of a copper (I) oxide layer (Cu2O, cuprite) and another layer of copper (II) oxide (CuO, tenorite) [24, 30]. In spite of this, the corrosion continues, possibly because the formed film is non-adherent and conductive, allowing the passage of electrons.

F. García-Ávila, L. Flores del Pino, G. Bonifaz-Barba, C. Zhindón-Arévalo, L. Ramos-Fernández, D. García-Altamirano, S. Vázquez-García and C. Sánchez- Alvarracín/Journal of Engineering Science and Technology Review 12 (2) (2019) 119 - 126
123
Fig. 5. Copper corrosion rate versus exposure time 3.3 Copper release The initial and final copper concentrations in the water are shown in Table 4. By-product release was more dependent on the chlorine concentration than on the exposure time as shown in Fig. 5. Table 4. Variation of Cu dissolved for each Cl2 concentration Concentration Cl2 (mg/l)
Average initial Cu (µg/l)
Average final Cu (µg/l)
0.25 34.39 182.71 0.50 42.08 185.09 0.75 46.79 190.03 1.0 31.06 208.99 2.0 36.85 301.36 5.0 49.29 331.91
For chlorine concentrations between 0.25 to 5 mg/L in water, a considerable variation in the dissolved copper concentration occurred (Fig. 6). At chlorine concentrations of 2 mg/L and 5 mg/L, a greater copper release was generated. Chlorine concentrations between 0.3 to 0.7 mg/L are commonly found in the drinking water distribution network [45]; at this range, the copper concentration released is in the range of 180 to 220 µg/L, which is within the dissolved copper limits recommended by WHO (2004) [60].
Fig. 6. Copper corrosion rate versus residual chlorine concentration 3.4 Cumulative copper changes Copper release trends were compared by summing the amount of copper (mg Cu/L) released during the entire exposure time (Fig. 7).
Fig. 7. Impact of residual chlorine on the cumulative concentration of copper released during the static immersion test.
At a chlorine concentration of 5 mg/L, 2.31 mg Cu/L was released into water after 30 days. The increase in the cumulative copper release was rapid and almost linear throughout the trial. At lower chlorine concentrations, between 0.25 and 0.75 mg/L, a lower amount of copper was released. 3.5 Surface analysis of copper coupons Samples aged with calcium hypochlorite concentrations of 1, 2 and 5 mg/L showed greater pitting corrosion after 30 days of exposure, while samples aged with 0.25, 0.5 and 0.75 mg/L showed less pitting corrosion, wells are observed on the exposed surface (Fig. 8). As mentioned by Castillo Montes et al. (2014) [8], an incubation period in the residual chlorine presence is needed to detect pitting corrosion in the copper pipe. A visual examination showed holes and discoloration in the coupons at the end of the tests. Fig. 9 shows the copper metallography at different immersion times (a) under filtration (b) in a storage tank and (c) in corrosion test racks. Fig. 9 (a) shows a change in the coloration in certain areas of the coupons; this may be due to corrosion by the chlorine. An uneven layer of tenorite was observed on the surface of the pipes exposed to filtered water without chlorine. Signs of pitting corrosion were observed. At 180 days, the surface of the copper was coated with a relatively uniform light blue layer. Fig. 9 (b) shows a dark coloration, typical of a copper oxide such as Cu2O [16]. The impact of chlorine on the surface is evident. Coupons exposed to the higher chlorine concentration in the storage tanks contained deeper cracks in those in corrosion test racks did. At a chlorine concentration of 0.37 mg/L, a dark brown layer was observed that covered the plate (Fig. 9b). This thin layer can be copper oxide (tenorite), which is related to the process of passivation of the corrosive process. In Fig. 9 (c), the copper coupons were covered with brown corrosion products. After 180 days of exposure to a chlorine concentration of 0.85 mg/L, localised degradation in the form of circular pits were observed. The surface of the coupons was covered with brown corrosion products and a few shallow and wide wells were observed at 90 and 180 days. Green corrosion products were visible at the bottom of the wells. Calcium hypochlorite may also influence copper deterioration, as previously suggested by Castillo Montes et al. (2014) [8].

F. García-Ávila, L. Flores del Pino, G. Bonifaz-Barba, C. Zhindón-Arévalo, L. Ramos-Fernández, D. García-Altamirano, S. Vázquez-García and C. Sánchez- Alvarracín/Journal of Engineering Science and Technology Review 12 (2) (2019) 119 - 126
124
Fig. 8. Visual examination of the surface of the copper coupons after the static immersion test for each chlorine concentration The results of this study indicate a significant influence of residual chlorine on copper corrosion. Chlorine is an important oxidizing agent responsible for the copper corrosion [20, 61]. It would be interesting to conduct a new study in which dissolved oxygen is included. This research suggests that water suppliers can use relatively simple copper coupons to examine the effects of residual chlorine on copper pipes that carry potable water,
determine the tendency of water to induce pitting, and determine the amount of copper released from the pipes. Water suppliers who use chlorine as a disinfectant can use this information to analyse the localized corrosion that can occur in copper pipes. A combination of water quality variables in which residual chlorine is included is often the cause of the corrosion problem of copper pipes used in plumbing.
Fig. 9. Image of corrosion of the copper coupons

F. García-Ávila, L. Flores del Pino, G. Bonifaz-Barba, C. Zhindón-Arévalo, L. Ramos-Fernández, D. García-Altamirano, S. Vázquez-García and C. Sánchez- Alvarracín/Journal of Engineering Science and Technology Review 12 (2) (2019) 119 - 126
125
4. Conclusions This study demonstrates that by means of a simple and low-cost technique, such as the use of coupons, the effects of residual chlorine on copper pipes carrying potable water can be examined. Allowing to determine the tendency of the water to induce pitting, as well as to determine the amount of copper released from the pipes. The findings of this investigation showed that corrosion of copper pipes with residual chlorine concentration greater than 1 mg/L was favoured. The copper corrosion and residual copper rates predicted by the developed test was qualitatively consistent with the visual results observed on the plates after the observation periods. The results suggest that the presence of free chlorine, commonly used for the disinfection of drinking water, causes an increase in dissolved copper in the drinking water. While it is desirable for protection against bacterial regrowth, free chlorine can stimulate copper corrosion in the plumbing materials. The copper concentration in drinking water is mainly determined by the chlorine dose and contact time. Water with a high free
chlorine content more easily dissolves metal pipes; thus, free chlorine concentrations should be controlled to effectively reduce copper pipe corrosion. This study was limited to new copper pipes (not aged) and water quality of the supply system under study. Still, copper concentrations in drinking water distribution systems were shown to be related to the free chlorine concentration. In particular, the coupon corrosion tests reasonably predicted the effect of chlorine on copper solubility. The copper pipes used in the water distribution system in Azogues were not found to be subject to an excessive corrosion rate. 5. Acknowledgement The authors thank the EMAPAL EP for their collaboration. This is an Open Access article distributed under the terms of the Creative Commons Attribution License
______________________________
References
[1] Z. Tang, S. Hong, W. Xiao, J. Taylor, Impacts of blending ground surface and saline waters on lead release in drinking water distribution systems, Water Res. 40 (2006) 943-950.
[2] G. Liu, Y. Zhang, W.J. Knibbe, C. Feng, W. Liu, G. Medema, W. van der Meer, Potential impacts of changing supply-water quality on drinking water distribution: A review, Water Res. 16 (2017) 135-148.
[3] N. Boulay, M. Edwards, Role of temperature chlorine and organic matter in copper corrosion by-product release in soft water, Water Res. 35(3) (2001) 683-690.
[4] S. Takasaki, Y. Yamada, Effects of temperature and aggressive anions on corrosion of carbon steel in potable water, Corros Sci. 49 (2007) 240-247.
[5] F. Yang, B. Shi, J. Gu, D. Wang, M. Yang, Morphological and physicochemical characteristics of iron corrosion scales formed under different water source histories in a drinking water distribution system. Water Research 46(16) (2012) 5423-5433.
[6] K. Zakowski, K. Darowicki, J. Orlikowski, A. Jazdzewska, S. Krakowiak, M. Gruszka, J. Banas, Electrolytic corrosion of water pipeline system in the remote distance from stray currents-Case study, Case Stud. Constr. Mater. 4 (2016) 116-124.
[7] S. Triantafyllidou, D. Lytle, C. Muhlen, J. Swertfeger, Copper-silver ionization at a US hospital: Interaction of treated drinking water with plumbing materials aesthetics and other considerations. Water Res. 102 (2016) 1-10.
[8] J. Castillo Montes, F. Hamdani, J. Creus, S. Touzain, O. Correc, Impact of chlorinated disinfection on copper corrosion in hot water systems, Appl. Surf. Sci. 314 (2014) 686-696.
[9] D.A. Lytle, M.N. Nadagouda, A comprehensive investigation of copper pitting corrosion in a drinking water distribution system, Corros. Sci. 52(6) (2010) 1927-1938.
[10] I. Vargas, D. Fischer, M. Alsina, J. Pavissich, P. Pablo, G. Pizarro. Copper corrosion and biocorrosion events in premise plumbing, Mater. 10(9) (2017) 1-30.
[11] T. Olivares, R. Cienfuegos, I.T. Vargas, G.E. Pizarro, Experimental evidence for enhanced copper release from domestic copper plumbing under hydrodynamic control, Corros. Sci. 80 (2014) 473-481.
[12] M. Zheng, C. He, q. He, Fate of free chlorine in drinking water during distribution in premise plumbing. Ecotoxicol. 42 (2015) 2151-2155.
[13] H. Wang, C. H, X. Hu, M. Yang, J. Qu, Effects of disinfectant and biofilm on the corrosion of cast iron pipes in a reclaimed water distribution system. Water Res. 46 (2012) 1070-1078.
[14] F. García-Ávila, G. A. Bonifaz, S. Donoso, L. Ramos-Fernández, Dataset of copper pipes corrosion after exposure to chlorine, Data Brief 19 (2018) 170-178.
[15] L. Yohai, W.H. Schreiner, M. Vazquez, M. B. Valcarce, Phosphate ions as inhibiting agents for copper corrosion in chlorinated tap water. Mater. Chem. Phys. 139(2-3) (2013) 817-824.
[16] D. Lytle, J. Liggett, Impact of water quality on chlorine demand of corroding copper, Water Res. 92 (2016) 11-21.
[17] V.C. Rao, G.M. Reddy, K.S. Rao, Influence of tool pin profile on microstructure and corrosion behaviour of AA2219 Al - Cu alloy friction stir weld nuggets, Defence Technol. 11(3) (2015) 197-208.
[18] L. Raju, A. Kumar, Influence of Al2O3 particles on the microstructure and mechanical properties of copper surface composites fabricated by friction stir processing. Defence Technol. 10 (2014) 375-383.
[19] T. Elshenawy, S. Soliman, A. Hawwas, Influence of electric current intensity on the performance of electroformed copper liner for shaped charge application, Defence Technol. 13 (2017) 439-442.
[20] D. Atlas, D. Coombs, O. Zajicek, The corrosion of copper by chlorinated drinking waters, Water Res. 16 (1982) 693-698.
[21] T. Tzevelekou, A. Flampouri, A. Rikos, A. Vazdirvanidis, G. Pantazopoulos, D. Skarmoutsos, Hot-water corrosion failure of a hard-drawn copper tube, Eng. Fail. Anal. 33 (2013) 176-183.
[22] R.T. Loto, Study of the corrosion behaviour of S32101 duplex and 410 martensitic stainless steel for application in oil refinery distillation systems, J. Mater. Res. Technol. 6(3) (2017) 203-212.
[23] C. Taxen, M.V. Letelier, G. Lagos, Model for estimation of copper release to drinking water from copper pipes, Corros. Sci. 58 (2012) 267-277.
[24] S.H. Suh, Y. Suh, H.G. Yoon, J.H. Oh, Y. Kim, K.M. Jung, H.S. Kwon, Analysis of pitting corrosion failure of copper tubes in an apartment fire sprinkler system, Eng. Fail. Anal. 64 (2016) 111-125.
[25] M. Save-Soderbergh, J. Bylund, A. Malm, M. Simonsson, J. Toljander, Gastrointestinal illness linked to incidents in drinking water distribution networks in Sweden, Water Res. 122 (2017) 503-511.
[26] M. Schock, R. Hyland, M. Welch, Occurrence of contaminant accumulation in lead pipe scales from domestic drinking-water distribution systems, Environ. Sci. Technol. 42 (2008) 4285-4291.
[27] S.H. Lee, J.G. Kim, J.Y. Koo, Investigation of pitting corrosion of a copper tube in a heating system, Eng. Fail. Anal. 17 (2010) 1424-1435.
[28] J.C. Rushing, M. Edwards, The role of temperature gradients in residential copper pipe corrosion, Corros. Sci. 46 (2004) 1883-1894.

F. García-Ávila, L. Flores del Pino, G. Bonifaz-Barba, C. Zhindón-Arévalo, L. Ramos-Fernández, D. García-Altamirano, S. Vázquez-García and C. Sánchez- Alvarracín/Journal of Engineering Science and Technology Review 12 (2) (2019) 119 - 126
126
[29] A. Jazdzewska, K. Darowicki, J. Orlikowski, S. Krakowiak, K. Zakowski, M. Gruszka, J. Banas, Critical analysis of laboratory measurements and monitoring system of water-pipe network corrosion-case study, Case Stud. Constr. Mater. 4 (2016) 102-107.
[30] C. Nguyen, K. Powers, M. Raetz, J. Parks, M. Edwards, Rapid free chlorine decay in the presence of Cu(OH)2: Chemistry and practical implications, Water Res. 45(16) (2011) 53025312.
[31] J. Orlikowski, A. Zielinski, K. Darowicki, S. Krakowiak, K. Zakowski, P. Slepski, A. Jazdzewska, M. Gruszka, J. Banas, Research on causes of corrosion in the municipal water supply system, Case Stud. Constr. Mater. 4 (2016) 108-115.
[32] Canada Health, Corrosion Control in Drinking Water Distribution Systems, Federal- Provincial-Territorial Committee on Drinking Water, 2007.
[33] R.A. Bajares, L. Di Mella, Study of the Corrosion Rate in the Couple of Steels ASTM A-36 and AISI/SAE 304 in a Water-coke of Petroleum System, Procedia Mater. Sci. 8(1985) (2015) 702-711.
[34] M. Galik, J. Kris, J. Ilavsky, Corrosion tests at the water treatment plant in Jakubany, GeoSci. Eng. LX(4) (2015) 51-60.
[35] E. Huttunen-Saarivirta, P. Rajala, L. Carpen, Corrosion behaviour of copper under biotic and abiotic conditions in anoxic ground water: Electrochemical study, Electrochim. Acta 203 (2016) 350-365
[36] J.D. Eisnor, G.A. Gagnon, A framework for the implementation and design of pilot-scale distribution systems. Journal of Water Supply: Res. Technol. AQUA 52(7) (2003) 501-519.
[37] K. Slavickova,A. Griinwald, B. Stastny, Monitoring of the Corrosion of Pipes Used for the Drinking Water Treatment and Supply, Civil Eng. Archit. 1(3) (2013) 61-65.
[38] A. Fateh, M. Aliofkhazraei, A. Rezvanian, Review of corrosive environments for copper and its corrosion inhibitors, Arabian J. Chem. (2017).
[39] A. Khadraoui, A. Khelifa, M. Hadjmeliani, R. Mehdaoui, K. Hachama, A. Tidu, Z. Azari, Extraction characterization and anti-corrosion activity of Mentha pulegium oil: Weight loss electrochemical thermodynamic and surface studies, J. Mol. Liq. 216 (2016) 724-731.
[40] J.W. Sowards, E.Mansfield, Corrosion of copper and steel alloys in a simulated underground storage-tank sump environment containing acid-producing bacteria, Corros. Sci. 87 (2014) 460-471.
[41] ASTM G1-03, Standard practice for preparing, cleaning, and evaluating corrosion test specimens, 2011.
[42] R. Baboian, Corrosion Tests and Standards: Application and Interpretation. U.S.A. ASTM International 2nd Edition ASTM, Manual Series West Conshohocken, 2005.
[43] M. Finsga,r 2-Mercaptobenzimidazole as a copper corrosion inhibitor: Part I. Long-term immersion 3D-profilometry and electrochemistry, Corros. Sci. 72 (2013) 82-89.
[44] R.T. Loto, Pitting corrosion evaluation of austenitic stainless steel type 304 in acid chloride media, J. Mater. Environ. Sci. 4(4) (2013) 448-459.
[45] F. García-Ávila, L. Ramos, D. Pauta, D. Quezada, Evaluation of water quality and stability in the drinking water distribution network in the Azogues city Ecuador, Data Brief 18 (2018) 11-123.
[46] F. García-Ávila, L. Ramos, C. Zhindón, Estimation of corrosive and scaling trend in drinking water systems in the Azogues city Ecuador, Revista Ambiente Água (2018).
[47] ASTM G31-12a, Standard practice for laboratory immersion corrosion testing of metals, 2012.
[48] M.M. Sadawy, M. Ghanem, Grain refinement of bronze alloy by equal-channel angular pressing (ECAP ) and its effect on corrosion behaviour, Defence Technol. 12(4) (2016) 316-323.
[49] H. Medhashree, A.N. Shetty, Electrochemical corrosion study of Mg-Al-Zn-Mn alloy in aqueous ethylene glycol containing chloride ions, J. Mater. Re.s Technol. 6(1) (2017) 40-49.
[50] O.O. Joseph, C.A. Loto, S. Sivaprasad, J.A. Ajayi, S. Tarafder, Role of chloride in the corrosion and fracture behavior of micro-alloyed steel in E80 simulated fuel grade ethanol environment, Mater. 9 (2016) 1-17.
[51] O.O. Joseph, S. Sivaprasad, O.S.I. Fayomi, Comparative study on the effect of NaNO2 in corrosion inhibition of micro-alloyed and API-5L X65 steels in E20 simulated FGE, Energy Procedia 119 (2017) 953-960.
[52] ASTM 2688, Designation: D 2688-05 Standard. Standard Test Method for Corrosivity of Water in the Absence of Heat Transfer (Weight Loss Method), 2005.
[53] C.M.B. Martins, J.L. Moreira, J.I. Martins, Corrosion in water supply pipe stainless steel 304 and a supply line of helium in stainless steel 316, Eng. Fail. Anal. 39 (2014) 65-71.
[54] M. Liu, X. Cheng, X. Li, J. Hu, Y. Pan, Z. Jin, Case Studies in Construction Materials Indoor accelerated corrosion test and marine fi eld test of corrosion-resistant low-alloy steel rebars, Case Stud. Constr. Mater. 5 (2016) 87-99.
[55] J. Sathiyabama, S. Rajendran, J. JeyasSundari, B. Shyamaladevi, The effect of Zn2+ ion in promoting inhibitive property of phenolphthalein. Eng. Sci. Tech. Rev. 3(1) (2010) 27-31.
[56] S.К. Kiselyeva, L.I. Zaynullina, М.М. Abramova, N.Y. Dudareva, I.V. Alexandrov, The Effect of Microarc Oxidation (MAO) Modes on Corrosion Behavior of High-Silicon Aluminum Alloy. Eng. Sci. Tech. Rev. 7 (5) (2014) 36-39.
[57] I. Singh, D.S. Mavinic, Significance of building and plumbing specifics on trace metal concentrations in drinking water, Can. J. Civil Eng. 18 (1991) 893-903.
[58] A. Stone, D. Spyridakis, M. Benjamin, J. Ferguson, S. Reiber, S. Osterhus, J. Am. Water Works Assn 79(2) (1987) 75-2.
[59] S.H. Reiber, Copper plumbing surfaces: an electrochemical study, J. Am. Water Works Assn 81(7) (1989) 114-122.
[60] WHO, Copper in Drinking-water. Background document for development of WHO Guidelines for Drinking-water Quality, (2004)
[61] I.T. Vargas, P.A. Pasten, G.E. Pizarro, Empirical model for dissolved oxygen depletion during corrosion of drinking water copper pipes, Corros. Sci. 52(7) (2010) 2250-2257.


