Research Article International Journal of Women’s Health ... · Demographic Health Survey...
16
International Journal of Women’s Health Care Whether Recent Upswing in Women’s Empowerment has a Potential to Address Malnutrition among Women and Children? Evidence from Fourth Round of Indian Demographic Health Survey Research Article Int J Women’s Health Care, 2017 Shri Kant Singh 1 , Swati Srivastava 1* , Gudakesh 1 , Y. Vaidehi 2 and Jitendra Gupta 1 * Corresponding author Swati Srivastava, Research Scholar, International Institute for Population Sciences, Govandi Station Road, Deonar, Mumbai, 400088, India. Submitted: 17 Aug 2017; Accepted: 24 Aug 2017; Published: 01 Sep 2017 1 International Institute for Population Sciences. 2 Consultant ICF, USA. Abstract Background: Socio-political status of women in India has been improved considerably in the last decades and has been perceived to be an important catalyst behind the improvement in maternal and child health situation. Many evil and masculine forces still prevail in the modern Indian society that resists the forward march of women folk. Methods: Using the information from the 4th round of National Family Health Survey (2015-16) and multivariate linear regression analysis this study explored that whether the recent swings of women empowerment has potential to address the nutritional status of women and children in India. Results: Result shows a considerable variation in level and inequality in women’s empowerment across states. Regression results shows a positive association between inequalities in possession of house/land, bank account, at least 10 years of schooling and working status of women with malnutrition among women and children; whereas negative relationship with household decision making and use of mobile. The study highlighted that there had been amelioration in the situation of women, but their true empowerment is still awaited. The study highlighted that inequalities in different dimensions of women’s empowerment are positively associated with nutritional status of women and children. Conclusions: The study concluded that inequalities in women’s empowerment are associated with nutritional status of women and children. Ensuring equity in women’s empowerment should be topmost priority through structural interventions. Many states have considerable gap in institutional births and colostrum’s feeding as well as 3+DPT and exclusive breastfeeding. Minimizing this missed opportunity may improve the nutritional status of women and children. Keywords: Women’s empowerment, Inequality, Malnutrition, Shannon Diversity Index, Correlation. Abbreviations SDG-Sustainable Development Goals NFHS-National Family Health Survey BMI-Body Mass Index HAZ-Height-for-Age WHZ-Weight-for-Height WAZ-Weight-for-Age ICDS-Integrated Child Development Scheme MNP- Minimum Needs Programme TINP-Tamil Nadu Integrated Nutrition programme JSY-Janani Surakhsha Yojna Introduction Malnutrition among women and children is a major public health problem in most of the developing countries across the world. Lowering malnutrition levels among women and children is one of the most important objectives of the Sustainable Development Goals (SDGs). Improved health of women and children is not only a matter of human rights but it also plays a significant role in the country’s growth and improving its economy. because poor health of women and children erodes social and economic gain of the country as it is burdened with disease, poor nutritional status and poverty [1]. Many global, regional and national level efforts have been made to reduce malnutrition among women and children in different parts of the world, despite these efforts; situation of malnutrition is still dire [2,3]. In poor and developing countries, malnutrition among women or children, occurs when a person does not receive adequate nutrients from their diet. This causes damage to vital organs and functions of the body. However in developed countries the causes of malnutrition may be varied [4]. Also, poor diet of women during pregnancy and/or during lactation period Volume 2 | Issue 2 | 1 of 16
Transcript of Research Article International Journal of Women’s Health ... · Demographic Health Survey...
International Journal of Women’s Health CareWhether Recent Upswing in Women’s Empowerment has a Potential to Address Malnutrition among Women and Children? Evidence from Fourth Round of Indian Demographic Health Survey
Research Article
Int J Women’s Health Care, 2017
Shri Kant Singh1, Swati Srivastava1*, Gudakesh1, Y. Vaidehi2 and Jitendra Gupta1
*Corresponding authorSwati Srivastava, Research Scholar, International Institute for Population Sciences, Govandi Station Road, Deonar, Mumbai, 400088, India.
Submitted: 17 Aug 2017; Accepted: 24 Aug 2017; Published: 01 Sep 2017
1International Institute for Population Sciences.
2 Consultant ICF, USA.
AbstractBackground: Socio-political status of women in India has been improved considerably in the last decades and has been perceived to be an important catalyst behind the improvement in maternal and child health situation. Many evil and masculine forces still prevail in the modern Indian society that resists the forward march of women folk.
Methods: Using the information from the 4th round of National Family Health Survey (2015-16) and multivariate linear regression analysis this study explored that whether the recent swings of women empowerment has potential to address the nutritional status of women and children in India.
Results: Result shows a considerable variation in level and inequality in women’s empowerment across states. Regression results shows a positive association between inequalities in possession of house/land, bank account, at least 10 years of schooling and working status of women with malnutrition among women and children; whereas negative relationship with household decision making and use of mobile. The study highlighted that there had been amelioration in the situation of women, but their true empowerment is still awaited. The study highlighted that inequalities in different dimensions of women’s empowerment are positively associated with nutritional status of women and children.
Conclusions: The study concluded that inequalities in women’s empowerment are associated with nutritional status of women and children. Ensuring equity in women’s empowerment should be topmost priority through structural interventions. Many states have considerable gap in institutional births and colostrum’s feeding as well as 3+DPT and exclusive breastfeeding. Minimizing this missed opportunity may improve the nutritional status of women and children.
Keywords: Women’s empowerment, Inequality, Malnutrition, Shannon Diversity Index, Correlation.
AbbreviationsSDG-Sustainable Development GoalsNFHS-National Family Health SurveyBMI-Body Mass IndexHAZ-Height-for-AgeWHZ-Weight-for-HeightWAZ-Weight-for-AgeICDS-Integrated Child Development SchemeMNP- Minimum Needs ProgrammeTINP-Tamil Nadu Integrated Nutrition programmeJSY-Janani Surakhsha Yojna
IntroductionMalnutrition among women and children is a major public health
problem in most of the developing countries across the world. Lowering malnutrition levels among women and children is one of the most important objectives of the Sustainable Development Goals (SDGs). Improved health of women and children is not only a matter of human rights but it also plays a significant role in the country’s growth and improving its economy. because poor health of women and children erodes social and economic gain of the country as it is burdened with disease, poor nutritional status and poverty [1]. Many global, regional and national level efforts have been made to reduce malnutrition among women and children in different parts of the world, despite these efforts; situation of malnutrition is still dire [2,3]. In poor and developing countries, malnutrition among women or children, occurs when a person does not receive adequate nutrients from their diet. This causes damage to vital organs and functions of the body. However in developed countries the causes of malnutrition may be varied [4]. Also, poor diet of women during pregnancy and/or during lactation period
Volume 2 | Issue 2 | 1 of 16

Int J Women’s Health Care, 2017
affects health of their children. Moreover, some parental factors, for instance- low BMI of women during pregnancy, age of women during pregnancy, lack of knowledge about good child feeding practices, women’s endowments, women’s empowerment, etc. are also responsible for poor health of women and children.
Women’s empowerment refers to the creation of an environment for women where they can freely live their life with a sense of self-worth, respect, dignity, having equal rights for social and economic justice and having equal rights to participate in social, religious and public activities. In other words, women’s empowerment means emancipation of women from the vicious grips of social, economic, political, religion, caste and gender-based discrimination. Women’s empowerment does not mean ‘deifying women’ but rather it means replacing patriarchy with parity [5].
For a long time women in India have remained within the four walls of their household, where they totally depended on their counterparts. It is also evident from the history of India that from Rig-Vedic period to later Vedic civilization the position of women has deteriorated. Women were denied to having right to education, right to widow remarriage and, right to inheritance and ownership of property. Apart from these hurdles, many social evils like child marriage, dowry system, and Sati Pratha surfaced and started to overwhelm women. Many social reformers such as Raja Rammohun Roy, Ishwar Chandra Vidyasagar, and Jyotirao Phule started agitations for the empowerment of women. Their efforts led to the end of Sati and formulation of the Widow Remarriage Act.
In recent times, major steps have taken place to improve the situation of women in Indian society. In 1961, a ‘Dowry Prohibition Act, 1961’ was initiated which prohibits the request, payment or acceptance of a dowry. Under this act asking or giving dowry is punishable by imprisonment as well as fine. Another Act, namely, ‘Protection of Women from Domestic Violence Act, 2005’ was formulated to provide a more effective protection of the rights of women who were victims of domestic violence. A breach of this Act is punishable with both fine and imprisonment. Moreover, ‘Sexual Harassment of Women at Work Place (Prevention, Prohibition, and Redressal) Act, 2013’ has been initiated to create a conducive environment for women at the workplace where they should not be subjected to any sort of sexual harassment [5]. Furthermore, many provisions have been made under the constitution of the Government of India. For example ‘Right to equality under Article 14’ of the Indian Constitution, which means that every person who is living within the territory of India have an equal right before the law. This right confirms that there should be no discrimination based on sex. Also,
‘Equal pay for equal work under Article 39(d)’ guards the economic rights of women by guaranteeing equal pay for equal work. Another one is ‘Maternity Relief under Article 42’ which allows provisions to be made by the state for securing just and humane condition of work and maternity relief for women. The concern about empowerment is not restricted to the above mentioned constitutional Acts and can be also seen in various reservation systems. Until recent times, in Indian society, the suppression of women’s political rights was a manifestation of the patriarchal mindset. It was considered that from birth till death, identity of women can only be derived from a man; either from her father or her husband. Therefore, participation of women in politics was made effective with a provision, namely, ‘Panchayati Raj Institutions’ which was included in the 73rd and 74th Constitutional Amendment Act, which reserved one-third of their seats for women out of all the local elected bodies. Further, ‘Women’s Reservation Bill’ has been proposed to reserve 33 percent of all seats in the LokSabha and in all State Legislative Assemblies for women. Apart from these efforts, Government of India launched various welfare schemes and policies at both state and central levels for development and empowerment of women. Some such major programmers and schemes are- Swadhar (1995), Swayam Siddha (2001), Support to Training and Employment Programme for Women (STEP-2003), Sabla Scheme (2010), National Mission for Empowerment of Women (2010), etc. All such policies and programs focused on social, economic and educational empowerment of women across various age groups.
Because of these concentrated efforts, the status of women in social, economic and political life began to elevate in the Indian society. Based on the ideas championed by our founding fathers for women’s empowerment many social, economic and political provisions were incorporated in the Indian Constitution. Women in India now participate in areas such as education, sports, politics, media, art and culture, service sector and science and technology. However, in the last two decades, discourse and attention to the concept of women’s empowerment has gained impetus to achieve various developmental goals. United Nations Development Programmers focus on gender equality and women’s empowerment not only as basic human rights but also because they are a pathway to achieving the Sustainable Development Goals [6]. Research on the subject shows that the linkages between women’s empowerment and nutritional indicators have been increasing over the years. The pathway, from women’s empowerment to improved nutrition has been influenced by some factors such as social norms, knowledge, skills, and decision-making power within households [7]. (See Figure below).
Source: Herforth and Harris, 2014
Volume 2 | Issue 2 | 2 of 16

Int J Women’s Health Care, 2017
Empowerment of women has been considered to not only be an important but also a crucial indicator of nutritional outcome, because women are primary caregivers of the family as well as children, therefore, they can influence their nutritional status and, children’s nutritional status through childcare practices [8,9]. Many studies demonstrated the association between women’s empowerment (using direct and indirect measures of women’s empowerment) and nutritional status of themselves their own as well as their children [8,10-17]. Moreover, several studies highlighted the consequences of women’s empowerment [8,18-21]. However, some of the studies found that domestic violence (an indicator of ultimate disempowerment) as the probable reason for low levels of antenatal care, breastfeeding and child immunization [8,22-24]. In the Indian context also, many studies found a positive association between the measures of maternal autonomy (like- financial independence, participation in decision-making within the household, acceptance of domestic violence, and freedom of movement) with child growth outcomes [25,26]. Many studies have found an association between women’s empowerment and variety of good health outcomes of a child (including greater use of health care, better immunization and nutritional status and reduced child mortality) [27,28].
After facing extensive discrimination and many years of struggle, women have been given property rights, voting rights, equality in civil rights before the law, rights in matters of marriage and employment, but there still are many issues because of which they are struggling against many handicaps and social evils in a male-dominated society [29]. Many evil and masculine forces still prevail in the modern Indian society that resists the forward march of women folk. Due to the deep-rooted patriarchal mentality in the Indian society, women are still subjected to discrimination in the social, economic and educational field. There has been amelioration in the situation of women but still there is lack of equality in women’s empowerment that is why achieving gender equality became the one of the important objective of sustainable development goals. Therefore, by focusing on sustainable development goals, this study has an objective to determine the association between inequality in women’s empowerment and nutritional status of women and children by exploring two important research questions - up to what extent the recent improvement upswing of women’s empowerment has affected malnutrition among women and children and what are the potential gaps in maternal and child health program which need to be addressed effectively in order to improve the nutritional status of women and children. In this connection, this study aims to hypothesize that there is no association between inequalities in the indicators of women’s empowerment and malnutrition among women and children in India.
Materials and MethodsDataThe study used the information from state and national fact sheets of two rounds of National Family Health Survey (NFHS), which was conducted during the year 2005-06 and 2015-16 in states of India. NFHS is large scale survey which covered approximate 99 percent population of India. This survey was conducted under the stewardship of Ministry of Health and Family Welfare, Government of India. The International Institute for Population Sciences, Mumbai was designated as the nodal agency for different rounds of NFHS and ORC Macro, Calverton, Maryland, USA, which is currently known as the ICF International, was providing the
technical support in various rounds of NFHS. In the fourth round of the National Family Health Survey (NFHS-4) conducted in 2015-16, information regarding different dimensions of women’s empowerment was collected from approximately 649,775 women of age 15-49 across 29 states in India.
Description of Variables Outcome variablesThe outcome variables of interest were related to the nutritional status of women and children. Women’s nutritional status were assessed through body mass index < 18.5 kg/m2, however nutritional status of children was accessed through height-for-age (<-2SD) and weight-for-age (<-2SD) under age 5 years.
Women BMI Women’s weight and height measurements were used to derive their BMI, expressed as the weight in kilograms divided by the square of the height in meters (kg/m2).
Child anthropometryWeight and height/length measurements of children under five years. Anthropometric measurements of each child were compared to WHO child growth standards reference.
Exposure variablesWomen’s empowerment was assessed through different dimensions of empowerment indicators like- household decision making, ownership of house/land, bank account (either jointly or alone), mobile phone which woman can use independently, employment status (worked in the last 12 months and paid in cash) and schooling of 10 years of more.
Household Decision MakingCurrently married women were asked who make decisions about their own health care, major household purchases, and visits to their own family or relatives. If their response was either “alone” or “jointly with someone”, it has been considered as their participation in HH decision making.
Ownership of House/LandWomen age 15-49 were asked whether they have ownership of land or house. If their response was either “having alone” or “jointly with someone”, it has been considered as their ownership of household assets.
Bank or saving Account Women age 15-49 were asked whether they have saving bank account, which they themselves can use. If their response was either “having alone” or “joint account”, it has been considered as having a bank or saving account.
Mobile Phone Women age 15-49 were asked whether they have a mobile phone that they themselves use. If their response was “yes”, it has been considered to have it.
Working in the last 12 months and paid in cashThis question was asked to women age 15-49, if they worked in the last 12 months and paid in cash.
Volume 2 | Issue 2 | 3 of 16
At least 10 years of schoolingWomen age 15-49 were asked about their education attainment in terms of years of schooling and classified accordingly.
MethodsShannon diversity index was used to determine the inequality in a different domain of women’s empowerment by using the different domains to measure empowerment. Diversity index is a mathematical measure to determine diversity in habitat in the community. In the present study, women were treated as habitats that are living in the different states of India.
The proportion of women (i) relative to the total number of women (pi) is calculated and then multiplied by the natural logarithm of this proportion (lnpi). The resulting product is summed across women, and multiplied by ‘-1’
Shannon’s equitability (EH) can be calculated by dividing H by Hmax. Equitability assumes a value between 0 and 1.
Bivariate association was determined to understand the association between exposure and outcome variables. However, multivariate regression analysis was used to determine the adjusted effect of exposure variables on outcome variables. Let x1, x2, x3...xn be the predictors of response variable y where b1, b2, b3...bi represent the coefficient of each predictor variable included in the model and ‘e’ is
the error term. The linear regression model can be written as-
yj=b0+b1 x1+b2 x2+b3 x3+……..+bi xi+e
All the analysis has been done in MS-Excel.
ResultsTable 1 shows the percentage of women who reported to have different dimensions of women’s empowerment in state. Table 2 shows the diversity index inequalities in the different dimensions of women’s empowerment by state. Table 3 shows the nutritional status of women (body mass index <18.5 kg/m2) and children (stunting and underweight) by state, from NFHS-3 and NFHS-4. Table 4 shows the correlation matrix between the different dimensions of women’s empowerment, for year 2015-16. Table 5 shows the results of the multivariate linear regression for nutritional status of women and children, for year 2015-16. Table 6 shows the percentage of births in the five years preceding the survey. Figures 1-18 show the key findings from the bivariate association (Figures 1-18th as been shown in appendix).
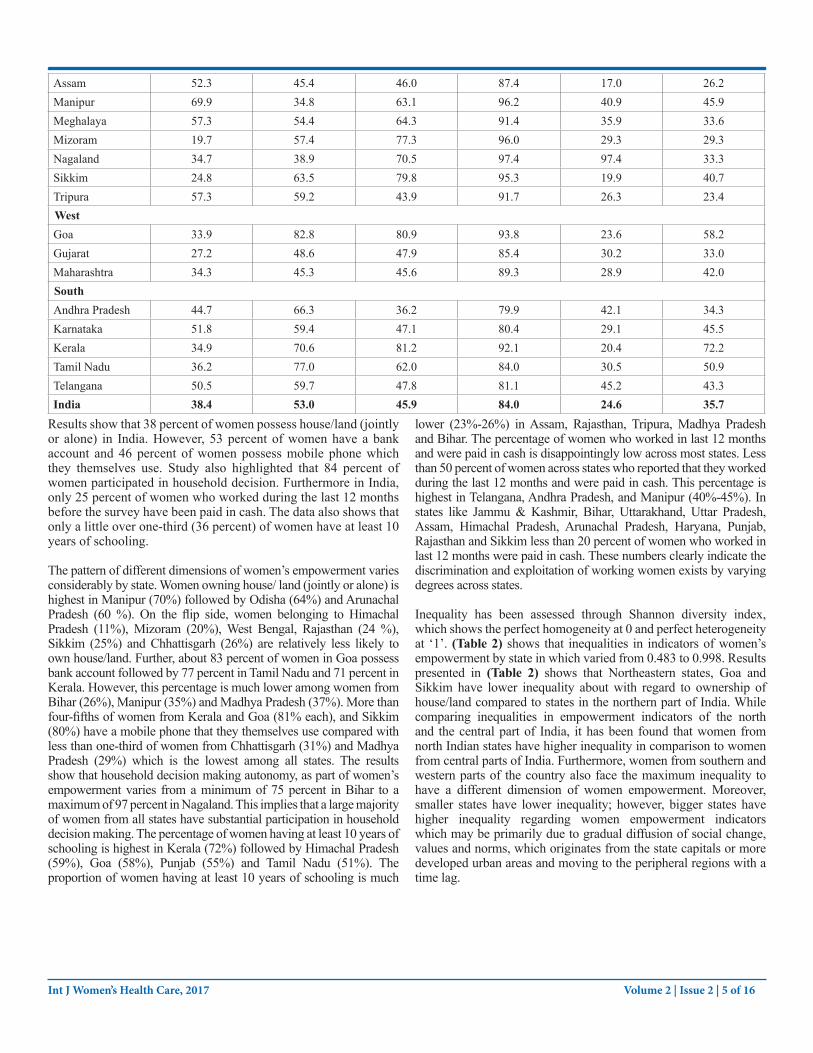
Levels and inequality in women’s empowerment among statesWomen’s empowerment is an active, multi-dimensional process which enables women to realize their potential and powers in all spheres of life. It is not only necessary for social justice and equal opportunity for women but also essential to eliminate poverty, under nutrition and to achieve better health and education for society. (Table 1) shows percentage of women who own house/land, bank account, mobile phone, participate in the household decision making, have at least ten years of schooling, worked in last 12 months and were paid in cash across 29 states of India and for the country.
Table: 1 Percentage of women who report to have different dimensions of women’s empowerment in India and states, 2015-16State Owning house or
landOwning
bank accountHavingmobile
Household decision making
Working andwere paid in cash (in last 12 months)
Having 10 or more year of
schoolingNorthHaryana 35.8 45.6 50.5 76.7 17.6 45.8Himachal Pradesh 11.3 68.8 73.9 90.8 17.0 59.4Jammu and Kashmir
33.3 60.3 54.2 84.0 12.4 37.2
Punjab 32.1 58.8 57.2 90.2 18.5 55.1Rajasthan 24.1 58.2 41.4 81.7 18.6 25.1Uttarakhand 29.2 58.5 55.4 89.8 15.5 44.6CentralChhattisgarh 26.4 51.3 31.0 90.5 36.8 26.5Madhya Pradesh 43.5 37.3 28.7 82.8 29.9 23.2Uttar Pradesh 34.2 54.6 37.1 81.7 16.6 32.9
EastBihar 58.8 26.4 40.9 75.2 12.5 22.8Jharkhand 49.7 45.1 35.2 86.6 24.8 28.7Odisha 63.5 56.2 39.2 81.8 22.5 26.7West Bengal 23.8 43.5 41.9 89.9 22.8 26.5NortheastArunachal Pradesh 59.7 56.6 56.6 89.1 17.1 31.0
Int J Women’s Health Care, 2017 Volume 2 | Issue 2 | 4 of 16
Assam 52.3 45.4 46.0 87.4 17.0 26.2Manipur 69.9 34.8 63.1 96.2 40.9 45.9Meghalaya 57.3 54.4 64.3 91.4 35.9 33.6Mizoram 19.7 57.4 77.3 96.0 29.3 29.3Nagaland 34.7 38.9 70.5 97.4 97.4 33.3Sikkim 24.8 63.5 79.8 95.3 19.9 40.7Tripura 57.3 59.2 43.9 91.7 26.3 23.4WestGoa 33.9 82.8 80.9 93.8 23.6 58.2Gujarat 27.2 48.6 47.9 85.4 30.2 33.0Maharashtra 34.3 45.3 45.6 89.3 28.9 42.0SouthAndhra Pradesh 44.7 66.3 36.2 79.9 42.1 34.3Karnataka 51.8 59.4 47.1 80.4 29.1 45.5Kerala 34.9 70.6 81.2 92.1 20.4 72.2Tamil Nadu 36.2 77.0 62.0 84.0 30.5 50.9Telangana 50.5 59.7 47.8 81.1 45.2 43.3India 38.4 53.0 45.9 84.0 24.6 35.7
Results show that 38 percent of women possess house/land (jointly or alone) in India. However, 53 percent of women have a bank account and 46 percent of women possess mobile phone which they themselves use. Study also highlighted that 84 percent of women participated in household decision. Furthermore in India, only 25 percent of women who worked during the last 12 months before the survey have been paid in cash. The data also shows that only a little over one-third (36 percent) of women have at least 10 years of schooling.
The pattern of different dimensions of women’s empowerment varies considerably by state. Women owning house/ land (jointly or alone) is highest in Manipur (70%) followed by Odisha (64%) and Arunachal Pradesh (60 %). On the flip side, women belonging to Himachal Pradesh (11%), Mizoram (20%), West Bengal, Rajasthan (24 %), Sikkim (25%) and Chhattisgarh (26%) are relatively less likely to own house/land. Further, about 83 percent of women in Goa possess bank account followed by 77 percent in Tamil Nadu and 71 percent in Kerala. However, this percentage is much lower among women from Bihar (26%), Manipur (35%) and Madhya Pradesh (37%). More than four-fifths of women from Kerala and Goa (81% each), and Sikkim (80%) have a mobile phone that they themselves use compared with less than one-third of women from Chhattisgarh (31%) and Madhya Pradesh (29%) which is the lowest among all states. The results show that household decision making autonomy, as part of women’s empowerment varies from a minimum of 75 percent in Bihar to a maximum of 97 percent in Nagaland. This implies that a large majority of women from all states have substantial participation in household decision making. The percentage of women having at least 10 years of schooling is highest in Kerala (72%) followed by Himachal Pradesh (59%), Goa (58%), Punjab (55%) and Tamil Nadu (51%). The proportion of women having at least 10 years of schooling is much
lower (23%-26%) in Assam, Rajasthan, Tripura, Madhya Pradesh and Bihar. The percentage of women who worked in last 12 months and were paid in cash is disappointingly low across most states. Less than 50 percent of women across states who reported that they worked during the last 12 months and were paid in cash. This percentage is highest in Telangana, Andhra Pradesh, and Manipur (40%-45%). In states like Jammu & Kashmir, Bihar, Uttarakhand, Uttar Pradesh, Assam, Himachal Pradesh, Arunachal Pradesh, Haryana, Punjab, Rajasthan and Sikkim less than 20 percent of women who worked in last 12 months were paid in cash. These numbers clearly indicate the discrimination and exploitation of working women exists by varying degrees across states.
Inequality has been assessed through Shannon diversity index, which shows the perfect homogeneity at 0 and perfect heterogeneity at ‘1’. (Table 2) shows that inequalities in indicators of women’s empowerment by state in which varied from 0.483 to 0.998. Results presented in (Table 2) shows that Northeastern states, Goa and Sikkim have lower inequality about with regard to ownership of house/land compared to states in the northern part of India. While comparing inequalities in empowerment indicators of the north and the central part of India, it has been found that women from north Indian states have higher inequality in comparison to women from central parts of India. Furthermore, women from southern and western parts of the country also face the maximum inequality to have a different dimension of women empowerment. Moreover, smaller states have lower inequality; however, bigger states have higher inequality regarding women empowerment indicators which may be primarily due to gradual diffusion of social change, values and norms, which originates from the state capitals or more developed urban areas and moving to the peripheral regions with a time lag.
Int J Women’s Health Care, 2017 Volume 2 | Issue 2 | 5 of 16
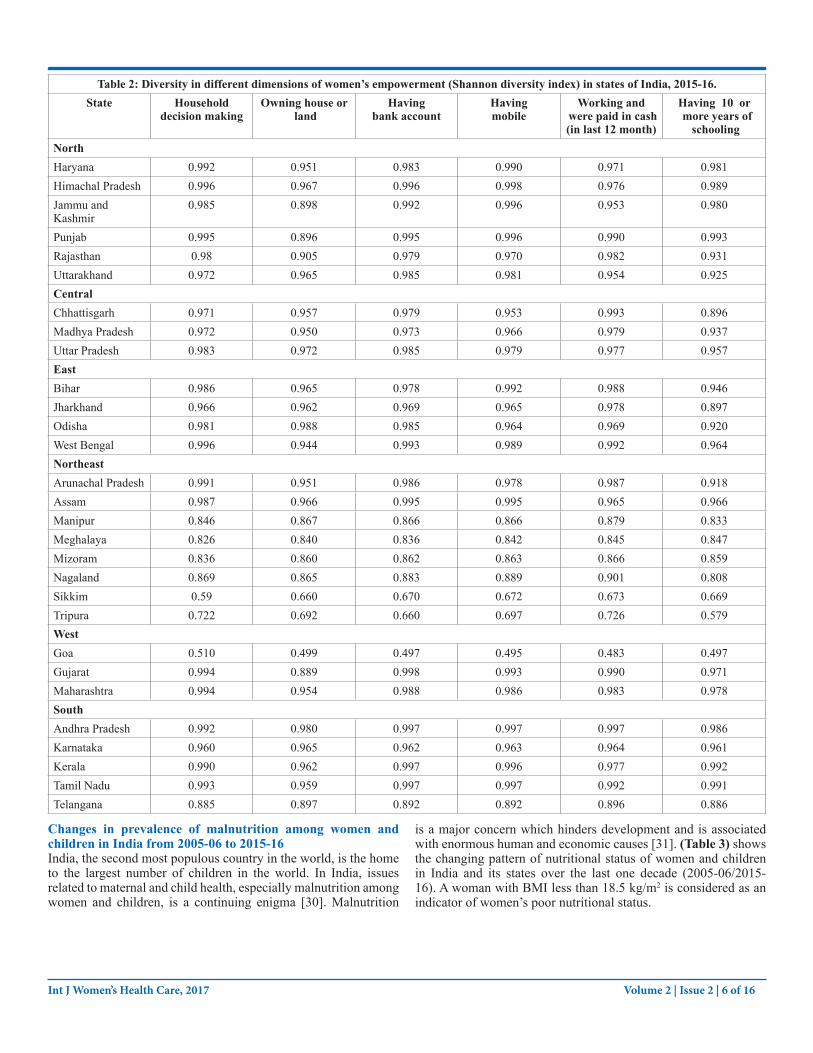
Table 2: Diversity in different dimensions of women’s empowerment (Shannon diversity index) in states of India, 2015-16.State Household
decision makingOwning house or
landHaving
bank accountHavingmobile
Working and were paid in cash (in last 12 month)
Having 10 or more years of
schoolingNorthHaryana 0.992 0.951 0.983 0.990 0.971 0.981Himachal Pradesh 0.996 0.967 0.996 0.998 0.976 0.989Jammu and Kashmir
0.985 0.898 0.992 0.996 0.953 0.980
Punjab 0.995 0.896 0.995 0.996 0.990 0.993Rajasthan 0.98 0.905 0.979 0.970 0.982 0.931Uttarakhand 0.972 0.965 0.985 0.981 0.954 0.925CentralChhattisgarh 0.971 0.957 0.979 0.953 0.993 0.896Madhya Pradesh 0.972 0.950 0.973 0.966 0.979 0.937Uttar Pradesh 0.983 0.972 0.985 0.979 0.977 0.957EastBihar 0.986 0.965 0.978 0.992 0.988 0.946Jharkhand 0.966 0.962 0.969 0.965 0.978 0.897Odisha 0.981 0.988 0.985 0.964 0.969 0.920West Bengal 0.996 0.944 0.993 0.989 0.992 0.964NortheastArunachal Pradesh 0.991 0.951 0.986 0.978 0.987 0.918Assam 0.987 0.966 0.995 0.995 0.965 0.966Manipur 0.846 0.867 0.866 0.866 0.879 0.833Meghalaya 0.826 0.840 0.836 0.842 0.845 0.847Mizoram 0.836 0.860 0.862 0.863 0.866 0.859Nagaland 0.869 0.865 0.883 0.889 0.901 0.808Sikkim 0.59 0.660 0.670 0.672 0.673 0.669Tripura 0.722 0.692 0.660 0.697 0.726 0.579WestGoa 0.510 0.499 0.497 0.495 0.483 0.497Gujarat 0.994 0.889 0.998 0.993 0.990 0.971Maharashtra 0.994 0.954 0.988 0.986 0.983 0.978SouthAndhra Pradesh 0.992 0.980 0.997 0.997 0.997 0.986Karnataka 0.960 0.965 0.962 0.963 0.964 0.961Kerala 0.990 0.962 0.997 0.996 0.977 0.992Tamil Nadu 0.993 0.959 0.997 0.997 0.992 0.991Telangana 0.885 0.897 0.892 0.892 0.896 0.886
Changes in prevalence of malnutrition among women and children in India from 2005-06 to 2015-16India, the second most populous country in the world, is the home to the largest number of children in the world. In India, issues related to maternal and child health, especially malnutrition among women and children, is a continuing enigma [30]. Malnutrition
is a major concern which hinders development and is associated with enormous human and economic causes [31]. (Table 3) shows the changing pattern of nutritional status of women and children in India and its states over the last one decade (2005-06/2015-16). A woman with BMI less than 18.5 kg/m2 is considered as an indicator of women’s poor nutritional status.
Int J Women’s Health Care, 2017 Volume 2 | Issue 2 | 6 of 16

Table 3: Changes in prevalence of nutritional status of women and children from NFHS-3 to NFHS-4 in India and states, 2005-16.
State Women BMI <18.5 Stunting UnderweightNFHS-3 NFHS-4 NFHS-3 NFHS-4 NFHS-3 NFHS-4
NorthHaryana 31.4 15.8 45.7 34.0 39.6 29.4Himachal Pradesh
29.9 16.2 38.6 26.3 36.5 21.2
Jammu and Kashmir
28.0 11.5 35.0 27.4 25.6 16.6
Punjab 18.9 11.7 36.7 25.7 24.9 21.6Rajasthan 36.7 27.0 43.7 39.1 39.9 36.7Uttarakhand 30.0 18.4 44.4 33.5 38.0 26.6CentralChhattisgarh 43.4 26.7 52.9 37.6 47.1 37.7Madhya Pradesh 41.7 28.3 50.0 50.0 60.0 42.8Uttar Pradesh 36.0 25.3 56.8 46.3 42.4 39.5EastBihar 45.0 30.4 55.6 48.3 55.9 43.9Jharkhand 42.9 31.5 49.8 45.3 56.5 47.8Odisha 41.4 26.4 45.0 34.1 40.7 34.4West Bengal 39.1 21.3 44.6 32.5 38.7 31.5 NortheastArunachal Pradesh
16.4 8.5 43.3 29.4 32.5 19.5
Assam 36.5 25.7 46.5 36.4 36.4 29.8Manipur 14.8 8.8 35.6 28.9 22.2 13.8Meghalaya 14.6 12.1 55.1 43.8 48.8 29Mizoram 14.4 8.3 39.8 28.0 19.9 11.9Nagaland 17.4 12.2 38.8 28.6 25.2 16.8Sikkim 11.2 6.4 38.3 29.6 19.7 14.2Tripura 36.9 18.9 35.7 24.3 39.6 24.1WestGoa 27.9 14.7 25.6 20.1 25.0 23.8Gujarat 36.3 27.2 51.7 38.5 44.6 39.3Maharashtra 36.2 23.5 46.3 34.4 37.0 36.0Andhra Pradesh 30.8 17.6 38.4 31.4 29.8 31.9Karnataka 35.4 20.7 43.7 36.2 37.6 35.2Kerala 18.0 9.7 24.5 19.7 22.9 16.9Tamil Nadu 28.4 14.6 30.9 27.1 29.8 23.8Telangana - 23.1 - 28.1 - 28.5India 35.5 22.9 48 38.4 42.5 35.7
Int J Women’s Health Care, 2017 Volume 2 | Issue 2 | 7 of 16
(Table 3) shows that percentage of women having poor nutritional status (BMI<18.5 kg/m2) has declined by almost 13 percent points in India over the last decade (36% to 23%). The percentage decline in nutritional status is varied consistent across states. Meghalaya, Sikkim, Nagaland, Manipur, Arunachal Pradesh, Assam and Mizoram are some of the northeastern states which have shown minimum decline in the percentage of undernourished women in the last decade. It may be noted that the proportion of undernourished women in these states was low in both rounds of the survey (NFHS-3 and NFHS-4). Except to other northeastern states, Tripura is the state which has relatively higher proportion of undernourished women in both rounds of NFHS and maximum decline in undernourished women. In some of the north Indian states, Gujarat and Maharashtra the proportion of women with less than normal BMI is quite high in both rounds of NFHS though the decline over the last decade is considerable. Among the southern states, Andhra Pradesh, Tamil Nadu, and Karnataka have shown maximum decline and in Kerala the decline is minimum. Moreover, rest of the states like Odisha, Haryana, Jammu & Kashmir, Chhattisgarh and West Bengal shows a relatively higher reduction in women with less than normal BMI.
The study has considered stunting and underweight as the nutritional indicators for children under age five years. (Table 3) further shows a decline of approximately 10 percent points in stunted children and 8 percentage points decline in underweight children in India from NFHS-3 to NFHS-4. The study found that all the states have experienced a decline in undernourished children from 2005 to 2016. The proportion of stunted children also reduced from NFHS-3 to NFHS-4 in all states. In some states like- Kerala, Goa, Tamil Nadu, Jammu & Kashmir, Manipur, Sikkim, and Andhra Pradesh the decline in percentage of stunted children is marginal though it should be noted that the percentage of stunted children was also low in these states in both NFHS-3 and NFHS-4. Karnataka, Rajasthan, Jharkhand and Madhya Pradesh are the states which have large proportion of stunted children but seen lower reduction. Moreover states like- Tripura, Punjab, Himachal Pradesh, Arunanchal Pradesh, West Bengal, Gujarat, Chhattisgarh, and Meghalaya have seen the moderate to large reduction in stunted children, however the share of stunted children was highest in these states. Like stunted children, percent of underweight children also have been declined from 2005 to 2016 in all states of India, except Andhra Pradesh (increases by 2 percent point). A very sharp reduction in underweight children has been seen in Meghalaya (reduced by 20 % point) Madhya Pradesh (reduced by 17% point) and Tripura (reduced by 16 % point); however the proportion of underweight children was higher in these states. Contrary to this, states like- Sikkim, Kerala, Punjab, Goa and Tamil Nadu have the relatively lower proportion of underweight children in NFHS-3 and NFHS-4 though the reduction in underweight children is low in these states. Furthermore, Assam, Maharashtra, Karnataka, Rajasthan, Odisha and Uttar Pradesh are the states with high proportion of underweight children however lower reduction in underweight children during 2005 to 2016.
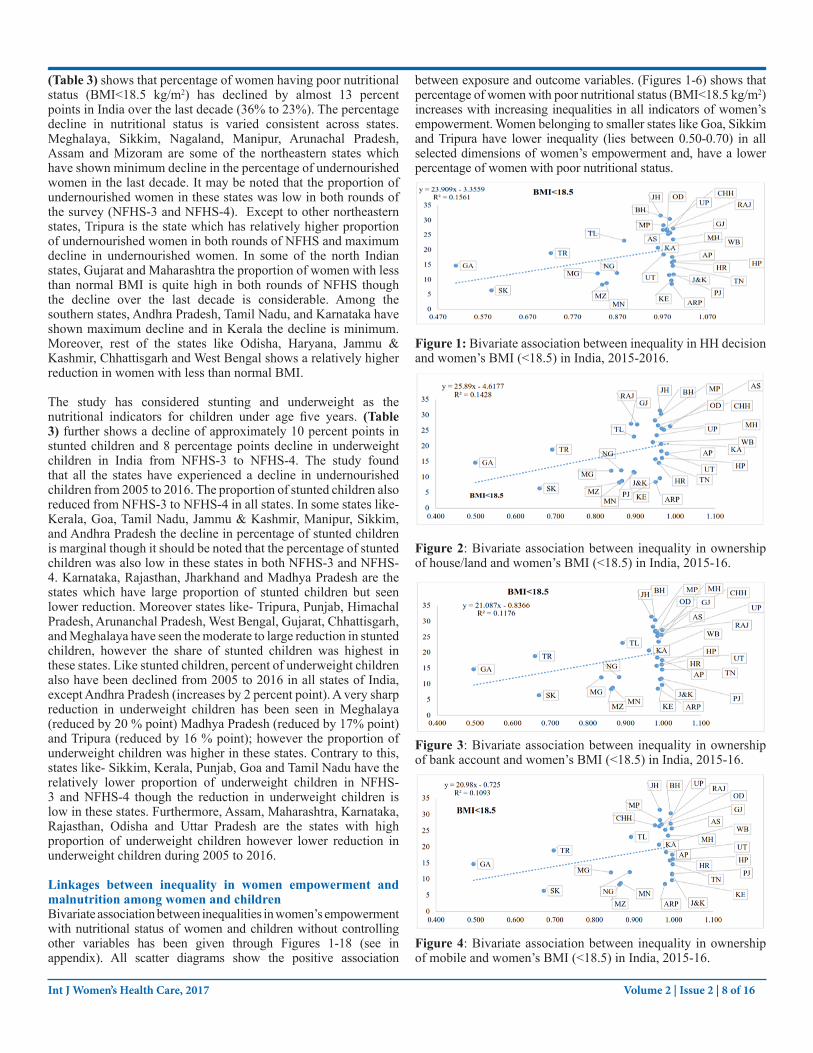
Linkages between inequality in women empowerment and malnutrition among women and childrenBivariate association between inequalities in women’s empowerment with nutritional status of women and children without controlling other variables has been given through Figures 1-18 (see in appendix). All scatter diagrams show the positive association
between exposure and outcome variables. (Figures 1-6) shows that percentage of women with poor nutritional status (BMI<18.5 kg/m2) increases with increasing inequalities in all indicators of women’s empowerment. Women belonging to smaller states like Goa, Sikkim and Tripura have lower inequality (lies between 0.50-0.70) in all selected dimensions of women’s empowerment and, have a lower percentage of women with poor nutritional status.
Figure 1: Bivariate association between inequality in HH decision and women’s BMI (<18.5) in India, 2015-2016.
Figure 2: Bivariate association between inequality in ownership of house/land and women’s BMI (<18.5) in India, 2015-16.
Figure 3: Bivariate association between inequality in ownership of bank account and women’s BMI (<18.5) in India, 2015-16.
Figure 4: Bivariate association between inequality in ownership of mobile and women’s BMI (<18.5) in India, 2015-16.
Int J Women’s Health Care, 2017 Volume 2 | Issue 2 | 8 of 16

Figure 5: Bivariate association between inequality in working status (who were paid in cash in last 12 months) and women’s BMI (<18.5) in India, 2015-16.
Figure 6: Bivariate association between inequality in women’s at least 10 years of schooling with women’s BMI (<18.5) in India, 2015-16.
However, remained northeastern states (Meghalaya, Manipur, Nagaland and Mizoram), some North Indian states (Haryana, Jammu & Kashmir, Himachal Pradesh, and Punjab) and some south Indian states (Tamil Nadu, Kerala) have relatively high inequality in various dimensions of women empowerment with lower percent of women less than normal BMI. Rest of the states reflects higher inequality in empowerment indicators with the higher proportion of women less than normal BMI. Likewise to women BMI, a positive association has been found between inequality in empowerment indicators with childhood stunting (Figures 7-12) and underweight (Figures 13-18).
Figure 7: Bivariate association between inequalities in HH decision with childhood stunting in India, 2015-16.
Figure 8: Bivariate association between inequalities in ownership of house/land with childhood stunting in India, 2015-16.
Figure 9: Bivariate association between inequalities in bank account with childhood stunting in India, 2015-16.
Figure 10: Bivariate association between inequalities in use of mobile phone with childhood stunting in India, 2015-16.
Figure 11: Bivariate association between inequalities in working status (who was paid in cash in last 12 months) with childhood stunting in India, 2015-16.
Fgure 12: Bivariate association between inequalities in women’s at least 10 years of schooling with childhood stunting in India, 2015-16.
Figure 13: Bivariate association between inequalities in HH decision with childhood underweight in India, 2015-16.
Int J Women’s Health Care, 2017 Volume 2 | Issue 2 | 9 of 16
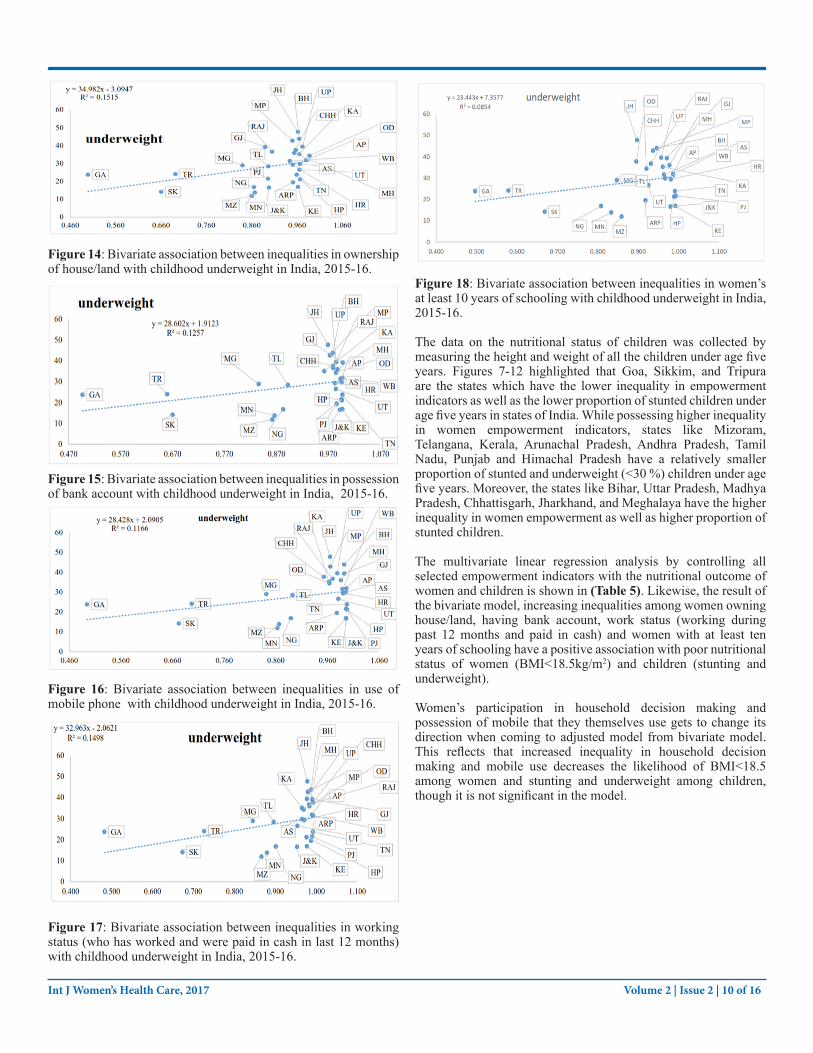
Figure 14: Bivariate association between inequalities in ownership of house/land with childhood underweight in India, 2015-16.
Figure 15: Bivariate association between inequalities in possession of bank account with childhood underweight in India, 2015-16.
Figure 16: Bivariate association between inequalities in use of mobile phone with childhood underweight in India, 2015-16.
Figure 17: Bivariate association between inequalities in working status (who has worked and were paid in cash in last 12 months) with childhood underweight in India, 2015-16.
Figure 18: Bivariate association between inequalities in women’s at least 10 years of schooling with childhood underweight in India, 2015-16.
The data on the nutritional status of children was collected by measuring the height and weight of all the children under age five years. Figures 7-12 highlighted that Goa, Sikkim, and Tripura are the states which have the lower inequality in empowerment indicators as well as the lower proportion of stunted children under age five years in states of India. While possessing higher inequality in women empowerment indicators, states like Mizoram, Telangana, Kerala, Arunachal Pradesh, Andhra Pradesh, Tamil Nadu, Punjab and Himachal Pradesh have a relatively smaller proportion of stunted and underweight (<30 %) children under age five years. Moreover, the states like Bihar, Uttar Pradesh, Madhya Pradesh, Chhattisgarh, Jharkhand, and Meghalaya have the higher inequality in women empowerment as well as higher proportion of stunted children.
The multivariate linear regression analysis by controlling all selected empowerment indicators with the nutritional outcome of women and children is shown in (Table 5). Likewise, the result of the bivariate model, increasing inequalities among women owning house/land, having bank account, work status (working during past 12 months and paid in cash) and women with at least ten years of schooling have a positive association with poor nutritional status of women (BMI<18.5kg/m2) and children (stunting and underweight).
Women’s participation in household decision making and possession of mobile that they themselves use gets to change its direction when coming to adjusted model from bivariate model. This reflects that increased inequality in household decision making and mobile use decreases the likelihood of BMI<18.5 among women and stunting and underweight among children, though it is not significant in the model.
Int J Women’s Health Care, 2017 Volume 2 | Issue 2 | 10 of 16

Table 5: Multivariate linear regression for women’s and childhood nutritional status across the states of India, 2015-16.Inequality in indicators of women empowerment
BMI<18.5 Stunting Underweight
Coefficients P-value Coefficients P-value Coefficients P-valueIntercept -0.72 0.27
R2 = 0.266
0.01 0.93
R2= 0.101
-1.0 0.22
R2= 0.252
Household decision making
-1.69 0.61 -1.40 0.70 -1.50 0.73
Owning House or Land
0.47 0.35 -0.02 0.96 0.55 0.41
Having bank account
1.14 0.54 0.92 0.65 1.26 0.61
Having mobile -0.82 0.62 1.01 0.58 -0.97 0.66Working and were paid in cash (in last 12 months)
1.62 0.22 0.33 0.82 1.89 0.28
Having at least 10 years of schooling
0.24 0.57 -0.58 0.22 0.19 0.73
DiscussionsThis study provided evidence by demonstrating the association between inequality in indicators of women’s empowerment with nutritional status of women and children in India. The study found that inequality in women’s empowerment in terms of owning a house/land, having a bank account, having at least ten years of schooling and working in the past 12 months and paid in cash have a positive association with women’s and children’s nutritional status. This relationship holds true even after controlling the effect of other indicators of empowerment in the regression model. This finding corroborated the findings from earlier research [8, 10,25,26]. Further, the bivariate association between inequality in household decision making and bank account shows a positive relationship with nutritional status of women and children (Table 4) but this direction gets reversed in the regression model. The study further highlighted that autonomy in household decision making is positively and strongly correlated with having bank account, having a mobile phone that women uses herself and working during last 12 months and paid in cash (Table 4). Additionally, there exists high correlation between possession of bank account and mobile phone for their own use. But some states like Manipur and Nagaland, women have good access of cell phone and less ownership of bank account, which they can use independently. Conversely, at least ten years of schooling of women is weakly correlated with ownership of house/land and working status (who were paid in cash in last 12 months) (r2=0.22) (Table 4).
Table 4: Correlation matrix between different dimensions of women empowerment in India, 2015-16.Household decision making
Owning house/ land
Havingbank account
Having mobile Working and Were paid in cash (in last 12 months)
Having at least 10 years of schooling
Household decision making 1.00Owning House or Land 0.64 1.00Having bank account 0.96 0.68 1.00Having mobile 0.94 0.50 0.90 1.00Working and were paid in cash (in last 12 months)
0.79 0.64 0.71 0.63 1.00
Having at least 10 years of schooling
0.63 0.22 0.67 0.73 0.22 1.00
The study found that Goa is the only state, which shows the lowest inequality in all dimensions of women empowerment and has minimum share of undernourished women and children. Also, the percentage of women who own house/land and earned in cash (in last 12 months) is also quite low in Goa. The possible reasons for this could be that Goa is a small state and is one of the few developed states of India where women’s status is considerably high on the west coast of India, which has attracted much attention, as it features prominently on the national as well as international holiday seekers’ map. Possibly because of its geography, history or its cultural amalgamation, Goa has also earned a reputation for being a unique Indian state. Furthermore, the human development
indicators such as high per capita income, high literacy rate, low fertility rate, low infant mortality rate and universal knowledge of contraception are often used to highlight the advantageous position of women in Goa, particularly when the same are compared with that of other Indian states.
In the northeastern part of the country, Sikkim and Tripura are the states with higher equity (60-70%) in women empowerment indicators compare to other northeastern states (83-98%). Moreover, these states have the lower proportion of undernourished women. These findings are consistent with another study [32]. While looking at level of empowerments indicators, it has been
Int J Women’s Health Care, 2017 Volume 2 | Issue 2 | 11 of 16
found that women’s autonomy on household decision and control over the ownership of house/land is high in the northeastern states, where more than 86 percent of women have control over the household decision making and more than 50 percent of women own house/land. Further, results also highlight that the proportion of undernourished children is relatively small in the northeastern region. Possible reason might be the fair distribution of vitamin A supplement, coverage of immunization, effective programs to promote good health of women and child are better in northeastern states than all Indian average [33,34]. Moreover, women from the northeastern states have the good breastfeeding and vitamin A rich food that is why the nutritional status of northeast children shows the relative better result of stunting and underweight [35].
Southern states having very high inequality in indicators of women’s empowerment, while possess small proportion of undernourished women and children. When looking at level of empowerment indicators it has been found that, except the women’s participation in household decision making, all 5 dimensions of empowerment have low to moderate coverage. Additionally, some more states like-Uttarakhand, Haryana, Jammu & Kashmir, Himachal Pradesh, Punjab, have a relatively lower proportion of undernourished women and children. However, the level of empowerment indicators is very low while inequality is high in these states. The justified reason might be that, these are the state which ranked at top 10 states with a higher proportion of female obesity; therefore, these states contributes a minimum share of women with less than normal BMI. Providing food outside of the home, first introduced in the southern states of India. Notably, southern states are already reached at the second stage of demographic transition, where TFR is low, family planning is good, education is high and many nutritional programmes run very well. Additionally, mid-day meal program was first introduced in Tamil Nadu and Kerala. ICDS, MNP and Tamil Nadu integrated nutrition project (TINP) which was for rural women, which offers food and health services to children under age five years, pregnant and lactating women. Government commitments, attention on detailed program planning, accountability targeted services delivery and quality supervision played a decisive role in the better nutritional status of women and children.
In contrast, the remaining bigger states like Madhya Pradesh, Bihar, Jharkhand, Orissa, Uttar Pradesh, Chhattisgarh, Rajasthan, Gujarat, Maharashtra and West Bengal have high inequality in empowerment indicators and, have a higher proportion of underweight women. These larger states of India have the higher number of districts and, the status of women which has been access through women empowerment is quite low in these states. Except West Bengal, Gujarat and Maharashtra other states belong to Empowered Action Group States, which already have poor demographic profile in terms of health and nutrition. However, for the states like West Bengal and Orissa nutritional imbalance might be the one possible reason. For instance, food pattern like, rice and sweats are the staple food and it is very rare to see meals without sweets and rice in these states. Furthermore, for the states like Jharkhand, Chhattisgarh and Madhya Pradesh, majority of the population are tribal, where the sexual violence is high.
Furthermore, it has been seen that since last two years food production in Maharashtra has been affected by numbers of droughts in several parts of states, which directly affected the nutrition of individuals. Furthermore, the study indicates that in these state BMI is a function of development and that narrow,
person-level, health-focused solutions may not succeed in reducing variability in this measure [36]. This reason may be arising from the lack of knowledge of child feeding practices which is affected by different socio-economic characteristic. Food security at household level at proper food distribution system and availability of health facility are the important factors which positively affects the nutritional status of women. These findings are also in the queue of the studies which found the relationship between women empowerment and childhood under nutrition (stunting and underweight) [8,12,23,25,26,37,].
Strategies to minimize the missed opportunities to address cofactors of malnutrition among childrenMaternal and child health (MCH) programmes were started for providing medical and social services to mothers and children. These programmes have been highly effective when they were implemented as part of the National Rural Health Mission (NRHM). Some of the schemes launched under this were Janani Surakhacha Yojna (JSY), Universal Immunization Program (UIP) and Integrated Child Development Services (ICDS). These initiatives have resulted into substantial reduction in maternal deaths, promoted child survival and safe motherhood, and ensured the birth of a healthy child through strengthening of components of maternal health care like antenatal care checkups (ANC), institutional delivery, postnatal checkups (PNC), etc. and immunization programs. It is worth mentioning that these programmes and services have also provided an opportunity to enhance contact with health personnel during prenatal, delivery and postnatal care and immunization. Health personnel provide a range of services for both the mother and child. They provide knowledge about maternal nutrition, importance of colostrum’s feeding and exclusive breastfeeding, and other child feeding practices.
Over the years there has been growing evidence suggesting association between colostrum’s feeling, increasing immunities against childhood morbidities and nutritional status of children. Therefore increasing prevalence of institutional deliveries may be the best strategy to minimize the missed opportunity to address this issue. Table 6 shows the gap between institutional births and colostrums feeding for India and its states. Level of institutional delivery has improved from 39 percent to 79 percent during the last decade. There is considerable improvement in colostrum’s feeding (increased from 23% to 42%) during the last decade but there is still a large gap. As per NFHS-4 results, the gap between institutional delivery has increased 15 to 37 percent points during these time. The difference is substantial in Punjab (60 percentage points), Rajasthan (56 percentage points), Telangana (54 percentage points) and Andhra Pradesh (52 percentage points). The gap between intuitional delivery and colostrum’s feeding has widened during the last decade mainly due to great improvement in institutional deliveries in these states from during last one decade. However, the difference is minimum in Manipur, Assam, and Mizoram and in Arunachal Pradesh, Meghalaya, and Nagaland gap is negative, that is, percentage of births receiving colostrum’s feeding is greater that percentage of institutional births. Thus, to minimize the gap between institutional delivery and colostrums feeding, strategies to make sure active involvement of health care providers may be developed. They should be trained to provide counseling and information before and after delivery, which can be achieved without any additional financial burden.
Int J Women’s Health Care, 2017 Volume 2 | Issue 2 | 12 of 16

Int J Women’s Health Care, 2017 Volume 2 | Issue 2 | 13 of 16
Table 6: Potential Opportunity to address missed opportunity during NFHS-3 to NFHS-4 in India and states, 2005-16.State NFHS-3 NFHS-4 NFHS-3 NFHS-4
Institutional delivery
Colostrums feeding
Institutional delivery
Colostrums feeding
3+DPT Exclusive breastfeeding
3+DPT Exclusive breastfeeding
NorthHaryana 35.7 22.3 80.5 42.4 74.2 16.9 76.5 50.3Himachal Pradesh
43.1 43.4 76.4 41.1 85.1 27.2 85.0 67.2
Jammu and Kashmir
50.2 31.9 85.7 46.0 84.5 42.3 88.1 65.4
Punjab 51.3 10.3 90.5 30.7 70.5 35.7 94.5 53.0Rajasthan 29.6 13.3 84.0 28.4 38.7 33.2 71.6 58.2Uttarakhand 32.6 32.9 68.6 27.8 67.1 31.2 80.0 51.0CentralChhattisgarh 14.3 24.6 70.2 47.1 62.8 82.0 91.4 77.2Madhya Pradesh
26.2 14.9 80.8 34.5 49.8 21.6 73.4 58.2
Uttar Pradesh 20.6 7.2 67.8 25.2 30.0 51.3 66.5 41.6EastBihar 19.9 4.0 63.8 34.9 46.1 28.0 80.2 53.5Jharkhand 18.3 10.9 61.9 33.2 40.3 57.8 82.4 64.8Odisha 35.6 54.4 85.4 68.6 67.9 50.8 89.2 65.6West Bengal 42.0 23.7 75.2 47.5 71.5 58.6 92.7 52.3NortheastArunachal Pradesh
28.5 55.0 52.3 58.7 39.3 60.0 52.3 56.5
Assam 22.4 50.7 70.6 64.4 44.9 63.1 66.5 63.5Manipur 45.9 57.2 69.1 65.4 61.2 62.1 77.8 73.6Meghalaya 29.0 58.6 51.4 60.6 47.3 26.3 74.0 35.8Mizoram 59.8 65.5 80.1 70.2 66.8 46.1 61.7 60.6Nagaland 11.6 51.4 32.8 53.2 28.7 29.5 52.0 44.5Sikkim 47.2 43.3 94.7 66.5 84.3 37.2 93.0 54.6Tripura 46.9 33.1 79.9 44.4 60.2 36.1 71.1 70.7WestGoa 92.3 59.7 96.9 73.3 87.5 17.7 94.2 60.9Gujarat 52.7 27.1 88.7 50.0 61.4 47.8 72.7 55.8Maharashtra 64.6 51.8 90.3 57.5 76.1 53.0 74.9 56.6SouthAndhra Pradesh
68.6 22.4 91.6 40.1 61.0 63.0 89.0 70.2
Karnataka 64.7 35.6 94.3 56.4 74.0 58.6 77.9 54.2Kerala 99.3 55.4 99.9 64.3 84.0 56.2 90.4 53.3Tamil Nadu 87.8 55.2 99.0 54.7 95.7 34.1 84.5 48.3Telangana - - 91.5 37.1 - - 87.9 67.3India 38.7 23.4 78.9 41.6 55.3 40.6 78.4 44.9
Int J Women’s Health Care, 2017 Volume 2 | Issue 2 | 14 of 16
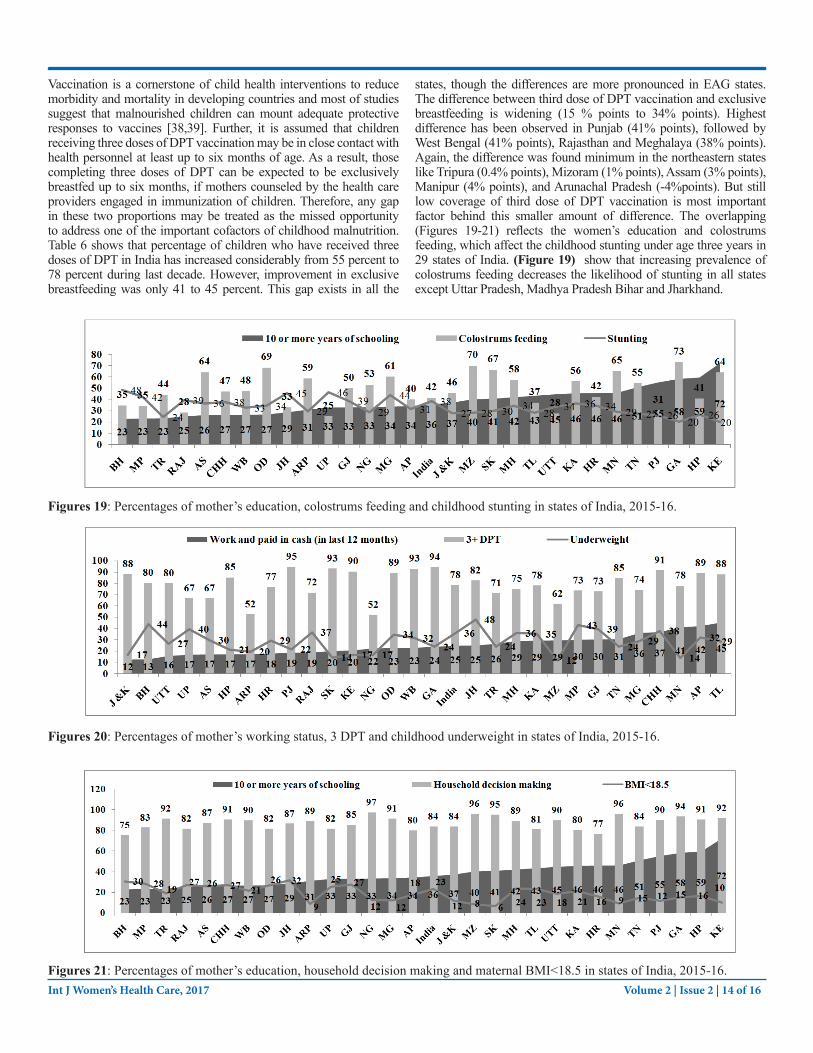
Vaccination is a cornerstone of child health interventions to reduce morbidity and mortality in developing countries and most of studies suggest that malnourished children can mount adequate protective responses to vaccines [38,39]. Further, it is assumed that children receiving three doses of DPT vaccination may be in close contact with health personnel at least up to six months of age. As a result, those completing three doses of DPT can be expected to be exclusively breastfed up to six months, if mothers counseled by the health care providers engaged in immunization of children. Therefore, any gap in these two proportions may be treated as the missed opportunity to address one of the important cofactors of childhood malnutrition. Table 6 shows that percentage of children who have received three doses of DPT in India has increased considerably from 55 percent to 78 percent during last decade. However, improvement in exclusive breastfeeding was only 41 to 45 percent. This gap exists in all the
states, though the differences are more pronounced in EAG states. The difference between third dose of DPT vaccination and exclusive breastfeeding is widening (15 % points to 34% points). Highest difference has been observed in Punjab (41% points), followed by West Bengal (41% points), Rajasthan and Meghalaya (38% points). Again, the difference was found minimum in the northeastern states like Tripura (0.4% points), Mizoram (1% points), Assam (3% points), Manipur (4% points), and Arunachal Pradesh (-4%points). But still low coverage of third dose of DPT vaccination is most important factor behind this smaller amount of difference. The overlapping (Figures 19-21) reflects the women’s education and colostrums feeding, which affect the childhood stunting under age three years in 29 states of India. (Figure 19) show that increasing prevalence of colostrums feeding decreases the likelihood of stunting in all states except Uttar Pradesh, Madhya Pradesh Bihar and Jharkhand.
Figures 19: Percentages of mother’s education, colostrums feeding and childhood stunting in states of India, 2015-16.
Figures 20: Percentages of mother’s working status, 3 DPT and childhood underweight in states of India, 2015-16.
Figures 21: Percentages of mother’s education, household decision making and maternal BMI<18.5 in states of India, 2015-16.

Int J Women’s Health Care, 2017 Volume 2 | Issue 2 | 15 of 16
The findings of this study need to be considered in the context of its limitations and strength. Due to the unavailability of individual level data one can only talk about state level association between exposure and outcome variables, instead of unit level association. On the other hand, the strength of the study is that it is based on a recent large scale nationwide household survey in which for the first-time information about various dimensions of women’s empowerment have been collected and findings are available at the state level and for the country as a whole.
Conclusions The study concluded that inequalities in different dimensions of women’s empowerment at the state level are associated with women’s as well as child nutritional status. Based on the results of this study, researchers, programme managers and policy makers who are working on improving maternal and child nutritional status in India should pay attention to some specific dimensions of women’s empowerment such as autonomy to own house/land, have a bank account and possession of mobile phone which they can use independently. Further, the focus should be given to improve the educational attainment of women in society, because reduced inequality in education can solely mitigate the inequality in other dimensions of empowerment.
The present study does not confirm the causal association; therefore further research should be done to test the gains in women and child nutritional status that can be achieved by some targeted interventions which aim to improve these specific aspects of women’s empowerment in India. Additional research can also be done to see whether the relationships between inequality in women’s empowerment and women and child nutritional status which are also found in other South Asian contexts. Research from the different corners of the world gauges the different information related to women’s empowerment and concluded that the women’s empowerment in any direction directly improves welfare and health of women and children through greater food security and income. Better child health outcome will come from side of women, rather than men alone by making key household decisions.
Ethical approval and consent to participateThis analysis is based on a secondary dataset with no identifiable information on the survey participants. This dataset is available in public domain for research use hence no approval was required from any institutional review board as there is no question of human subject protection arising in this case.
Authors’ contributionsSKS conceived the idea. SKS, SS designed the experiment, analyzed it, interpreted the results and drafted the first round of manuscript. SKS, SS, YV, JG, G drafted second round of manuscript. All the authors read and approved the final manuscript.
References1. Kapoor, Shruti (2010) Infant mortality rates in India: District
level variations and correlations. Paper presented at the 6th Annual Conference on Growth and Development.
2. De Onis, Mercedes, Blössner, Monika, Borghi, et al. (2004) Methodology for estimating regional and global trends of child malnutrition 33: 1260-1270.
3. Lakshminarayanan, Subitha, Jayalakshmy, Ramakrishnan (2015) Diarrheal diseases among children in India: current
scenario and future perspectives. Journal of natural science, biology, and medicine 6: 24.
4. Mandal, Ananya (2012) [Causes of malnutrition].5. Gupta VP (2017) [Article on Women Empowerment |Essay on
Women Empowerment].6. UNDP (2016) Women’s Empowerment. 7. USAID (2014) Understanding the Women’s Empowerment Pathway
IMPROVING NUTRITION THROUGH AGRICULTURE TECHNICAL BRIEF SERIES.
8. Bhagowalia Priya, Headey Derek, Kadiyala Suneetha (2012) Agriculture, income, and nutrition linkages in India.
9. Lisa C, Ramakrishnan, Usha, Ndiaye, Aida, et al. (2003) The importance of women’s status for child nutrition in developing countries.
10. Engle, Patrice L (1993) Influences of mothers’ and fathers’ income on children’s nutritional status in Guatemala. Social Science & Medicine 37: 1303-1312.
11. Fafchamps, Marcel, Kebede, Bereket, Quisumbing, et al. (2009) intrahousehold welfare in rural Ethiopia. Oxford Bulletin of Economics and Statistics 71: 567-599.
12. Frost, Michelle Bellessa, Forste, Renata, Haas, et al. (2005) Maternal education and child nutritional status in Bolivia: finding the links. Social science & medicine, 60: 395-407.
13. Guha-Khasnobis, Basudeb, Hazarika, Gautam (2006) Women’s status and children’s food security in Pakistan. Food Security, 95.
14. Kennedy, Eileen, Peters, Pauline (1992) Household food security and child nutrition: the interaction of income and gender of household head. World development, 20: 1077-1085.
15. Smith, Lisa C (2003) The importance of women’s status for child nutrition in developing countries: Intl Food Policy Res Inst 131.
16. Smith, Lisa C, Haddad, Lawrence James (2000) Explaining child malnutrition in developing countries: A cross-country analysis: Intl Food Policy Res Inst 111.
17. Thomas, Duncan (1990) Intra-household resource allocation: An inferential approach. Journal of human resources 635-664.
18. Herforth, Anna, Jones, Andrew, Pinstrup-Andersen, Per (2012) Prioritizing nutrition in agriculture and rural development: guiding principles for operational investments. Health, Nutrition and Population Discussion Paper Series. Washington, DC: World Bank.
19. Ruel, Marie T, Alderman, Harold, Maternal, Group, Child Nutrition Study (2013) Nutrition-sensitive interventions and programmes: how can they help to accelerate progress in improving maternal and child nutrition? The Lancet, 382: 536-551.
20. Smith Lisa C, Khan Faheem, Frankenberger Timothy R, Wadud AKM Abdul (2013) Admissible evidence in the court of development evaluation? The impact of CARE’s SHOUHARDO project on child stunting in Bangladesh. World Development, 41: 196-216.
21. UNICEF (2011)22. Åsling-Monemi Kajsa, Peña Rodolfo, Ellsberg Mary Carroll,
Person Lars Åke (2003) Violence against women increases the risk of infant and child mortality 81: 10-16.
23. Sobkoviak, Rudina M, Yount, Kathryn M, Halim, Nafisa (2012) Domestic violence and child nutrition in Liberia. Social science & medicine, 74: 103-111.
24. Ziaei Shirin, Naved Ruchira Tabassum, Ekström Eva-

Charlotte (2014) Women’s exposure to intimate partner violence and child malnutrition: findings from demographic and health surveys in Bangladesh. Maternal & child nutrition, 10: 347-359.
25. Arulampalam Wiji, Bhaskar Anjor, Srivastava Nisha (2016) Does greater autonomy among women provide the key to better child nutrition?
26. Shroff Monal R, Griffiths Paula L, Suchindran Chirayath, Nagalla Balakrishna, Vazir, Shahnaz, et al. (2011). Does maternal autonomy influence feeding practices and infant growth in rural India? Social science & medicine, 73: 447-455.
27. Bloom Shelah S, Wypij David, Gupta Monica Das (2001) Dimensions of women’s autonomy and the influence on maternal health care utilization in a north Indian city. Demography, 38: 67-78.
28. Kishor Sunita (2000) Empowerment of women in Egypt and links to the survival and health of their infants.
29. Mondal Puja (2015) Essay on Women Empowerment in India. Young Article Library.
30. Million Death Study (2010) Causes of neonatal and child mortality in India: a nationally representative mortality survey (Vol. 376, pp. 1853-1860). The Lancet.
31. Horton Susan (1999) Opportunities for investments in nutrition in low-income Asia.
32. Hindin M. J (2000) Women’s power and anthropometric status in Zimbabwe. Soc Sci Med, 51: 1517-1528.
33. National Family Health Survey (2000) International Institute for Population Sciences, Mumbai.
34. National Family Health Survey (2007) (Vol. 1): International Institute for Population Sciences
35. Lalneizo Dorothy, Reddy Sunita (2010) Health Status of Children in North Eastern States of India. Indian Anthropologis: 37-52.
36. Chockalingam Ravikumar, Raghavan Ramesh, Agrawal Jyotsna, Lama Gyanesh, Lai Hor et al. (2011). Understanding geographic variations in BMI in India.
37. Dávalos María E, Santos Indhira Vanessa (2006) Domestic violence and child nutrition in Latin America.
38. Prendergast, Andrew J (2015) Malnutrition and vaccination in developing countries. Phil. Trans. R. Soc. B, 370: 20140141.
39. Prendergast Andrew J, Humphrey Jean H (2014) The stunting syndrome in developing countries. Paediatrics and international child health, 34: 250-265.
Copyright: ©2017 Swati Srivastava, et al. This is an open-access article distributed under the terms of the Creative Commons Attribution License, which permits unrestricted use, distribution, and reproduction in any medium, provided the original author and source are credited.
Int J Women’s Health Care, 2017 Volume 2 | Issue 2 | 16 of 16