Research Article Highway Expenditures and Associated ...
10
Research Article Highway Expenditures and Associated Customer Satisfaction: A Case Study Alexander Paz, 1 Hanns de la Fuente-Mella, 2 Ashok Singh, 3 Rebecca Conover, 1 and Heather Monteiro 3 1 Department of Civil and Environmental Engineering, University of Nevada, Las Vegas, 4505 S. Maryland Parkway, P.O. Box 454015, Las Vegas, NV 89154, USA 2 Facultad de Ciencias Econ´ omicas y Administrativas, Pontificia Universidad Cat´ olica de Valpara´ ıso, Avenida Brasil 2830, 2340031 Valpara´ ıso, Chile 3 William F. Harrah College of Hotel Administration, University of Nevada, Las Vegas, 4505 Maryland Parkway, Box 6021, Las Vegas, NV 89154-4015, USA Correspondence should be addressed to Hanns de la Fuente-Mella; [email protected] Received 4 January 2016; Accepted 9 March 2016 Academic Editor: Roberto Dominguez Copyright © 2016 Alexander Paz et al. is is an open access article distributed under the Creative Commons Attribution License, which permits unrestricted use, distribution, and reproduction in any medium, provided the original work is properly cited. is study analyzes the satisfaction of the Nevadans with respect to their highway transportation system and the corresponding expenditures of Nevada Department of Transportation (NDOT). A survey questionnaire was designed to capture the opinions of the Nevadans (customers) about a number of characteristics of their transportation system. Data from the financial data warehouse of the NDOT was used to evaluate expenditures. Multinomial probit models were estimated to study the correlations between customers’ opinion and the government expenditures in transportation. e results indicate the customer satisfaction is decreasing with respect to traffic safety throughout Northwestern and Southern Nevada highways. In addition, users of Northwestern highways are more likely to be satisfied, compared to their counterparts, with increasing construction spending to reduce the time taken to complete construction projects. In Southern Nevada highways, customers’ satisfaction increases with the expenditures associated with reduction of congestion. ese insights are examples of the conclusions that were obtained as a consequence of simultaneously considering customer satisfaction and the corresponding expenditures in transportation. 1. Introduction Customer satisfaction surveys help reveal customer desires and preferences and have been widely used by private industries. e private sector typically allocates significant resources to learn what their customers want in order to maximize profits, increase shareholder return, and gain competitive advantage. is approach is rarely used by public entities, even though residents are the main shareholders of public services and deserve to be considered [1]. Despite the immense amount of cost and time allocated to public projects, the public sector has several reasons for its lack of interest in customer input. ese reasons include the monopoly these departments have on service regardless of public support, laws dictating the department’s responsibil- ities, and an “accountability to elected officials,” according to Sorel [1]. In recent years, however, there has been an increased desire to include the public in the decision-making process, based on the desire to “build community, generate support, agreement, and momentum for public actions, remediate democratic and citizenship deficits, address complex gover- nance problems, and take advantage of transformations in the expectations and capacities of ordinary people”. Unfor- tunately, the public does not have significant confidence in government entities. According to Kline [2], a Gallup survey from 1997 showed that 90 percent of respondents believed that ‘people in government waste a lot of money we pay in taxes,’ and that 66 percent of respondents believed that while the American ‘system of government is good, the people running it are incompetent.’ [2] Hindawi Publishing Corporation Mathematical Problems in Engineering Volume 2016, Article ID 4630492, 9 pages http://dx.doi.org/10.1155/2016/4630492
Transcript of Research Article Highway Expenditures and Associated ...

Research ArticleHighway Expenditures and Associated Customer Satisfaction:A Case Study
Alexander Paz,1 Hanns de la Fuente-Mella,2 Ashok Singh,3
Rebecca Conover,1 and Heather Monteiro3
1Department of Civil and Environmental Engineering, University of Nevada, Las Vegas, 4505 S. Maryland Parkway,P.O. Box 454015, Las Vegas, NV 89154, USA2Facultad de Ciencias Economicas y Administrativas, Pontificia Universidad Catolica de Valparaıso, Avenida Brasil 2830,2340031 Valparaıso, Chile3William F. Harrah College of Hotel Administration, University of Nevada, Las Vegas, 4505 Maryland Parkway, Box 6021,Las Vegas, NV 89154-4015, USA
Correspondence should be addressed to Hanns de la Fuente-Mella; [email protected]
Received 4 January 2016; Accepted 9 March 2016
Academic Editor: Roberto Dominguez
Copyright © 2016 Alexander Paz et al. This is an open access article distributed under the Creative Commons Attribution License,which permits unrestricted use, distribution, and reproduction in any medium, provided the original work is properly cited.
This study analyzes the satisfaction of the Nevadans with respect to their highway transportation system and the correspondingexpenditures ofNevadaDepartment of Transportation (NDOT).A survey questionnairewas designed to capture the opinions of theNevadans (customers) about a number of characteristics of their transportation system. Data from the financial data warehouseof the NDOT was used to evaluate expenditures. Multinomial probit models were estimated to study the correlations betweencustomers’ opinion and the government expenditures in transportation.The results indicate the customer satisfaction is decreasingwith respect to traffic safety throughoutNorthwestern and SouthernNevada highways. In addition, users ofNorthwestern highwaysare more likely to be satisfied, compared to their counterparts, with increasing construction spending to reduce the time taken tocomplete construction projects. In Southern Nevada highways, customers’ satisfaction increases with the expenditures associatedwith reduction of congestion.These insights are examples of the conclusions that were obtained as a consequence of simultaneouslyconsidering customer satisfaction and the corresponding expenditures in transportation.
1. Introduction
Customer satisfaction surveys help reveal customer desiresand preferences and have been widely used by privateindustries. The private sector typically allocates significantresources to learn what their customers want in order tomaximize profits, increase shareholder return, and gaincompetitive advantage.This approach is rarely used by publicentities, even though residents are the main shareholders ofpublic services and deserve to be considered [1].
Despite the immense amount of cost and time allocatedto public projects, the public sector has several reasons forits lack of interest in customer input. These reasons includethe monopoly these departments have on service regardlessof public support, laws dictating the department’s responsibil-ities, and an “accountability to elected officials,” according to
Sorel [1]. In recent years, however, there has been an increaseddesire to include the public in the decision-making process,based on the desire to “build community, generate support,agreement, and momentum for public actions, remediatedemocratic and citizenship deficits, address complex gover-nance problems, and take advantage of transformations inthe expectations and capacities of ordinary people”. Unfor-tunately, the public does not have significant confidence ingovernment entities. According to Kline [2], a Gallup surveyfrom 1997 showed that
90 percent of respondents believed that ‘people ingovernment waste a lot of money we pay in taxes,’and that 66 percent of respondents believed thatwhile the American ‘system of government is good,the people running it are incompetent.’ [2]
Hindawi Publishing CorporationMathematical Problems in EngineeringVolume 2016, Article ID 4630492, 9 pageshttp://dx.doi.org/10.1155/2016/4630492

2 Mathematical Problems in Engineering
Without satisfaction surveys, problems such as these maynever be revealed [2].
Customer satisfaction surveys have been used for a longtime to measure public opinion in industry. However, theyare a time consuming and expensive investment. Becauseof this, it is important that the results of these surveys areinterpreted correctly and the results effectively integrated intobusiness operations. If customer input is deemed significantto an industry’s definition of success, it is important that inputis sought often, that decision makers are constantly aware ofthe effects of their decisions on the customer [3], and thatthe customer is made aware of those decisions that will affectthem [1].
In 2000, the Institute of Transportation Engineers (ITE)and the Federal Highway Administration (FHWA) led anational dialogue on transportation operations with stateDepartments of Transportation (DOTs) across the countryto develop a definition of success and a list of perfor-mance indicators, which included results from customersatisfaction surveys [4]. In 2009, the National CooperativeHighway Research Program (NCHRP) and the Transporta-tion Research Board (TRB) commissioned a manual ofguidelines for performing customer satisfaction surveys forDOTs across the country. In total, 31 states were representedin the review, which highlighted the methods, purposes,successes, and failures they experienced when utilizing asurvey [5]. Since this manual was published, DOTs fromover a dozen states throughout the US have conductedsimilar satisfaction surveys, including Nevada in 2009 [6],for the purpose of tracking progress over time or as ameans of comparing strengths and weaknesses with those ofneighboring states. Additionally, the TRB manual providesinformation on various surveymethods available to designersincluding the pros and cons of each [7]. The most expensiveoption, the personal interview, requires a huge investment intraining interviewers but provides the most in-depth results[7].
Independent of initiatives from the public sector, therecan be inconsistent results from customer surveys. Forexample, customersmay feel that safety is the greatest priorityon Nevada roads; simultaneously, they may think that safetyexpenditures may appear to be an inexcusable drain onresources. This disagreement could cause one analyst topromote increased spending on road safety features andanother to promote reduced spending on safety in favor ofother projects, such as adding new roads.
Thus, the intent of this research is to combine theresults of the 2014 Customer Satisfaction Survey and theBusiness Intelligence Review of the Nevada Department ofTransportation (NDOT) financial database. Combining thesurvey responses with the annual expenditure of NDOT hasthe potential of showing where spending has been successfuland where it has been wasteful. With this information,NDOT could plan budgets and allocate funds to addressthe needs of Nevada residents in a more optimal manner.Additionally, the analysis has the potential of being applied toother public departments with limited budgets where publicopinion, not sales, profits, or shareholder constraints, is thepriority.
2. Methodology
Aquestionnaire was designed and implemented to survey theNevadans on their opinions about congestion, construction,maintenance, safety, and funding for state roads. For thissurvey, it was important to determine the differences amongthe three districts within NDOT’s jurisdiction, District 1:Southern Nevada; District 2: Northwestern Nevada; and Dis-trict 3: Northeastern Nevada. Moreover, occupational sub-populations were targeted in the questionnaire and includedbusiness executives, school district employees, firefighters,police officers, tourists and tourism workers, commercialtruck drivers, and warehousing and distribution managers.The respondents answered 24 questions related to experi-ences on the Nevada roads, five demographic questions forweighing and location purposes, and one open-ended ques-tion that allowed for additional suggestions and concerns.
A total of 4,285 survey responses were collected by theCannon SurveyCenter (CSC), operatedwithin theUniversityof Nevada, Las Vegas (UNLV). CSC collected 2,636 responsesby online and telephone surveys. In addition, to reach theoccupational subpopulation goals, 1,649 responses were col-lected from several smaller population groups independentlyfrom the CSC surveys, using a small subcontractor andUNLV’s Transportation Research Center (TRC). The samplesize of each of these subpopulationswas determined to obtaina representative sample for the corresponding size of thesubpopulations using information from the US Bureau ofLabor Statistics [8].
Considering the discrete characteristic of the opinions,various discrete choicemodel specifications were tested seek-ing to better capture the interdependencies between opinionsand potential explanatory variables. Some of the specifica-tions that were tested included logit, mixed-logit, and probitmodels. In this study, the best model results in terms ofhigher explanatory power were obtained using probit spec-ifications. Probit models are characterized by the assumptionof normally distributed error terms. That is, the distributionof the unobserved factors is normal. This assumption makesprobit models very attractive and able to capture complexinterdependencies. Other alternative models such as logitare very restrictive because they imply the assumption ofindependent and identically distribute extreme value errorterms. Most discrete choice models can handle multinomial,discrete-ordered, and binary specifications [9]. When thedata includes an increasing or decreasing order of choices, adiscrete-ordered specification enables using this informationfor potentially increasing the explanatory power of themodel[10].
The probit models that were developed in this studyprovided insights into how the Nevadans felt regardingtheir highway system. These insights were correlated withthe expenditure trends that may or may not have affectedthese feelings or opinions. The financial database of NevadaDepartment of Transportation (NDOT) was used for study-ing this potential correlation. This database provides infor-mation about how resources were used across the highwaysystem.The analysis period included fiscal years 1999 through2014.

Mathematical Problems in Engineering 3
Table 1: Congestion acceptability as a function of travel time satisfaction. District 1 (Southern Nevada).
Variable Likelihood estimate Standard error 𝑍 value Pr(>|𝑧|)(Intercept) −1.513 0.1203 −12.58 <2𝑒 − 16∗∗∗
Con1 Satisfied 0.8084 0.1254 6.447 1.14𝑒 − 10∗∗∗
Con1 Neutral 1.6258 0.1333 12.2 <2𝑒 − 16∗∗∗
Con1 Dissatisfied 2.557 0.146 17.51 <2𝑒 − 16∗∗∗
Con1 Very Dissatisfied 3.0511 0.2113 14.441 <2𝑒 − 16∗∗∗
Significance codes: 0 = ∗ ∗ ∗, 0.001 = ∗∗, 0.01 = ∗, 0.05 = #.
Table 2: Congestion acceptability as a function of congestion reduction satisfaction. District 1 (Southern Nevada).
Variable Likelihood estimate Standard error 𝑍 value Pr(>|𝑧|)(Intercept) −1.3267 0.1534 −8.647 <2𝑒 − 16∗∗∗
Con2 Satisfied 0.3713 0.1588 2.339 0.0194∗
Con2 Neutral 1.1181 0.1624 6.885 5.78𝑒 − 12∗∗∗
Con2 Dissatisfied 2.1405 0.1652 12.956 <2𝑒 − 16∗∗∗
Con2 Very Dissatisfied 2.9922 0.2259 13.245 <2𝑒 − 16∗∗∗
Significance codes: 0 = ∗ ∗ ∗, 0.001 = ∗∗, 0.01 = ∗, 0.05 = #.
Table 3: Congestion acceptability as a function of travel time satisfaction. District 2 (Northwestern Nevada).
Variable Likelihood estimate Standard error 𝑍 value Pr(>|𝑧|)(Intercept) −1.5414 0.1361 −11.325 <2𝑒 − 16∗∗∗
Con1 Satisfied 0.4923 0.1546 3.185 0.00145∗∗
Con1 Neutral 1.333 0.1844 7.227 4.92𝑒 − 13∗∗∗
Con1 Dissatisfied 1.9075 0.2783 6.855 7.14𝑒 − 12∗∗∗
Con1 Very Dissatisfied 6.7522 142.3995 0.047 0.96218Significance codes: 0 = ∗ ∗ ∗, 0.001 = ∗∗, 0.01 = ∗, 0.05 = #.
Table 4: Congestion acceptability as a function of congestion reduction satisfaction. District 2 (Northwestern Nevada).
Variable Likelihood estimate Standard error 𝑍 value Pr(>|𝑧|)(Intercept) −1.5087 0.1656 −9.112 <2𝑒 − 16∗∗∗
Con2 Satisfied 0.2952 0.1847 1.598 0.11
Con2 Neutral 0.8166 0.2032 4.019 5.85𝑒 − 05∗∗∗
Con2 Dissatisfied 1.4162 0.2098 6.751 1.46𝑒 − 11∗∗∗
Con2 Very Dissatisfied 3.0097 0.5249 5.734 9.80𝑒 − 09∗∗∗
Significance codes: 0 = ∗ ∗ ∗, 0.001 = ∗∗, 0.01 = ∗, 0.05 = #.
2.1. Results from Probit Models for Congestion. Three ques-tions were asked in the Congestion section of the survey:
(1) How satisfied are you with your highway travel time?(2) How satisfied are you with the efforts being made to
reduce congestion on freeways?(3) Is the level of congestion on Nevada highways accept-
able?
The first two questions were asked on a five-point scalefrom “Very Satisfied” to “Very Dissatisfied.”The last questionwas a simple binary “yes or no” question. All three questionshad a majority of positive responses; however, to improvesatisfaction, we must determine what factors or combinationof factors led some respondents to answer that they wereeither “Dissatisfied” or “Very Dissatisfied.”
A probit model was developed to understand how theresponses of the two prefacing questions influenced theresponse of the final question: “Is the level of congestion onNevada highways acceptable?” A model was developed foreach of NDOT’s three districts.
In Table 1, “Con1 Satisfied” represents a “Satisfied”response for the first question about Congestion. A model,with all coefficients equal to zero, represented the likelihoodof a respondent indicating that they were “Very Satisfied”with either their highway travel time (Congestion Question1) or the efforts beingmade to reduce congestion on freeways(Congestion Question 2) while simultaneously respondingthat the level of congestion on Nevada highways was notacceptable.
As the level of satisfaction decreased with each question,shown in Tables 1–4, the likelihood of responding that the

4 Mathematical Problems in Engineering
Table 5: Perception of safety as a function of debris removal satisfaction. District 1 (Southern Nevada).
Variable Likelihood estimate Standard error 𝑍 value Pr(>|𝑧|)(Intercept) 1.54616 0.09607 16.093 <2𝑒 − 16∗∗∗
Safe 1 Satisfied −0.36739 0.10344 −3.552 0.000382∗∗∗
Safe 1 Neutral −1.05738 0.11427 −9.254 <2𝑒 − 16∗∗∗
Safe 1 Dissatisfied −1.3742 0.12284 −11.187 <2𝑒 − 16∗∗∗
Safe 1 Very Dissatisfied −1.97689 0.19677 −10.047 <2𝑒 − 16∗∗∗
Significance codes: 0 = ∗ ∗ ∗, 0.001 = ∗∗, 0.01 = ∗, 0.05 = #.
Table 6: Perception of safety as a function of roadway striping satisfaction. District 1 (Southern Nevada).
Variable Likelihood estimate Standard error 𝑍 value Pr(>|𝑧|)(Intercept) 1.5011 0.1286 11.672 <2𝑒 − 16∗∗∗
Safe 2 Satisfied −0.1699 0.1356 −1.253 0.21Safe 2 Neutral −0.8281 0.1419 −5.835 5.38𝑒 − 09
∗∗∗
Safe 2 Dissatisfied −1.165 0.1409 −8.269 <2𝑒 − 16∗∗∗
Safe 2 Very Dissatisfied −1.6358 0.1751 −9.342 <2𝑒 − 16∗∗∗
Significance codes: 0 = ∗ ∗ ∗, 0.001 = ∗∗, 0.01 = ∗, 0.05 = #.
Table 7: Perception of safety as a function of signage satisfaction. District 1 (Southern Nevada).
Variable Likelihood estimate Standard error 𝑍 value Pr(>|𝑧|)(Intercept) 1.36651 0.09895 13.81 <2𝑒 − 16∗∗∗
Safe 3 Satisfied −0.18946 0.10593 −1.789 0.0737
Safe 3 Neutral −0.62453 0.11565 −5.4 6.65𝑒 − 08∗∗∗
Safe 3 Dissatisfied −1.36651 0.12564 −10.876 <2𝑒 − 16∗∗∗
Safe 3 Very Dissatisfied −2.1387 0.22122 −9.668 <2𝑒 − 16∗∗∗
Significance codes: 0 = ∗ ∗ ∗, 0.001 = ∗∗, 0.01 = ∗, 0.05 = #.
level of congestion on Nevada highways was unacceptableincreased. A strong trend could not be discerned from Dis-trict 3. In Districts 1 (Southern Nevada) and 2 (NorthwesternNevada), a decreased level of satisfaction was indicated forboth prefacing questions. Likely, the lack of a trend may bedue to the small sample size of District 3, as the populationis roughly 3% of the entire state. Another possibility was thestrong rural influence in this district; that is, congestion wasless of an issue for drivers in District 3.
In both Districts 1 and 2, analysis showed that dissat-isfaction with highway travel time was the most influentialpredictor of a “No” response for the acceptability of thelevel of congestion on Nevada highways. This implied thatif highway travel time were addressed by NDOT, a greaternumber of respondents who are currently dissatisfied wouldfeel that the level of congestion on Nevada highways wasacceptable.
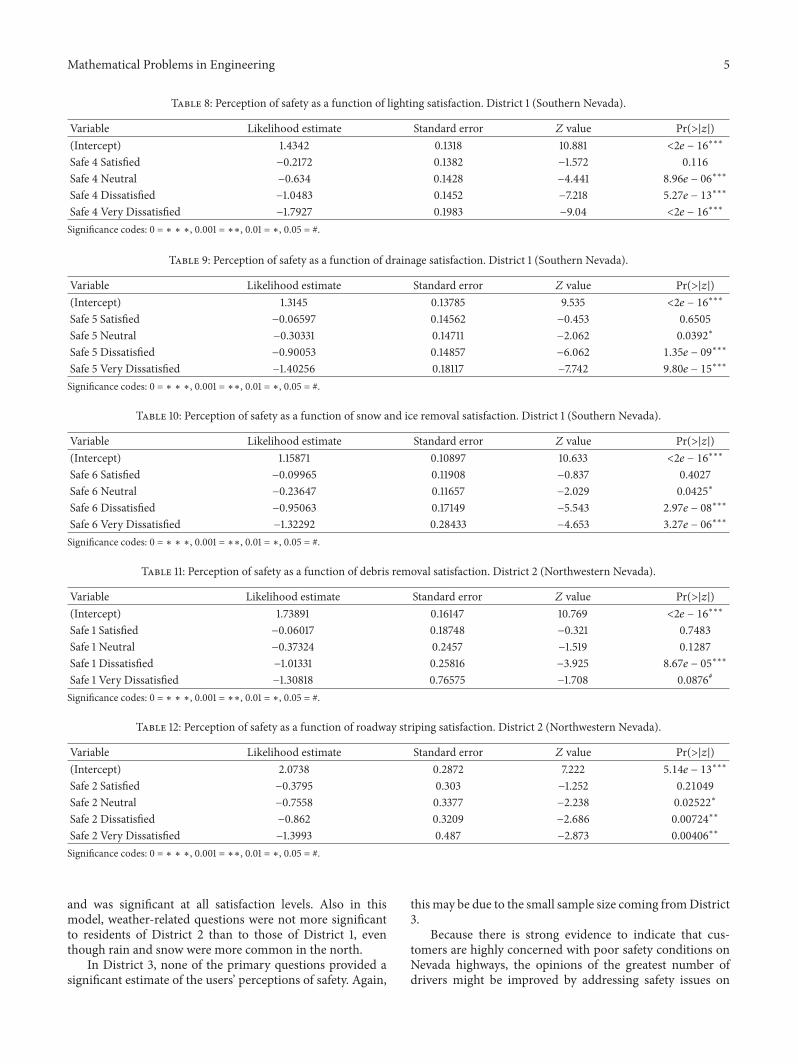
2.2. Results from Probit Models for Safety. A similar analysiswas performed within the “Safety” segment of the survey.In that section, there were six prefacing questions andone summary question. The prefacing questions sought therespondent’s level of satisfaction regarding debris removal,roadway striping, signage, lighting, drainage, and snow andice removal. The respondents answered on a five-pointscale from “Very Satisfied” to “Very Dissatisfied.” The final
summary question was: “Overall, how safe do you feel whentraveling on highways in Nevada?” The last question wasasked on a four-point scale to create a definitive positive ornegative response ranging from “Very Safe” to “Very Unsafe.”
For each district, different prefacing questions were sig-nificant when predicting a respondent’s overall perceptionof safety on Nevada highways. In the following models, theinitial intercept estimate was the likelihood that a “VerySatisfied” respondent considered that he or she was safe(either “Safe” or “Very Safe”). Therefore, as satisfaction levelsdecreased, it was expected that the estimates would decreasetoward a negative perception of safety.
In determining the overall level of safety that usersperceive regarding Nevada highways, the models for District1, found in Tables 5–10, showed that all factors were at leastpartially significant. Safety Question 1, concerning debrisremoval, showed the greatest effects implying that betterremoval of debris byNDOTwould have a greater effect on theoverall perception of safety. The two weather-related topics,drainage and snow and ice removal, were not significant forthemodel,most likely because these issues aremore prevalentin the northern districts.
The models for District 2, shown in Tables 11–16, showedweaker correlations than did the models for District 1.The model for signage, shown in Table 13, appears to bethe most significant predictor of the perception of safety
Mathematical Problems in Engineering 5
Table 8: Perception of safety as a function of lighting satisfaction. District 1 (Southern Nevada).
Variable Likelihood estimate Standard error 𝑍 value Pr(>|𝑧|)(Intercept) 1.4342 0.1318 10.881 <2𝑒 − 16∗∗∗
Safe 4 Satisfied −0.2172 0.1382 −1.572 0.116
Safe 4 Neutral −0.634 0.1428 −4.441 8.96𝑒 − 06∗∗∗
Safe 4 Dissatisfied −1.0483 0.1452 −7.218 5.27𝑒 − 13∗∗∗
Safe 4 Very Dissatisfied −1.7927 0.1983 −9.04 <2𝑒 − 16∗∗∗
Significance codes: 0 = ∗ ∗ ∗, 0.001 = ∗∗, 0.01 = ∗, 0.05 = #.
Table 9: Perception of safety as a function of drainage satisfaction. District 1 (Southern Nevada).
Variable Likelihood estimate Standard error 𝑍 value Pr(>|𝑧|)(Intercept) 1.3145 0.13785 9.535 <2𝑒 − 16∗∗∗
Safe 5 Satisfied −0.06597 0.14562 −0.453 0.6505
Safe 5 Neutral −0.30331 0.14711 −2.062 0.0392∗
Safe 5 Dissatisfied −0.90053 0.14857 −6.062 1.35𝑒 − 09∗∗∗
Safe 5 Very Dissatisfied −1.40256 0.18117 −7.742 9.80𝑒 − 15∗∗∗
Significance codes: 0 = ∗ ∗ ∗, 0.001 = ∗∗, 0.01 = ∗, 0.05 = #.
Table 10: Perception of safety as a function of snow and ice removal satisfaction. District 1 (Southern Nevada).
Variable Likelihood estimate Standard error 𝑍 value Pr(>|𝑧|)(Intercept) 1.15871 0.10897 10.633 <2𝑒 − 16∗∗∗
Safe 6 Satisfied −0.09965 0.11908 −0.837 0.4027
Safe 6 Neutral −0.23647 0.11657 −2.029 0.0425∗
Safe 6 Dissatisfied −0.95063 0.17149 −5.543 2.97𝑒 − 08∗∗∗
Safe 6 Very Dissatisfied −1.32292 0.28433 −4.653 3.27𝑒 − 06∗∗∗
Significance codes: 0 = ∗ ∗ ∗, 0.001 = ∗∗, 0.01 = ∗, 0.05 = #.
Table 11: Perception of safety as a function of debris removal satisfaction. District 2 (Northwestern Nevada).
Variable Likelihood estimate Standard error 𝑍 value Pr(>|𝑧|)(Intercept) 1.73891 0.16147 10.769 <2𝑒 − 16∗∗∗
Safe 1 Satisfied −0.06017 0.18748 −0.321 0.7483
Safe 1 Neutral −0.37324 0.2457 −1.519 0.1287
Safe 1 Dissatisfied −1.01331 0.25816 −3.925 8.67𝑒 − 05∗∗∗
Safe 1 Very Dissatisfied −1.30818 0.76575 −1.708 0.0876#
Significance codes: 0 = ∗ ∗ ∗, 0.001 = ∗∗, 0.01 = ∗, 0.05 = #.
Table 12: Perception of safety as a function of roadway striping satisfaction. District 2 (Northwestern Nevada).
Variable Likelihood estimate Standard error 𝑍 value Pr(>|𝑧|)(Intercept) 2.0738 0.2872 7.222 5.14𝑒 − 13
∗∗∗
Safe 2 Satisfied −0.3795 0.303 −1.252 0.21049
Safe 2 Neutral −0.7558 0.3377 −2.238 0.02522∗
Safe 2 Dissatisfied −0.862 0.3209 −2.686 0.00724∗∗
Safe 2 Very Dissatisfied −1.3993 0.487 −2.873 0.00406∗∗
Significance codes: 0 = ∗ ∗ ∗, 0.001 = ∗∗, 0.01 = ∗, 0.05 = #.
and was significant at all satisfaction levels. Also in thismodel, weather-related questions were not more significantto residents of District 2 than to those of District 1, eventhough rain and snow were more common in the north.
In District 3, none of the primary questions provided asignificant estimate of the users’ perceptions of safety. Again,
this may be due to the small sample size coming fromDistrict3.
Because there is strong evidence to indicate that cus-tomers are highly concerned with poor safety conditions onNevada highways, the opinions of the greatest number ofdrivers might be improved by addressing safety issues on

6 Mathematical Problems in Engineering
Table 13: Perception of safety as a function of signage satisfaction. District 2 (Northwestern Nevada).
Variable Likelihood estimate Standard error 𝑍 value Pr(>|𝑧|)(Intercept) 2.219 0.2734 8.115 4.86𝑒 − 16
∗∗∗
Safe 3 Satisfied −0.5844 0.2864 −2.04 0.041306∗
Safe 3 Neutral −1.1645 0.3526 −3.302 0.000959∗∗∗
Safe 3 Dissatisfied −1.1082 0.3608 −3.071 0.002131∗∗
Safe 3 Very Dissatisfied −2.4723 0.4853 −5.094 3.51𝑒 − 07∗∗∗
Significance codes: 0 = ∗ ∗ ∗, 0.001 = ∗∗, 0.01 = ∗, 0.05 = #.
Table 14: Perception of safety as a function of lighting satisfaction. District 2 (Northwestern Nevada).
Variable Likelihood estimate Standard error 𝑍 value Pr(>|𝑧|)(Intercept) 2.303 0.376 6.125 9.10𝑒 − 10
∗∗∗
Safe 4 Satisfied −0.621 0.3884 −1.599 0.1099
Safe 4 Neutral −0.802 0.4205 −1.907 0.0565#
Safe 4 Dissatisfied −0.9721 0.406 −2.394 0.0167∗
Safe 4 Very Dissatisfied −2.3996 0.5125 −4.682 2.84𝑒 − 06∗∗∗
Significance codes: 0 = ∗ ∗ ∗, 0.001 = ∗∗, 0.01 = ∗, 0.05 = #.
Table 15: Perception of safety as a function of drainage satisfaction. District 2 (Northwestern Nevada).
Variable Likelihood estimate Standard error 𝑍 value Pr(>|𝑧|)(Intercept) 1.9808 0.2965 6.68 2.39𝑒 − 11
∗∗∗
Safe 5 Satisfied −0.1621 0.3144 −0.516 0.606164Safe 5 Neutral −0.5757 0.3385 −1.701 0.088972#
Safe 5 Dissatisfied −1.0519 0.3367 −3.124 0.001785∗∗
Safe 5 Very Dissatisfied −1.632 0.487 −3.351 0.000805∗∗∗
Significance codes: 0 = ∗ ∗ ∗, 0.001 = ∗∗, 0.01 = ∗, 0.05 = #.
Table 16: Perception of safety as a function of snow and ice removal satisfaction. District 2 (Northwestern Nevada).
Variable Likelihood estimate Standard error 𝑍 value Pr(>|𝑧|)(Intercept) 1.9145 0.2478 7.727 1.1𝑒 − 14
∗∗∗
Safe 6 Satisfied −0.1583 0.2677 −0.591 0.554384
Safe 6 Neutral −0.1457 0.3353 −0.434 0.663941
Safe 6 Dissatisfied −0.8821 0.2889 −3.054 0.002260∗∗
Safe 6 Very Dissatisfied −1.4838 0.3934 −3.772 0.000162∗∗∗
Significance codes: 0 = ∗ ∗ ∗, 0.001 = ∗∗, 0.01 = ∗, 0.05 = #.
roads, specifically deploying countermeasures in the loca-tions with the most safety issues. Clearly, this requires a com-plete traffic-safety management process involving networkscreening, diagnosis, countermeasure selection, appraisal,and evaluation.
2.3. The Relationship between Customer Satisfaction and Gov-ernment Spending. The expenditure data that was accessiblecovered fiscal years 1999 through 2014. Expenditures wereseparated both by district and category. There were 50possible expenditure categories, only five of which could bedirectly related to a given question regarding customer sat-isfaction and had consistent data across the time period anddistricts. These five categories were construction, construc-tion engineering, maintenance, roadway design, and traffic.
Regarding an expenditure trend analysis, themost appro-priate one for this study and the method used in this researchwas a time-series regression [11]. Unfortunately, a time-series regression did not yield statistically significant trendsfor all five expenditure categories (see Table 17). Significantresults included maintenance and roadway design and trafficfor District 1 and maintenance for Districts 2 and 3. Inlarge part, expenses were random over the time periodand had too large variance to confidently assign a meanannual expense or average rate of change in expenditures (seeTable 17).Thus, the average annual growth (or average annualdecline) could not be included as a variable in a potentialmodel measuring the relationship between satisfaction andexpenditure. Therefore, the true value of the expense wascompared to the levels of satisfaction.

Mathematical Problems in Engineering 7
Table 17: Estimates for the expenditure trend categories.
Mean Standard deviation Trend estimate Standard error 𝑡-statistics Pr(>|𝑡|)District 1
Construction 396372.6 670038.2 38794.54 36156.06 1.0729 0.3014Construction engineering 7582574 1149534 53298.14 62938.55 0.8468 0.4113Maintenance 17059451 4659285 700596.9 182622.0 3.8363 0.0018∗∗
Roadway design 272945.8 378387.7 62035.85 13277.79 4.6721 0.0004∗∗∗
Traffic 9307.105 5434.873 504.43 273.68 1.8430 0.0086∗∗
District 2Construction 227817.1 481591.5 38108.16 25042.81 1.5217 0.1503Construction engineering 3666015 657684.5 50251.84 34390.40 1.4612 0.1660Maintenance 16860084 6034262 1117075 160037.60 6.9800 0.0000∗∗∗
Roadway design 12782.43 23525.46 795.51 1303.40 0.6103 0.5515Traffic 5903.336 4331.059 −331.38 226.42 −1.4635 0.1654
District 3Construction 258197.6 524008.7 39028.29 27504.34 1.4189 0.1778Construction engineering 3422544 559718.7 22305.39 30849.72 0.7230 0.4816Maintenance 14886381 5923932 629710.9 286815.4 2.1955 0.0455Roadway design 1894.336 5453.910 −367.89 289.94 −1.2688 0.2252Traffic 3719.804 2988.365 −83.82 166.25 −0.5041 0.6220Significance codes: 0 = ∗ ∗ ∗, 0.001 = ∗∗, 0.01 = ∗, 0.05 = #.
Table 18: Comparison of survey question categories to expenditurecategories.
Survey question category Expenditure category
ConstructionConstruction
Construction engineeringMaintenance
Safety Roadway designCongestion Traffic
Data for financial expenditure originally was divided into50 expenditure categories. Survey questionswere divided intogroups comparing relevant expenditure data, either directlyor indirectly. These groups were construction, safety, andcongestion. The relationships between the survey questioncategories and the expenditure categories are shown inTable 18.
To measure and confirm the relationships between thetwo data sets, nonparametric correlations were establishedusing Spearman’s Rho and factor analysis. After performingthe factor and correlation analyses, one survey questionshowed a significant correlation with the given expenditures.A 2-tailed 𝑝 value of 0.10 was used to determine statisticalsignificance.
Table 19 shows the relationships between constructionexpenditures for District 2 and the five survey questions.
Significant Spearman’s Rho correlation coefficient wasfound between Question 4 of the survey, “how satisfied areyouwith the amount of time it takes to complete constructionprojects?,” and construction expenditures.Thus, as construc-tion spending increased in District 2, dissatisfaction withconstruction times decreased.
Table 19: Construction correlation for District 2.
Constructionsurvey question
Constructionexpenditures
Const 1Correlation coefficient 0.220
Significance 0.414𝑁 16
Const 2Correlation coefficient 0.217
Significance 0.414𝑁 16
Const 3Correlation coefficient −0.438
Significance 0.419𝑁 16
Const 4Correlation coefficient −0.471
Significance 0.065𝑁 16
Const 5Correlation coefficient −0.237
Significance 0.376𝑁 16
Table 20 provides the relationships between congestion(traffic) expenditures for District 3 and the three questionsof the survey about this criterion.
In Table 20, significant Spearman’s Rho correlation coef-ficient was observed between Question 2, “how satisfiedare you with the efforts being made to reduce congestionon freeways?,” and congestion (traffic) expenditures. Thus,as congestion (traffic) spending increased in District 3,dissatisfaction decreased.

8 Mathematical Problems in Engineering
Table 20: Congestion correlation for District 3.
Traffic surveyquestion
Trafficexpenditures
Traff 1Correlation coefficient −0.402
Significance 0.123𝑁 16
Traff 2Correlation coefficient −0.422
Significance 0.100𝑁 16
Traff 3Correlation coefficient −0.122
Significance 0.654𝑁 16
Table 21: Congestion correlation for District 3 (factor analysis).
Spearman’s Rho Traffic expenditures
FactorCorrelation coefficient −0.452
Significance 0.079𝑁 16
Table 21 shows the relationship between congestion(traffic) expenditures for District 3 and the factor analysiscreated for the three congestion questions using Spearman’sRho coefficients as a measure of nonparametric correlationand Cronbach’s Alpha coefficient as a measure of reliability.Cronbach’s Alpha (0.53) indicates a consistency suitable forthe new factor [12].
Table 21 shows significant Spearman’s Rho correlationcoefficient for the relationship between congestion (traffic)expenditures and the factor analysis created for the three con-gestion questions in District 3. Thus, as congestion (traffic)spending increases in District 3, dissatisfaction decreases.
Finally, Table 22 displays the relationships between safetyexpenditures for District 3 and the survey questions aboutthese criteria, using Spearman’s Rho criteria.
Table 22 shows significant Spearman’s Rho correlationcoefficient for the relationship between Safety Question 1 andSafety Question 2 of the survey, concerning debris removaland road striping, respectively, and roadway design expen-ditures. Thus, additional spending increased dissatisfactionwith both debris removal and roadway striping in District 3.
3. Conclusion
This study provides evidence of the level of satisfaction of theresidents of Nevada decreases related to the safety conditionson Northwestern and Southern Nevada highways. Analy-sis confirmed several statistically significant relationshipsbetween customer satisfaction and government spending.In District 2, increasing construction spending resulted inincreasing customer satisfaction with the amount of timeit takes to complete construction projects. In District 3,the analysis confirmed that additional traffic expendituresincreased satisfaction. In District 3, roadway design expen-ditures had an effect on user perception of both debris
Table 22: Safety correlation for District 3.
Safety surveyquestion
Roadway designexpenditures
Safe 1Correlation coefficient 0.497
Significance 0.050𝑁 16
Safe 2Correlation coefficient 0.487
Significance 0.056𝑁 16
Safe 3Correlation coefficient 0.115
Significance 0.671𝑁 16
Safe 4Correlation coefficient 0.000
Significance 1.000𝑁 16
Safe 5Correlation coefficient −0.350
Significance 0.183𝑁 16
Safe 6Correlation coefficient 0.016
Significance 0.954𝑁 16
Safe 7Correlation coefficient 0.239
Significance 0.372𝑁 16
removal and roadway striping. However, these roadwaydesign expenditures had the unintended effect of makingusers less satisfied with these issues.This may be an efficiencyissue because roadway design dollars are not going towarddebris removal or roadway striping projects.
Several problems arose in the latter half of this research.First, confidence in the expenditure data was limited. Becausethere was only a finite breakdown of expenditure types,assumptions had to bemade both when entering expendituredata at the source and when analyzing the data in the present.Second, comparing direct expenditures between districts waspotentially misleading. Most of Nevada’s population livesin District 1; moreover, there are different types of roadsthroughout the state. Attempts were made to account for thisissue by weighting expenditure data using such factors asdistrict population, Average Annual Daily Traffic (AADT),and road miles in each jurisdiction. Finally, only the rawdata values for expenditures could be used when measuringthe correlations. Had there been a time-series relationship,variables such as rate of growth of expenditure or rate ofdecline of expenditure could been confidently used in amodel.
Further analysis should be conducted to determine if andwhereNDOT funding is being expended to better address theneeds and perceptions of the transportation users in Nevada.It is recommended that additional studies be conductedto measure respondent satisfaction over time. Additional

Mathematical Problems in Engineering 9
questions could include the duration of state or regional resi-dency, the perception of changing conditions (e.g., improvingconditions), and additional ranking questions.
Competing Interests
The authors declare that they have no competing interests.
References
[1] T. Sorel, “Great expectations,” Public Roads, vol. 68, no. 1, pp.10–15, 2004.
[2] J. J. Kline, “How quality award-winning governments handlecustomer service,” Journal of Organizational Excellence, vol. 20,no. 3, pp. 41–47, 2001.
[3] R. Sloane and K. Stein, Using Customer Needs to DriveTransportation Decisions, Report 487, Transportation ResearchBoard, 2003.
[4] Institute of Transportation Engineers, TransportationOperations—The National Dialogue Continues, Institute ofTransportation Engineers, Washington, DC, USA, 2000.
[5] NuStats, “Putting Customer Research into Practice: Guidelinesfor Conducting, Reporting, and Using Customer SurveysRelated to Highway Maintenance Operations,” 2009, http://onlinepubs.trb.org/onlinepubs/nchrp/docs/NCHRP20-07(260)FR Volume1.pdf.
[6] The Center for Research Design and Analysis, Nevada Depart-ment of Transportation Customer Satisfaction Survey 2009,University of Nevada, Reno, Reno, Nev, USA, 2009.
[7] J. T. Israel, Alternative Designs and Methods for Customer Sat-isfaction Measurement, SatisFaction Strategies, Portland, Ore,USA, 2002.
[8] United States Department of Labor, Bureau of Labor Statistics,2012.
[9] S. P. Washington, M. G. Karlaftis, and F. L. Mannering, Statisti-cal and Econometric Methods for Transportation Data Analysis,Chapman & Hall, Boca Raton, Fla, USA, 2003.
[10] UCLA: Institute for Digital Research and Education, RData Analysis Examples: Ordinal Logistic Regression, 2015,http://www.ats.ucla.edu/stat/r/dae/ologit.htm.
[11] B. Kittel and H. Obinger, “Political parties, institutions, and thedynamics of social expenditure in times of austerity,” Journal ofEuropean Public Policy, vol. 10, no. 1, pp. 20–45, 2003.
[12] M. C. Rodriguez and Y. Maeda, “Meta-analysis of coefficientalpha,” Psychological Methods, vol. 11, no. 3, pp. 306–322, 2006.

Submit your manuscripts athttp://www.hindawi.com
Hindawi Publishing Corporationhttp://www.hindawi.com Volume 2014
MathematicsJournal of
Hindawi Publishing Corporationhttp://www.hindawi.com Volume 2014
Mathematical Problems in Engineering
Hindawi Publishing Corporationhttp://www.hindawi.com
Differential EquationsInternational Journal of
Volume 2014
Applied MathematicsJournal of
Hindawi Publishing Corporationhttp://www.hindawi.com Volume 2014
Probability and StatisticsHindawi Publishing Corporationhttp://www.hindawi.com Volume 2014
Journal of
Hindawi Publishing Corporationhttp://www.hindawi.com Volume 2014
Mathematical PhysicsAdvances in
Complex AnalysisJournal of
Hindawi Publishing Corporationhttp://www.hindawi.com Volume 2014
OptimizationJournal of
Hindawi Publishing Corporationhttp://www.hindawi.com Volume 2014
CombinatoricsHindawi Publishing Corporationhttp://www.hindawi.com Volume 2014
International Journal of
Hindawi Publishing Corporationhttp://www.hindawi.com Volume 2014
Operations ResearchAdvances in
Journal of
Hindawi Publishing Corporationhttp://www.hindawi.com Volume 2014
Function Spaces
Abstract and Applied AnalysisHindawi Publishing Corporationhttp://www.hindawi.com Volume 2014
International Journal of Mathematics and Mathematical Sciences
Hindawi Publishing Corporationhttp://www.hindawi.com Volume 2014
The Scientific World JournalHindawi Publishing Corporation http://www.hindawi.com Volume 2014
Hindawi Publishing Corporationhttp://www.hindawi.com Volume 2014
Algebra
Discrete Dynamics in Nature and Society
Hindawi Publishing Corporationhttp://www.hindawi.com Volume 2014
Hindawi Publishing Corporationhttp://www.hindawi.com Volume 2014
Decision SciencesAdvances in
Discrete MathematicsJournal of
Hindawi Publishing Corporationhttp://www.hindawi.com
Volume 2014 Hindawi Publishing Corporationhttp://www.hindawi.com Volume 2014
Stochastic AnalysisInternational Journal of


![AGREEMENT BETWEEN THE ASSOCIATED GENERAL … - 2022 IW 112 [Highlighted].pdfagreement between the associated general contractors of illinois and iron workers local #112 covering highway](https://static.fdocuments.net/doc/165x107/5eb90e49a097c8779b025bc2/agreement-between-the-associated-general-2022-iw-112-highlightedpdf-agreement.jpg)