Research Article Fourier-Transform Infrared Absorption ...
8
Research Article Fourier-Transform Infrared Absorption Spectroscopy in Binary Hydrocarbon-Alcohol Single Droplet Evaporation Shane R. Daly, Nicholas Olson, and Christopher L. Hagen Energy Systems Laboratory, School of Mechanical, Industrial and Manufacturing Engineering, Oregon State University, 2600 NW College Way, Bend, OR 97703, USA Correspondence should be addressed to Christopher L. Hagen; [email protected] Received 20 August 2015; Revised 17 December 2015; Accepted 14 January 2016 Academic Editor: Stephane Schilt Copyright © 2016 Shane R. Daly et al. is is an open access article distributed under the Creative Commons Attribution License, which permits unrestricted use, distribution, and reproduction in any medium, provided the original work is properly cited. Broadband absorption spectroscopy, by way of FTIR, was used to investigate the vapor cloud of a single millimeter sized liquid droplet suspended by a syringe as it evaporates at standard conditions. Single beam data were collected every 8 seconds resulting in a time-resolved record. Species concentrations were tracked using their resonant absorption peaks and correlated with a multidimensional numerical model. e numerical model combined a Gaussian beam transmission through a temporally changing spherical vapor cloud with radial concentration gradients, informed by the 2 law and interpreted using the Abel transform. ere was fair agreement with temporal evaporation trends for single component runs. Multicomponent experiments of ethanol and isooctane showed synergistic blending effects and preferential evaporation of ethanol. Droplets were also suspended by a thermocouple to track the droplet temperature over time as they were subject to evaporative cooling. is work is the foundation of a basic technique for collecting useful data to inform a complex transport problem. 1. Introduction Droplet research is a widely diverse topic with one appli- cation being the investigation of fuel evaporation in direct injected internal combustion engines. Combustion scientists are interested in the burning and transport behavior of hydro- carbon droplets because of the implications on emissions and fuel efficiency. A significant body of fuel spray droplet research, both experimental and modeling, exists for combustion scientists [1, 2]. However, single droplet fuel evaporation of mixtures is also of interest to help inform the spray work by extrapolating the behavior of one droplet to the aggregate behavior of many. For example, Wei et al. suspended droplet mixtures of propanol, methanol, and acetone using quartz optical fibers and conducted ultraviolet- (UV-) visible absorption spectroscopy in tandem with charge-coupled device (CCD) camera video [3]. Ghassemi et al. conducted a study of single droplet binary mixtures of heptane and hexadecane at elevated temperatures and pressures [4]; in their work, the droplets were suspended using a quartz fiber and their evap- oration was recorded with a high-speed CCD camera. Hallett and Beauchamp-Kiss also used quartz fiber suspension and a camera to study single droplets of multicomponent fuels for correlating fuel distillation curves to likely composition [5]. Others, such as Arnold et al. and Grader et al., have electrodynamically trapped (suspended) single aerosol par- ticles in tightly controlled environments and modulated the size of the particles by heating the micron sized targets with focused thermal IR sources [6, 7]. In these works, particle size was monitored by secondary laser sources and scattering techniques. e modeling complement to single droplet evaporation experiments can be minimally accomplished by way of the 2 law method [8]. at said, much more complex models exist. See Raghuram and Raghavan, Camm et al., or Hołyst et al. for more involved single droplet numerical representations [9–11]. We present here a multidimensional model which is more elaborate than, albeit rooted in, the 2 law. 2. Theory and Approach e work done here is a step towards identifying preferential vaporization (different components evaporating at different Hindawi Publishing Corporation Journal of Spectroscopy Volume 2016, Article ID 3619634, 7 pages http://dx.doi.org/10.1155/2016/3619634
Transcript of Research Article Fourier-Transform Infrared Absorption ...

Research ArticleFourier-Transform Infrared Absorption Spectroscopy inBinary Hydrocarbon-Alcohol Single Droplet Evaporation
Shane R. Daly, Nicholas Olson, and Christopher L. Hagen
Energy Systems Laboratory, School of Mechanical, Industrial and Manufacturing Engineering, Oregon State University,2600 NW College Way, Bend, OR 97703, USA
Correspondence should be addressed to Christopher L. Hagen; [email protected]
Received 20 August 2015; Revised 17 December 2015; Accepted 14 January 2016
Academic Editor: Stephane Schilt
Copyright © 2016 Shane R. Daly et al. This is an open access article distributed under the Creative Commons Attribution License,which permits unrestricted use, distribution, and reproduction in any medium, provided the original work is properly cited.
Broadband absorption spectroscopy, by way of FTIR, was used to investigate the vapor cloud of a single millimeter sized liquiddroplet suspended by a syringe as it evaporates at standard conditions. Single beam data were collected every 8 seconds resultingin a time-resolved record. Species concentrations were tracked using their resonant absorption peaks and correlated with amultidimensional numerical model.The numerical model combined aGaussian beam transmission through a temporally changingspherical vapor cloud with radial concentration gradients, informed by the 𝐷2 law and interpreted using the Abel transform.There was fair agreement with temporal evaporation trends for single component runs. Multicomponent experiments of ethanoland isooctane showed synergistic blending effects and preferential evaporation of ethanol. Droplets were also suspended by athermocouple to track the droplet temperature over time as they were subject to evaporative cooling. This work is the foundationof a basic technique for collecting useful data to inform a complex transport problem.
1. Introduction
Droplet research is a widely diverse topic with one appli-cation being the investigation of fuel evaporation in directinjected internal combustion engines. Combustion scientistsare interested in the burning and transport behavior of hydro-carbon droplets because of the implications on emissions andfuel efficiency.
A significant body of fuel spray droplet research, bothexperimental and modeling, exists for combustion scientists[1, 2]. However, single droplet fuel evaporation of mixtures isalso of interest to help inform the spray work by extrapolatingthe behavior of one droplet to the aggregate behavior ofmany. For example, Wei et al. suspended droplet mixturesof propanol, methanol, and acetone using quartz opticalfibers and conducted ultraviolet- (UV-) visible absorptionspectroscopy in tandem with charge-coupled device (CCD)camera video [3]. Ghassemi et al. conducted a study ofsingle droplet binary mixtures of heptane and hexadecane atelevated temperatures and pressures [4]; in their work, thedroplets were suspended using a quartz fiber and their evap-oration was recorded with a high-speed CCD camera. Hallett
and Beauchamp-Kiss also used quartz fiber suspension anda camera to study single droplets of multicomponent fuelsfor correlating fuel distillation curves to likely composition[5]. Others, such as Arnold et al. and Grader et al., haveelectrodynamically trapped (suspended) single aerosol par-ticles in tightly controlled environments and modulated thesize of the particles by heating the micron sized targets withfocused thermal IR sources [6, 7]. In these works, particlesize was monitored by secondary laser sources and scatteringtechniques.
The modeling complement to single droplet evaporationexperiments can beminimally accomplished byway of the𝐷2law method [8]. That said, much more complex models exist.See Raghuram and Raghavan, Camm et al., or Hołyst et al.for more involved single droplet numerical representations[9–11]. We present here a multidimensional model which ismore elaborate than, albeit rooted in, the𝐷2 law.
2. Theory and Approach
The work done here is a step towards identifying preferentialvaporization (different components evaporating at different
Hindawi Publishing CorporationJournal of SpectroscopyVolume 2016, Article ID 3619634, 7 pageshttp://dx.doi.org/10.1155/2016/3619634

2 Journal of Spectroscopy
y-axis y-axis
x-axisx-axis (I0)
FTIR source Gaussian beam
Vapor
cloud
Liquid droplet
r
Angle 𝜃
FTIR
det
ecto
r
Figure 1: Two-dimensional representation of the absorption processused to derive the model presented here. Note that 𝜃 is the angleof revolution and that the beam moves from left to right in thisdepiction.
times) of a binary oxygenated hydrocarbon droplet in aneffort to improve understanding of mixture behavior. Ourwork highlights the study of a single relatively large droplet(1.9 [mm] diameter) under ambient conditions. This dropletsize has been investigated in similar experiments, as men-tioned, by Ghassemi et al. (1.1–1.3 [mm] diameter) andHallettand Beauchamp-Kiss (1.4–1.8 [mm] diameter). Our dropletswere probed by infrared (IR) absorption spectroscopy. Inshort summary, substances with varying elements andmolec-ular structures absorb frequencies of radiation that areresonant to it; and therefore the use of IR spectra can yieldspeciation of mixtures (i.e., relative amounts), as well asquantitative data such as the absolute concentrations.
Figure 1 is a schematic representation of our single dropletabsorption spectroscopy experiment. Using the coordinatesystem from Figure 1, we can write the light extinctionequations for a liquid and vapor in the following sections[12, 13].We also discuss the use of the Beer-Lambert equationfor determining species concentration.
2.1. Liquid Scattering. The droplet investigated here has ahigh size parameter for a majority of its liquid existence andwe predict complete attenuation due to light scattering:
𝜒def=
2𝜋𝑟droplet
𝜆, (1)
where𝜒 is the size parameter [—]. 𝑟droplet is the droplet radius,here [nm] but [cm] for later use. 𝜆 is the wavelength of sourcelight [nm].
That is to say, while the droplet is of diameter 1.9–0.19 [mm] over our optical frequency range of interest of800–3400 [cm−1] (or 12,500–2,941 [nm]), the maximum andminimum size parameter are 2000-50, respectively. Thesesizes can be compared to the scattering regime graphic byPetty 2004 to show that scattering is at first a combinationof geometric optics and Mie scattering [14]. As the dropletevaporates and the size parameter decreases, scattering is allMie scattering for the droplet size we are considering. Thescattering of light by large spherical shapes, like our droplet,is wavelength independent wherein the extinction efficiencycan be calculated using size parameter and droplet refractiveindex.
Owing to the extinction paradox, extinction efficiency(𝑄𝑒) has an oscillatory second-order response to size param-
eter where the steady state value is 2 [12]. Louedec and Urbanshow this behavior for a range of relative refractive indices(i.e., the index of the particle relative to the medium of 1.05–2.0) and size parameters up to 100 for nonabsorbing sphericalparticles.
We have absorbing spheres in our work where the realrefractive indices can be found, but reliable sources for theimaginary indices (which represent absorption and dampenthe oscillatory extinction efficiency behavior) have beenelusive [14]. Nevertheless, ethanol and isooctane have realrefractive indices of 1.31–1.35 and 1.33–1.44 over our range,respectively [15–17]. Considering these refractive indices,ethanol and isooctane also have 𝑄
𝑒’s of 2 for a majority
of our droplet lifetimes. A 𝑄𝑒of 2 means that, owing to
the effects of diffraction, the droplet is opaque over twicethe diameter of the geometric diameter. This backgroundindicates that transmission of the IR light through the liquidto the detector will be zero and we neglect it. We verified thisstatement in the laboratory by probing an evaporating waterdroplet (index of refraction of 1.3 at 589 [nm]) using our FTIRmethod presented in this paper. We looked for liquid waterIR absorption features. No liquid features were found, thoughvapor absorption was pervasive [18].
Since the droplet completely attenuates the incident lightevenly across all wavelengths of interest, it is simply an offsetin the absorption results where it was easily removed inpostprocessing. Another consequence of the scattering is thatthe only light to reach the detector in our experiment willhave travelled through the vapor.Therefore, we set our spatialintegral limits for the vapor portion of the Beer-Lambertrelationship from the droplet radius to the IR beam radius. Itshould be noted that while we could have set our integrationlimits to twice the geometric droplet radius because ofour extinction efficiency, here we are using the geometricradius.
2.2. Vapor Absorption. The basic transmittance form of theBeer-Lambert relationship is given here:
(𝐼
𝐼0
)
],𝑦,𝜃,𝑡= 𝑒−𝜎]𝑛𝑦,𝜃,𝑡𝐿, (2)
where 𝐼 is the transmitted light [W]. 𝐼0is the incident
light [W]. ] is the optical frequency of interest [cm−1]. 𝑦is the distance away from, and normal to, the centerlineaxis or axis of symmetry from Figure 1 [cm]. 𝜃 is the angleof revolution from Figure 1 [rad]. 𝑡 is time [s]. 𝜎] is theabsorption cross section [cm2/molecule]. 𝑛 is the numberdensity [molecules/cm3]. 𝐿 is path length.
It is apparent given the spatial and temporal dependenciesof (2) that additional relationships and other details arerequired to capture the physical situation. We created themodel here by reasoning what fraction of light of the FTIRdetector would collect over our experiment as a function oftime. The 𝐷2 law was used to account for the time varying
Journal of Spectroscopy 3
nature of the droplet size as well as the change in radialconcentration of the vapor cloud over time [8]:
𝐷2(𝑡) = 𝐷
2
0− 𝐾𝑡, (3)
where 𝐷 is diameter of droplet as a function of time [m].𝐷0is initial diameter [m]. 𝐾 is evaporative constant =
(8𝜌airD𝑎𝑏/𝜌liq) ln(1 + 𝐵𝑌) [m2/s]. 𝜌 is density [kg/m3].D
𝑎𝑏is
diffusion coefficient [m2/s]. 𝐵𝑌is transfer number = (𝑌
𝐴,𝑠−
𝑌𝐴,∞
)/(1−𝑌𝐴,𝑠).𝑌𝐴,𝑠
is vapormass fraction at droplet surface.𝑌𝐴,∞
is vapor mass fraction far from surface.Assumptions for 𝐷2 model include that the vapor cloud
is not stagnant and diffuses radially (buoyancy of the gasesis negligible) into the surrounding atmosphere and thatevaporation occurs at a constant rate.
Initial conditions for (3) were determined experimentallyas described later.
The surrounding vapor cloud profile varies according to
𝑌 (𝑟, 𝑡) = 1 − (1 − 𝑌𝐴,𝑠)𝑟0(𝑡)/𝑟
, (4)
where 𝑌𝐴,𝑠, as with the 𝐷2 law, is the mass fraction at the
surface of droplet. This is determined with the mole fractionat the surface—by way of the Clausius-Clapeyron relation—and knowledge of the molecular weights. This value isassumed constant over time. 𝑟
0(𝑡) is the initial radius of the
droplet, which is assumed to evolve with time according tothe 𝐷2 law. 𝑟 is the radial location inside the vapor cloud.The outer radius of the vapor cloud was set to be wherea 99% decay of the original mole fraction occurred. Sincethe liquid droplet is assumed to decay according to the 𝐷2evaporativemodel, every step in time results in a new 𝑟
0value
and therefore new outer radius value.The𝐷2 law (3) governs the droplet size with time, and the
vapor cloud distribution (4) alterswith this droplet size as𝑌𝐴,𝑠
is assumed constant. However, buoyancy is likely significant,and we expect some discrepancy between the model andresults. In particular, we anticipate that the experimentalabsorbance results should be higher than that of the idealizedmodel. Since the vapor cloud is significantly larger than thebeam width for the lifetime of the droplet, buoyancy maycause the lower portion of the vapor cloud to rise into thebeams path and thus increasing the overall number density.The light intensity distribution that probes the droplet andvapor cloud will now be introduced.
The mass fraction concentration profile was convertedto mass density by way of the ideal gas law and combinedwith the original mass fraction profile to obtain a molarconcentration profile.
Spatial information was first modeled in two dimensionsassuming axisymmetry. More specifically, we used half of aGaussian distribution for the incident light beam:
𝐼0(𝑦) = 𝑎𝑒
−(𝑦−𝑏)2/2𝑐2
, (5)
where 𝑎 is the amplitude of the beam. 𝑐 controls the width ofthe beam [mm]. 𝑏 is the center location of the beam relativeto a reference axis [mm].
1000 1500 2000 2500 3000
Abso
rban
ce (—
)
00.05
0.10.15
0.2
EthanolIsooctane
Ethanol peak usedIsooctane peak used
Region used formulticomponent droplet
analysis
C-H region that is used forsingle species analysis
Wavenumber (cm−1)
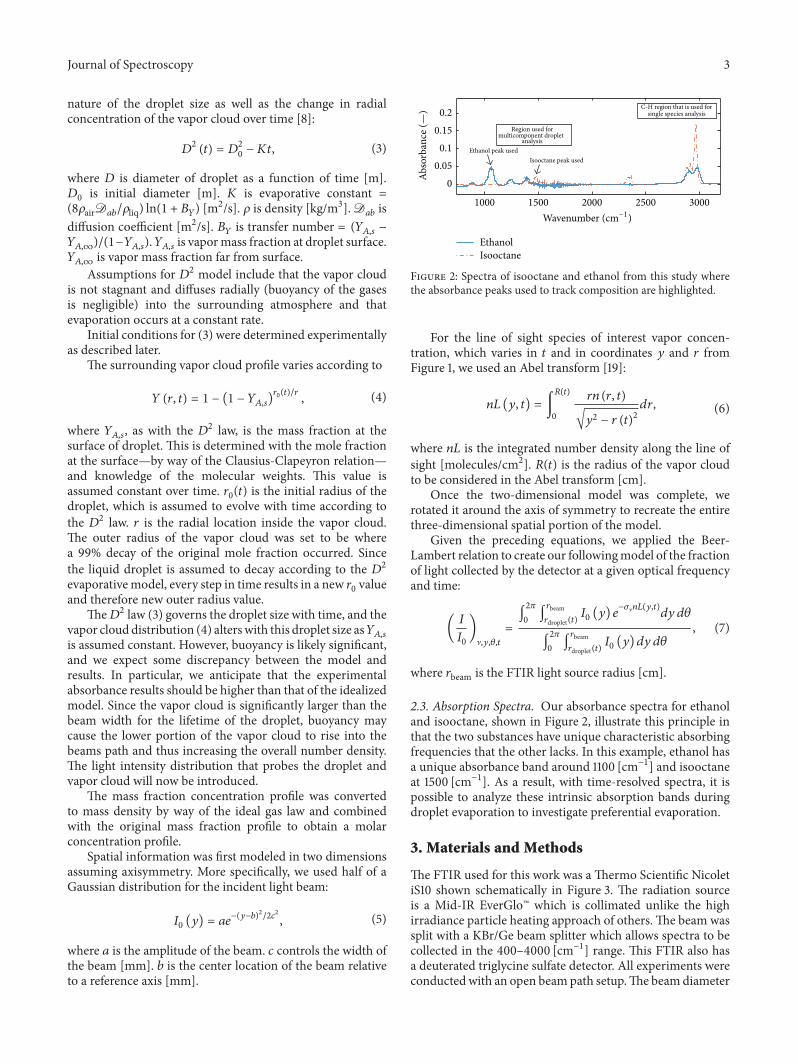
Figure 2: Spectra of isooctane and ethanol from this study wherethe absorbance peaks used to track composition are highlighted.
For the line of sight species of interest vapor concen-tration, which varies in 𝑡 and in coordinates 𝑦 and 𝑟 fromFigure 1, we used an Abel transform [19]:
𝑛𝐿 (𝑦, 𝑡) = ∫
𝑅(𝑡)
0
𝑟𝑛 (𝑟, 𝑡)
√𝑦2 − 𝑟 (𝑡)2
𝑑𝑟, (6)
where 𝑛𝐿 is the integrated number density along the line ofsight [molecules/cm2]. 𝑅(𝑡) is the radius of the vapor cloudto be considered in the Abel transform [cm].
Once the two-dimensional model was complete, werotated it around the axis of symmetry to recreate the entirethree-dimensional spatial portion of the model.
Given the preceding equations, we applied the Beer-Lambert relation to create our followingmodel of the fractionof light collected by the detector at a given optical frequencyand time:
(𝐼
𝐼0
)
],𝑦,𝜃,𝑡=
∫2𝜋
0∫𝑟beam
𝑟droplet(𝑡)𝐼0(𝑦) 𝑒−𝜎]𝑛𝐿(𝑦,𝑡)
𝑑𝑦𝑑𝜃
∫2𝜋
0∫𝑟beam
𝑟droplet(𝑡)𝐼0(𝑦) 𝑑𝑦 𝑑𝜃
, (7)
where 𝑟beam is the FTIR light source radius [cm].
2.3. Absorption Spectra. Our absorbance spectra for ethanoland isooctane, shown in Figure 2, illustrate this principle inthat the two substances have unique characteristic absorbingfrequencies that the other lacks. In this example, ethanol hasa unique absorbance band around 1100 [cm−1] and isooctaneat 1500 [cm−1]. As a result, with time-resolved spectra, it ispossible to analyze these intrinsic absorption bands duringdroplet evaporation to investigate preferential evaporation.
3. Materials and Methods
The FTIR used for this work was a Thermo Scientific NicoletiS10 shown schematically in Figure 3. The radiation sourceis a Mid-IR EverGlo™ which is collimated unlike the highirradiance particle heating approach of others.The beam wassplit with a KBr/Ge beam splitter which allows spectra to becollected in the 400–4000 [cm−1] range. This FTIR also hasa deuterated triglycine sulfate detector. All experiments wereconductedwith an open beampath setup.The beamdiameter
4 Journal of Spectroscopy
Fixed mirror
Mov
ing
mirr
or
Source: mid- infrared ever-Glo
Syringe: Hamilton GasTight #1750
Detector: deuterated
triglycine sulfate
FTIR
Vapor cloud
Beam sp
litter:
KBr/G
e
8.0mm beam
1.9mm dia. droplet
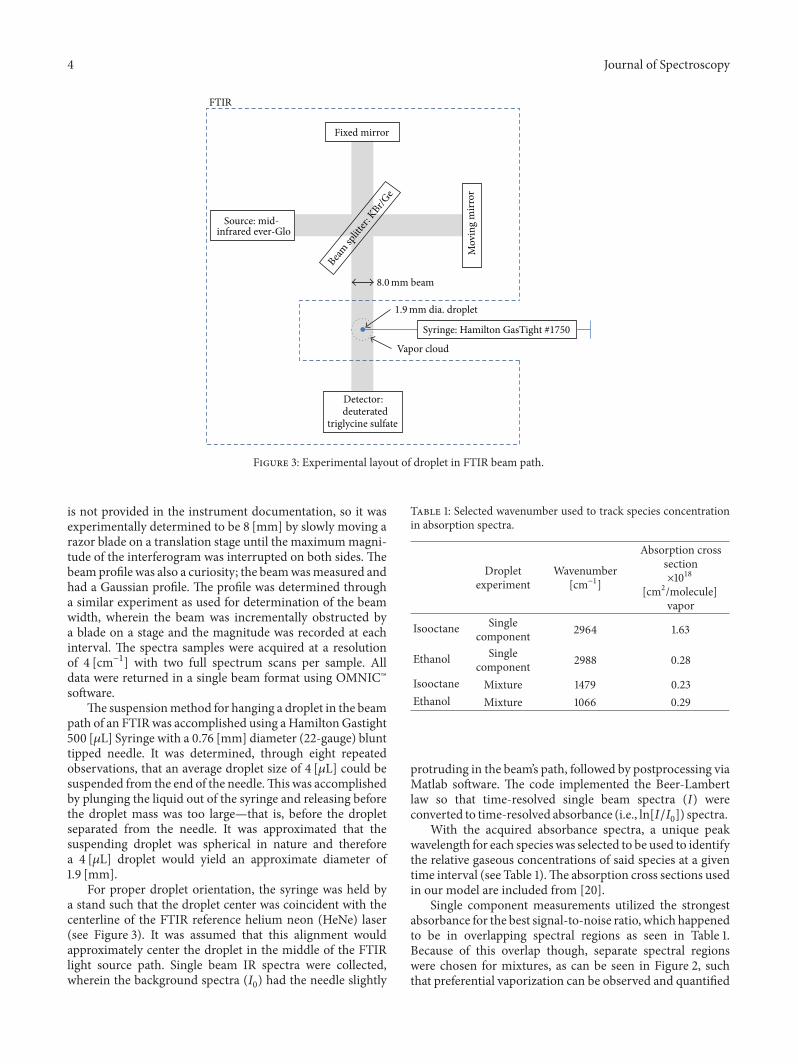
Figure 3: Experimental layout of droplet in FTIR beam path.
is not provided in the instrument documentation, so it wasexperimentally determined to be 8 [mm] by slowly moving arazor blade on a translation stage until the maximummagni-tude of the interferogram was interrupted on both sides. Thebeamprofile was also a curiosity; the beamwasmeasured andhad a Gaussian profile. The profile was determined througha similar experiment as used for determination of the beamwidth, wherein the beam was incrementally obstructed bya blade on a stage and the magnitude was recorded at eachinterval. The spectra samples were acquired at a resolutionof 4 [cm−1] with two full spectrum scans per sample. Alldata were returned in a single beam format using OMNIC™software.
The suspensionmethod for hanging a droplet in the beampath of an FTIRwas accomplished using aHamiltonGastight500 [𝜇L] Syringe with a 0.76 [mm] diameter (22-gauge) blunttipped needle. It was determined, through eight repeatedobservations, that an average droplet size of 4 [𝜇L] could besuspended from the end of the needle.This was accomplishedby plunging the liquid out of the syringe and releasing beforethe droplet mass was too large—that is, before the dropletseparated from the needle. It was approximated that thesuspending droplet was spherical in nature and thereforea 4 [𝜇L] droplet would yield an approximate diameter of1.9 [mm].
For proper droplet orientation, the syringe was held bya stand such that the droplet center was coincident with thecenterline of the FTIR reference helium neon (HeNe) laser(see Figure 3). It was assumed that this alignment wouldapproximately center the droplet in the middle of the FTIRlight source path. Single beam IR spectra were collected,wherein the background spectra (𝐼
0) had the needle slightly
Table 1: Selected wavenumber used to track species concentrationin absorption spectra.
Dropletexperiment
Wavenumber[cm−1]
Absorption crosssection×1018
[cm2/molecule]vapor
Isooctane Singlecomponent 2964 1.63
Ethanol Singlecomponent 2988 0.28
Isooctane Mixture 1479 0.23Ethanol Mixture 1066 0.29
protruding in the beam’s path, followed by postprocessing viaMatlab software. The code implemented the Beer-Lambertlaw so that time-resolved single beam spectra (𝐼) wereconverted to time-resolved absorbance (i.e., ln[𝐼/𝐼
0]) spectra.
With the acquired absorbance spectra, a unique peakwavelength for each species was selected to be used to identifythe relative gaseous concentrations of said species at a giventime interval (see Table 1).The absorption cross sections usedin our model are included from [20].
Single component measurements utilized the strongestabsorbance for the best signal-to-noise ratio, which happenedto be in overlapping spectral regions as seen in Table 1.Because of this overlap though, separate spectral regionswere chosen for mixtures, as can be seen in Figure 2, suchthat preferential vaporization can be observed and quantified

Journal of Spectroscopy 5
Table 2: Properties of liquid substances used for single droplet and binary droplet experiments.
Species Formula Density[kg/m3]
Diffusioncoefficient
D𝑎𝑏
×105 [m2/s]
Boiling point[∘C] Vapor pressure [kPa] Molar mass [kg/kmol]
Isooctane C8H18
690 0.653 99 8.713 114.23Ethanol C
2H6O 789 1.108 78 5.27 46.07
based on the magnitude of absorbance at a designatedwavenumber.
Next, samples were taken with the needle (no droplet)being incrementally lowered into, and through, the beam.This test also showed no apparent wavelength dependentvariability of the spectra; however, significant variability ofwater vapor and CO
2was noticed in the spectra, presumably
from the operator’s breath and variable laboratory conditions.A nitrogen purge was conducted to improve the signal-to-noise ratio of the absorbers of interest, that is, to reduce theabsorption of nontarget species.This FTIR has a built-in portfor nitrogen purging the unit itself; with the addition of aglove bag around the unit we were able to purge the entiresetup and significantly reduce the amount of water vapor andCO2being observed in the spectra samples.
Another problem that was addressed was the issue ofcapillary effects and seepage from the endof the needle. Initialdata collection suggested that the droplet would never fullydisperse, indicated by the characteristic absorbance peaksnever completely reaching zero. To eliminate this concern,and in effort to include droplet temperature data, a ther-mocouple (type K with 0.81mm [0.032 in] diameter, OmegaTJ36-CASS-032U-6), of an equal diameter to the syringe,was used for suspending droplets.The droplets were carefullyplaced on the end of the thermocouple with the syringe.This approach proved to have significant benefits. First, therewas no residual evaporation from the liquid in the needleseeping out. Second, we now had the ability to record thetemperature profile of the droplets as they were evaporating.Note that evaporation diameter results, seen in Results, areentirely from the syringewhereas the temperature data resultsutilized the thermocouple. It should be noted that, unlikequartz fibers and electrodynamic levitation, both our needleand thermocouple suspension approaches introduce heatconduction concerns.
Ethanol and isooctane (2,2,4-trimethylpentane) wereselected as components of a binary mixture because they arerepresentative of components in oxygenated gasoline. Theproperties of the two components are listed in Table 2 [21].
The diffusion coefficient was found in dry air [8]. Amixture of 85% isooctane and 15% ethanol by volume waschosen as the mixture properties to be representative of E15oxygenated gasoline in the United States. The results wereaveraged over five separate droplet evaporation instances.
4. Results and Discussion
4.1. Single Component Droplet Evaporation by IR AbsorptionSpectroscopy. The single species droplet absorption spectra
Time (s)500 100 150 200 250 300
Abso
rban
ce
0
0.005
0.01
0.015
0.02
0.025
0.03
0.035
0.04
0.045
0.05
A(t) for ethanol assuming D2 law dependence(D ∝ t1/2) overlaid with averaged experimental data
Experimental dataModel data
Figure 4: Single component droplet evaporation comparing theexperimental data from IR absorption spectroscopy of our modelfor 100% ethanol. Data shown were averaged over five experiments.
over time were compared to our model (i.e., (7)). Theabsorption is seen to decrease over time; however there wassome variability in that the spectra did not decrease smoothlyand monotonically with each time interval due to nonidealeffects. It can be seen in Figures 4 and 5 that the averageddata resemble our model, despite the nonideal influences onthe final results.
The decay times are similar in both the model and theempirical data. It seems that our measurement results areindicative of the reduction over time of the actual dropletdiameter, but perhaps nonideal effects prevent the initialconditions from matching. The disagreement in magnitudesat time zero may also be attributed to mischaracterizationof the initial droplet diameter. This is in spite of our effortsto characterize the initial diameter through multiple trials aspreviously mentioned.
4.2. Single and Binary Droplet Evaporation by Thermocouple.In our work, the temperature profiles of isooctane andethanol exhibit nonmonatomic behavior as also seen insmaller diameter droplet (0.015mm diameter) modelingwork done by Cammet al. [10]. Cammet al. found that a well-mixed 60% isooctane and 40% ethanol by volume (i.e., E40)

6 Journal of Spectroscopy
20 40 60 800 100 120 140 160 180
Abso
rban
ce
0
0.02
0.04
0.06
0.08
0.1
0.12
0.14
0.16
0.18
0.2
Time (s)
A(t) for isooctane assuming D2 law dependence(D ∝ t1/2) overlaid with averaged experimental data
Experimental dataModel data
Figure 5: Single component droplet evaporation comparing theexperimental data from IR absorption spectroscopy of ourmodel for100% isooctane. Data shown were averaged over five experiments.
Tem
pera
ture
(∘C) 30
2520151050
Time (s)0 41 82 123 164 205 246
85–15 isooctane/ethanolIsooctaneEthanol
Figure 6: Droplet evaporation by suspension from a thermocoupleand the corresponding thermocouple measurements over time.
mixture droplet completed its temperature-time profile in amanner similar to isooctane.
In Figure 6, the ethanol temperature profile takes longerto equilibrate relative to isooctane and mixture of isooctaneand ethanol. Considering the single component absorbancespectra, it can be seen that the absorbance for ethanol alsotakes longer in relation to isooctane.
Considering the binary mixture temperature-time his-tory in Figure 6, primarily consisting of isooctane, it wasexpected that the temperature profile would exhibit nearlythe same profile as pure isooctane. However, it can be seenthat there is a more significant cooling effect early in theevaporation process (i.e., a lower temperature near timezero), more so than pure ethanol alone. This phenomenonmay suggest preferential evaporation along with a synergisticblending (i.e., the mixture has a greater cooling effect thaneither of the individual components alone) effect for fasterevaporation. However, as with the work of Camm et al., atlonger times the temperature profile of the mixture behavessimilarly to that of neat isooctane [10].
Time (s)20 40 60 800 100 120 140 160
Abso
rban
ce (—
)
0
0.02
0.04
0.06
0.08
Isooctane, wavenumber = 1479 cm−1Ethanol, wavenumber = 1066 cm−1
Figure 7: Binary droplet (85% isooctane and 15% ethanol by vol-ume) evaporation measured by IR absorbance.
Note that a third method for evaporation-time measure-ment, a time series of digital photographs of the dropletdiameter with a grid background, was also conducted, butthe images were not of sufficient quality for reliable inter-pretation of droplet diameter. As a reminder, the approachesto verifying the use of diameter over time were a meansto verify the next approach which is tracking individualspecies evaporation over time for a multicomponent fuelusing spectral properties.
4.3. Binary Mixture Droplet Evaporation by IR AbsorptionSpectroscopy. The experimental binary absorbance spectraresults are shown in Figure 7 which are not compared toour single component model. Focusing on isooctane in themixture, it is seen that the isooctane diminishes at a fasterrate initially than neat isooctane from Figure 5. In Figure 5,the absorbance of neat isooctane decreased slowly at first thenmore rapidly (i.e., decreasing concave down).
However, the binarymixture yields a short rapid decreaseinitially, then slows, decreases more rapidly again, and finallyapproaches zero (i.e., exponential decay). It appears that theisooctane could have a two-stage diminishing profile or, asdescribed byHallett and Beauchamp-Kiss, the presence of thepolar ethanol molecule negates Raoult’s law behavior therebyprolonging the evaporation of the isooctane [5]. However, itshould be noted that this approach is in development andthough broad trends can be interpreted, finer structure couldbe variation due to a poor signal-to-noise ratio rather thanphysical behavior.
Considering ethanol, it can be seen that the absorbancealso decays rapidly and resembles an exponential decayingprofile, in comparison to neat ethanol’s slower initial decay.This would explain the lower temperature in the blendedmixture initially. The overall time for ethanol to decay inthe binary mixture decreased over twofold in comparisonto its neat component results. This, along with the fact thatthe overall time for isooctane to diminish was relativelyunchanged, lends some evidence to ethanol as a preferential

Journal of Spectroscopy 7
evaporation pathway.That is to say, ethanol appears to evapo-rate more quickly in the presence of isooctane in the mixtureratios shown here than as a pure component.
5. Conclusion
Infrared absorption, by way of FTIR, and a thermocouplewere used to track the evaporation of single component andbinary mixtures droplets. The single component absorbancedata correlated with our model and provided a means toexplain the observed temperature profiles. The absorbancedata in the binary mixture shows that there is significantincrease in the evaporation of ethanol compared to ethanolalone. Neat ethanol demonstrated a slow, linear diminish-ment, but when blended with isooctane it diminished signifi-cantly faster overall and at an exponential rate. For isooctane,a faster absorbance decay rate occurred initially, but the totaltime for evaporation is nearly unchanged. Because of thesetrends, it is believed that the ethanol is more preferential forevaporation and there are synergistic blending effects present.
With the uncertainty of the equipment due to low signal-to-noise ratio, as well as nonideal effects in the data, develop-ment is ongoing. However, it is definite that the IR spectro-scopic analysis technique presented here deserves continuedattention. By including nonideal effects into the modeland increasing the signal-to-noise ratio of the absorbancespectra (e.g., by averagingmore experimental runs) it appearsplausible to observe preferential evaporation of binary, andeven more than binary, multicomponent substances. Withmore detailed modeling and slight experimental techniquealterations, this novel technique may be the means toquantitatively improve our understanding of preferentialevaporation of multicomponent mixtures.
Conflict of Interests
The authors declare that there is no conflict of interestsregarding the publication of this paper.
Acknowledgments
Theauthors thankDr. JeffGautschi for generous use of his labspace and use of the FTIR. Oregon State University, Cascades,supports this work.
References
[1] P. Hottenbach, T. Brands, and G. Grunefeld, “An experimentalinvestigation on the evaporation characteristics of a two-component fuel in diesel-like sprays,” SAE International Journalof Engines, vol. 4, no. 1, pp. 800–812, 2011.
[2] Y. Ra and R. D. Reitz, “A vaporization model for discrete multi-component fuel sprays,” International Journal of MultiphaseFlow, vol. 35, no. 2, pp. 101–117, 2009.
[3] J. B. Wei, B. D. Shaw, and J. S. Xiao, “Transient measurementsof the composition of evaporating droplets by fiber opticabsorption spectroscopy,” Optics and Lasers in Engineering, vol.39, no. 1, pp. 91–108, 2003.
[4] H. Ghassemi, S. W. Baek, and Q. S. Khan, “Experimentalstudy on binary droplet evaporation at elevated pressures and
temperatures,” Combustion Science and Technology, vol. 178, no.6, pp. 1031–1053, 2006.
[5] W. L. H. Hallett and S. Beauchamp-Kiss, “Evaporation of singledroplets of ethanol–fuel oil mixtures,” Fuel, vol. 89, no. 9, pp.2496–2504, 2010.
[6] G. S. Grader, S. Arnold, R. C. Flagan, and J. H. Seinfeld, “Fouriertransform infrared spectroscopy of a single aerosol particle,”TheJournal of Chemical Physics, vol. 86, no. 11, pp. 5897–5903, 1987.
[7] S. Arnold, E. K.Murphy, andG. Sageev, “Aerosol particlemolec-ular spectroscopy,” Applied Optics, vol. 24, no. 7, pp. 1048–1053,1985.
[8] S. R. Turns, An Introduction to Combustion: Concepts andApplications, McGraw-Hill, New York, NY, USA, 2012.
[9] S. Raghuram and V. Raghavan, “Thermodynamic analysis ofevaporation of levitated binary and ternary liquid fuel dropletsunder normal gravity,” ISRNThermodynamics, vol. 2012, ArticleID 167281, 10 pages, 2012.
[10] J. Camm, R. Stone, M. H. Davy, and D. Richardson, “The mod-elling of multi-component droplet evaporation,” in Proceedingsof the 23rd “Journees d’Etude” of the Belgian Section of theCombustion Institute, Brussels, Belgium, May 2014.
[11] R. Hołyst, M. Litniewski, D. Jakubczyk et al., “Evaporation offreely suspended single droplets: experimental, theoretical andcomputational simulations,” Reports on Progress in Physics, vol.76, no. 3, Article ID 034601, 2013.
[12] C. F. Bohren and D. R. Huffman, Absorption and Scattering ofLight by Small Particle, JohnWiley & Sons, New York, NY, USA,2008.
[13] K. N. Rao,Molecular Spectroscopy: Modern Research, AcademicPress, London, UK, 1976.
[14] G. W. Petty, A First Course in Atmospheric Radiation, SundogPublishing, LLC, Madison, Wis, USA, 2004.
[15] fractiveindex.info, fractiveindex.info, December 2015, http://refractiveindex.info/.
[16] S. Kedenburg, M. Vieweg, T. Gissibl, and H. Giessen, “Linearrefractive index and absorption measurements of nonlinearoptical liquids in the visible and near-infrared spectral region,”Optical Materials Express, vol. 2, no. 11, pp. 1588–1611, 2012.
[17] M. R. Anderson, Determination of infrared optical constants forsingle component hydrocarbon fuels [M.S. thesis], University ofMissouri-Rolla, 2000.
[18] Thermo Fisher Scientific, OMNIC Specta General ChemicalsSoftware Version 9.2.98, Thermo Fisher Scientific, Waltham,Mass, USA, 2012.
[19] A.W. Caswell,Water vapor absorption thermometry for practicalcombustion applications [Ph.D. thesis], University ofWisconsin-Madison, Madison, Wis, USA, 2009.
[20] S. W. Sharpe, T. J. Johnson, R. L. Sams, P. M. Chu, G. C. Rhod-erick, and P. A. Johnson, “Gas-phase databases for quantitativeinfrared spectroscopy,” Applied Spectroscopy, vol. 58, no. 12, pp.1452–1461, 2004.
[21] R. Stenutz, “Tables for Chemistry,” December 2009, http://www.stenutz.eu/chem.

Submit your manuscripts athttp://www.hindawi.com
Hindawi Publishing Corporationhttp://www.hindawi.com Volume 2014
Inorganic ChemistryInternational Journal of
Hindawi Publishing Corporation http://www.hindawi.com Volume 2014
International Journal ofPhotoenergy
Hindawi Publishing Corporationhttp://www.hindawi.com Volume 2014
Carbohydrate Chemistry
International Journal of
Hindawi Publishing Corporationhttp://www.hindawi.com Volume 2014
Journal of
Chemistry
Hindawi Publishing Corporationhttp://www.hindawi.com Volume 2014
Advances in
Physical Chemistry
Hindawi Publishing Corporationhttp://www.hindawi.com
Analytical Methods in Chemistry
Journal of
Volume 2014
Bioinorganic Chemistry and ApplicationsHindawi Publishing Corporationhttp://www.hindawi.com Volume 2014
SpectroscopyInternational Journal of
Hindawi Publishing Corporationhttp://www.hindawi.com Volume 2014
The Scientific World JournalHindawi Publishing Corporation http://www.hindawi.com Volume 2014
Medicinal ChemistryInternational Journal of
Hindawi Publishing Corporationhttp://www.hindawi.com Volume 2014
Chromatography Research International
Hindawi Publishing Corporationhttp://www.hindawi.com Volume 2014
Applied ChemistryJournal of
Hindawi Publishing Corporationhttp://www.hindawi.com Volume 2014
Hindawi Publishing Corporationhttp://www.hindawi.com Volume 2014
Theoretical ChemistryJournal of
Hindawi Publishing Corporationhttp://www.hindawi.com Volume 2014
Journal of
Spectroscopy
Analytical ChemistryInternational Journal of
Hindawi Publishing Corporationhttp://www.hindawi.com Volume 2014
Journal of
Hindawi Publishing Corporationhttp://www.hindawi.com Volume 2014
Quantum Chemistry
Hindawi Publishing Corporationhttp://www.hindawi.com Volume 2014
Organic Chemistry International
ElectrochemistryInternational Journal of
Hindawi Publishing Corporation http://www.hindawi.com Volume 2014
Hindawi Publishing Corporationhttp://www.hindawi.com Volume 2014
CatalystsJournal of


![FOURIER -TRANSFORM INFRARED SPECTROMETER [FTIR]](https://static.fdocuments.net/doc/165x107/587539961a28abe7728b6867/fourier-transform-infrared-spectrometer-ftir.jpg)