RESEARCH ARTICLE crossm - UFOP
21
Identification of Novel Alleles Conferring Superior Production of Rose Flavor Phenylethyl Acetate Using Polygenic Analysis in Yeast Bruna Trindade de Carvalho, a,b Sylvester Holt, a,b Ben Souffriau, a,b Rogelio Lopes Brandão, c Maria R. Foulquié-Moreno, a,b Johan M. Thevelein a,b Laboratory of Molecular Cell Biology, Institute of Botany and Microbiology, KU Leuven, Flanders, Belgium a ; Center for Microbiology, VIB, Leuven-Heverlee, Flanders, Belgium b ; Laboratório de Biologia Celular e Molecular, Núcleo de Pesquisas em Ciências Biológicas, ICEB II, Departamento de Farmácia, Escola de Farmácia, Universidade Federal de Ouro Preto, Campus do Morro do Cruzeiro, CEP 35, Ouro Preto, Brazil c ABSTRACT Flavor compound metabolism is one of the last areas in metabolism where multiple genes encoding biosynthetic enzymes are still unknown. A major challenge is the involvement of side activities of enzymes having their main function in other areas of metabolism. We have applied pooled-segregant whole-genome se- quence analysis to identify novel Saccharomyces cerevisiae genes affecting produc- tion of phenylethyl acetate (2-PEAc). This is a desirable flavor compound of major importance in alcoholic beverages imparting rose- and honey-like aromas, with pro- duction of high 2-PEAc levels considered a superior trait. Four quantitative trait loci (QTLs) responsible for high 2-PEAc production were identified, with two loci each showing linkage to the genomes of the BTC.1D and ER18 parents. The first two loci were investigated further. The causative genes were identified by reciprocal allele swapping into both parents using clustered regularly interspaced short palindromic repeat (CRISPR)/Cas9. The superior allele of the first major causative gene, FAS2, was dominant and contained two unique single nucleotide polymorphisms (SNPs) re- sponsible for high 2-PEAc production that were not present in other sequenced yeast strains. FAS2 encodes the alpha subunit of the fatty acid synthetase complex. Surprisingly, the second causative gene was a mutant allele of TOR1, a gene in- volved in nitrogen regulation. Exchange of both superior alleles in the ER18 parent strain increased 2-PEAc production 70%, nearly to the same level as in the best su- perior segregant. Our results show that polygenic analysis combined with CRISPR/ Cas9-mediated allele exchange is a powerful tool for identification of genes encod- ing missing metabolic enzymes and for development of industrial yeast strains generating novel flavor profiles in alcoholic beverages. IMPORTANCE Multiple reactions in flavor metabolism appear to be catalyzed by side activities of other enzymes that have been difficult to identify. We have applied genetic mapping of quantitative trait loci in the yeast Saccharomyces cerevisiae to identify mutant alleles of genes determining the production of phenylethyl acetate, an important flavor compound imparting rose- and honey-like aromas to alcoholic beverages. We identified a unique, dominant allele of FAS2 that supports high pro- duction of phenylethyl acetate. FAS2 encodes a subunit of the fatty acid synthetase complex and apparently exerts an important side activity on one or more alternative substrates in flavor compound synthesis. The second mutant allele contained a non- sense mutation in TOR1, a gene involved in nitrogen regulation of growth. Together the two alleles strongly increased the level of phenylethyl acetate. Our work high- lights the potential of genetic mapping of quantitative phenotypic traits to identify novel enzymes and regulatory components in yeast metabolism, including regular Received 4 July 2017 Accepted 29 September 2017 Published 7 November 2017 Citation Trindade de Carvalho B, Holt S, Souffriau B, Lopes Brandão R, Foulquié-Moreno MR, Thevelein JM. 2017. Identification of novel alleles conferring superior production of rose flavor phenylethyl acetate using polygenic analysis in yeast. mBio 8:e01173-17. https://doi .org/10.1128/mBio.01173-17. Editor Fred M. Winston, Harvard Medical School Copyright © 2017 Trindade de Carvalho et al. This is an open-access article distributed under the terms of the Creative Commons Attribution 4.0 International license. Address correspondence to Maria R. Foulquié- Moreno, [email protected], or Johan M. Thevelein, [email protected]. RESEARCH ARTICLE crossm November/December 2017 Volume 8 Issue 6 e01173-17 ® mbio.asm.org 1 mbio.asm.org on April 13, 2018 - Published by mbio.asm.org Downloaded from
Transcript of RESEARCH ARTICLE crossm - UFOP

Identification of Novel Alleles ConferringSuperior Production of Rose FlavorPhenylethyl Acetate Using PolygenicAnalysis in Yeast
Bruna Trindade de Carvalho,a,b Sylvester Holt,a,b Ben Souffriau,a,b
Rogelio Lopes Brandão,c Maria R. Foulquié-Moreno,a,b Johan M. Theveleina,b
Laboratory of Molecular Cell Biology, Institute of Botany and Microbiology, KU Leuven, Flanders, Belgiuma;Center for Microbiology, VIB, Leuven-Heverlee, Flanders, Belgiumb; Laboratório de Biologia Celular e Molecular,Núcleo de Pesquisas em Ciências Biológicas, ICEB II, Departamento de Farmácia, Escola de Farmácia,Universidade Federal de Ouro Preto, Campus do Morro do Cruzeiro, CEP 35, Ouro Preto, Brazilc
ABSTRACT Flavor compound metabolism is one of the last areas in metabolismwhere multiple genes encoding biosynthetic enzymes are still unknown. A majorchallenge is the involvement of side activities of enzymes having their main functionin other areas of metabolism. We have applied pooled-segregant whole-genome se-quence analysis to identify novel Saccharomyces cerevisiae genes affecting produc-tion of phenylethyl acetate (2-PEAc). This is a desirable flavor compound of majorimportance in alcoholic beverages imparting rose- and honey-like aromas, with pro-duction of high 2-PEAc levels considered a superior trait. Four quantitative trait loci(QTLs) responsible for high 2-PEAc production were identified, with two loci eachshowing linkage to the genomes of the BTC.1D and ER18 parents. The first two lociwere investigated further. The causative genes were identified by reciprocal alleleswapping into both parents using clustered regularly interspaced short palindromicrepeat (CRISPR)/Cas9. The superior allele of the first major causative gene, FAS2, wasdominant and contained two unique single nucleotide polymorphisms (SNPs) re-sponsible for high 2-PEAc production that were not present in other sequencedyeast strains. FAS2 encodes the alpha subunit of the fatty acid synthetase complex.Surprisingly, the second causative gene was a mutant allele of TOR1, a gene in-volved in nitrogen regulation. Exchange of both superior alleles in the ER18 parentstrain increased 2-PEAc production 70%, nearly to the same level as in the best su-perior segregant. Our results show that polygenic analysis combined with CRISPR/Cas9-mediated allele exchange is a powerful tool for identification of genes encod-ing missing metabolic enzymes and for development of industrial yeast strainsgenerating novel flavor profiles in alcoholic beverages.
IMPORTANCE Multiple reactions in flavor metabolism appear to be catalyzed byside activities of other enzymes that have been difficult to identify. We have appliedgenetic mapping of quantitative trait loci in the yeast Saccharomyces cerevisiae toidentify mutant alleles of genes determining the production of phenylethyl acetate,an important flavor compound imparting rose- and honey-like aromas to alcoholicbeverages. We identified a unique, dominant allele of FAS2 that supports high pro-duction of phenylethyl acetate. FAS2 encodes a subunit of the fatty acid synthetasecomplex and apparently exerts an important side activity on one or more alternativesubstrates in flavor compound synthesis. The second mutant allele contained a non-sense mutation in TOR1, a gene involved in nitrogen regulation of growth. Togetherthe two alleles strongly increased the level of phenylethyl acetate. Our work high-lights the potential of genetic mapping of quantitative phenotypic traits to identifynovel enzymes and regulatory components in yeast metabolism, including regular
Received 4 July 2017 Accepted 29September 2017 Published 7 November 2017
Citation Trindade de Carvalho B, Holt S,Souffriau B, Lopes Brandão R, Foulquié-MorenoMR, Thevelein JM. 2017. Identification of novelalleles conferring superior production of roseflavor phenylethyl acetate using polygenicanalysis in yeast. mBio 8:e01173-17. https://doi.org/10.1128/mBio.01173-17.
Editor Fred M. Winston, Harvard MedicalSchool
Copyright © 2017 Trindade de Carvalho et al.This is an open-access article distributed underthe terms of the Creative Commons Attribution4.0 International license.
Address correspondence to Maria R. Foulquié-Moreno, [email protected],or Johan M. Thevelein,[email protected].
RESEARCH ARTICLE
crossm
November/December 2017 Volume 8 Issue 6 e01173-17 ® mbio.asm.org 1
m
bio.asm.org
on April 13, 2018 - P
ublished by m
bio.asm.org
Dow
nloaded from

metabolic enzymes with unknown side activities responsible for biosynthesis of spe-cific flavor compounds. The superior alleles identified can be used to develop indus-trial yeast strains generating novel flavor profiles in alcoholic beverages.
KEYWORDS 2-phenylethyl acetate, QTL analysis, fatty acid synthetase, rose flavor,yeast
Flavor is one of the main defining characteristics of alcoholic beverages with criticalimportance for their commercial value (1, 2). The Saccharomyces cerevisiae yeast
plays an important role in generating the final aroma profile of alcoholic beverages.Pleasant flavors to the human palate include the fruity aromas that are largely derivedfrom secondary metabolism of sugar during yeast alcoholic fermentation. Esters com-prise the largest and most important group. They often have pleasant aromas, lowperception thresholds, and relatively high concentrations in alcoholic beverages (1, 3,4). Small changes in ester concentrations can have significant effects on the taste ofalcoholic beverages (3).
Esters are formed from an alcohol and a carboxylic acid linked with coenzyme A(CoA). There are two groups of flavor-active esters in fermented beverages, ethyl estersand acetate esters. Ethyl esters are formed from ethanol and the acyl-CoA derivative ofmedium-chain fatty acids (MCFA). Among this group, the most important are ethylhexanoate (anise seed, apple-like aroma) and ethyl octanoate (apple, pineapple aroma).Acetate esters are formed from acetyl-CoA and an alcohol that can be ethanol (yieldingethyl acetate) or a higher alcohol derived from amino acid metabolism. The mostflavor-relevant acetate esters are ethyl acetate (solvent-like aroma), isoamyl acetate(banana-like aroma), and 2-phenylethylacetate (honey- and rose-like aroma) (1, 4–7).
To date, the main genes responsible for ester biosynthesis identified are ATF1 andATF2 for acetate esters and EHT1 and EEB1 for ethyl esters (8–12). Double deletion ofATF1 and ATF2 largely abolishes the production of isoamyl acetate and strongly reducesthe production of many other flavor esters, including 2-phenylethyl acetate (2-PEAc).The observation that significant production levels are retained in the atf1� atf2� strainindicates involvement of other unknown biosynthetic enzymes (8). Double deletion ofEEB1 and EHT1 caused considerable but also only partial reduction in the levels of allethyl esters, again indicating the presence of additional biosynthetic enzymes (10). Inaddition, little is known about the regulation of the biosynthetic pathways and aboutother factors that may influence the production of specific flavor compounds. Flavorproduction is highly variable among yeast strains, and the genetic basis of this broadphenotypic variation has remained largely unknown until recently. Quantitative traitlocus (QTL) mapping studies have now revealed genes involved in production ofnerolidol, 2-phenyl ethanol, and ethyl esters (13), ethyl acetate (14), and undesirablesulfur flavor compounds (15). Given the large variety of flavor compounds and themany parameters affecting their formation, most of the underlying genetic basis of thenatural variation in flavor compound production remains unknown.
Flavor compound production is a complex, polygenic trait. For many years, thegenetic analysis of polygenic traits was very cumbersome, but in recent years, powerfultools have been developed that allow efficient mapping of major and minor quanti-tative trait loci and identification of the causative genes in the center of the QTLs(16–22). These technologies are based on the use of the many single nucleotidepolymorphisms (SNPs) between unrelated strains as genetic markers, and the recentdevelopment of low-cost high-throughput sequencing technologies has greatly facili-tated determination of the nucleotide frequency that is used to detect specific linkagewith the genome of one of the parent strains. Pooled-segregant whole-genomesequence analysis has thus emerged as a powerful tool for QTL mapping and has beensuccessfully performed with as few as 20 to 30 superior segregants displaying thephenotype of interest to an extent similar to that of the superior parent strain (17, 21,23). This low number is important for genetic analysis of nonselectable phenotypes andfor traits that require an elaborate experimental setup for scoring, such as a require-
Trindade de Carvalho et al. ®
November/December 2017 Volume 8 Issue 6 e01173-17 mbio.asm.org 2
m
bio.asm.org
on April 13, 2018 - P
ublished by m
bio.asm.org
Dow
nloaded from
ment for small-scale fermentations with all individual segregants. The latter has beensuccessfully accomplished for the nonselectable traits of low glycerol production (24,25), maximum ethanol accumulation capacity (23), ethyl acetate production (14), andproduction of multiple other flavor compounds (13). Production of flavor compounds,like ethyl acetate, is a nonselectable trait and has to be scored in individual small-scalefermentations with hundreds of segregants to obtain a pool of superior segregantslarge enough for efficient QTL mapping (13, 14).
In most cases, reciprocal hemizygosity analysis (RHA) has been used for identifica-tion of the causative genes in the QTLs (16). It involves construction of two hemizygousdiploid strains in which a different allele of the candidate gene has been deleted,followed by comparison of their phenotype for the trait of interest. Bulk RHA has alsobeen used in this bulk RHA; first, consecutive blocks of genes are deleted, followed bydeletion of single genes in blocks where a phenotypic difference between the twohemizygous diploid strains is observed in the RHA analysis (22). For production of theflavor compound ethyl acetate, QTL mapping using pooled-segregant whole-genomesequence analysis and RHA for determination of causative genes have resulted in theidentification of PMA1, CEM1, and TPS1 as novel genes affecting ethyl acetate produc-tion (14). The recent development of the clustered regularly interspaced short palin-dromic repeat (CRISPR)/Cas9 technology for site-directed genetic modification in yeast(26–30) allows us to exchange precisely the causative alleles for their counterparts inthe superior and inferior parent, which allows evaluating the contribution of thecausative alleles in the haploid parent background.
Polygenic analysis of complex traits has generally been carried out with two haploidparent strains that differ considerably in the trait of interest, i.e., a superior parent andan inferior parent. However, crossing of two strains with similar properties can alsogenerate segregants that strongly differ in these properties and that therefore can besubmitted to selection of superior segregants, pooled-segregant whole-genome se-quence analysis for QTL mapping and RHA or allele exchange for identification of thecausative alleles. Inbreeding populations, in which the genomes of different strainshave been mixed to a great extent by multiple meiotic recombinations, have beenestablished for that purpose. This greatly reduces genomic linkage and thus makes theQTLs much smaller, facilitating identification of the causative alleles. This approach hasbeen used for elucidation of the genetic basis of multiple complex traits (13, 31–35). Inthis case, both parents are bound to harbor causative genetic elements for establishinga superior trait. However, genetic analysis of a complex trait using superior and inferiorparents generally also reveals QTLs linked to the inferior parent (17, 20, 22, 23, 36, 37).This indicates the presence of many alleles with potential impact on a specific complextrait as well as the importance of synthetic interactions between appropriate alleles forconferring a complex trait.
In this study, we have investigated the polygenic basis of 2-phenylethyl acetateproduction, a desirable flavor compound with a honey-, rose-like aroma. Production ofhigher 2-PEAc levels can thus be considered a superior trait. We have used two randomsegregants (BTC.1D and ER18) derived from two nonselected diploid strains as parentsand identified offspring with high 2-PEAc production. Several major QTLs were thenmapped by pooled-segregant whole-genome sequence analysis, and two novel caus-ative alleles of TOR1 and FAS2 were identified as superior alleles derived from strainBTC.1D. Exchange of the superior alleles of TOR1 and FAS2 by CRISPR/Cas9-mediatedallele exchange into the ER18 parent strain established the high 2-PEAc production(70%), indicating that these two superior alleles were responsible for the majority of thehigh 2-PEAc production capacity. The superior FAS2 allele contained two unique SNPs,not present in any other sequenced yeast strain, that after exchange into the ER18parent strain led to a 25% increase in 2-PEAc production. These alleles might be usefultools for construction of cisgenic industrial yeast strains for production of alcoholicbeverages with specific modifications of the flavor profile.
Polygenic Analysis of Rose Flavor Production in Yeast ®
November/December 2017 Volume 8 Issue 6 e01173-17 mbio.asm.org 3
m
bio.asm.org
on April 13, 2018 - P
ublished by m
bio.asm.org
Dow
nloaded from

RESULTSFlavor profile of a set of segregants obtained from unselected parent strains.
We have obtained a pool of haploid strains for flavor profile analysis by sporulating ahybrid diploid Saccharomyces cerevisiae yeast strain, obtained by crossing two descen-dants from the unrelated industrial yeast strains WLP575, an ale yeast, and Ethanol Red(ER), a bioethanol production yeast. BTC.1D (MAT�), a segregant from WLP575, andER18 (MATa), a segregant from ER, were crossed to generate a hybrid diploid namedBTC.1D/ER18. This hybrid strain was sporulated, and 574 segregants were isolated andevaluated in small-scale fermentations for flavor production.
We have used bar graphs to visualize the production data distribution among thesegregants for each flavor compound (Fig. 1). Some segregants produced much higherlevels of specific flavor compounds than the two parent strains. For isobutyl acetate,one segregant produced 3.14 ppm which is almost 4 times higher than the levelproduced by the best parent strain (0.85 ppm). Similarly, the highest production ofethyl acetate reached in the population of segregants was 123 ppm, whereas theparent strains produced 53.6 and 47.2 ppm. For 2-PEAc, one of the segregants pro-
FIG 1 Bar graphs of flavor compound production by the segregants from the BTC.1D/ER18 strain. Fermentations were carried out in 100 ml YP250Glu10%,and flavors were measured by GC-FID at the end of fermentation. The flavor production by the parent strains is represented by black arrows (BTC.1D) andgray arrows (ER18). The lowest value indicated represents either the lowest value measured or the detection limit.
Trindade de Carvalho et al. ®
November/December 2017 Volume 8 Issue 6 e01173-17 mbio.asm.org 4
m
bio.asm.org
on April 13, 2018 - P
ublished by m
bio.asm.org
Dow
nloaded from

duced 4 ppm, while the BTC.1D and ER18 parent strains produced only 1.7 and 1.9 ppm,respectively. Because 2-PEAc is an important and highly desirable ester in alcoholicbeverages due to its pleasant rose-like and honey-like aroma and since little is knownabout factors controlling its synthesis, we have selected this flavor production trait forgenetic analysis.
Pooled-segregant whole-genome sequence analysis and QTL mapping. Wehave composed a pool of 24 selected, superior segregants with a 2-PEAc productionlevel of at least 2.8 ppm, corresponding to the 2-PEAc level produced by the 98thpercentile of the MCB yeast strain collection, and a second “unselected pool” with 24random segregants. Both pools were subjected to pooled-segregant whole-genomesequence analysis using Illumina HiSeq2000 technology (Beijing Genomics Institute[BGI], Hong Kong, China).
The sequence reads from the parental strains and the pool were first aligned to thereference S288c genome sequence to identify all SNPs after which the SNPs betweenthe two parent strains with a coverage of at least 20 times were selected followingprevious polygenic analysis protocols (17, 38). SNPs of the individual parent strains withthe S288c reference genome sequence but absent in the parent strains themselves (i.e.,the same nucleotide was present in the two parent strains) were filtered out using thenext-generation sequencing eclipse plugin (NGSEP) program. The SNP variant fre-quency was used for QTL mapping using the NGSEP program in order to identify thegenomic loci linked to high 2-PEAc production. For this purpose, the SNP variantfrequency was plotted against the chromosomal position of the SNP using version0.99.903 of the RStudio program, generating the QTL map (Fig. 2). Next, P valuescalculated from the SNP variant frequency data were plotted against the respectivechromosomal position. P values of �0.05 were considered statistically significant.Because of the low number of segregants and the unexpectedly large variation of theSNP variant frequency in the random pool, we calculated the P values for the wholegenome both with the mapping result of the random pool as a reference and also withthe mean value of 0.5 for the whole genome as a reference, which is the value thatwould normally be expected for most of the genome (23) (Fig. 2).
Since genomic elements of both parent strains could contribute to the high 2-PEAcphenotype in the superior pool, the QTLs could be linked to either parent genome. Ahigh SNP frequency, significantly above 50%, indicated linkage with the correspondingpart of the genome of the BTC.1D parent strain, while a low SNP frequency indicatedlinkage with the corresponding part of the genome of the ER18 parent strain. Themidline obtained fluctuated around 50% inheritance in most areas of the genome.Strong deviation from 50% inheritance was observed on chromosomes VII, X, XV, andXVI. The QTLs on chromosomes X and XVI were linked to the BTC.1D parent genome,while the QTLs on chromosomes VII and XV were linked to the ER18 parent genome(Fig. 2). We have selected the QTLs on chromosomes X and XVI linked to the BTC.1Dparent for further analysis.
Identification of TOR1 as a causative gene in the major QTL on chromosome X.First, we have fine mapped the major QTL on chromosome X by scoring selected SNPsby allele-specific PCR in the 24 individual superior segregants. Random SNPs werechosen throughout the QTL region at an average distance of 5 to 15 kb, resulting in atotal of seven SNPs. The whole region of 46.5 kb showed strong linkage, with a P valuelower than 0.001. The highest linkage (P value of 3.6 � 10�5) was observed for a 15-kbregion located in the middle of the QTL. This region contained 12 genes, of which 5 hadnonsynonymous mutations in the open reading frame (ORF) (Fig. 3A to C). Amongthese five genes, three were nonessential genes and their possible effect on the 2-PEAcphenotype was verified by deleting each gene individually.
Since neither the haploid parents nor the diploid hybrid showed the superiorphenotype, the possible involvement of the candidate genes was investigated in asuperior segregant, strain 442. This haploid strain exhibited a 2-PEAc production ofabout 4 ppm and contained the superior allele in the region under investigation. Thenonessential genes MOG1, BNA2, and TOR1 were deleted in this superior segregant by
Polygenic Analysis of Rose Flavor Production in Yeast ®
November/December 2017 Volume 8 Issue 6 e01173-17 mbio.asm.org 5
m
bio.asm.org
on April 13, 2018 - P
ublished by m
bio.asm.org
Dow
nloaded from

FIG 2 Genetic mapping of QTLs involved in high phenylethyl acetate production by pooled-segregant whole-genome sequence analysis. Pooled F1selected or random segregants (24 segregants in each pool) were subjected to sequence analysis with the Illumina platform at BGI. The chromosome
(Continued on next page)
Trindade de Carvalho et al. ®
November/December 2017 Volume 8 Issue 6 e01173-17 mbio.asm.org 6
m
bio.asm.org
on April 13, 2018 - P
ublished by m
bio.asm.org
Dow
nloaded from

replacing them with a nourseothricin resistance marker cassette. The deletion strainswere evaluated by fermentation for flavor production, and a significant decrease in2-PEAc production was observed only for the 442 tor1Δ strain (Fig. 3D).
Sequence comparison of the TOR1 alleles from the two parents revealed severalpolymorphisms, eight of them leading to nonsynonymous mutations (Table 1). Themost striking mutation was an early stop codon at position 216 of the amino acidsequence in the ER18 parent, while the wild-type Tor1 protein has a total length of2,470 amino acids. The truncated protein was expected to cause a phenotype similar to
FIG 2 Legend (Continued)number is shown in the top right corner of each set of graphs. The SNP variant frequency was used for QTL mapping. Black lines represent the random“unselected pool,” and red lines represent the selected “superior pool” (top rows). The log odds ratio with confidence interval is shown in the second rows.The most reliable QTLs are indicated by stippled rectangles. When the SNP variant frequency is �0.5, linkage is with the BTC.1D parent. When the SNPvariant frequency is �0.5, linkage is with the ER18 parent. P values calculated from the sequencing data were plotted against the respective chromosomalposition (third rows). P values of �0.05 (indicated by dotted line) were considered statistically significant. The blue line represents P values calculated with0.5 as reference for the whole genome. The green line represents P values calculated with the actual result of the random pool as the reference for thewhole genome.
FIG 3 Identification of TOR1 as a causative gene in QTL1 located on chromosome X. (A) SNP variantfrequency for seven selected SNPs as determined with the 24 superior segregants individually. (B) P valuesfor the same seven SNPs plotted against their chromosomal position. P values below 0.05 were consideredstatistically significant. (C) Overview of all genes present in the region with strongest linkage of the QTL1on chromosome X. Genes marked with an asterisk contain one or more nonsynonymous mutations in theORF. (D) 2-PEAc production in strains derived from superior segregant 442: wild-type (wt), tor1Δ, andtor1E216* strains. Fermentations were carried out in 100 ml YP250Glu10%. 2-PEAc was measured at the endof fermentation. Values that were significantly different (P � 0.01) by the unpaired Student t test from thevalue for 2-PEAc production for the wild-type strain are indicated by two asterisks. (E) TOR1 allele swappingin the parent strains BTC.1D and ER18. Fermentations were carried out in 100 ml YP250Glu10%. 2-PEAc wasmeasured at the end of fermentation. Values for 2-PEAc production that were significantly different (P �0.001) by the unpaired Student t test are indicated by a bar and three asterisks.
Polygenic Analysis of Rose Flavor Production in Yeast ®
November/December 2017 Volume 8 Issue 6 e01173-17 mbio.asm.org 7
m
bio.asm.org
on April 13, 2018 - P
ublished by m
bio.asm.org
Dow
nloaded from

that of the 442 tor1Δ strain. We inserted this specific point mutation in the superiorsegregant 442 by CRISPR/Cas9 methodology and compared the phenotype of themutant strain with that of the wild-type 442 and 442 tor1Δ strains. Figure 3D shows thatthe 442 tor1Δ and 442 tor1E216* strains produced similarly reduced levels of 2-PEAc,which were approximately 30% lower than that of the wild-type strain. This indicatedthat TOR1 affected 2-PEAc production and that the tor1E216* allele, derived from strainER18, behaved as a loss-of-function allele.
The TOR1 alleles were also exchanged in the parent strains. The stop codonmutation E216* was introduced in the BTC.1D parent, while the E216 residue wasrestored in the ER18 parent, both via CRISPR/Cas9 methodology. The 2-PEAc produc-tion by the BTC.1D tor1E216* and ER18 TOR1E216 strains was evaluated in small-scalefermentations. The introduction of the early stop codon into the BTC.1D parent resultedin a decrease of about 40% in 2-PEAc production, while ER18 showed a 35% increasewhen the E216 residue was restored and the complete wild-type Tor protein was
TABLE 1 Occurrence of nonsynonymous mutations in the proteins Tor1 and Fas2 in a setof 39 yeast strains for which the complete genome sequence is known
Strain
Amino acid in Tor1 at position:Amino acid in Fas2 atposition:
58 133 216 396 547 1117 1640 2414 57 565 1136 1624 1800
BTC.1Da D S E N N S F K T N T I NER18a G N * K S P V R A S A V S
S288c D S E N N S F K A S A V SAWRI796 P F T Y K N A V NBC 187 D S E K S S F K T N A V NBY4741 D S E N N S F K A S A V SBY4742 D S E N N S F K A S A V SCBS7960 E K S S V R A S A V SCEN.PK D S E K S S V R A S A V ND273-10B G N E K S S V R A S A V NDBVP6044 G N E K S S V R A N A V NEC1118 D S E K S S V K A N A V NEC9-8 G N E K S S T N A V NFL100 D S E N N S F K A S A V SFY1679 D S E N N S F K X N A V NFostersB P P F T Y X A N A V NFostersO E K S A N A V NJAY291 D S E K S S V R A S A V SJK9-3d D S E K S S V R A S A V SK11 G N E K S P V R A S A V SKyokai7 G N E K S P V R T N A V NL1528 D S E K S S F K A N A V NLalvinQA23 Y A S A V NRM11-1a D S E K S S F K T N A V NRedStar G N E K S S F R T N A V NSEY6210 D S E K S S V R A S A V SSK1 G N E K S S V R A S A V NUC5 G N E K S P V R A S A V SVL3 D S E K S S A S A V SVin13 D S E K S A S A V SW303 D S E N N S F K T N A V NX2180-1A D S E N N S F K X N AY55 G N E K S S V R A S A V SYJM269 G N E K S S V R A S A V SYJM339 G N E K S P V R T N A V NYJM789 G N E K S P V R A S A V SYJM499 D S E K S S V R T N A V NYPS128 G N E K S S V R A S A V SYPS163 G N E K S S V R A S A V NYS9 P P F T Y R A S A V NZTW1 G N E K S S V R T N A V NaThe amino acids for parental strains BTC.1D and ER18 are shown in boldface type. The asterisk indicates anonsense mutation.
Trindade de Carvalho et al. ®
November/December 2017 Volume 8 Issue 6 e01173-17 mbio.asm.org 8
m
bio.asm.org
on April 13, 2018 - P
ublished by m
bio.asm.org
Dow
nloaded from

therefore expressed (Fig. 3E). These results further confirmed that TOR1 was thecausative gene in the major QTL on chromosome X and that Tor1 inactivation com-promises 2-PEAc production.
Identification of FAS2 as a causative gene in the major QTL on chromosomeXVI. We have performed fine mapping with allele-specific PCR to confirm and down-scale the major QTL on chromosome XVI. Six SNPs were selected; these SNPs covereda region of 54 kb. The region between the first and fifth SNP showed strong linkagewith the BTC.1D parent with P values ranging from 0.002 to 0.007 (Fig. 4A and B). Thisarea consists of 25 genes, most of them containing nonsynonymous mutations in theORF as well as mutations in the promoter and/or terminator regions. The region wasdivided in 10 blocks in order to evaluate consecutive sets of genes for location of thecausative gene in a process of bulk replacement (Fig. 4C). As for the major QTL onchromosome X, we chose the superior segregant 442, which contained the genomicsequence of the BTC.1D parent over the whole length of this QTL, for exchange of theselected blocks of genes.
Direct replacement of the blocks of genes was required, since the superior seg-regant 442 is haploid and some genes in the blocks are essential. Direct replacement
FIG 4 Identification of FAS2 as a causative gene in QTL2 located on chromosome XVI. (A) SNP variantfrequency for six selected SNPs as determined with the 24 superior segregants individually. (B) P values forthe same six SNPs. P values below 0.05 were considered statistically significant. (C) QTL2 was divided into10 gene blocks, which were each tested for causative character using CRISPR/Cas9 direct replacement bythe 2xgRNA approach. (D) Block 7 contained the FAS2 gene, which turned out to be causative for QTL2. (E)2-PEAc production by the wild-type (wt) strain 442 and derivatives with a bulk replacement of each geneblock (gene block 1 [b1] to 10 [b10]). Fermentations were carried out in 100 ml YP250Glu10%. 2-PEAc wasmeasured at the end of fermentation. The value for 2-PEAc production was significantly different (P � 0.05)from the value for the wild type by the unpaired Student t test as indicated by the asterisk. (F) FAS2 alleleswapping in the parent strains BTC.1D and ER18. Fermentations were carried out in 100 ml YP250Glu10%.2-PEAc was measured at the end of fermentation. The 2-PEAc production values indicated by a bar and twoasterisks were significantly different (P � 0.01) by the unpaired Student t test.
Polygenic Analysis of Rose Flavor Production in Yeast ®
November/December 2017 Volume 8 Issue 6 e01173-17 mbio.asm.org 9
m
bio.asm.org
on April 13, 2018 - P
ublished by m
bio.asm.org
Dow
nloaded from

was achieved using CRISPR/Cas9 methodology using two guide RNAs (gRNAs), onetargeting a sequence upstream of the first SNP of interest and the other targeting asequence downstream of the last SNP of interest. The donor DNA was PCR amplifiedfrom the ER18 parent, which apparently contained the genomic DNA with the inferiorcausative allele. The bulk replacement strains for each block of genes were used insmall-scale fermentations and 2-PEAc production was measured at the end of fermen-tation. This revealed a conspicuous drop in 2-PEAc production specifically with the 442strain in which block number 7 with the BTC.1D parent sequence had been exchangedfor the sequence of the ER18 parent strain (Fig. 4E).
The length of block 7 was 6.4 kb, and it contained one gene (FAS2) with about500 bp of its promoter and terminator. Since FAS2 encodes the alpha subunit of fattyacid synthetase, it appeared to be the best candidate causative gene in this block(Fig. 4D). Comparison of the FAS2 gene sequences of the BTC.1D and ER18 parentstrains revealed five nonsynonymous mutations in the open reading frame. We checkedthe occurrence of those amino acid mutations in 39 strains for which the whole-genome sequence is available in the Saccharomyces Genome Database. The results areshown in Table 1. Fas2 is a highly conserved protein, and of the five amino acid changesfound in the BTC.1D parent sequence, two were not found in any sequenced strain. Atposition 1136 in the amino acid sequence, strain BTC.1D contained threonine, while allthe other strains contained alanine, while at position 1624 in the amino acid sequence,BTC.1D contained isoleucine, while it was valine in all other strains. For practicalreasons, the BTC.1D superior allele, FAS2A57T,S565N,A1136T,V1624I,S1800N, will be referred toas FAS2BTC.1D and the inferior allele from strain ER18 will be referred to as fas2ER18.
In order to confirm FAS2 as the causative allele in the major QTL on chromosomeXVI, we performed FAS2 allele swapping in the parent strains by targeting the samecutting sites used to construct the bulk replacement in segregant 442. The productionof 2-PEAc by the newly constructed transformant strains was compared with that of thewild-type parents BTC.1D and ER18. Figure 4F shows that the replacement of FAS2BTC.1D
by the fas2ER18 allele in the BTC.1D parent led to a 25% reduction in 2-PEAc production,while the replacement of fas2ER18 by the FAS2BTC.1D allele in the ER18 parent raised itby 30%. We did not test the effect of FAS2 deletion on 2-PEAc production because FAS2is an essential gene.
Establishing the superior phenotype by replacing the TOR1 and FAS2 alleles inthe ER18 parent strain. QTL mapping revealed four major QTLs linked to highproduction of 2-PEAc. Allele-specific PCR analysis with the two parent strains confirmedthat the ER18 parent contained the superior allele for the QTLs on chromosomes VII andXV and the inferior allele for the QTLs on chromosomes X and XVI, in which weidentified TOR1 and FAS2, respectively, as the causative genes. Hence, we decided toreplace both the inferior alleles tor1E216* and fas2ER18 by the TOR1E216 and FAS2BTC.1D
superior alleles, respectively, in the ER18 parent strain to obtain a strain possessingsuperior alleles of the four major QTLs (Fig. 5A). Also the single replacement strainswere constructed. The original ER18 parent strain and the modified ER18 strains wereused in small-scale fermentations, and 2-PEAc production was analyzed. This showedthat the replacement of tor1E216* was already enough to reach the superior phenotypeof the selected segregants (�2.8 ppm 2-PEAc), while the replacement of both inferioralleles, tor1E216* and fas2ER18, led to an increase of about 70% in 2-PEAc production,reaching about 3.5 ppm, almost as high as the level of 4 ppm for the top superiorsegregant 442 (Fig. 5A).
To test whether the FAS2BTC.1D allele was dominant or recessive in the same geneticbackground, we crossed the control strain ER18 (MAT�) and the strain ER18 FAS2BTC.1D
(MAT�) with strain ER18 (MATa) to obtain the two diploid strains ER18/ER18 andER18/ER18 FAS2BTC.1D (Fig. 5B). To perform the same test with a different geneticbackground, we crossed the control strain ER18 (MAT�) and the strain ER18 FAS2BTC.1D
(MAT�) with strain 16D (MATa) to obtain the diploid strains ER18/16D and ER18FAS2BTC.1D/16D (Fig. 5B). Strain 16D is a haploid segregant of JT22689, a strain used in“sturm” must fermentations (Austria) (21), which contains the fas2ER18 allele. In all of the
Trindade de Carvalho et al. ®
November/December 2017 Volume 8 Issue 6 e01173-17 mbio.asm.org 10
m
bio.asm.org
on April 13, 2018 - P
ublished by m
bio.asm.org
Dow
nloaded from

constructed diploid strains, any mutant TOR1 allele with the early stop codon E216* wascorrected into the wild-type TOR1 allele. Therefore, any difference between the diploidstrain pairs would be due only to the effect of the FAS2BTC.1D allele. (The TOR1 gene wastherefore not mentioned in the genotypes indicated in Fig. 5B.) In both diploid strainpairs, the presence of a wild-type FAS2 copy together with one copy of the superiorallele FAS2BTC.1D in the same strain was sufficient to increase 2-PEAc productionsignificantly above that in the control strain containing two FAS2 wild-type alleles,indicating the dominant character of the FAS2BTC.1D allele (Fig. 5B).
Production of the other flavor compounds in the ER18 strains engineered forhigh 2-PEAc production. The single and double replacement ER18 strains were alsoevaluated for the production of other flavor compounds in YP250Glu10% (0.27% yeastextract, 0.54% Bacto peptone to a total predicted nitrogen content of 250 mg/liter,which is in the same range as in beer and wine fermentations, and 10% [wt/vol]glucose) medium (Fig. 6). For none of the other acetate esters, ethyl, isobutyl, andisoamyl acetate, was there any significant change in the production level compared tothe parent ER18 strain. Hence, in YP250Glu10% medium, the mutations causing the
FIG 5 Allele swapping of both causative alleles from strain BTC-1D into the ER18 parent strain and testfor dominance/recessivity of the FAS2BTC.1D allele. (A) The tor1E216* SNP in parent strain ER18 was changedinto the wild-type TOR1E216 amino acid from parent strain BTC.1D, and the FAS2ER18 allele in parent strainER18 was replaced by the FAS2BTC.1D allele from parent strain BTC.1D, while in the third ER18-derivedstrain, both changes were introduced. 2-PEAc production by the parent strain ER18, the single anddouble replacement strains, and strain 442, one of the top 2-PEAc-producing segregants, is shown.Fermentations were carried out in 100 ml YP250Glu10%. 2-PEAc was measured at the end of fermen-tation. The values for 2-PEAc production were significantly different by one-way analysis of variance(ANOVA) with Dunnet’s multiple-comparison test as indicated by a bar and asterisks as follows: *, P �0.05; ***, P � 0.001. (B) The strains ER18 TOR1*216E and ER18 TOR1*216E FAS2BTC.1D were crossed with ER18TOR1*216E (white bars) and 16D (black bars). Fermentations were carried out in 100 ml YP250Glu10%.2-PEAc was measured at the end of fermentation. The values for 2-PEAc production were significantlydifferent (P � 0.05) by the unpaired t test as indicated by the bar and single asterisk.
Polygenic Analysis of Rose Flavor Production in Yeast ®
November/December 2017 Volume 8 Issue 6 e01173-17 mbio.asm.org 11
m
bio.asm.org
on April 13, 2018 - P
ublished by m
bio.asm.org
Dow
nloaded from

increase in 2-PEAc production do not have a general effect on acetate ester production.On the other hand, for isobutanol, isoamyl alcohol, and particularly phenylethanol,there appeared to be an increase similar to that observed for phenylethyl acetate. Theincrease in phenylethanol, which also has a rose flavor, may strengthen the effect of theenhanced 2-PEAc level on total rose flavor impression. The higher increase in phenyle-thanol (97%) compared to isobutanol and isoamyl alcohol (35% and 39%, respectively)may explain why only the increase in phenylethyl acetate was significant and not thatin isobutyl acetate and isoamyl acetate. The FAS2 allele caused a strong reduction in theproduction of ethyl hexanoate and ethyl octanoate, which may be due to reducedactivity of Fas2 for synthesis of medium-chain fatty acids and/or indicate competitionbetween the synthesis of these compounds and the synthesis of 2-PEAc. For acetalde-hyde, there was no significant difference among the four strains.
The double replacement strain, containing TOR1E216 and FAS2BTC.1D, was also com-pared with the parent strain in wort fermentations (Fig. 7). This revealed a 60% increasein the level of 2-PEAc, confirming the potency of the superior alleles to enhance roseflavor production. As in YP medium, the level of isobutanol and isoamyl alcohol, but notthat of phenyl ethanol, was significantly increased. The double replacement strain alsoshowed a significant increase in both isoamyl alcohol and isoamyl acetate, leaving theratio unchanged, as opposed to YP medium where only isoamyl alcohol increased and
FIG 6 Evaluation of the complete flavor profile of the engineered ER18 strains. The tor1E216* SNP inparent strain ER18 was changed into the wild-type TOR1E216 amino acid from parent strain BTC.1D, andthe FAS2ER18 allele in parent strain ER18 was replaced by the FAS2BTC.1D allele from parent strain BTC.1D,while in the third ER18-derived strain, both changes were introduced. The production of different flavorcompounds by the wild-type parent strain ER18, the single replacement strains (ER18 TOR1E216 and ER18FAS2BTC.1D), double replacement strains, and strain 442, one of the top 2-PEAc-producing segregants, isshown. Fermentations were carried out in 100 ml YP250Glu10% at 140 rpm and 25°C. Flavor compoundswere measured at the end of fermentation. For each flavor compound, the one-way ANOVA withDunnet’s multiple-comparison test was applied to determine significance of any difference with thecontrol strain ER18 (*, P � 0.05; **, P � 0.01; ***, P � 0.001).
Trindade de Carvalho et al. ®
November/December 2017 Volume 8 Issue 6 e01173-17 mbio.asm.org 12
m
bio.asm.org
on April 13, 2018 - P
ublished by m
bio.asm.org
Dow
nloaded from

not isoamyl acetate. Interestingly, in wort medium, there was no significant drop in theproduction of ethyl hexanoate and ethyl octanoate, as opposed to YP medium.
DISCUSSION
Polygenic analysis is turning out to be a powerful tool to identify novel componentsinvolved in physiological and biochemical traits by addressing natural variation in anunbiased way. Examples include MKT1 in sporulation capacity (39), high-temperaturegrowth (40), and mitochondrial genome stability (41), and global gene expression (42),APJ1 in ethanol tolerance (17), KIN3 in maximal ethanol accumulation capacity (23),CUP2, GLO1, and DOT5 in acetic acid tolerance (21), NCS2, PRP42, and SMD2 inthermotolerance (22, 43) and also for wine aroma production with PDR8 in theproduction of farnesyldiphosphate derivatives, ABZ1 in the production of numerousflavor compounds, PLB2 in ethyl ester synthesis (13), and IRC7 in production of thevarietal thiol 4-mercapto-4-methylpentan-2-one (4MMP) (44).
In this work, we have used segregants from nonselected parent strains for pheno-typing and QTL mapping by pooled-segregant whole-genome sequence analysis. Theproduction of 2-PEAc in the segregants ranged from less than 0.1 ppm to about4.0 ppm, and many segregants produced a higher level of 2-PEAc than the parentstrains, which produced about 2 ppm (1.74 and 1.9 ppm). Steyer et al. (13) reported thatsegregants from a cross between a laboratory strain and a wine strain could exceed theproduction level of both parents for some flavor compounds, which was most pro-nounced for acetate esters. The flavor threshold values reported for 2-PEAc in wine andbeer differ greatly, ranging from 0.25 (in the presence of 10% ethanol) to 3.8 ppm (2,7, 45). We decided to take a stringent cutoff of at least 2.8 ppm for 2-PEAc productionby the segregants. This corresponds to a very high level of 2-PEAc production, presentin only a small minority of natural and industrial yeast strains. It resulted in a pool of 24superior segregants.
In this work, we have identified two new genetic elements, FAS2 and TOR1, that havenever previously been connected to production of 2-PEAc, an important flavor com-pound in alcoholic beverages, imparting a honey- and rose-like flavor. Because of thesevere truncation, the tor1E216* allele likely produces an inactive gene product. Whilethe identification of TOR1 as a causative allele reveals an unexpected link between TORsignaling and 2-PEAc production, the molecular connection remains unclear.
TOR1 encodes a phosphatidylinositol kinase homologue that regulates multiplecellular processes, including induction of autophagy (46) and the diauxic shift, and it
FIG 7 Evaluation of the flavor profile in brewing wort of strain ER18 and its TOR1 FAS2 doublereplacement strain. The TOR1*216E and FAS2BTC.1D alleles were engineered into the ER18 strain to obtainthe ER18TOR1*216E FAS2BTC.1D strain. Both strains were used for fermentations in 17°P Brouwland brewingwort with 20 ppm O2 at 20°C. Flavor compounds were measured at the end of fermentation. For eachflavor compound, the unpaired t test was applied to determine significance of any difference betweenthe two strains (*, P � 0.05; **, P � 0.01; ***, P � 0.001).
Polygenic Analysis of Rose Flavor Production in Yeast ®
November/December 2017 Volume 8 Issue 6 e01173-17 mbio.asm.org 13
m
bio.asm.org
on April 13, 2018 - P
ublished by m
bio.asm.org
Dow
nloaded from
directly modulates glucose activation and discrimination pathways (47). Tor1 has neverbeen directly associated with flavor production, although its major downstream targetSch9 has been found as an important regulator for ATF1 expression (48). Tor1 iswell-known to be involved in nitrogen-regulated processes, such as nitrogen cataboliterepression (49, 50). Since most industrial fermentation processes with the yeastSaccharomyces cerevisiae happen under nitrogen starvation and since flavor pro-duction is strongly affected by nitrogen availability (51), the defective TOR1 alleleidentified in our study may affect 2-PEAc production through interference withnitrogen metabolism. Tor signaling also regulates the transcription of amino acidpermeases and therefore might influence the levels of L-phenylalanine and itsbreakdown product 2-phenylethanol (2-PE) as precursors of 2-PEAc synthesis (52).Insertion of the nonsense mutant allele tor1E216* in the superior segregant 442 andthe BTC.1D parent strain led to a decrease of about 30% in 2-PEAc production.Fermentation performance was not affected by this TOR1 replacement or by itsdeletion, and therefore, the reduction in ester production is not due to sluggish orincomplete fermentation. This nonsense mutation was not present in any otherS. cerevisiae strain in which the genome has been completely sequenced. Theusefulness of this defective allele for industrial strain improvement therefore ap-pears very limited, since most natural and industrial yeast strains likely also have anintact wild-type TOR1 allele.
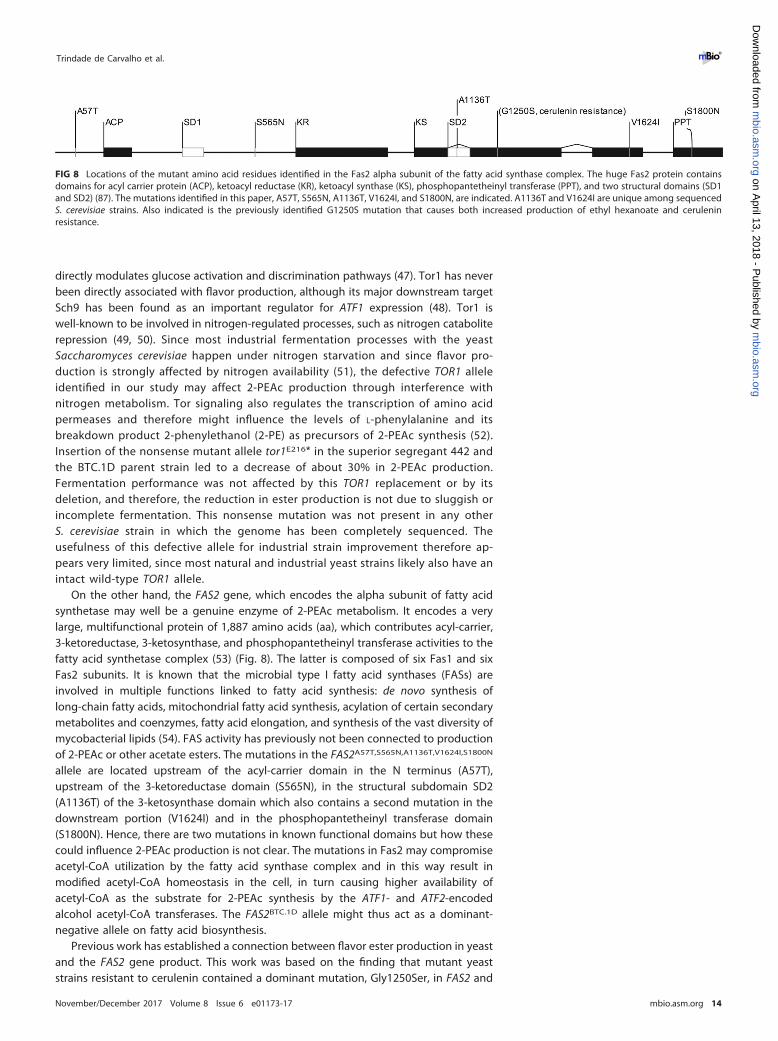
On the other hand, the FAS2 gene, which encodes the alpha subunit of fatty acidsynthetase may well be a genuine enzyme of 2-PEAc metabolism. It encodes a verylarge, multifunctional protein of 1,887 amino acids (aa), which contributes acyl-carrier,3-ketoreductase, 3-ketosynthase, and phosphopantetheinyl transferase activities to thefatty acid synthetase complex (53) (Fig. 8). The latter is composed of six Fas1 and sixFas2 subunits. It is known that the microbial type I fatty acid synthases (FASs) areinvolved in multiple functions linked to fatty acid synthesis: de novo synthesis oflong-chain fatty acids, mitochondrial fatty acid synthesis, acylation of certain secondarymetabolites and coenzymes, fatty acid elongation, and synthesis of the vast diversity ofmycobacterial lipids (54). FAS activity has previously not been connected to productionof 2-PEAc or other acetate esters. The mutations in the FAS2A57T,S565N,A1136T,V1624I,S1800N
allele are located upstream of the acyl-carrier domain in the N terminus (A57T),upstream of the 3-ketoreductase domain (S565N), in the structural subdomain SD2(A1136T) of the 3-ketosynthase domain which also contains a second mutation in thedownstream portion (V1624I) and in the phosphopantetheinyl transferase domain(S1800N). Hence, there are two mutations in known functional domains but how thesecould influence 2-PEAc production is not clear. The mutations in Fas2 may compromiseacetyl-CoA utilization by the fatty acid synthase complex and in this way result inmodified acetyl-CoA homeostasis in the cell, in turn causing higher availability ofacetyl-CoA as the substrate for 2-PEAc synthesis by the ATF1- and ATF2-encodedalcohol acetyl-CoA transferases. The FAS2BTC.1D allele might thus act as a dominant-negative allele on fatty acid biosynthesis.
Previous work has established a connection between flavor ester production in yeastand the FAS2 gene product. This work was based on the finding that mutant yeaststrains resistant to cerulenin contained a dominant mutation, Gly1250Ser, in FAS2 and
FIG 8 Locations of the mutant amino acid residues identified in the Fas2 alpha subunit of the fatty acid synthase complex. The huge Fas2 protein containsdomains for acyl carrier protein (ACP), ketoacyl reductase (KR), ketoacyl synthase (KS), phosphopantetheinyl transferase (PPT), and two structural domains (SD1and SD2) (87). The mutations identified in this paper, A57T, S565N, A1136T, V1624I, and S1800N, are indicated. A1136T and V1624I are unique among sequencedS. cerevisiae strains. Also indicated is the previously identified G1250S mutation that causes both increased production of ethyl hexanoate and ceruleninresistance.
Trindade de Carvalho et al. ®
November/December 2017 Volume 8 Issue 6 e01173-17 mbio.asm.org 14
m
bio.asm.org
on April 13, 2018 - P
ublished by m
bio.asm.org
Dow
nloaded from

at the same time showed higher production levels of ethyl caproate, a compoundproducing highly desirable apple-like flavors in sake (55, 56). The cerulenin resistanceconferring mutation G1250S is located in the middle of the 3-ketosynthase domain(Fig. 8). Much work in this respect has been performed for the construction ofself-cloned nongenetically modified organism (non-GMO) sake strains with mutationsin FAS2 that enhance ethyl caproate production and were obtained on the basis ofcerulenin resistance (57–62). There is little information, however, concerning the pos-sible effect of these cerulenin resistance-conferring mutations in FAS2 on the produc-tion of other flavor compounds in yeast. This approach to improve the flavor profile ofan alcoholic beverage has been very limited due to the very specific nature of thecerulenin resistance-conferring mutations. Our work using polygenic analysis of flavorcompound production allows for a much broader and unbiased approach to identifynovel genes involved, directly or indirectly, in the production of specific flavor com-pounds.
In the present study, we have identified a naturally occurring FAS2 allele conferringsuperior production of 2-PEAc, but other flavor compounds were also affected. Thelevel of phenylethanol was also significantly increased but only in synthetic medium. Ifthis could also happen in wort medium under other conditions, it would strengthen theincrease in perception of rose flavor in beer. Another positive effect on flavor produc-tion is that all acetate esters are enhanced except for ethyl acetate, which has agenerally negative solvent-like off-flavor. On the other hand, there was a conspicuousdrop in the positive-flavor compounds ethyl hexanoate and ethyl octanoate, but thiswas observed only in synthetic medium and not in wort medium. There was also anincrease in the level of the higher alcohols, isoamyl alcohol and isobutanol, which mayhave a positive or negative effect on flavor perception. This depends on the generalflavor profile produced by the strain genetic background, in particular the total level ofhigher alcohols already produced by the strain, as well as the application of high-gravity brewing, which generally causes more production of higher alcohols (63).
This superior FAS2BTC.1D allele does not have the mutation causing the G1250Samino acid change that provides cerulenin resistance. On the other hand, it containsother SNPs causing five amino acid changes compared to fas2ER18, three of which arealso found in other yeast strains. The mutations A1136T and V1624I are not found inany other sequenced S. cerevisiae strain and might therefore be unique mutationsresponsible for the superior acetate ester aroma profile brought about by the BTC.1Dallele. Our work has now revealed that the FAS2 gene product may play a much moreimportant role in the synthesis of flavor esters than previously anticipated, since notonly 2-PEAc production was affected by the FAS2BTC.1D allele but the production ofother flavor compounds as well. The FAS2 mutation may compromise the cycling of thefatty acids within the fatty acid synthetase complex until they reach the appropriatelength. Precocious release of hexanoyl-CoA from the complex may explain why thelevel of ethyl hexanoate was also strongly enhanced. The mutations in the fatty acidsynthetase complex may disturb lipid homeostasis, causing effects on the productionof multiple metabolically connected compounds, like the flavor esters.
2-PEAc is an acetate ester made by esterification of acetyl-CoA and 2-phenylethanol.2-PE is synthesized by degradation of the aromatic amino acid L-phenylalanine. In-creased levels of 2-PEAc can be due to higher levels of its precursor, 2-PE. Indeed,mutants of Kyokai no. 9, a sake yeast strain, that were selected for higher 2-PEproduction also showed higher levels of 2-PEAc (64). Mutants with enhanced 2-PEproduction were obtained by chemical mutagenesis, followed by selection for p-fluoro-DL-phenylalanine (PFP) resistance. PFP is a phenylalanine analog, and PFP-resistantmutants are usually deficient in phenylalanine feedback inhibition of ARO3-encoded3-deoxy-D-arabino-heptulosonate-7-phosphate (DHAP) synthase, the first enzyme inthe biosynthesis pathway of aromatic amino acids. As a consequence, phenylalanineoveraccumulates in such mutants, causing enhanced flux also in its degradationpathway, resulting in higher 2-PE levels (64, 65). This fits with the observation thataddition of high levels of L-phenylalanine in the medium also results in higher 2-PE
Polygenic Analysis of Rose Flavor Production in Yeast ®
November/December 2017 Volume 8 Issue 6 e01173-17 mbio.asm.org 15
m
bio.asm.org
on April 13, 2018 - P
ublished by m
bio.asm.org
Dow
nloaded from

levels (66). Naturally PFP-resistant mutants of S. cerevisiae accumulating high levels of2-PE have not been reported.
The catabolism of L-phenylalanine in the Ehrlich pathway is initiated by the aromaticamino acid transferases encoded by ARO8 and ARO9 (67). There have been no reportsof whether overexpression of ARO8 and/or ARO9 could enhance the level of 2-PE andthus also the level of its ester 2-PEAc. We have examined possible linkage in our QTLmapping results between the genomic position of ARO8 (chromosome [Chr.] VII,116059 to 117561) and ARO9 (Chr. VIII, 375709 to 377250) and the high 2-PEAcproduction phenotype but did not find any indication for significant linkage in our QTLmapping. There was no significant difference between the BTC.1D and ER18 allelesregarding their contribution to the phenotype.
The first step in the amino acid catabolism to produce alcohols via the Ehrlichpathway involves the transamination into alpha-keto acid, catalyzed by BAT1, BAT2,ARO8, and ARO9 genes (67). BAT1 and BAT2 are involved in the biosynthesis ofbranched-chain amino acids (valine, isoleucine, and leucine); however, overexpressionof these genes could only poorly influence 2-PE levels, while isobutanol and isoamylalcohol (and indirectly, isoamyl acetate) were significantly increased (68). However,overexpression of ARO8 and ARO9 was not evaluated. The first step in the conversionof phenylpyruvate to 2-PE is catalyzed by phenylpyruvate decarboxylase, which isencoded by ARO10, PDC1, PDC5, and PDC6 (69). There was no linkage with any one ofthese genes in the QTL mapping of high 2-PEAc production. The same was true for thegenes encoding phenylacetaldehyde dehydrogenase, SFA1, ADH5, and ADH4, catalyz-ing the second step in this conversion.
The next step in the production of acetate esters is the esterification of the higheralcohols, like 2-PE, with acetyl-CoA, which is catalyzed by the alcohol acetyl transferasesATF1 and ATF2 (4, 9, 11, 66, 70). This reaction allows the removal of 2-PE that can becytotoxic at higher concentrations and production of the less harmful ester derivative2-PEAc (66, 70). Ester formation can also regenerate the levels of free CoA in the cells(3, 71). Overexpression of ATF1 led to a 2.4- to 10.8-fold increase in 2-PEAc production,depending on the substrate, yeast strain, and fermentation conditions. Overexpressionof ATF2 had only a minor effect, while EHT1 overexpression had no effect (12). In spiteof the important role of Atf1 in production of multiple flavor esters, including 2-PEAc,there was no linkage of high 2-PEAc production in our QTL mapping experiment withthe genomic location of ATF1 (Chr. XV, 1046226 to 1047803) nor with that of ATF2 (Chr.VII, 848829 to 850436).
Adaptation of the flavor profile of alcoholic beverages by genetic modification posesmultiple challenges. Genetic modification using deletion or overexpression of specificgenes often produces unwanted side effects compromising industrial application of theengineered strains. Introduction of heterologous genes creates transgenic yeast strains,which currently are difficult to use for the production of alcoholic beverages and otherfoods. Exchange of naturally occurring S. cerevisiae alleles identified by polygenicanalysis in existing natural or industrial yeast strains minimizes the risk of significantside effects on other cellular functions important for industrial application (18). It alsocreates cisgenic yeast strains, which may be or may become more acceptable forindustrial application in the food sector (72–76). Since cisgenic yeast strains withprecisely exchanged alleles cannot be recognized as GMOs, it is not possible in practiceto apply GMO regulations to such organisms. In some countries, cisgenic or self-clonedorganisms are not considered genetically modified organisms (60, 61, 77). Examples ofself-cloned yeast strains that have received GRAS (generally recognized as safe) statusare P1Y0 (GRN000350), which is a variant of a common S. cerevisiae wine strain with asuperior MET10 allele derived from another S. cerevisiae strain, and a baker’s yeast straincarrying extra copies of the natural ASP3 gene (GRN000422).
Conclusions. We have identified two genes, the wild-type TOR1 allele and a superiorFAS2BTC.1D allele, that affect the level of the important flavor compound 2-PEAc, whichhas a highly desirable rose flavor. The FAS2BTC.1D allele allows us to strongly enhance
Trindade de Carvalho et al. ®
November/December 2017 Volume 8 Issue 6 e01173-17 mbio.asm.org 16
m
bio.asm.org
on April 13, 2018 - P
ublished by m
bio.asm.org
Dow
nloaded from

the production of 2-PEAc, even in a strain that already produces a higher level thangenerally found in fermentations by S. cerevisiae strains. This is accomplished withadditional positive effects on other flavor compounds and apparently without signifi-cant effects on compounds with a negative contribution to the flavor profile. Hence, theFAS2BTC.1D allele appears to be highly promising for the creation of cisgenic brewingstrains with an attractive and novel flavor profile.
MATERIALS AND METHODSMicroorganisms and cultivation media. Yeasts were grown in yeast extract-peptone-dextrose
(YPD) medium (2% [wt/vol] glucose, 2% [wt/vol] peptone, 1% [wt/vol] yeast extract) shaking at 200 rpmand at 30°C. For solid nutrient plates, 1.5% (wt/vol) Bacto agar was added. The Saccharomyces cerevisiaeyeast strains used in this study are listed in Table 2.
Escherichia coli cells (DH5; Invitrogen) were grown at 37°C in Luria broth (LB) medium containing0.5% (wt/vol) yeast extract, 1% (wt/vol) Bacto tryptone, and 1% (wt/vol) sodium chloride (pH 7.5). Forsolid nutrient plates, 1.5% (wt/vol) Bacto agar was added. Selection of transformants was performed inthe presence of 100 mg/ml ampicillin.
Flavor compound screening was performed in YP250Glu10% (0.27% yeast extract [Merck] and 0.54%Bacto peptone [Oxoid] to a total predicted nitrogen content of 250 mg/liter, which is in the same rangeas beer and wine fermentations, and 10% [wt/vol] glucose). The predicted nitrogen content was basedon information of titratable nitrogen from the suppliers. For confirmation, unhopped wort was used(17°Plato, 18.8% [wt/vol] malt extract, 2.068 ppm ZnSO4 · 7H2O).
Fermentation experiments. Yeast cells were first cultivated overnight in 3 ml of YPD2% (yeastextract, peptone, 2% dextrose) in a shaking incubator at 30°C and 200 rpm. This preculture was used toinoculate 100 ml of YP250Glu10% (wt/vol) with an initial optical density at 600 nm (OD600) of 0.1.Fermentation was carried out at 25°C in 100-ml fermentation tubes, previously validated againstEuropean Brewing convention (EBC) tall tubes, fitted with a water lock in order to create semianaerobicconditions, mimicking large-scale fermentations. Agitation was performed with a magnetic rod at130 rpm. Fermentation progress was monitored by weight loss due to CO2 release. Samples were takenat the end of fermentations for headspace gas chromatography coupled with flame ionization detection(GC-FID) analysis. Wort fermentations were performed at 20°C, and yeast was inoculated to an initialOD
600of 2.0.
Headspace GC-FID analysis. Headspace gas chromatography coupled with flame ionization detec-tion was used to measure flavor compounds at the end of fermentation. Samples were collected andcentrifuged at 3,500 rpm for 5 min. Then, 2-ml portions of the supernatant were collected in 25-ml vialsand analyzed using a gas chromatograph with a headspace sampler (HS40; PerkinElmer Life Sciences).The headspace was equilibrated by shaking and incubating for 10 min at 60°C using a Thermoscience RSPlus auto sampler and then injected into a polyethylene glycol column (Restek Stabilwax) (60 m by 0.25mm by 0.25 �m).
TABLE 2 S. cerevisiae strains used in this study
Strain Descriptiona Source and/or reference
WLP575 Industrial ale yeast strain “White Labs Pitchable LiquidYeast” (USA)
BTC.1D Haploid segregant from WLP575; MAT� This studyER18 Segregant of Ethanol Red (industrial yeast strain used for bioethanol production); MATa MCB, KU Leuven (21)BTC.1D/ER18 Hybrid diploid strain obtained by crossing BTC.1D and ER18 This study442 Haploid segregant from BTC.1D/ER18 with high 2-PEAc production This study442 TOR1Δ Haploid 442 with tor1Δ (marker removed) This study442 MOG1Δ Haploid 442 with mog1Δ (marker removed) This study442 BNA2Δ Haploid 442 with bna2Δ (marker removed) This study442 tor1E216* Haploid 442 with tor1E216* point mutation inserted via CRISPR/Cas9 This study442 ChrXVI.b1 Haploid 442 with block 1 exchanged by ER18 allele (ChrXVI, 79486–85523) This study442 ChrXVI.b2 Haploid 442, block 2 exchanged by ER18 allele (ChrXVI, 85504–91015) This study442 ChrXVI.b5 Haploid 442, block 5 exchanged by ER18 allele (ChrXVI, 101093–104721) This study442 ChrXVI.b6 Haploid 442, block 6 exchanged by ER18 allele (ChrXVI, 104702–108350) This study442 ChrXVI.b7 Haploid 442, block 7 exchanged by ER18 allele (ChrXVI, 108331–114729) This study442 ChrXVI.b8 Haploid 442, block 8 exchanged by ER18 allele (ChrXVI, 114710–119641) This study442 ChrXVI.b9 Haploid 442, block 9 exchanged by ER18 allele (ChrXVI, 119622. 125450) This study442 ChrXVI.b10 Haploid 442, block 10 exchanged by ER18 allele (ChrXVI, 125432–129615) This studyBTC2 Haploid BTC.1D with tor1E216* This studyBTC3 Haploid ER18 with TOR1E216 This studyBTC4 Haploid BTC.1D with fas2ER18 This studyBTC5 Haploid ER18 with FAS2BTC.1D This studyBTC6 Haploid ER18 with TOR1*216E/FAS2BTC.1D This studyaThe chromosome (e.g., chromosome XVI) and positions for the block exchanged are shown within parentheses.
Polygenic Analysis of Rose Flavor Production in Yeast ®
November/December 2017 Volume 8 Issue 6 e01173-17 mbio.asm.org 17
m
bio.asm.org
on April 13, 2018 - P
ublished by m
bio.asm.org
Dow
nloaded from

Injection block and flame ionization detector temperatures were kept constant at 220 and 250°C,respectively. The oven temperature was kept at 40°C for 2 min and then increased to 240°C at a rate of15°C/min. Helium was used as the carrier gas at a flow rate of 2.0 ml/s. GC operating conditions were asfollows: injection volume of 1 ml, split rate of 1:25, and split flow of 50 ml/min.
Mating type, sporulation, and tetrad dissection. Standard procedures were used for sporulationand tetrad dissection (78) and for mating type determination by PCR with primers for the MAT locus andMATa and MAT� DNA (79).
Molecular biology methods. Yeast cells were transformed by electroporation (80). Standard mo-lecular biology protocols were used in this work.
Genomic DNA extraction and whole-genome sequence analysis. Segregants were grown sepa-rately in 3 ml YPD and pooled by OD600 with the purpose of obtaining approximately equal amounts ofDNA for each strain. Genomic DNA was extracted and purified with the Masterpure Yeast DNApurification kit from Epicentre in order to obtain high-quality genomic DNA. At least 10 �g of DNA perpool was provided to the Beijing Genomics Institute (BGI) (Hong Kong, China) for whole-genomesequence analysis, which was performed with the Illumina platform (HiSeq2000).
Assembly and mapping were performed with NGSEP (next-generation sequencing eclipse plugin)(81). Significance tests used to determine quantitative trait loci (QTLs) were conducted by the methodof Claesen et al. (82).
Next-generation sequence analysis and statistical analysis. The sequence reads from the parentalstrains and the pool were first aligned to the reference S288c genome sequence after which singlenucleotide polymorphisms (SNPs) remaining between the two parent strains and with a coverage of atleast 20 times were selected following previous polygenic analysis protocols (17, 38). SNPs between theindividual parent strains and the reference genome sequence but absent in the parent strains themselveswere filtered out using the next-generation sequencing eclipse plugin (81). SNP variant frequencies werecalculated by dividing the number of the variant by the total number of aligned reads. Deviation from50%, either above or below, was a sign of a one-sided SNP variant segregation, indicating genetic linkageto the trait of interest (18).
Genetic linkage to the phenotype of high phenylethyl acetate (2-PEAc) production was statisticallyconfirmed using EXPloRA, a hidden Markov model (HMM)-based algorithm for extraction of overrepre-sented alleles in bulk segregant analysis (83). Finally, the SNP variant frequency mapping and datasmoothing were performed using the HMM-based algorithm developed by Claesen and Burzykowski (84)in the R platform (RStudio 0.99.903 program, R version 3.3.1, R Development Core Team, 2013). Thisalgorithm allowed reduction of the width of QTLs by estimating the significance (P value) of linkage ineach SNP location by comparing the SNP variant frequencies of the superior and random pools at thisposition. In addition, we have calculated the P value by comparing the SNP variant frequency of thesuperior pool and a predicted variant frequency of a random pool of 0.5, which would correspond, in theabsence of inadvertent linkage, to the expected situation that for the total number of reads at a certainposition, half represent the reference SNP variant and the other half represent the alternative SNP variant.
Allele-specific PCR. Fine mapping was performed by scoring selected SNPs in the 24 individualsuperior segregants. SNPs were chosen throughout each QTL at an average distance of 5 to 15 kb. Foreach SNP marker, two primers were constructed differing only at their 3=-terminal end, containing eitherthe BTC.1D or ER18 nucleotide. To select these primers, the same criteria were taken into considerationas for any regular primer. Moreover, the SNP located at the 3=-terminal end should ideally vary from Aor T to C or G and vice versa to improve the chances of specifically amplifying the BTC.1D orER18sequence.
Both primers were always applied in separate PCRs. The optimal annealing temperature wasdetermined by gradient PCR using DNA from BTC.1D and ER18 parents. The optimal temperature is theannealing temperature at which only hybridization with primers containing an exact match wasobserved. The SNP data of the individual segregants were analyzed using the binomial distributionprobability.
CRISPR/Cas9 technology. (i) Cas9 plasmid. The clustered regularly interspaced short palindromicrepeat (CRISPR)/Cas9 technology was applied by using the pTEF-Cas9-KanMX plasmid (CRISPR-mediatedgene inactivation or replacement, single copy, Cas9 behind the TEF promoter, KanMX marker) which wasderived from the p414-TEF1p-Cas9-CYC1t plasmid (27). The pTEF-Cas9-KanMX plasmid was created byintroducing the KanMX4 marker into KpnI-digested p414-TEF1p-Cas9-CYC1t.
(ii) gRNA plasmids. For each target, specific guide RNAs (gRNAs) were designed for 1x-, 2x-, or3xgRNA approach. Specific gRNAs were assembled in the XhoI-EcoRV-digested P58 vector by using theGibson Assembly kit. P58 was derived from p426-SNR52p-gRNA.CAN1.Y-SUP4t (27). It was created byassembling the HPH marker and the universal CRISPR gRNA cloning site into the p426-SNR52p-gRNA.CAN1.Y-SUP4t backbone.
(a) 1xgRNA approach—introduction of point mutation. A specific gRNA without a protospacer adjacentmotif (PAM) site and flanked by flanking regions 1 and 2 was designed. Flanking region 1 (promoter) wasGCAGTGAAAGATAAATGATC. Flanking region 2 (terminator) was GTTTTAGAGCTAGAAATAG.
Forward and reverse oligomers were hybridized and assembled in the XhoI-EcoRV-digested P58vector with the Gibson Assembly kit. For hybridization, oligomers were dissolved in STE buffer (10 mMTris [pH 8.0], 50 mM NaCl, 1 mM EDTA) at a concentration of 500 �M. Equimolar concentrations of theforward and reverse primers, were combined and heated at 94°C (4°C/min) for 3 min and slowly cooleddown (to 75°C at 0.05°C/min and then cooled to 10°C at 0.02°C/min).
Trindade de Carvalho et al. ®
November/December 2017 Volume 8 Issue 6 e01173-17 mbio.asm.org 18
m
bio.asm.org
on April 13, 2018 - P
ublished by m
bio.asm.org
Dow
nloaded from

(b) pJET-2xgRNA. The pJET-2xgRNA plasmid was derived from pJET1,2-blunt (ThermoScientific) andcontains a module consisting of the gRNA terminator and promoter. Amplification of this module,flanked by gRNA sequences, allows the addition of more gRNAs in the regular gRNA plasmids.
(c) 2xgRNA approach—allele swapping in haploids. A specific gRNA without a PAM site and flanked byflanking regions 1 and 2 was designed, one before the first SNP of interest and the other after the lastSNP of interest. Forward gRNA1 and reverse gRNA2 oligomers were used to amplify the module frompJET-2xgRNA. Amplification of this module flanked with gRNA sequences allows the addition of moregRNAs in the regular gRNA plasmids. The amplification product (505 bp) was assembled in theXhoI-EcoRV-digested P58 vector using the Gibson Assembly kit.
Design guide RNA targets. Proper gRNA targets were selected based on the presence of naturalSNPs in the inferior and superior alleles at the protospacer adjacent motif sequence or the 8 bp of DNApreceding the PAM sequence, reported to be the most important for specificity (85, 86). Next, weanalyzed potential off-targets in the genome, which are regions matching the gRNA sequence with threeor less SNPs followed by a valid PAM site.
Donor DNA. (i) Introducing a point mutation in TOR1. Donor DNA was a 71-bp oligomercontaining the desired mutation and 35-bp identical sequences on each side: TAAAGTCTTGCCTAGAATGGCTTACTGCCTCCACGTAAAAGAATTCATTCTCAAGTTCGAAGCCAGACCAT.
The forward and reverse sequences were ordered and then hybridized.(ii) Allele swapping. Donor DNA was PCR amplified from the BTC.1D parent, which contains the
superior allele on chromosome XVI. Donor DNA contained 500 to 800 bp of flanking sequence similarity.CRISPR/Cas9 application. Point mutations were introduced by using CRISPR/Cas9 technology and
a single gRNA. Bulk replacements on chromosome XVI were performed by using the 2xgRNA approach.In haploid cells, the 1x- or 2xgRNA approach was used. Cells were first transformed with 250 ng ofpTEF-Cas9-KanMX plasmid by electroporation. Cas9 transformants were pregrown overnight in 3 mlYPD-Geneticin (200 �g/ml) at 30°C. This culture was used to inoculate 50 ml YPD-Geneticin to an initialOD of 0.2. Cells were transformed by electroporation using 500 ng of the gRNA plasmid and 1,000 ng ofdonor DNA (or 2 �l of 250 �M duplexed oligomers for the point mutation). Transformants were selectedon solid YPD2% plus 200 �g/ml Geneticin and 300 �g/ml hygromycin B.
Data availability. All sequence data have been submitted to the NCBI Sequence Read Archive (SRA)(http://trace.ncbi.nlm.nih.gov/Traces/sra/sra.cgi) with the identifier SRP119133, Bioproject PRJNA412158.
ACKNOWLEDGMENTSWe gratefully acknowledge Stijn De Graeve and Thomas Talpe for help with the
fermentation experiments, Paul Vandecruys, Françoise Dumortier, and all other mem-bers of the Genetic Analysis Group for stimulating discussions, Nico Vangoethem forpreparing the figures, and Jorge Duitama for help with the bioinformatic analysis.
This work was supported by a Ph.D. fellowship from CNPq (Brazil) to B.T.D.C. and anSBO grant (IWT 140044) from IWT-Flanders to J.M.T.
The funders had no role in study design, data collection and interpretation, or thedecision to submit the work for publication.
We declare no conflicts of interest. VIB/KU Leuven has submitted a patent applica-tion on the use of these alleles for industrial yeast strain development.
REFERENCES1. Lambrechts MG, Pretorius IS. 2000. Yeast and its importance to wine
aroma - a review. S Afr J Enol Vitic 21:97–129.2. Swiegers JH, Bartowsky EJ, Henschke PA, Pretorius IS. 2005. Yeast and
bacterial modulation of wine aroma and flavour. Aust J Grape Wine Res11:139 –173. https://doi.org/10.1111/j.1755-0238.2005.tb00285.x.
3. Saerens SM, Delvaux FR, Verstrepen KJ, Thevelein JM. 2010. Productionand biological function of volatile esters in Saccharomyces cerevisiae.Microb Biotechnol 3:165–177. https://doi.org/10.1111/j.1751-7915.2009.00106.x.
4. Verstrepen KJ, Derdelinckx G, Dufour JP, Winderickx J, Thevelein JM,Pretorius IS, Delvaux FR. 2003. Flavor-active esters: adding fruitiness tobeer. J Biosci Bioeng 96:110 –118. https://doi.org/10.1016/S1389-1723(03)90112-5.
5. Peddie HAB. 1990. Ester formation in brewery fermentations. J Inst Brew96:327–331. https://doi.org/10.1002/j.2050-0416.1990.tb01039.x.
6. Cordente AG, Curtin CD, Varela C, Pretorius IS. 2012. Flavour-active wineyeasts. Appl Microbiol Biotechnol 96:601– 618. https://doi.org/10.1007/s00253-012-4370-z.
7. Meilgaard MC. 1975. Flavor chemistry of beer, part ii: flavour and thresh-old of 239 aroma volatiles. Tech Q Master Brew Assoc Am 12:151–168.
8. Verstrepen KJ, Van Laere SDM, Vanderhaegen BMP, Derdelinckx G,Dufour J-P, Pretorius IS, Winderickx J, Thevelein JM, Delvaux FR. 2003.Expression levels of the yeast alcohol acetyltransferase genes ATF1,
Lg-ATF1, and ATF2 control the formation of a broad range of volatileesters. Appl Environ Microbiol 69:5228 –5237. https://doi.org/10.1128/AEM.69.9.5228-5237.2003.
9. Fujii T, Nagasawa N, Iwamatsu A, Bogaki T, Tamai Y, Hamachi M. 1994.Molecular cloning, sequence analysis, and expression of the yeast alco-hol acetyltransferase gene. Appl Environ Microbiol 60:2786 –2792.
10. Saerens SM, Verstrepen KJ, Van Laere SD, Voet AR, Van Dijck P, DelvauxFR, Thevelein JM. 2006. The Saccharomyces cerevisiae EHT1 and EEB1genes encode novel enzymes with medium-chain fatty acid ethyl estersynthesis and hydrolysis capacity. J Biol Chem 281:4446 – 4456. https://doi.org/10.1074/jbc.M512028200.
11. Mason AB, Dufour JP. 2000. Alcohol acetyltransferases and the signifi-cance of ester synthesis in yeast. Yeast 16:1287–1298. https://doi.org/10.1002/1097-0061(200010)16:14�1287::AID-YEA613�3.0.CO;2-I.
12. Lilly M, Lambrechts MG, Pretorius IS. 2000. Effect of increased yeastalcohol acetyltransferase activity on flavor profiles of wine and distil-lates. Appl Environ Microbiol 66:744 –753. https://doi.org/10.1128/AEM.66.2.744-753.2000.
13. Steyer D, Ambroset C, Brion C, Claudel P, Delobel P, Sanchez I, Erny C,Blondin B, Karst F, Legras JL. 2012. QTL mapping of the production ofwine aroma compounds by yeast. BMC Genomics 13:573. https://doi.org/10.1186/1471-2164-13-573.
14. Den Abt TD, Souffriau B, Foulquié-Moreno MR, Duitama J, Thevelein
Polygenic Analysis of Rose Flavor Production in Yeast ®
November/December 2017 Volume 8 Issue 6 e01173-17 mbio.asm.org 19
m
bio.asm.org
on April 13, 2018 - P
ublished by m
bio.asm.org
Dow
nloaded from

JM. 2016. Genomic saturation mutagenesis and polygenic analysisidentify novel yeast genes affecting ethyl acetate production, anon-selectable polygenic trait. Microb Cell 3:159 –175. https://doi.org/10.15698/mic2016.04.491.
15. Noble J, Sanchez I, Blondin B. 2015. Identification of new Saccharomycescerevisiae variants of the MET2 and SKP2 genes controlling the sulfurassimilation pathway and the production of undesirable sulfur com-pounds during alcoholic fermentation. Microb Cell Fact 14:68. https://doi.org/10.1186/s12934-015-0245-1.
16. Steinmetz LM, Sinha H, Richards DR, Spiegelman JI, Oefner PJ, McCuskerJH, Davis RW. 2002. Dissecting the architecture of a quantitative traitlocus in yeast. Nature 416:326 –330. https://doi.org/10.1038/416326a.
17. Swinnen S, Schaerlaekens K, Pais T, Claesen J, Hubmann G, Yang Y,Demeke M, Foulquié-Moreno MR, Goovaerts A, Souvereyns K, Clement L,Dumortier F, Thevelein JM. 2012. Identification of novel causative genesdetermining the complex trait of high ethanol tolerance in yeast usingpooled-segregant whole-genome sequence analysis. Genome Res 22:975–984. https://doi.org/10.1101/gr.131698.111.
18. Swinnen S, Thevelein JM, Nevoigt E. 2012. Genetic mapping of quanti-tative phenotypic traits in Saccharomyces cerevisiae. FEMS Yeast Res12:215–227. https://doi.org/10.1111/j.1567-1364.2011.00777.x.
19. Liti G, Louis EJ. 2012. Advances in quantitative trait analysis in yeast.PLoS Genet 8:e1002912. https://doi.org/10.1371/journal.pgen.1002912.
20. Parts L, Cubillos FA, Warringer J, Jain K, Salinas F, Bumpstead SJ, MolinM, Zia A, Simpson JT, Quail MA, Moses A, Louis EJ, Durbin R, Liti G. 2011.Revealing the genetic structure of a trait by sequencing a populationunder selection. Genome Res 21:1131–1138. https://doi.org/10.1101/gr.116731.110.
21. Meijnen J-P, Randazzo P, Foulquié-Moreno MR, van den Brink J, Vande-cruys P, Stojiljkovic M, Dumortier F, Zalar P, Boekhout T, Gunde-Cimerman N, Kokošar J, Štajdohar M, Curk T, Petrovic U, Thevelein JM.2016. Polygenic analysis and targeted improvement of the complex traitof high acetic acid tolerance in the yeast Saccharomyces cerevisiae.Biotechnol Biofuels 9:5. https://doi.org/10.1186/s13068-015-0421-x.
22. Yang Y, Foulquié-Moreno MR, Clement L, Erdei E, Tanghe A, Schaerlaek-ens K, Dumortier F, Thevelein JM. 2013. QTL analysis of high thermotol-erance with superior and downgraded parental yeast strains reveals newminor QTLs and converges on novel causative alleles involved in RNAprocessing. PLoS Genet 9:e1003693. https://doi.org/10.1371/journal.pgen.1003693.
23. Pais TM, Foulquié-Moreno MR, Hubmann G, Duitama J, Swinnen S,Goovaerts A, Yang Y, Dumortier F, Thevelein JM. 2013. Comparativepolygenic analysis of maximal ethanol accumulation capacity and tol-erance to high ethanol levels of cell proliferation in yeast. PLoS Genet9:e1003548. https://doi.org/10.1371/journal.pgen.1003548.
24. Hubmann G, Foulquié-Moreno MR, Nevoigt E, Duitama J, Meurens N, PaisTM, Mathé L, Saerens S, Nguyen HT, Swinnen S, Verstrepen KJ, Concilio L, deTroostembergh JC, Thevelein JM. 2013. Quantitative trait analysis of yeastbiodiversity yields novel gene tools for metabolic engineering. Metab Eng17:68 – 81. https://doi.org/10.1016/j.ymben.2013.02.006.
25. Hubmann G, Mathé L, Foulquié-Moreno MR, Duitama J, Nevoigt E,Thevelein JM. 2013. Identification of multiple interacting alleles confer-ring low glycerol and high ethanol yield in Saccharomyces cerevisiaeethanolic fermentation. Biotechnol Biofuels 6:87. https://doi.org/10.1186/1754-6834-6-87.
26. Bao Z, Xiao H, Liang J, Zhang L, Xiong X, Sun N, Si T, Zhao H. 2015.Homology-integrated CRISPR-Cas (HI-CRISPR) system for one-step mul-tigene disruption in Saccharomyces cerevisiae. ACS Synth Biol 4:585–594.https://doi.org/10.1021/sb500255k.
27. DiCarlo JE, Norville JE, Mali P, Rios X, Aach J, Church GM. 2013. Genomeengineering in Saccharomyces cerevisiae using CRISPR-Cas systems. Nu-cleic Acids Res 41:4336 – 4343. https://doi.org/10.1093/nar/gkt135.
28. Horwitz AA, Walter JM, Schubert MG, Kung SH, Hawkins K, Platt DM,Hernday AD, Mahatdejkul-Meadows T, Szeto W, Chandran SS, NewmanJD. 2015. Efficient multiplexed integration of synergistic alleles andmetabolic pathways in yeasts via CRISPR-Cas. Cell Syst 1:88 –96. https://doi.org/10.1016/j.cels.2015.02.001.
29. Mans R, van Rossum HM, Wijsman M, Backx A, Kuijpers NG, van denBroek M, Daran-Lapujade P, Pronk JT, van Maris AJ, Daran JM. 2015.CRISPR/Cas9: a molecular Swiss army knife for simultaneous introductionof multiple genetic modifications in Saccharomyces cerevisiae. FEMSYeast Res 15:fov004. https://doi.org/10.1093/femsyr/fov004.
30. Stovicek V, Borodina I, Forster J. 2015. CRISPR–Cas system enables fastand simple genome editing of industrial Saccharomyces cerevisiae
strains. Metab Eng Commun 2:13–22. https://doi.org/10.1016/j.meteno.2015.03.001.
31. Brion C, Ambroset C, Sanchez I, Legras JL, Blondin B. 2013. Differentialadaptation to multi-stressed conditions of wine fermentation revealedby variations in yeast regulatory networks. BMC Genomics 14:681.https://doi.org/10.1186/1471-2164-14-681.
32. Wilkening S, Lin G, Fritsch ES, Tekkedil MM, Anders S, Kuehn R, NguyenM, Aiyar RS, Proctor M, Sakhanenko NA, Galas DJ, Gagneur J, Deutsch-bauer A, Steinmetz LM. 2014. An evaluation of high-throughput ap-proaches to QTL mapping in Saccharomyces cerevisiae. Genetics 196:853– 865. https://doi.org/10.1534/genetics.113.160291.
33. Cubillos FA, Parts L, Salinas F, Bergström A, Scovacricchi E, Zia A,Illingworth CJ, Mustonen V, Ibstedt S, Warringer J, Louis EJ, Durbin R, LitiG. 2013. High-resolution mapping of complex traits with a four-parentadvanced intercross yeast population. Genetics 195:1141–1155. https://doi.org/10.1534/genetics.113.155515.
34. Cubillos FA, Billi E, Zörgö E, Parts L, Fargier P, Omholt S, Blomberg A,Warringer J, Louis EJ, Liti G. 2011. Assessing the complex architecture ofpolygenic traits in diverged yeast populations. Mol Ecol 20:1401–1413.https://doi.org/10.1111/j.1365-294X.2011.05005.x.
35. Ehrenreich IM, Bloom J, Torabi N, Wang X, Jia Y, Kruglyak L. 2012. Geneticarchitecture of highly complex chemical resistance traits across fouryeast strains. PLoS Genet 8:e1002570. https://doi.org/10.1371/journal.pgen.1002570.
36. Ehrenreich IM, Torabi N, Jia Y, Kent J, Martis S, Shapiro JA, Gresham D,Caudy AA, Kruglyak L. 2010. Dissection of genetically complex traits withextremely large pools of yeast segregants. Nature 464:1039 –1042.https://doi.org/10.1038/nature08923.
37. Katou T, Namise M, Kitagaki H, Akao T, Shimoi H. 2009. QTL mapping ofsake brewing characteristics of yeast. J Biosci Bioeng 107:383–393.https://doi.org/10.1016/j.jbiosc.2008.12.014.
38. Dohm JC, Lottaz C, Borodina T, Himmelbauer H. 2008. Substantial biasesin ultra-short read data sets from high-throughput DNA sequencing.Nucleic Acids Res 36:e105.
39. Deutschbauer AM, Davis RW. 2005. Quantitative trait loci mapped tosingle-nucleotide resolution in yeast. Nat Genet 37:1333–1340. https://doi.org/10.1038/ng1674.
40. Sinha H, Nicholson BP, Steinmetz LM, McCusker JH. 2006. Complexgenetic interactions in a quantitative trait locus. PLoS Genet 2:e13.https://doi.org/10.1371/journal.pgen.0020013.
41. Dimitrov LN, Brem RB, Kruglyak L, Gottschling DE. 2009. Polymorphismsin multiple genes contribute to the spontaneous mitochondrial genomeinstability of Saccharomyces cerevisiae S288C strains. Genetics 183:365–383. https://doi.org/10.1534/genetics.109.104497.
42. Zhu J, Zhang B, Smith EN, Drees B, Brem RB, Kruglyak L, Bumgarner RE,Schadt EE. 2008. Integrating large-scale functional genomic data todissect the complexity of yeast regulatory networks. Nat Genet 40:854 – 861. https://doi.org/10.1038/ng.167.
43. Sinha H, David L, Pascon RC, Clauder-Münster S, Krishnakumar S, NguyenM, Shi G, Dean J, Davis RW, Oefner PJ, McCusker JH, Steinmetz LM. 2008.Sequential elimination of major-effect contributors identifies additionalquantitative trait loci conditioning high-temperature growth in yeast.Genetics 180:1661–1670. https://doi.org/10.1534/genetics.108.092932.
44. Roncoroni M, Santiago M, Hooks DO, Moroney S, Harsch MJ, Lee SA,Richards KD, Nicolau L, Gardner RC. 2011. The yeast IRC7 gene encodesa beta-lyase responsible for production of the varietal thiol 4-mercapto-4-methylpentan-2-one in wine. Food Microbiol 28:926 –935. https://doi.org/10.1016/j.fm.2011.01.002.
45. Guth H. 1997. Quantitation and sensory studies of character impactodorants of different white wine varieties. J Agric Food Chem 45:3027–3032. https://doi.org/10.1021/jf970280a.
46. Noda T, Ohsumi Y. 1998. Tor, a phosphatidylinositol kinase homologue,controls autophagy in yeast. J Biol Chem 273:3963–3966. https://doi.org/10.1074/jbc.273.7.3963.
47. Hardwick JS, Kuruvilla FG, Tong JK, Shamji AF, Schreiber SL. 1999.Rapamycin-modulated transcription defines the subset of nutrient-sensitive signaling pathways directly controlled by the Tor proteins. ProcNatl Acad Sci U S A 96:14866 –14870. https://doi.org/10.1073/pnas.96.26.14866.
48. Fujiwara D, Kobayashi O, Yoshimoto H, Harashima S, Tamai Y. 1999.Molecular mechanism of the multiple regulation of the Saccharomycescerevisiae ATF1 gene encoding alcohol acetyltransferase. Yeast 15:1183–1197. https://doi.org/10.1002/(SICI)1097-0061(19990915)15:12�1183::AID-YEA444�3.0.CO;2-J.
Trindade de Carvalho et al. ®
November/December 2017 Volume 8 Issue 6 e01173-17 mbio.asm.org 20
m
bio.asm.org
on April 13, 2018 - P
ublished by m
bio.asm.org
Dow
nloaded from

49. Loewith R, Hall MN. 2011. Target of rapamycin (TOR) in nutrient signal-ing and growth control. Genetics 189:1177–1201. https://doi.org/10.1534/genetics.111.133363.
50. Conrad M, Schothorst J, Kankipati HN, Van Zeebroeck G, Rubio-TexeiraM, Thevelein JM. 2014. Nutrient sensing and signaling in the yeastSaccharomyces cerevisiae. FEMS Microbiol Rev 38:254 –299. https://doi.org/10.1111/1574-6976.12065.
51. Tesnière C, Brice C, Blondin B. 2015. Responses of Saccharomycescerevisiae to nitrogen starvation in wine alcoholic fermentation. ApplMicrobiol Biotechnol 99:7025–7034. https://doi.org/10.1007/s00253-015-6810-z.
52. Crespo JL, Hall MN. 2002. Elucidating TOR signaling and rapamycinaction: lessons from Saccharomyces cerevisiae. Microbiol Mol Biol Rev66:579 –591. https://doi.org/10.1128/MMBR.66.4.579-591.2002.
53. Mohamed AH, Chirala SS, Mody NH, Huang WY, Wakil SJ. 1988.Primary structure of the multifunctional alpha subunit protein ofyeast fatty acid synthase derived from FAS2 gene sequence. J BiolChem 263:12315–12325.
54. Schweizer E, Hofmann J. 2004. Microbial type I fatty acid synthases (FAS):major players in a network of cellular FAS systems. Microbiol Mol BiolRev 68:501–517. https://doi.org/10.1128/MMBR.68.3.501-517.2004.
55. Inokoshi J, Tomoda H, Hashimoto H, Watanabe A, Takeshima H, OmuraS. 1994. Cerulenin-resistant mutants of Saccharomyces cerevisiae with analtered fatty acid synthase gene. Mol Gen Genet 244:90 –96. https://doi.org/10.1007/BF00280191.
56. Ichikawa E, Hosokawa N, Hata Y, Abe Y, Suginami K, Imayasu S. 1991.Breeding of a sake yeast with improved ethyl caproate productivity.Agric Biol Chem 55:2153–2154.
57. Akada R, Matsuo K, Aritomi K, Nishizawa Y. 1999. Construction of recom-binant sake yeast containing a dominant FAS2 mutation without extra-neous sequences by a two-step gene replacement protocol. J BiosciBioeng 87:43– 48. https://doi.org/10.1016/S1389-1723(99)80006-1.
58. Akada R, Hirosawa I, Hoshida H, Nishizawa Y. 2001. Detection of a pointmutation in FAS2 gene of sake yeast strains by allele-specific PCRamplification. J Biosci Bioeng 92:189 –192. https://doi.org/10.1016/S1389-1723(01)80224-3.
59. Kotaka A, Sahara H, Hata Y. 2010. The construction and application ofdiploid sake yeast with a homozygous mutation in the FAS2 gene. JBiosci Bioeng 110:675– 678. https://doi.org/10.1016/j.jbiosc.2010.07.007.
60. Aritomi K, Hirosawa I, Hoshida H, Shiigi M, Nishizawa Y, Kashiwagi S,Akada R. 2004. Self-cloning yeast strains containing novel FAS2 muta-tions produce a higher amount of ethyl caproate in Japanese sake. BiosciBiotechnol Biochem 68:206 –214. https://doi.org/10.1271/bbb.68.206.
61. Akada R. 2002. Genetically modified industrial yeast ready for applica-tion. J Biosci Bioeng 94:536 –544. https://doi.org/10.1016/S1389-1723(02)80192-X.
62. Tamura H, Okada H, Kume K, Koyano T, Goshima T, Nakamura R, AkaoT, Shimoi H, Mizunuma M, Ohya Y, Hirata D. 2015. Isolation of aspontaneous cerulenin-resistant sake yeast with both high ethylcaproate-producing ability and normal checkpoint integrity. BiosciBiotechnol Biochem 79:1191–1199. https://doi.org/10.1080/09168451.2015.1020756.
63. Saerens SM, Verbelen PJ, Vanbeneden N, Thevelein JM, Delvaux FR.2008. Monitoring the influence of high-gravity brewing and fermenta-tion temperature on flavour formation by analysis of gene expressionlevels in brewing yeast. Appl Microbiol Biotechnol 80:1039 –1051.https://doi.org/10.1007/s00253-008-1645-5.
64. Fukuda K, Watanabe M, Asano K. 1990. Altered regulation of aromaticamino acid biosynthesis in �-phenylethyl-alcohol-overproducing mu-tants of sake yeast Saccharomyces cerevisiae. Agric Biol Chem 54:3151–3156. https://doi.org/10.1080/00021369.1990.10870488.
65. Fukuda K, Watanabe M, Asano K, Ueda H, Ohta S. 1990. Breeding ofbrewing yeast producing a large amount of �-phenylethyl alcohol and�-phenylethyl acetate. Agric Biol Chem 54:269 –271.
66. Etschmann MM, Bluemke W, Sell D, Schrader J. 2002. Biotechnologicalproduction of 2-phenylethanol. Appl Microbiol Biotechnol 59:1– 8.https://doi.org/10.1007/s00253-002-0992-x.
67. Hazelwood LA, Daran JM, van Maris AJ, Pronk JT, Dickinson JR. 2008. TheEhrlich pathway for fusel alcohol production: a century of research onSaccharomyces cerevisiae metabolism. Appl Environ Microbiol 74:2259 –2266. https://doi.org/10.1128/AEM.02625-07.
68. Lilly M, Bauer FF, Styger G, Lambrechts MG, Pretorius IS. 2006. The effectof increased branched-chain amino acid transaminase activity in yeast
on the production of higher alcohols and on the flavour profiles of wineand distillates. FEMS Yeast Res 6:726 –743. https://doi.org/10.1111/j.1567-1364.2006.00057.x.
69. Vuralhan Z, Morais MA, Tai SL, Piper MD, Pronk JT. 2003. Identificationand characterization of phenylpyruvate decarboxylase genes in Saccha-romyces cerevisiae. Appl Environ Microbiol 69:4534 – 4541. https://doi.org/10.1128/AEM.69.8.4534-4541.2003.
70. Etschmann MM, Sell D, Schrader J. 2005. Production of 2-phenylethanoland 2-phenylethylacetate from L-phenylalanine by coupling whole-cellbiocatalysis with organophilic pervaporation. Biotechnol Bioeng 92:624 – 634. https://doi.org/10.1002/bit.20655.
71. Saerens SM, Delvaux F, Verstrepen KJ, Van Dijck P, Thevelein JM, DelvauxFR. 2008. Parameters affecting ethyl ester production by Saccharomycescerevisiae during fermentation. Appl Environ Microbiol 74:454 – 461.https://doi.org/10.1128/AEM.01616-07.
72. Schenkel W, Leggewie G. 2015. New techniques in molecular biologychallenge the assessment of modified organisms. J Verbr Lebensm10:263–268. https://doi.org/10.1007/s00003-015-0958-4.
73. Kronberger N, Wagner W, Nagata M. 2014. How natural is “more natu-ral”? The role of method, type of transfer, and familiarity for publicperceptions of cisgenic and transgenic modification. Sci Commun 36:106 –130. https://doi.org/10.1177/1075547013500773.
74. Jones HD. 2015. Regulatory uncertainty over genome editing. Nat Plants1:14011. https://doi.org/10.1038/nplants.2014.11.
75. Hunter P. 2014. ‘Genetically Modified Lite’ placates public but notactivists: new technologies to manipulate plant genomes could help toovercome public concerns about GM crops. EMBO Rep 15:138 –141.https://doi.org/10.1002/embr.201338365.
76. Podevin N, Devos Y, Davies HV, Nielsen KM. 2012. Transgenic or not? Nosimple answer! New biotechnology-based plant breeding techniquesand the regulatory landscape. EMBO Rep 13:1057–1061. https://doi.org/10.1038/embor.2012.168.
77. Ando A, Suzuki C, Shima J. 2005. Survival of genetically modified andself-cloned strains of commercial baker’s yeast in simulated naturalenvironments: environmental risk assessment. Appl Environ Microbiol71:7075–7082. https://doi.org/10.1128/AEM.71.11.7075-7082.2005.
78. Sherman F, Hicks J. 1991. Micromanipulation and dissection of asci.Methods Enzymol 194:21–37.
79. Huxley C, Green ED, Dunham I. 1990. Rapid assessment of S. cerevisiaemating type by PCR. Trends Genet 6:236. https://doi.org/10.1016/0168-9525(90)90190-H.
80. Thompson JR, Register E, Curotto J, Kurtz M, Kelly R. 1998. An improvedprotocol for the preparation of yeast cells for transformation by electro-poration. Yeast 14:565–571. https://doi.org/10.1002/(SICI)1097-0061(19980430)14:6�565::AID-YEA251�3.0.CO;2-B.
81. Duitama J, Quintero JC, Cruz DF, Quintero C, Hubmann G, Foulquié-Moreno MR, Verstrepen KJ, Thevelein JM, Tohme J. 2014. An integratedframework for discovery and genotyping of genomic variants fromhigh-throughput sequencing experiments. Nucleic Acids Res 42:e44.https://doi.org/10.1093/nar/gkt1381.
82. Claesen J, Clement L, Shkedy Z, Foulquié-Moreno MR, Burzykowski T. 2013.Simultaneous mapping of multiple gene loci with pooled segregants. PLoSOne 8:e55133. https://doi.org/10.1371/journal.pone.0055133.
83. Duitama J, Sánchez-Rodríguez A, Goovaerts A, Pulido-Tamayo S, Hub-mann G, Foulquié-Moreno MR, Thevelein JM, Verstrepen KJ, Marchal K.2014. Improved linkage analysis of quantitative trait loci using bulksegregants unveils a novel determinant of high ethanol tolerance inyeast. BMC Genomics 15:207. https://doi.org/10.1186/1471-2164-15-207.
84. Claesen J, Burzykowski T. 2015. A hidden Markov-model for gene map-ping based on whole-genome next generation sequencing data. StatAppl Genet Mol Biol 14:21–34. https://doi.org/10.1515/sagmb-2014-0007.
85. Hsu PD, Lander ES, Zhang F. 2014. Development and applications ofCRISPR-Cas9 for genome engineering. Cell 157:1262–1278. https://doi.org/10.1016/j.cell.2014.05.010.
86. Fu Y, Foden JA, Khayter C, Maeder ML, Reyon D, Joung JK, Sander JD.2013. High-frequency off-target mutagenesis induced by CRISPR-Casnucleases in human cells. Nat Biotechnol 31:822– 826. https://doi.org/10.1038/nbt.2623.
87. Lomakin IB, Xiong Y, Steitz TA. 2007. The crystal structure of yeast fattyacid synthase, a cellular machine with eight active sites working to-gether. Cell 129:319 –332. https://doi.org/10.1016/j.cell.2007.03.013.
Polygenic Analysis of Rose Flavor Production in Yeast ®
November/December 2017 Volume 8 Issue 6 e01173-17 mbio.asm.org 21
m
bio.asm.org
on April 13, 2018 - P
ublished by m
bio.asm.org
Dow
nloaded from