Research Article Crack Risk Evaluation of Early Age Concrete...
14
Research Article Crack Risk Evaluation of Early Age Concrete Based on the Distributed Optical Fiber Temperature Sensing Nannan Shi, 1 Yanyu Chen, 2 and Zhenbao Li 1 1 College of Architecture and Civil Engineering, Beijing University of Technology, Beijing 100124, China 2 Department of Mechanical Engineering, State University of New York at Stony Brook, Stony Brook, NY 11794, USA Correspondence should be addressed to Zhenbao Li; [email protected] Received 29 March 2016; Accepted 31 July 2016 Academic Editor: Belal F. Yousif Copyright © 2016 Nannan Shi et al. is is an open access article distributed under the Creative Commons Attribution License, which permits unrestricted use, distribution, and reproduction in any medium, provided the original work is properly cited. Cracks oſten appear in concrete arch dams, due to the thermal stress and low tensile strength of early age concrete. ere are three commonly used temperature controlling measures: controlling the casting temperature, burying cooling pipe, and protecting the surface. However, because of the difficulty to obtain accurate temperature and thermal stress field of the concrete, the rationality and economy of these measures are not assessed validly before and aſter construction. In this paper, a crack risk evaluation system for early age concrete is established, including distributed optical fiber temperature sensing (DTS), prediction of temperature and stress fields, and crack risk evaluation. Based on the DTS temperature data, the back-analysis method is applied to retrieve the thermal parameters of concrete. en, the temperature and thermal stress of early age concrete are predicted using the reversed thermal parameters, as well as the laboratory test parameters. Finally, under the proposed cracking risk evaluation principle, the cracking risk level of each concrete block is given; the preliminary and later temperature controlling measures were recommended, respectively. e application of the proposed system in Xiluodu super high arch dam shows that this system works effectively for preventing cracks of early age concrete. 1. Introduction Cracks oſten appear in mass concrete structures, such as con- crete dams. Some of the cracks are due to the unreasonable structural design, uneven settlement of the structure, and/or the poor quality of concrete. However, most of the cracks are caused by the thermal stress [1, 2]. Particularly, thermal stress easily causes cracks, since the tensile strength of early age concrete is quite low. Cracks not only destroy the beauty of the dams but also affect durability of the concrete; what is more, severe concrete cracks may affect the normal use and dam safety. To reduce concrete cracks and improve integrity of the structures, temperature controlling measures are performed during construction, such as controlling the casting tem- perature, burying cooling pipe, and protecting the concrete surface. Practices show that these measures work effectively to reduce the concrete cracks in arch dams. However, because of the difficulty to obtain accurate temperature and thermal stress field of the concrete, the rationality and economy of these measures were not assessed validly before and aſter construction. In order to obtain internal temperature process of the concrete, the easiest and most straightforward way is to bury thermometers within the concrete, while, due to the limited number of measuring points, the poor reliability of human-read data, the interference caused by construction, and so forth, it is nearly impossible to obtain the exact temperature process of the concrete. With the development of optical fiber communication technology, distributed optic fiber temperature sensing (DTS) has been applied in the leakage monitoring of petroleum pipelines, HV power cable temperature monitoring, and concrete temperature monitor- ing of dams, because it has series of advantages, such as more measuring points, higher sensitivity, and lower cost of unit temperature information and real-time monitoring [3, 4]. Practices show that DTS can capture temperature process Hindawi Publishing Corporation Advances in Materials Science and Engineering Volume 2016, Article ID 4082926, 13 pages http://dx.doi.org/10.1155/2016/4082926
Transcript of Research Article Crack Risk Evaluation of Early Age Concrete...
Research ArticleCrack Risk Evaluation of Early Age Concrete Based onthe Distributed Optical Fiber Temperature Sensing
Nannan Shi,1 Yanyu Chen,2 and Zhenbao Li1
1College of Architecture and Civil Engineering, Beijing University of Technology, Beijing 100124, China2Department of Mechanical Engineering, State University of New York at Stony Brook, Stony Brook, NY 11794, USA
Correspondence should be addressed to Zhenbao Li; [email protected]
Received 29 March 2016; Accepted 31 July 2016
Academic Editor: Belal F. Yousif
Copyright © 2016 Nannan Shi et al. This is an open access article distributed under the Creative Commons Attribution License,which permits unrestricted use, distribution, and reproduction in any medium, provided the original work is properly cited.
Cracks often appear in concrete arch dams, due to the thermal stress and low tensile strength of early age concrete. There are threecommonly used temperature controlling measures: controlling the casting temperature, burying cooling pipe, and protecting thesurface. However, because of the difficulty to obtain accurate temperature and thermal stress field of the concrete, the rationalityand economy of these measures are not assessed validly before and after construction. In this paper, a crack risk evaluation systemfor early age concrete is established, including distributed optical fiber temperature sensing (DTS), prediction of temperature andstress fields, and crack risk evaluation. Based on the DTS temperature data, the back-analysis method is applied to retrieve thethermal parameters of concrete. Then, the temperature and thermal stress of early age concrete are predicted using the reversedthermal parameters, as well as the laboratory test parameters. Finally, under the proposed cracking risk evaluation principle, thecracking risk level of each concrete block is given; the preliminary and later temperature controlling measures were recommended,respectively. The application of the proposed system in Xiluodu super high arch dam shows that this system works effectively forpreventing cracks of early age concrete.
1. Introduction
Cracks often appear in mass concrete structures, such as con-crete dams. Some of the cracks are due to the unreasonablestructural design, uneven settlement of the structure, and/orthe poor quality of concrete. However, most of the cracksare caused by the thermal stress [1, 2]. Particularly, thermalstress easily causes cracks, since the tensile strength of earlyage concrete is quite low. Cracks not only destroy the beautyof the dams but also affect durability of the concrete; what ismore, severe concrete cracks may affect the normal use anddam safety.
To reduce concrete cracks and improve integrity of thestructures, temperature controlling measures are performedduring construction, such as controlling the casting tem-perature, burying cooling pipe, and protecting the concretesurface. Practices show that these measures work effectivelyto reduce the concrete cracks in arch dams. However, because
of the difficulty to obtain accurate temperature and thermalstress field of the concrete, the rationality and economy ofthese measures were not assessed validly before and afterconstruction. In order to obtain internal temperature processof the concrete, the easiest and most straightforward way isto bury thermometers within the concrete, while, due to thelimited number of measuring points, the poor reliability ofhuman-read data, the interference caused by construction,and so forth, it is nearly impossible to obtain the exacttemperature process of the concrete. With the developmentof optical fiber communication technology, distributed opticfiber temperature sensing (DTS) has been applied in theleakage monitoring of petroleum pipelines, HV power cabletemperature monitoring, and concrete temperature monitor-ing of dams, because it has series of advantages, such as moremeasuring points, higher sensitivity, and lower cost of unittemperature information and real-time monitoring [3, 4].Practices show that DTS can capture temperature process
Hindawi Publishing CorporationAdvances in Materials Science and EngineeringVolume 2016, Article ID 4082926, 13 pageshttp://dx.doi.org/10.1155/2016/4082926
2 Advances in Materials Science and Engineering
more realistically. Currently, to obtain the exact thermalstress of concrete, thermal stress measuring machine is oftenapplied to test the thermal stress of small size specimens in thelaboratory [5]. However, in practical project, software, basedon the FEM, is often applied to simulate the temperature andthermal stress of concrete [6–8]. Since most of the concretethermal parameters used in the simulation refer to similarprojects or are based on laboratory test results, there are somediscrepancies between the real parameters and the appliedparameters, which lead to the inaccuracy of the simulationresults.
In this paper, a crack risk evaluation system for theearly age concrete is established, including the followingaspects: firstly, in order to obtain adequate andmore accuratetemperature data, the internal temperature process of theconcrete is monitored by DTS; secondly, a back-analysismethod is applied to retrieve concrete thermal parametersfor the prediction of temperature and thermal stress underdifferent temperature controlling measures; thirdly, the stan-dard value of the concrete splitting tensile strength is obtainedby laboratory test; fourthly, a crack risk evaluation principleis established. Finally, when the temperature and thermalstress are predicted, combined with the established principle,the preliminary and later temperature controlling measureswere recommended, respectively, which are implemented asprovisions for concrete construction to reduce cracks.
2. The Crack Risk EvaluationSystem and Related Theories
2.1. Description of the System. The aim of this system isgiving preliminary and reasonable temperature controllingmeasures before construction and proposing temperaturecontrollingmeasures of early age concrete for possible factorswhichmay lead to crack after construction. Figure 1 shows thecrack risk evaluation system flow chart.
To achieve the real-time online monitoring of the con-crete temperature, DTS is introduced to monitor the tem-perature process of the typical dam blocks. First, a mon-itoring room is settled at the construction site to achievethe permanent and close observation. Second, the measuredtemperature process data of typical points are selected as theinput data for thermal parameters back-analysis. Third, theretrieved thermal parameters are used to perform feedbackanalysis, through comparing the DTSmeasured data with thecalculated data using the reversed thermal parameters, andthis process is a loop until the error of the two sets of data isacceptable.
After getting the reliable thermal parameters and beforethe new concrete block is casted, the temperature andthermal stress are predicted under the possible temperaturecontrolling measures.
To determine the rationality of temperature control mea-sures, the tensile strength of the concrete is also needed. Inthis paper, the splitting test of concrete is performed in thelaboratory to obtain the splitting tensile strength.
A crack risk evaluation principle is established, whichincludes two indicators. One is the allowed maximum
temperature of concrete. If the maximum temperature istoo high, the temperature gradient of internal and externalof the concrete is also large, which may lead to cracksof concrete. Besides, the temperature drop amplitude frommaximum temperature to the annual average temperatureis also notable, which may lead to cracks as well, sincethe maximum temperature of concrete often occurs in 3–5days of age. Therefore, the allowed maximum temperatureis one indicator of crack risk evaluation principle; the otherindicator is the anticrack safety factor of concrete, thecalculation method and the suggested range of which canbe obtained from the Design Code for Concrete Arch Dam(China DL/T5346-2006).
When the temperature process, thermal stress process,and the splitting tensile strength are obtained, the preliminarytemperature and crack control measure are proposed underthe crack risk evaluation principle.
After the new concrete block is set, considering thepossible factors, such as cold wave, rain storm, and solarradiation, which may result in cracks, the temperature andthermal stress are also predicted in order to recommendcorresponding temperature controlling measures.
2.2. Related Theories
2.2.1. Distributed Optical Fiber Sensing Principle. DTS isprimarily based on temperature effect of Raman backscatter-ing light and Optical Time Domain Reflectometry (OTDR)principle [9]. The Raman backscattering light has two com-ponents: stokes and antistokes components. Antistokes lightintensity is particularly sensitive for temperature change andthe intensity is modulated by temperature, while the stokeslight is not relevant to temperature. The intensity ratio ofantistokes to stoke signals from a constant optical pulse canbe related to the temperature measurements as given by (1)[9, 10]. Combined with internal reference temperature of theequipment and an externally determined calibration functionfor the particular fiber type, the temperature value can bedetermined. According to relationship between the speed oflight and time, expressed as (2) [9, 10], the precise positionof measuring points along optical fiber can be located. Thus,the temperature and the position of measuring point can bedetermined using DTS.
𝐼𝑎𝐼𝑠 = {(𝑥0 + 𝑥𝑘)4(𝑥0 − 𝑥𝑘)4} exp(−ℎ ⋅ 𝑐 ⋅ 𝑥𝑘𝜅𝑇) , (1)
where 𝐼𝑎 and 𝐼𝑠 are the light intensity of antistokes and stokes,respectively; 𝑥0 and 𝑥𝑘 are wave number of incident light indifferent energy levels; ℎ is the Planck constant; 𝑐 is the lightspeed in optical fiber; 𝜅 is the Boltzmann constant; and 𝑇 isthe absolute temperature.
𝑑 = 𝑐0 ⋅ 𝑡2𝑛 , (2)
where𝑑 is the distance from the emission site of the scatteringlight to the incident side; 𝑐0 is the speed of light in vacuum; 𝑡is the time of incident light returning to optical fiber incidentside; and 𝑛 is the refractive index of optical fiber.

Advances in Materials Science and Engineering 3
Crack risk evaluation system of early age concrete
DTS monitoring
(i) Calibrating DTS
(ii) Cable locating
(iii) Burying cable
(iv) DTS monitoring
(v) Collecting the data
Back-analysis
(i) 3D FEM model
(ii) Reversed parameters
(iii) Input the range of the
reversed parameters
(iv) Other thermal prosperities
Feedback analysis
(i) Temperature comparisons
of typical nodes
(ii) Allowable error
Stress prediction
(i) Boundary
(ii) Elastic modulus
(iii) Creep
(iv) Autogenous volume
deformation
(v) Thermal stress of nodes
Tensile strength
(i) Raw material
(ii) Specimen
(iii) Laboratory test units
(iv) Splitting tensile strength
Crack risk evaluation principle
(i) Max temperature
(ii) Anticrack safety factor
Preliminary temperature controlling measures
(i) Crack risk level
(ii) Recommended temperature controlling measures
Temperature controlling measures under abnormal weather
(i) Cold wave, rain storm, solar radiation, and so forth
(ii) Crack risk level
(iii) Recommended temperature controlling measures
Temperature prediction
(i) 3D FEM model
(ii) Reversed thermal parameter
(iii) Forecast temperature
(iv) Casting date
(v) Possible temperature
controlling measures
Figure 1: Flow chart of the crack risk evaluation system.
2.2.2. Principle of 3DUnsteady Temperature Field [1]. In com-putational domain 𝑅, unsteady temperature field 𝑇(𝑥, 𝑦, 𝑧, 𝑡)satisfies the heat conduction equation:
𝜕𝑇𝜕𝑡 = 𝑎(𝜕2𝑇𝜕𝑥2 + 𝜕2𝑇𝜕𝑦2 + 𝜕2𝑇𝜕𝑧2 ) + 𝜕𝜃𝜕𝜏 , (3)
where𝑇 is the temperature, ∘C; 𝑡 is the time, d; 𝑎 is the thermaldiffusivity, m2/d; 𝜃 is adiabatic temperature rise of concrete,∘C; and 𝜏 is the age, d.
According to the Variational Principle, 3D unsteady tem-perature field is solved by the following functional equation:
𝐼 (𝑇) =∭𝑅{12 [(𝜕𝑇𝜕𝑥)
2 + (𝜕𝑇𝜕𝑦 )2 + (𝜕𝑇𝜕𝑧 )
2]− 1𝑎 (𝜕𝜃𝜕𝜏 − 𝜕𝑇𝜕𝜏 )𝑇}𝑑𝑥𝑑𝑦𝑑𝑧+∬𝐶
𝛽𝜆 (𝑇2 − 𝑇𝑎)𝑇𝑑𝑠,(4)
4 Advances in Materials Science and Engineering
where 𝑅 is the computational domain; 𝑇 is the temperature;𝑎 is the thermal diffusivity; 𝜃 is adiabatic temperature rise;𝜆 is the thermal conductivity; 𝛽 is the surface heat transfercoefficient; 𝑇𝑎 is outside temperature; 𝑡 is the time; 𝜏 is theage; and 𝐶 is the third boundary condition. By the stationaryvalue condition 𝛿𝐼/𝛿𝑇 = 0 and backward difference fortime domain, the governing equation of FEM calculation fortemperature field is obtained:
[[𝐻] + 1Δ𝑡𝑛 [𝑅]] {𝑇𝑛+1} −1Δ𝑡𝑛 [𝑅] {𝑇𝑛} + {𝐹𝑛+1} = 0, (5)
where [𝐻] is the matrix of heat conduction; [𝑅] is thesupplemental matrix of heat conduction; 𝑇𝑛 and 𝑇𝑛+1 are thearrays of node temperature; and 𝐹𝑛+1 is the array of nodetemperature load. According to (5), {𝑇𝑛+1} can be derivedfrom {𝑇𝑛}.2.2.3. Principle of Cooling Pipe. According to Fourier Lawof Heat Conduction and heat balance, the accurate FEMmethod for pipe cooling was given by Zhu [1]. Because ofthe large temperature gradient around the cooling pipe, gridmust be densely arranged, which results in the complexity ofmodeling and large complexity of computation. In this paper,the equivalent equation of heat conduction to consider pipecooling proposed by Zhu [1] is adopted. The pipe cooling isconsidered as the negative heat source and cooling effect ofpipes is considered from a mean sense.
2.2.4. Principle of Back-Analysis of Thermal Parameters. Theerror 𝐸𝑟 between the measured temperature data and the cal-culated temperature data is defined as the objective function,and thermal parameters 𝛼, 𝛽, 𝜃0, 𝑎, and 𝑏 are selected asoptimal design variables. The specific mathematical modelcan be expressed as follows:
𝐸𝑟 = min𝐹 (𝑋) = min𝑚∑𝑗=1
𝑛∑𝑖=1
(𝑇𝑐𝑖𝑗 − 𝑇𝑚𝑖𝑗 )2 ,𝑋 = [𝑥1, 𝑥2, 𝑥3, 𝑥4, 𝑥5]𝑇 = [𝛼, 𝛽, 𝜃0, 𝑎, 𝑏]𝑇 .
(6)
The constraint condition is
𝑎𝑖 ≤ 𝑥𝑖 ≤ 𝑏𝑖, (𝑖 = 1, 2, 3, 4, 5) , (7)
where 𝑇𝑐𝑖𝑗 is the calculated temperature value of node 𝑗 at 𝑖moment; 𝑇𝑚𝑖𝑗 is the measured temperature value of node 𝑗 at𝑖 moment; 𝑚 is the total number of measuring points; and𝑛 is the vector number of observation time series. The opti-mization model is constraint nonlinear programming. Thesolving methods of the model are Complex Method, PenaltyFunction Method, Feasible Direction Method, and so forth.As there are only a few optimization parameters, consideringthe accuracy and solving speed, Complex Method is adoptedin this paper.
2.2.5. Principle of Elastic Creep Thermal Stress Field [1]. In acomplex stress state, concrete strain increment often includes
the elastic strain increment, the elastic creep increment, theautogenous volume strain increment, and the dry shrinkagestrain increment. The formula is expressed as
{Δ𝜀𝑛} = {Δ𝜀𝑒𝑛} + {Δ𝜀𝑐𝑛} + {Δ𝜀𝑇𝑛 } + {Δ𝜀𝑜𝑛} + {Δ𝜀𝑠𝑛} , (8)
where {Δ𝜀𝑒𝑛} is the elastic strain increment; {Δ𝜀𝑐𝑛} is the creepstrain increment; {Δ𝜀𝑇𝑛 } is the temperature strain increment;{Δ𝜀𝑜𝑛} is the autogenous volume strain increment; and {Δ𝜀𝑠𝑛}is the dry shrinkage strain increment.
The FEM governing equation is obtained in region 𝑅 inany time period by geometric equations, physical equations,and balance equations, expressed as
[𝐾] {Δ𝛿𝑛} = {Δ𝑃𝑛}𝐿 + {Δ𝑃𝑛}𝐶 + {Δ𝑃𝑛}𝑇 + {Δ𝑃𝑛}𝑂+ {Δ𝑃𝑛}𝑆 ,
(9)
where [𝐾] is the global stiffness matrix; {Δ𝛿𝑛} is the dis-placement increment of all nodes in three directions inregion 𝑅; and {Δ𝑃𝑛}𝐿, {Δ𝑃𝑛}𝐶, {Δ𝑃𝑛}𝑇, {Δ𝑃𝑛}𝑂, and {Δ𝑃𝑛}𝑆 arethe equivalent nodal force increments in Δ𝑡𝑛 caused by theexternal load, creep, temperature change, autogenous volumestrain, and dry shrinkage.
Based on the temperature and thermal stress calculationtheories mentioned above, FZFX3D, a three-dimensionalFEM program, was developed for the temperature andthermal stress prediction.
2.2.6. Crack Risk Evaluation Principle
(1) Allowed Maximum Temperature. To determine the maxi-mum allowed temperature of the concrete, the following fac-tors should be considered: the temperature gradient betweeninternal and external of the concrete, the temperature dropamplitude frommaximum temperature to the annual averagetemperature, the width of transverse joints needed for grout-ing, and the maturity of early age concrete. The calculationmethod of themaximumallowed temperature of the concretewas given in [1].
(2) Anticrack Safety Factor. The calculation method, asexpressed in (10), is given by Design Specification for Con-crete Arch Dams. In (10), the range of 𝐾 is usually 1.5–2.0. According to the range of 𝐾, the crack risk level of theconcrete is divided into four types and the comments andsuggestions of temperature controllingmeasure of each crackrisk level are tabulated in Table 1.
𝜎 ≤ 𝑓𝑡𝑘𝐾 , (10)
where 𝑓𝑡𝑘 is the tensile strength of the concrete and 𝐾 is theanticrack safety factor.
3. Application of the System
3.1. Description of the Project. Xiluodu hydropower station islocated in the Jinshajiang River Grand Canyon. The concrete
Advances in Materials Science and Engineering 5
Table 1: Crack risk evaluation level under different anticrack safety factor.
Crack risk level 𝐾 Evaluation results Analysis and possible solutions
I >2.0 Quite safe(i) Due to the strict temperature controlling measures, the minimum stress ratio isquite high, which means the low level of crack risk.(ii) The high value of the minimum stress ratio may increase the cost of temperaturecontrolling.
II 1.5–2.0 Acceptable(i) The minimum stress value means the crack risk is under control according to thecode of arch dam.(ii) No additional temperature controlling measures are needed and the proposedtemperature controlling is highly recommended.
III 1.0∼1.5 Unacceptable(i) Since this project is classified into the first level structures, this stress ratio maylead to possible potential risk of the dam block.(ii) The preliminary temperature measures are acceptable, but additional measuresare needed.
IV <1.0 High risk(i) The value of minimum stress ratio is quite low compared with that of Code ofArch Dam, which may lead to potential failure of the dam.(ii) The proposed temperature controlling measures are totally unacceptable, andthe restudy is needed.
arch dam is 285.50m in height. The total volume of concrete,needed for temperature controlling, is 6.34millionm3. Sinceinstalled capacity of Xiluodu hydropower station ranks thirdin the world, there is a high requirement for the quality,appearance, and safety of the dam. The dam is located inthe humid climate zone of midsubtropics, where the winteris dry and mild, and the summer is hot and rainy. Theimportance of the concrete dam and the special climaticcondition determine that it is an arduous task to prevent theconcrete crack.
15#-09 and 15#-10 (15# denotes the dam section number;09 or 10 denotes the block number) are taken as examplesto introduce the application process of crack risk evaluationsystem.
3.2. Back-Analysis of Concrete Thermal Parameters
3.2.1. DTS Calibration and Monitoring Results. To achievethe real-time online temperature monitoring of the concrete,the Sentinel-DTS produced by UK Sensor Net Companyis adopted in the project. Its temperature measurementresolution, measurement accuracy, and measurement rangeare 0.01∘C, 0.1∘C, and −60∘C–200∘C, respectively. The opticalfiber cable is buried in four dam sections (5#, 15#, 16#, and23#) and the planning burying length of cable is 13500m.
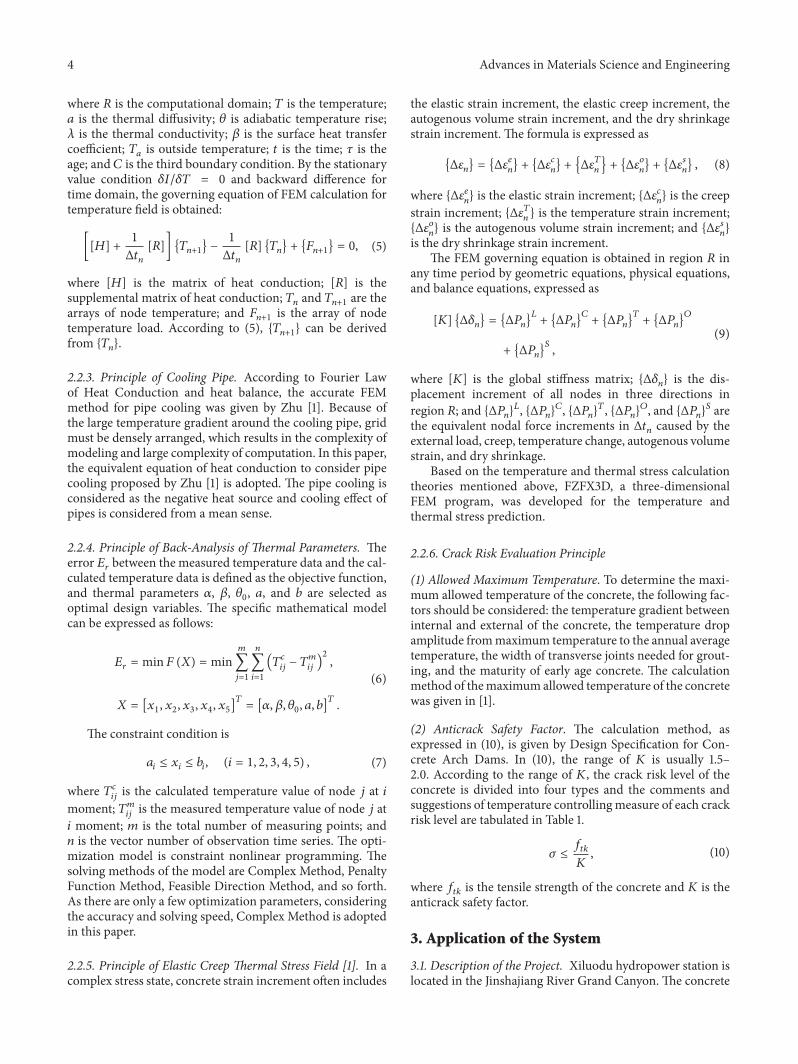
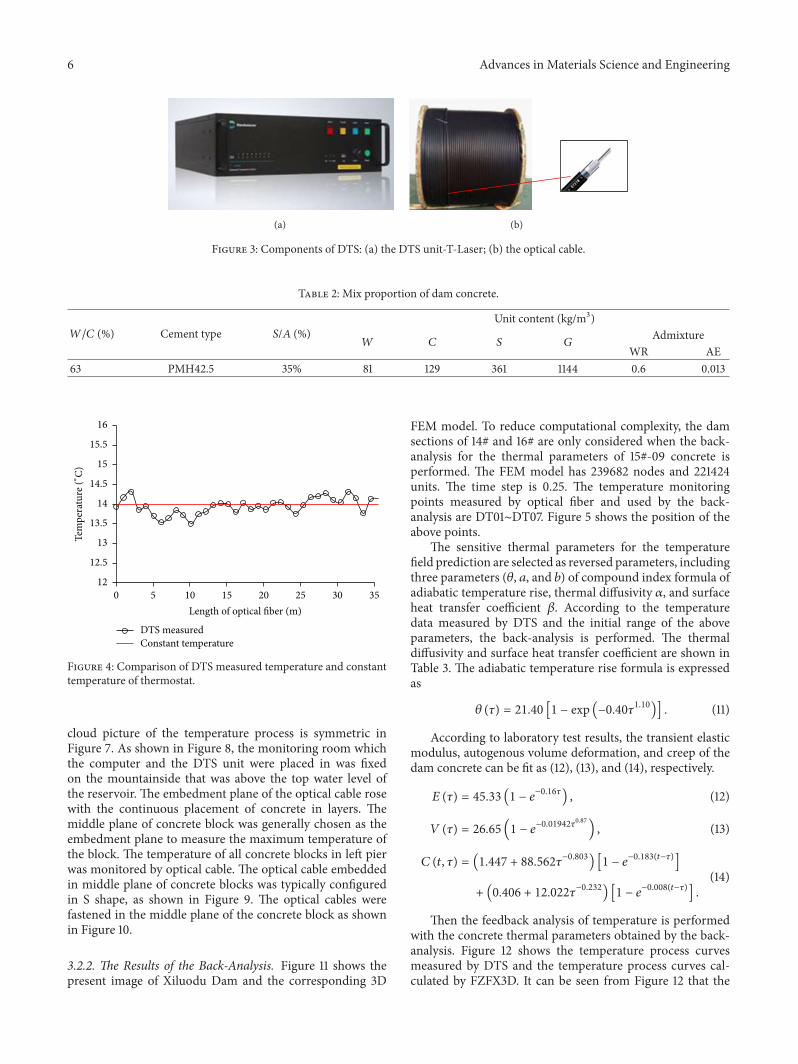
To ensure that the temperature data is more accuratealong the entire cable, theDTSmust be calibrated.The opticalfiber cable is put into the thermostat and then the optical fibermeasured values are compared with the reference thermome-ter value. At the same time, temperature parameters of DTSare configured. Figure 2 shows the setup of the calibrationexperiment. A 35m optical fiber is put into the thermostatfor the field calibration in this experiment. Figure 3 showsthat the main experimental apparatus DTS system consistsof the T-Laser DTS unit and optical cable. Figure 4 showsa comparison diagram of the temperature distribution after
Monitoring room
Output display and data storage
DTS system
Splicing point
Channel 1
Other concretestructures
Concretelayers
A5
A4
A3
A2
A1
Warning signals
Channel 2
Figure 2: Diagram of DTS calibration and cable burying.
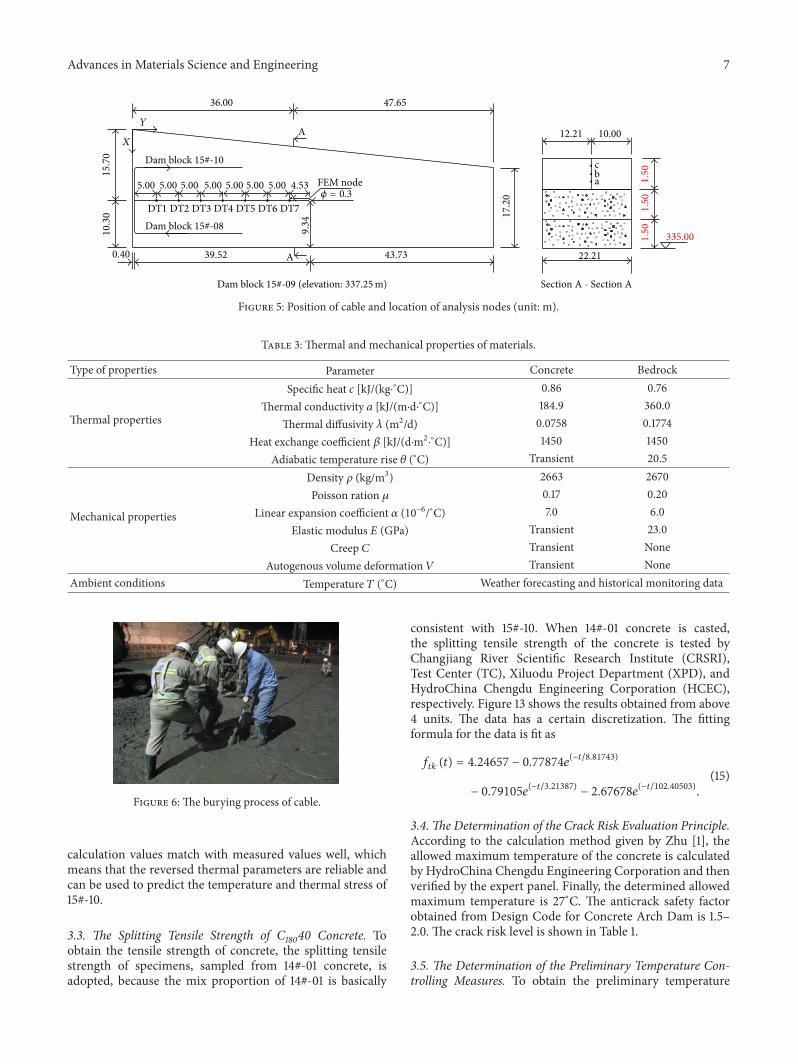
DTS calibration and the temperature displayed by the ther-mostat. It can be seen from Figure 4 that the space locationresolution is 1m, and the error range is within ±0.50∘C,which is acceptable because of some uncertain factors, suchas the disturbance of the external construction environmenton DTS and the space accuracy of selected measuring points.
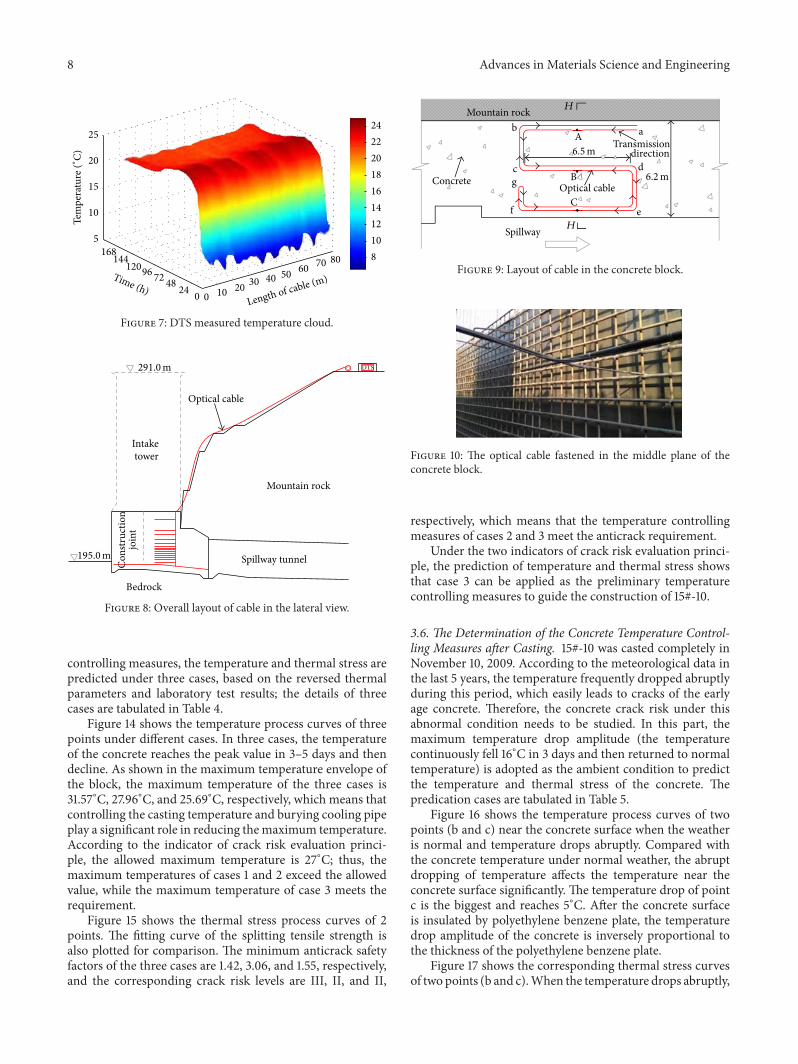
15#-09 was casted in October 18, 2009. The concretestrength grade is C18040, and its mix proportion is shownin Table 2. Part of thermal parameters and mechanicalparameters obtained from lab experiment is tabulated inTable 3. After DTS is calibrated, an 80m long duplex cable isburied in themiddle of 15#-09 (elevation direction) to achievethe real-time online temperature monitoring of the concrete.Figure 5 shows the burying position of cable and locationof analysis nodes. Figures 6 and 7 show the burying processof the cable and the temperature process of the concretemeasured by DTS. It can be seen from Figure 7 that theinternal temperature of the concrete experiences rising anddrop and then tends to be stable. The maximum temperatureoccurs in 3–5 days. Since the duplex fiber is buried, the
6 Advances in Materials Science and Engineering
(a) (b)
Figure 3: Components of DTS: (a) the DTS unit-T-Laser; (b) the optical cable.
Table 2: Mix proportion of dam concrete.
𝑊/𝐶 (%) Cement type 𝑆/𝐴 (%)Unit content (kg/m3)
𝑊 𝐶 𝑆 𝐺 AdmixtureWR AE
63 PMH42.5 35% 81 129 361 1144 0.6 0.013
DTS measured
Constant temperature
Tem
per
atu
re (∘ C
)
12
12.5
13
13.5
14
14.5
15
15.5
16
5 10 15 20 25 30 350
Length of optical fiber (m)
Figure 4: Comparison of DTS measured temperature and constanttemperature of thermostat.
cloud picture of the temperature process is symmetric inFigure 7. As shown in Figure 8, the monitoring room whichthe computer and the DTS unit were placed in was fixedon the mountainside that was above the top water level ofthe reservoir. The embedment plane of the optical cable rosewith the continuous placement of concrete in layers. Themiddle plane of concrete block was generally chosen as theembedment plane to measure the maximum temperature ofthe block. The temperature of all concrete blocks in left pierwas monitored by optical cable. The optical cable embeddedin middle plane of concrete blocks was typically configuredin S shape, as shown in Figure 9. The optical cables werefastened in the middle plane of the concrete block as shownin Figure 10.
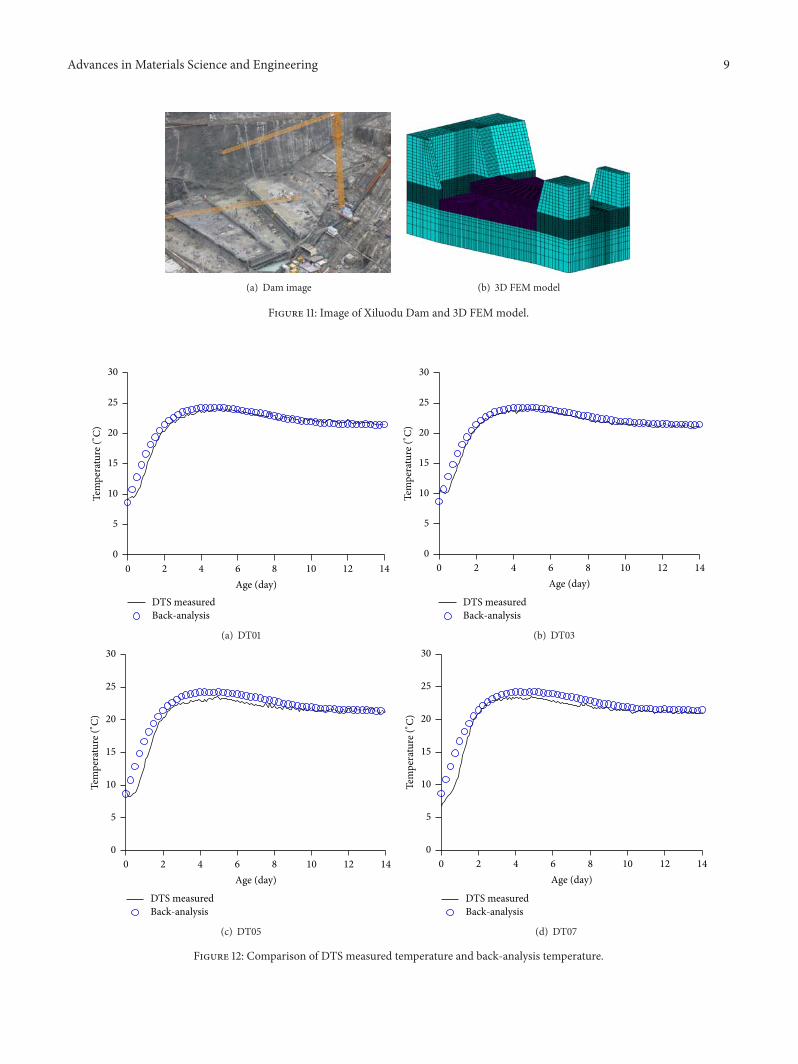
3.2.2. The Results of the Back-Analysis. Figure 11 shows thepresent image of Xiluodu Dam and the corresponding 3D
FEM model. To reduce computational complexity, the damsections of 14# and 16# are only considered when the back-analysis for the thermal parameters of 15#-09 concrete isperformed. The FEM model has 239682 nodes and 221424units. The time step is 0.25. The temperature monitoringpoints measured by optical fiber and used by the back-analysis are DT01∼DT07. Figure 5 shows the position of theabove points.
The sensitive thermal parameters for the temperaturefield prediction are selected as reversed parameters, includingthree parameters (𝜃, 𝑎, and 𝑏) of compound index formula ofadiabatic temperature rise, thermal diffusivity 𝛼, and surfaceheat transfer coefficient 𝛽. According to the temperaturedata measured by DTS and the initial range of the aboveparameters, the back-analysis is performed. The thermaldiffusivity and surface heat transfer coefficient are shown inTable 3. The adiabatic temperature rise formula is expressedas
𝜃 (𝜏) = 21.40 [1 − exp (−0.40𝜏1.10)] . (11)
According to laboratory test results, the transient elasticmodulus, autogenous volume deformation, and creep of thedam concrete can be fit as (12), (13), and (14), respectively.
𝐸 (𝜏) = 45.33 (1 − 𝑒−0.16𝜏) , (12)
𝑉 (𝜏) = 26.65 (1 − 𝑒−0.01942𝜏0.87) , (13)
𝐶 (𝑡, 𝜏) = (1.447 + 88.562𝜏−0.803) [1 − 𝑒−0.183(𝑡−𝜏)]+ (0.406 + 12.022𝜏−0.232) [1 − 𝑒−0.008(𝑡−𝜏)] . (14)
Then the feedback analysis of temperature is performedwith the concrete thermal parameters obtained by the back-analysis. Figure 12 shows the temperature process curvesmeasured by DTS and the temperature process curves cal-culated by FZFX3D. It can be seen from Figure 12 that the
Advances in Materials Science and Engineering 7
5.00 5.00 5.00 5.00 5.00 5.00 5.00 4.53
Dam block 15#-10
Dam block 15#-08
FEM node
15
.70
0.40 39.52 43.73
YA
A
36.00 47.65
DT1 DT2 DT3 DT4 DT5 DT6 DT7
22.21
12.21 10.00
335.00
Section A - Section A
cba
10
.30
9.3
4 17
.20
1.5
01
.50
1.5
0
X
Dam block 15#-09 (elevation: 337.25m)
𝜙 = 0.3
Figure 5: Position of cable and location of analysis nodes (unit: m).
Table 3: Thermal and mechanical properties of materials.
Type of properties Parameter Concrete Bedrock
Thermal properties
Specific heat 𝑐 [kJ/(kg⋅∘C)] 0.86 0.76Thermal conductivity 𝑎 [kJ/(m⋅d⋅∘C)] 184.9 360.0
Thermal diffusivity 𝜆 (m2/d) 0.0758 0.1774Heat exchange coefficient 𝛽 [kJ/(d⋅m2⋅∘C)] 1450 1450
Adiabatic temperature rise 𝜃 (∘C) Transient 20.5
Mechanical properties
Density 𝜌 (kg/m3) 2663 2670Poisson ration 𝜇 0.17 0.20
Linear expansion coefficient 𝛼 (10−6/∘C) 7.0 6.0Elastic modulus 𝐸 (GPa) Transient 23.0
Creep 𝐶 Transient NoneAutogenous volume deformation 𝑉 Transient None
Ambient conditions Temperature 𝑇 (∘C) Weather forecasting and historical monitoring data
Figure 6: The burying process of cable.
calculation values match with measured values well, whichmeans that the reversed thermal parameters are reliable andcan be used to predict the temperature and thermal stress of15#-10.
3.3. The Splitting Tensile Strength of C18040 Concrete. Toobtain the tensile strength of concrete, the splitting tensilestrength of specimens, sampled from 14#-01 concrete, isadopted, because the mix proportion of 14#-01 is basically
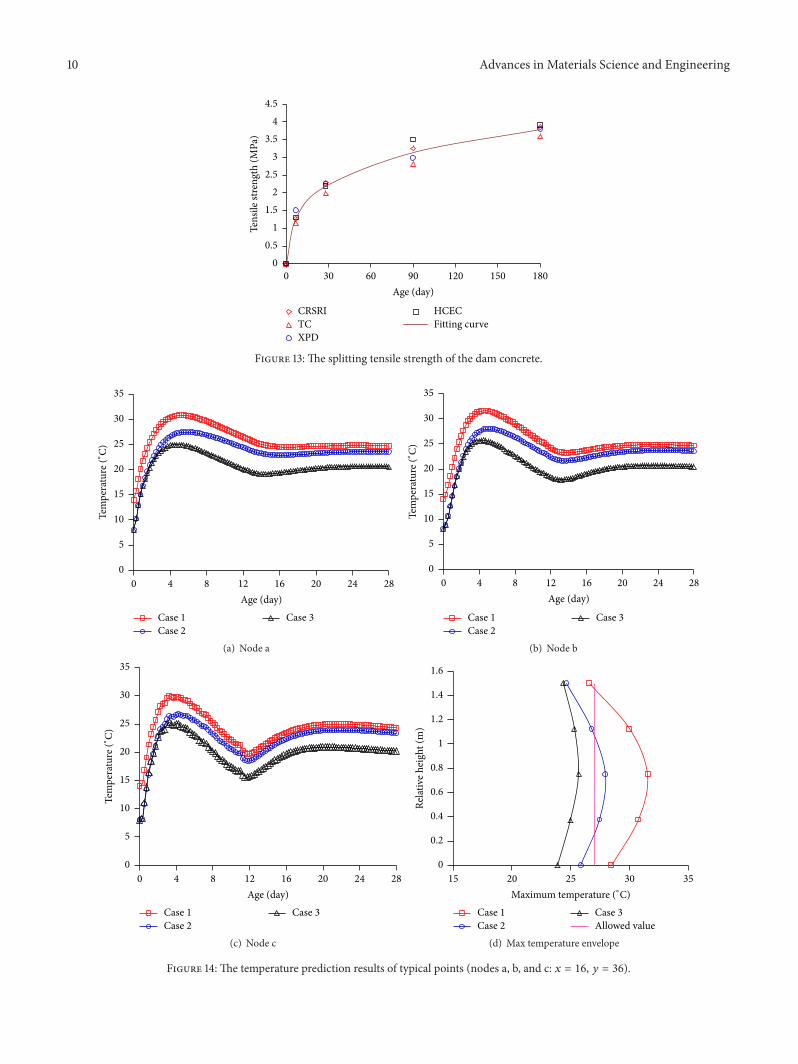
consistent with 15#-10. When 14#-01 concrete is casted,the splitting tensile strength of the concrete is tested byChangjiang River Scientific Research Institute (CRSRI),Test Center (TC), Xiluodu Project Department (XPD), andHydroChina Chengdu Engineering Corporation (HCEC),respectively. Figure 13 shows the results obtained from above4 units. The data has a certain discretization. The fittingformula for the data is fit as
𝑓𝑡𝑘 (𝑡) = 4.24657 − 0.77874𝑒(−𝑡/8.81743)− 0.79105𝑒(−𝑡/3.21387) − 2.67678𝑒(−𝑡/102.40503). (15)
3.4. The Determination of the Crack Risk Evaluation Principle.According to the calculation method given by Zhu [1], theallowed maximum temperature of the concrete is calculatedby HydroChina Chengdu Engineering Corporation and thenverified by the expert panel. Finally, the determined allowedmaximum temperature is 27∘C. The anticrack safety factorobtained from Design Code for Concrete Arch Dam is 1.5–2.0. The crack risk level is shown in Table 1.
3.5. The Determination of the Preliminary Temperature Con-trolling Measures. To obtain the preliminary temperature
8 Advances in Materials Science and Engineering
0 0 10 2030 40 50
6070 80
2448
7296
120144
168
Time (h)Length of cable (m)
Tem
per
atu
re (∘ C
)
5
10
15
20
25
8
10
12
14
16
18
20
22
24
Figure 7: DTS measured temperature cloud.
DTS
Optical cable
Mountain rock
Spillway tunnel
Co
nst
ruct
ion
join
t
Intake tower
Bedrock
291.0m
195.0m
Figure 8: Overall layout of cable in the lateral view.
controlling measures, the temperature and thermal stress arepredicted under three cases, based on the reversed thermalparameters and laboratory test results; the details of threecases are tabulated in Table 4.
Figure 14 shows the temperature process curves of threepoints under different cases. In three cases, the temperatureof the concrete reaches the peak value in 3–5 days and thendecline. As shown in the maximum temperature envelope ofthe block, the maximum temperature of the three cases is31.57∘C, 27.96∘C, and 25.69∘C, respectively, which means thatcontrolling the casting temperature and burying cooling pipeplay a significant role in reducing themaximum temperature.According to the indicator of crack risk evaluation princi-ple, the allowed maximum temperature is 27∘C; thus, themaximum temperatures of cases 1 and 2 exceed the allowedvalue, while the maximum temperature of case 3 meets therequirement.
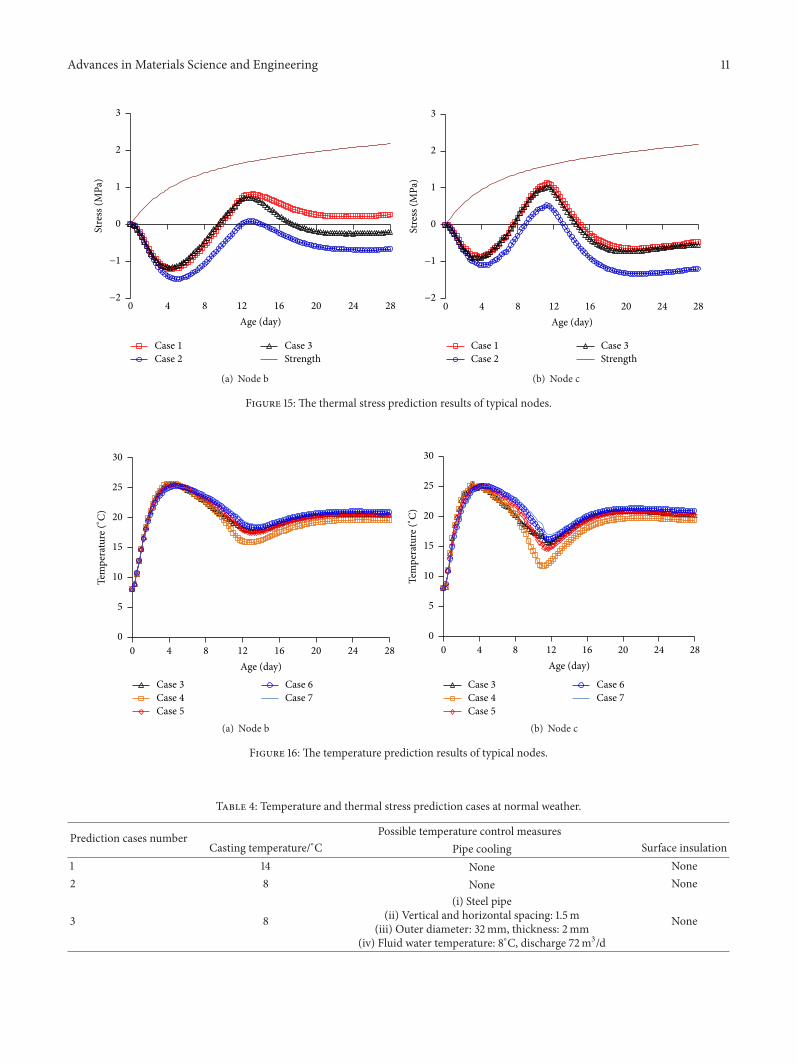
Figure 15 shows the thermal stress process curves of 2points. The fitting curve of the splitting tensile strength isalso plotted for comparison. The minimum anticrack safetyfactors of the three cases are 1.42, 3.06, and 1.55, respectively,and the corresponding crack risk levels are III, II, and II,
Concrete
SpillwayH
H
A
B
C
Optical cable
Transmission direction
ab
c d
ef
g
Mountain rock
6.5m
6.2m
Figure 9: Layout of cable in the concrete block.
Figure 10: The optical cable fastened in the middle plane of theconcrete block.
respectively, which means that the temperature controllingmeasures of cases 2 and 3 meet the anticrack requirement.
Under the two indicators of crack risk evaluation princi-ple, the prediction of temperature and thermal stress showsthat case 3 can be applied as the preliminary temperaturecontrolling measures to guide the construction of 15#-10.
3.6. The Determination of the Concrete Temperature Control-ling Measures after Casting. 15#-10 was casted completely inNovember 10, 2009. According to the meteorological data inthe last 5 years, the temperature frequently dropped abruptlyduring this period, which easily leads to cracks of the earlyage concrete. Therefore, the concrete crack risk under thisabnormal condition needs to be studied. In this part, themaximum temperature drop amplitude (the temperaturecontinuously fell 16∘C in 3 days and then returned to normaltemperature) is adopted as the ambient condition to predictthe temperature and thermal stress of the concrete. Thepredication cases are tabulated in Table 5.
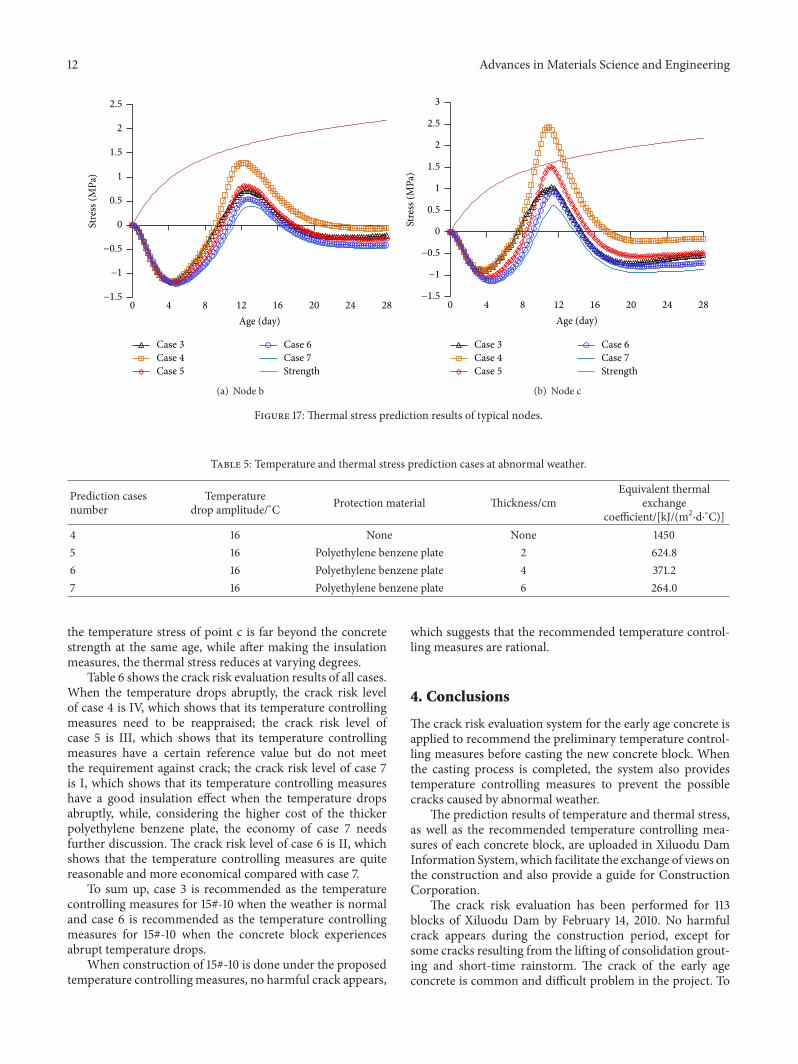
Figure 16 shows the temperature process curves of twopoints (b and c) near the concrete surface when the weatheris normal and temperature drops abruptly. Compared withthe concrete temperature under normal weather, the abruptdropping of temperature affects the temperature near theconcrete surface significantly. The temperature drop of pointc is the biggest and reaches 5∘C. After the concrete surfaceis insulated by polyethylene benzene plate, the temperaturedrop amplitude of the concrete is inversely proportional tothe thickness of the polyethylene benzene plate.
Figure 17 shows the corresponding thermal stress curvesof two points (b and c).When the temperature drops abruptly,
Advances in Materials Science and Engineering 9
(a) Dam image (b) 3D FEMmodel
Figure 11: Image of Xiluodu Dam and 3D FEMmodel.
DTS measured
Back-analysis
Tem
per
atu
re (∘ C
)
0
5
10
15
20
25
30
2 4 6 8 10 12 140
Age (day)
(a) DT01
DTS measured
Back-analysis
Tem
per
atu
re (∘ C
)
0
5
10
15
20
25
30
2 4 6 8 10 12 140
Age (day)
(b) DT03
DTS measured
Back-analysis
Tem
per
atu
re (∘ C
)
0
5
10
15
20
25
30
2 4 6 8 10 12 140
Age (day)
(c) DT05
DTS measured
Back-analysis
Tem
per
atu
re (∘ C
)
2 4 6 8 10 12 140
Age (day)
0
5
10
15
20
25
30
(d) DT07
Figure 12: Comparison of DTS measured temperature and back-analysis temperature.
10 Advances in Materials Science and Engineering
0
0.5
1
1.5
2
2.5
3
3.5
4
4.5
Ten
sile
str
engt
h (
MP
a)
30 60 90 120 150 1800
Age (day)
CRSRI
TC
XPD
HCEC
Fitting curve
Figure 13: The splitting tensile strength of the dam concrete.
Tem
per
atu
re (∘ C
)
0
5
10
15
20
25
30
35
4 8 12 16 20 24 280
Age (day)
Case 1
Case 2
Case 3
(a) Node a
Tem
per
atu
re (∘ C
)
4 8 12 16 20 24 280
Age (day)
0
5
10
15
20
25
30
35
Case 1
Case 2
Case 3
(b) Node b
Tem
per
atu
re (∘ C
)
0
5
10
15
20
25
30
35
4 8 12 16 20 24 280
Age (day)
Case 1
Case 2
Case 3
(c) Node c
0
0.2
0.4
0.6
0.8
1
1.2
1.4
1.6
Rel
ativ
e h
eigh
t (m
)
20 25 30 3515
Maximum temperature (∘C)
Case 1
Case 2
Case 3
Allowed value
(d) Max temperature envelope
Figure 14: The temperature prediction results of typical points (nodes a, b, and c: 𝑥 = 16, 𝑦 = 36).
Advances in Materials Science and Engineering 11
−2
−1
0
1
2
3
Stre
ss (
MP
a)
4 8 12 16 20 24 280
Age (day)
Case 1
Case 2
Case 3
Strength
(a) Node b
4 8 12 16 20 24 280
Age (day)
Case 1
Case 2
Case 3
Strength
−2
−1
0
1
2
3
Stre
ss (
MP
a)
(b) Node c
Figure 15: The thermal stress prediction results of typical nodes.
Tem
per
atu
re (∘ C
)
0
5
10
15
20
25
30
4 8 12 16 20 24 280
Age (day)
Case 3
Case 4
Case 5
Case 6
Case 7
(a) Node b
Tem
per
atu
re (∘ C
)
Case 3
Case 4
Case 5
Case 6
Case 7
4 8 12 16 20 24 280
Age (day)
0
5
10
15
20
25
30
(b) Node c
Figure 16: The temperature prediction results of typical nodes.
Table 4: Temperature and thermal stress prediction cases at normal weather.
Prediction cases number Possible temperature control measuresCasting temperature/∘C Pipe cooling Surface insulation
1 14 None None2 8 None None
3 8(i) Steel pipe
(ii) Vertical and horizontal spacing: 1.5m(iii) Outer diameter: 32mm, thickness: 2mm
(iv) Fluid water temperature: 8∘C, discharge 72m3/d
None
12 Advances in Materials Science and Engineering
−1.5
−1
−0.5
0
0.5
1
1.5
2
2.5St
ress
(M
Pa)
4 8 12 16 20 24 280
Age (day)
Case 3
Case 4
Case 5
Case 6
Case 7
Strength
(a) Node b
Case 3
Case 4
Case 5
Case 6
Case 7
Strength
−1.5
−1
−0.5
0
0.5
1
1.5
2
2.5
3
Stre
ss (
MP
a)
4 8 12 16 20 24 280
Age (day)
(b) Node c
Figure 17: Thermal stress prediction results of typical nodes.
Table 5: Temperature and thermal stress prediction cases at abnormal weather.
Prediction casesnumber
Temperaturedrop amplitude/∘C Protection material Thickness/cm
Equivalent thermalexchange
coefficient/[kJ/(m2⋅d⋅∘C)]4 16 None None 14505 16 Polyethylene benzene plate 2 624.86 16 Polyethylene benzene plate 4 371.27 16 Polyethylene benzene plate 6 264.0
the temperature stress of point c is far beyond the concretestrength at the same age, while after making the insulationmeasures, the thermal stress reduces at varying degrees.
Table 6 shows the crack risk evaluation results of all cases.When the temperature drops abruptly, the crack risk levelof case 4 is IV, which shows that its temperature controllingmeasures need to be reappraised; the crack risk level ofcase 5 is III, which shows that its temperature controllingmeasures have a certain reference value but do not meetthe requirement against crack; the crack risk level of case 7is I, which shows that its temperature controlling measureshave a good insulation effect when the temperature dropsabruptly, while, considering the higher cost of the thickerpolyethylene benzene plate, the economy of case 7 needsfurther discussion. The crack risk level of case 6 is II, whichshows that the temperature controlling measures are quitereasonable and more economical compared with case 7.
To sum up, case 3 is recommended as the temperaturecontrolling measures for 15#-10 when the weather is normaland case 6 is recommended as the temperature controllingmeasures for 15#-10 when the concrete block experiencesabrupt temperature drops.
When construction of 15#-10 is done under the proposedtemperature controllingmeasures, no harmful crack appears,
which suggests that the recommended temperature control-ling measures are rational.
4. Conclusions
The crack risk evaluation system for the early age concrete isapplied to recommend the preliminary temperature control-ling measures before casting the new concrete block. Whenthe casting process is completed, the system also providestemperature controlling measures to prevent the possiblecracks caused by abnormal weather.
The prediction results of temperature and thermal stress,as well as the recommended temperature controlling mea-sures of each concrete block, are uploaded in Xiluodu DamInformation System,which facilitate the exchange of views onthe construction and also provide a guide for ConstructionCorporation.
The crack risk evaluation has been performed for 113blocks of Xiluodu Dam by February 14, 2010. No harmfulcrack appears during the construction period, except forsome cracks resulting from the lifting of consolidation grout-ing and short-time rainstorm. The crack of the early ageconcrete is common and difficult problem in the project. To
Advances in Materials Science and Engineering 13
Table 6: Crack risk evaluation level of 15#-10.
Prediction cases number Node a Node b Node c Min (𝐾amin, 𝐾b
min, 𝐾cmin) Risk level𝐾a
min Age 𝐾bmin Age 𝐾c
min Age3 3.99 14.00 2.32 12.50 1.55 11.25 1.55 II4 2.27 14.00 1.27 12.00 0.65 11.00 0.65 IV5 4.06 14.00 2.06 12.25 1.06 11.00 1.06 III6 7.34 14.25 3.16 12.75 1.73 11.25 1.73 II7 11.77 14.25 4.34 13.00 2.68 11.50 2.68 I
prevent the crack of early age concrete effectively, additionalmeasures should be taken, such as improving the techniquelevel of the construction teams, timely maintenance to pre-vent shrinkage, and improving the accuracy of abnormalweather forecast.
One thing should be noted that the mix proportion ofadjacent concrete block is assumed to be unchanged. Underthis circumstance, the reversed thermal parameters can beapplied to predict the temperature and thermal stress of thenew concrete block. When the mix proportion of the newconcrete block changes, the thermal parameters should bereversed again and the splitting tensile strength adopted inthe crack risk evaluation is also needed to be tested again.
At present, the crack risk evaluation system aims to pro-vide temperature controlling measures for each new concreteblock.When the data of crack risk evaluation is sufficient, the3D model of the dam will be established and the crack riskevaluation of each block will be displayed dynamically in theDam Informative System, which will definitely facilitate allunits to grasp the state of the dam immediately.
Competing Interests
The authors declare that there is no conflict of interestsregarding the publication of this article.
Acknowledgments
The authors would like to acknowledge National NaturalScience Foundation of China for the financial support (ID:51178014).The authors would like to thank Sinohydro Bureau8 Co., Ltd. for their corporation during the burying of cableand also thankChangjiangRiver Scientific Research Institute,Test Center, Xiluodu Project Department, and HydroChinaChengduEngineeringCorporation for providing the splittingtensile strength test data.
References
[1] B. Zhu, Thermal Stresses and Temperature Control of MassConcrete, China Electric Power Press, Beijing, China, 2003(Chinese).
[2] F. Javanmardi and P. Leger, “Grouting of cracks in concretedams: numerical modelling and structural behaviour,” Progressin Structural Engineering andMaterials, vol. 7, no. 4, pp. 161–173,2005.
[3] F. Tanimola and D. Hill, “Distributed fibre optic sensors forpipeline protection,” Journal of Natural Gas Science and Engi-neering, vol. 1, no. 4-5, pp. 134–143, 2009.
[4] G. Yilmaz and S. E. Karlik, “A distributed optical fiber sensor fortemperature detection in power cables,” Sensors and Actuators,A: Physical, vol. 125, no. 2, pp. 148–155, 2006.
[5] M. N. Amin, J.-S. Kim, Y. Lee, and J.-K. Kim, “Simulationof the thermal stress in mass concrete using a thermal stressmeasuring device,” Cement and Concrete Research, vol. 39, no.3, pp. 154–164, 2009.
[6] Y. Yuan and Z. L. Wan, “Prediction of cracking within early-ageconcrete due to thermal, drying and creep behavior,” Cementand Concrete Research, vol. 32, no. 7, pp. 1053–1059, 2002.
[7] A. K. Schindler, J. M. Ruiz, R. O. Rasmussen, G. K. Chang, andL. G. Wathne, “Concrete pavement temperature prediction andcase studies with the FHWA HIPERPAV models,” Cement andConcrete Composites, vol. 26, no. 5, pp. 463–471, 2004.
[8] M.Azenha, R. Faria, andD. Ferreira, “Identification of early-ageconcrete temperatures and strains: monitoring and numericalsimulation,” Cement and Concrete Composites, vol. 31, no. 6, pp.369–378, 2009.
[9] S. M. Aminossadati, N. M. Mohammed, and J. Shemshad,“Distributed temperature measurements using optical fibretechnology in an underground mine environment,” Tunnellingand Underground Space Technology, vol. 25, no. 3, pp. 220–229,2010.
[10] E. Hurtig, S. Großwig, M. Jobmann, K. Kuhn, and P. Marschall,“Fibre-optic temperature measurements in shallow boreholes:experimental application for fluid logging,”Geothermics, vol. 23,no. 4, pp. 355–364, 1994.

Submit your manuscripts athttp://www.hindawi.com
ScientificaHindawi Publishing Corporationhttp://www.hindawi.com Volume 2014
CorrosionInternational Journal of
Hindawi Publishing Corporationhttp://www.hindawi.com Volume 2014
Polymer ScienceInternational Journal of
Hindawi Publishing Corporationhttp://www.hindawi.com Volume 2014
Hindawi Publishing Corporationhttp://www.hindawi.com Volume 2014
CeramicsJournal of
Hindawi Publishing Corporationhttp://www.hindawi.com Volume 2014
CompositesJournal of
NanoparticlesJournal of
Hindawi Publishing Corporationhttp://www.hindawi.com Volume 2014
Hindawi Publishing Corporationhttp://www.hindawi.com Volume 2014
International Journal of
Biomaterials
Hindawi Publishing Corporationhttp://www.hindawi.com Volume 2014
NanoscienceJournal of
TextilesHindawi Publishing Corporation http://www.hindawi.com Volume 2014
Journal of
NanotechnologyHindawi Publishing Corporationhttp://www.hindawi.com Volume 2014
Journal of
CrystallographyJournal of
Hindawi Publishing Corporationhttp://www.hindawi.com Volume 2014
The Scientific World JournalHindawi Publishing Corporation http://www.hindawi.com Volume 2014
Hindawi Publishing Corporationhttp://www.hindawi.com Volume 2014
CoatingsJournal of
Advances in
Materials Science and EngineeringHindawi Publishing Corporationhttp://www.hindawi.com Volume 2014
Smart Materials Research
Hindawi Publishing Corporationhttp://www.hindawi.com Volume 2014
Hindawi Publishing Corporationhttp://www.hindawi.com Volume 2014
MetallurgyJournal of
Hindawi Publishing Corporationhttp://www.hindawi.com Volume 2014
BioMed Research International
MaterialsJournal of
Hindawi Publishing Corporationhttp://www.hindawi.com Volume 2014
Nano
materials
Hindawi Publishing Corporationhttp://www.hindawi.com Volume 2014
Journal ofNanomaterials


![Diagnosis and Treatment of Anterior Cracked Tooth: A Case ... · crack [8-10]. Nevertheless, crack lines occurring at an early stage may not be visible and may also not present any](https://static.fdocuments.net/doc/165x107/5f2379fa5bbbd61a3a2a9998/diagnosis-and-treatment-of-anterior-cracked-tooth-a-case-crack-8-10-nevertheless.jpg)