Research Article Computational and Simulation Analysis of ...

Research ArticleComputational Model for the Neutronic Simulation ofPebble Bed Reactor’s Core Using MCNPX
J. Rosales,1 A. Muñoz,1 C. García,1 L. García,2 C. Brayner,3 J. Pérez,1 and A. Abánades4
1 Higher Institute of Technologies and Applied Sciences (InSTEC), Avenida Salvador Allende Esq. Luaces, Quinta de los Molinos,10600 Havana, Cuba
2 European Organization for Nuclear Research, Route de Meyrin 385, 1217 Meyrin, Switzerland3Department of Nuclear Energy, Federal University of Pernambuco, Avenida Prof. Luiz Freire, 1000 Cidade Universitaria,50740540 Recife, PE, Brazil
4 School of Industrial Engineering, C/ Jose Gutierrez Abascal, No. 2, 28006 Madrid, Spain
Correspondence should be addressed to J. Rosales; [email protected]
Received 2 June 2014; Accepted 12 August 2014; Published 17 September 2014
Academic Editor: Shuisheng He
Copyright © 2014 J. Rosales et al.This is an open access article distributed under the Creative CommonsAttribution License, whichpermits unrestricted use, distribution, and reproduction in any medium, provided the original work is properly cited.
Very high temperature reactor (VHTR) designs offer promising performance characteristics; they can provide sustainable energy,improved proliferation resistance, inherent safety, and high temperature heat supply. These designs also promise operation tohigh burnup and large margins to fuel failure with excellent fission product retention via the TRISO fuel design. The pebble bedreactor (PBR) is a design of gas cooled high temperature reactor, candidate for Generation IV of Nuclear Energy Systems. Thispaper describes the features of a detailed geometric computational model for PBR whole core analysis using the MCNPX code.The validation of the model was carried out using the HTR-10 benchmark. Results were compared with experimental data andcalculations of other authors. In addition, sensitivity analysis of several parameters that could have influenced the results and theaccuracy of model was made.
1. Introduction
Very high temperature reactor (VHTR) designs offer promis-ing performance characteristics. If realized, these conceptscan provide sustainable energy, offer improved proliferationresistance, and are more easily safeguarded than current lightwater reactors (LWR). These designs also promise operationto high burnup and large margins to fuel failure with excel-lent fission product retention via the TRISO (tristructural-isotropic) fuel design. The higher temperature of operationfor these concepts can support industrial process applicationsthat cannot be easily supported by LWR technology [1].
Two VHTR concepts have been studied: the prismaticreactor, with block-type fuel elements, and the pebble bedreactor (PBR), with spherical fuel elements, as shown inFigure 1.
In PBRs, the fuel is contained within graphite pebbleswhich form a randomly packed bed inside a graphite-walled
cylindrical cavity. Due to the stochastic nature of this bed,the location of the individual pebbles is not well defined. Thepebble bed in such a reactor for some type of calculationsis often modeled as a homogeneous mixture of pebblesand coolants materials, with a uniform density throughoutthe core. Unfortunately, such a model does not include allthe effects that the heterogeneity of the pebble bed entails,resulting in possible errors. Three of these effects are (1)the density fluctuations in the pebble bed near the wall, (2)the neutron streaming through the void space between thepebbles, and (3) the variations in the Dancoff factor near theedge of the pebble bed [2].
In the framework of a coordinated research program(CRP), the high temperature gas-cooled test reactor (HTR-10) benchmark was solved by several research organizationswith the aim of validating analytical codes and performancemodels for actual operating conditions of HTRs.The calcula-tions and experimental results were compared. The HTR-10,
Hindawi Publishing CorporationInternational Journal of Nuclear EnergyVolume 2014, Article ID 279073, 12 pageshttp://dx.doi.org/10.1155/2014/279073

2 International Journal of Nuclear Energy
Pyrolytic carbonSilicon carbideUranium dioxide or oxycarbide kernel
Prismatic
Pebb
leParticles Compacts Fuel element
TRISO-coated fuel particles (left) are formed into fuel compacts(center) and inserted into graphite fuel elements (right) for theprismatic reactor
Matrix KernelBuffer layer
Fueled zoneFuel-free shell Inner PyC-layer
SiC-layerOuter PyC-layer
TRISO-coated fuel particles are formedinto fuel spheres for pebble bed reactor
5mm graphite layer
Coated particles embeddedin graphite matrix
08-GAS0711.01
diameter 60mmFuel sphere Half-section
Figure 1: Scheme of TRISO fuel for pebble bed and prismatic VHTR.
built in China, is an experimental facility whose constructionwas completed in 2000 and its initial criticality took placein December of that year. The HTR-10 should serve as atest facility to demonstrate the inherent safety features ofthe modular reactor design and to gain acceptance fromregulatory institutions, utilities, and the public [3].
In the study by Taiwo et al. [4], an evaluation of the initialcritical configuration of the HTR-10 pebble bed reactor wasmade, as part of an effort to identify experimental tests ofthe highest priority, recover the data for those cases, andthen develop standard problems (benchmarks) that are ofsufficient quality for use in the licensing of theVHTR analysiscodes. The initial criticality measurement in HTR-10 wasjudged as an acceptable benchmark.
Monte Carlo techniques have been widely used to studycomplex systems. Several HTR-10 criticality analyses havebeen performedusing codes of theMCNP family. In the studyby Seker and Colak [5], three different geometrical modelswere employed to study the effect of geometric details on thecriticality calculations. Results were compared with diffusiontheory-based calculations as well as with experimental data.
Certain studies [6] have demonstrated that the hightemperature reactor (HTR) performance is considerablyinfluenced by theway its geometry ismodeledwith theMonteCarlo approach. The spatial and energy shielding of theneutron flux even in such small particles cannot be neglectedfor important isotopes with high resonance cross sections.
In previous studies [7], the design of a pebble bedtransmuter (PBT) was done. It is a subcritical system cooled
by helium and moderated by graphite, which uses as fuelsmall amounts of transuranic elements in the form of TRISOparticles, confined in 3 cm radius graphite pebbles forming apebble bed configuration. The PBT is a device designed forthe transmutation of nuclear waste from the existing LWR.In the study by Abanades et al. [8], the conceptual designof a transmutation advanced device for sustainable energyapplications (TADSEA) was presented. It could be usedfor simultaneous nuclear waste transmutation and hydrogengeneration.
In the study by Garcıa et al. [9], a geometrical method forcalculating the real number of pebbles that fit in a cylindricalADS (accelerator driven system) core, according to its sizeand pebble configuration, is described. Based on its results,the packing fraction influence on the TADSEA’s main workparameters was studied, and the redesign of the previousconfiguration was done in order to maintain the thermalpower that was established in the preliminary design. Resultsshowed the capability of the system to reach coolant outlettemperatures high enough for its application to hydrogenproduction.
In order to improve the conceptual design of the TAD-SEA, a new computational model for whole core calculationof PBRswas developed. In this paper, the features of a detailedgeometric computational model for PBR whole core analysis,using MCNPX code, are presented. The model considers anexplicit representation of the graphite reflector and the doubleheterogeneity of the coated fuel particles and the graphitepebbles. The validation of model was carried out using the

International Journal of Nuclear Energy 3
HTR-10 benchmark. Geometrical and material characteris-tics of the HTR-10 can be found in IAEA-TECDOC-1382 [3].The characteristics of fuel and dummy pebbles are shown inTable 1. Results were compared with experimental data andcalculations of other authors.
The HTR-10 benchmark was divided into two parts:the Original and the Deviated benchmarks. Additionally,a sensitivity analysis of the parameters that differ fromthe Deviated benchmark to the Original benchmark wasperformed to evaluate their influence on the differencesbetween the calculations and the experimental results.
In PBRs, the helium gas flows among closely packedpebbles that are randomly loaded into the core region. Itis difficult to model this distinguishing feature of arbitraryarrangement for pebbles. In general, most of the neu-tronic and thermohydraulic simulations assume an orderedarrangement of pebbles, including the simple cubic (SC),body-centered cubic (BCC), or the face-centered cubic (FCC)arrangement [10].
The effects of BCC and FCC arrangements on the criticalheight of theHTR-10 core are investigated using the proposedmodel based on MCNPX. In addition, the critical heightparameterwas calculated using twomodels for the simulationof the TRISO particles inside the pebbles: one model thatconsiders the boundary effect, in which the particles cut bythe surfaces are left out of the problem, and another model inwhich those particles are entirely considered.
The investigated geometric computational model is basedon MCNPX code, version 2.6e [11]. MCNP was created in1994 by Los Alamos National Laboratory. It is based onthe Monte Carlo probabilistic method for computationalmodelling of time dependent transport of many kinds ofparticles, with a wide range of energies, in much differentgeometries. The MCNPX version 2.6e incorporates newcapabilities with respect to previous versions and the availablelibrary in XSDIR, ENDF/B VI.2, was used.
2. Computational Model
In order to get more accurate results in the simulation ofPBRs core, the double heterogeneity of the system mustbe considered. It consists of randomly located pebbles intothe core and randomly located TRISO particles into thefuel pebbles. These features are often neglected due to thedifficulty to model themwithMCNP codes.Themain reasonis that the software allows defining a limited number ofcells and surfaces (99999) [12]. For instance, inside theHTR-10 core, there are in average 27000 pebbles and 8335TRISO particles per pebble to be modeled. This compositioncorresponds to a density of 10.4 g/cm3 of metal oxide and 5 gof pebble mass per coated fuel particles (CFPs) with a kernelsradius of 250 𝜇m.
In several studies, the geometric model is simplifiedhomogenizing the material zones [7–9]. In other studies, theCFPs are distributed within the pebbles in a regular way, aswell as the pebbles inside the core [5, 13]. In the study byAbediet al. [14], the CFPs truncated by the boundary of fuel regioninside fuel pebble were included in the study.
Table 1: Characteristics of the HTR-10 fuel element.
Parameter Units ValuePebble diameter cm 6.00Fuel zone diameter cm 5.00Matrix and graphite shell density g/cm3 1.73Uranium mass per pebble g 5.00Uranium enrichment (by weight) % 17.00Natural boron impurityequivalent content on uranium ppm 4.00
Natural boron impurityequivalent content on graphite ppm 1.30
Core packing fraction — 0.61Fuel core
Kernel radius 𝜇m 0.25UO2 density g/cm3 10.40
LayersTRISO layers PyC/PyC/SiC/PyCTRISO layers thickness mm 0.09/0.04/0.035/0.04TRISO layers density g/cm3 1.1/1.9/3.18/1.9
Dummy ballsPebble diameter cm 6Graphite density g/cm3 1.73Natural boron impurityequivalent content on graphite ppm 1.30
2.1. Models for the Simulation of the TRISO Particles insidethe Pebbles. Distributing the CFPs in a regular way withinthe pebbles is a suitable way to simulate the fuel insidethe core in complex geometries like in the HTR-10. Inthis work, a detailed modeling of TRISO fuel was carriedout. The layers covering a TRISO particle were modeledusing the exact densities and dimensions. In order to geta detailed geometric model equivalent to the homogeneousmodel, it was necessary to calculate the number of CFPs thatguarantees the desired fuel mass per pebble.
In the model, the CFPs are uniformly located in ahexagonal lattice within the pebble. First of all, the numberof CFPs that can fill the plane where the hexagonal lattice islocated (𝑁) is calculated (Figure 2(a)). Secondly, according to𝑁, a repetitive structure consisting of a CFP and its five layersis created. Then, the repetitive structure is spread all over theplane (Figure 2(b)).This model (in this paper calledModel I)has two major approaches: (1) to consider that the CFPs areuniformly arranged inside the pebble, which ignores the realrandomness of theCFPs location, and (2) not to include in thegeometry the fraction of CFPs intersected with the pebble’ssurface, causing the considered fuel mass in the pebble to beless than the real one.
The last situation can be avoided by removing the CFPslocated near the boundary. A model was built with a uniformdistribution of the CFPs inside the pebble where those CFPsintercepted by the pebble’s surface are visually removed fromthe array and relocated in the successive plane, causing allthe CFPs to be fully considered inside the pebble (Model

4 International Journal of Nuclear Energy
(a) XY plane (b) XZ plane
Figure 2: Uniform model with boundary effect, Model I.
II). However, this model has an extra difficulty: it is hard toconstruct.
2.2. Models for the Simulation of the Pebbles inside the Core.In the first load, the PBR core was filled with moderatorpebbles and fuel pebbles. Fuel pebbles contain CFPs in theirinner zone.Themoderator pebbles aremade only of graphite.The fuel-to-moderator pebble ratio (57%–43%) specified inthe HTR-10 benchmark cannot be exactly modeled usingrepetitive structures of MCNPX [12]. To solve this problem,the size of the dummy pebbles was changed in order toobtain the designed fuel-to-moderator ratio in the HTR-10core (Table 2).This approximationwas considered previouslyin IAEA-TECDOC-1382 [3].
In order to simulate the core’s geometry, two types oflattice were used: one with a tetrahedral arrangement in twoplanes (FCC) and the other is the BCC mentioned above. Tobuild the FCC arrangement, a tetrahedron composed of sixspheres at its base forming an equilateral triangle and one onthe top was assembled base to base with a similar tetrahedronrotated 60∘ with respect to the first one (Figure 3). The unitcell is the symmetric cube formed by 8 ⋅ (1/8) spheres atthe corners and 6 ⋅ (1/2) spheres on the faces. Four pebbles(8 ⋅ (1/8) + 6 ⋅ (1/2)) compose the cell. There are two dummypebbles with the reduced diameter and the other two onesare fuel pebbles. In order to keep the volumetric packingfraction (PF) established in the reference benchmark, thepebbles were conveniently spaced into the unit cell, and thedimensions of the unit cell were calculated according to that(see Table 2).
To fill the core volume with unit cells, a square latticefor each plane was created and it was repeated inside thecylinder that delimits the reactor core. To perform the axialdistribution of pebbles, as the number of unit cells in theaxial direction should be integer, the top plane that delimitsthe height of the core does not cut the fuel pebbles, andthe moderator-fuel ratio is preserved. In the radial direction,the surface of the cylinder cuts the unit cells so there is aboundary effect that can influence the accuracy of the results.
Table 2: HTR-10 unit cell data.
Parameter Units Value
Moderator-to-fuel volumetric ratio — 1.33
Fuel pebble radius cm 3.0000
Dummy pebble radius cm 2.7310
FCC unit cubic cell size cm 8.6648
BCC unit cubic cell size cm 6.8773
The height values, where the eigenvalue problems weresolved, were obtained as integer multipliers of the unit cellsize. The HTR-10 core heights for FCC model are displayedin Table 3.
A cubic unit cell composed of one pebble in the centerand eight eights in the corners was considered for the BCCconfiguration. Therefore, the unit cell is composed of twopebbles (1 + 8 ⋅ (1/8)), a fuel pebble and a dummy pebble(Figure 4).
Like in FCC arrangement, the dummy pebble diameteris reduced in order to guarantee the fuel-to-moderator ratio(57%–43%). Again, the cubic unit cell size was calculated tokeep the established PF in the core (0.61) (Table 2). With thecalculated size of the unit cell, the square repetitive structurewas applied to fill the core volume (Figure 4).
Similarly, the height values to solve the critical heightproblem with the BCC arrangement were taken as integersmultiples of the cubic unit cell size, to avoid the boundaryeffect in the axial direction (Table 4). This way allows min-imizing the influence of this approximation on the results,because the fuel pebbles are entirely taken into account in thesimulation process. In both FCC and BCC arrangements, thepebbles in the discharge cone were simulated with the samerepetitive structure, where all the pebbles are composed bygraphite, to guarantee the material continuity.

International Journal of Nuclear Energy 5
4r
Figure 3: FCC unit cell.
x
y
z
(a)
x
y
z
(b)
x
y
z
(c)
Figure 4: BCC unit cell.
Table 3: HTR-10 core height values for critical calculations withFCC arrangement.
Position Height (cm)1 86.648102 95.312913 103.977724 112.642535 121.307346 129.972157 138.636968 147.301779 155.9665810 164.63169
Table 4: HTR-10 core height values for critical calculations withBCC arrangement.
Position Height (cm)1 96.28222 103.15953 110.03684 116.91415 123.79146 130.66877 137.54608 144.42339 151.300610 158.177911 165.0552

6 International Journal of Nuclear Energy
3. Benchmark Solutions
In order to validate the proposed model, the neutronicbenchmark for the HTR-10, included in IAEA-TECDOC-1382 [3], was calculated.TheOriginal and Deviated problemsfor the initial criticality, control rod worth for full and initialcore, and the temperature coefficient were solved.
3.1. Benchmarks Description
3.1.1. Original Benchmark Description. The critical core’sheight is obtained calculating the effective multiplicationfactor (𝐾eff) for several heights of the core and interpolatingthe results. To determine the temperature effects and the rodworth,𝐾eff is calculated for different reactor states varying thetemperature in the core or modifying the positions of controlrods, respectively.
The benchmark was divided into four different subprob-lems:
(1) initial criticality (benchmark problem B1),(2) temperature coefficient (benchmark problem B2),(3) control rods worth for full core (benchmark problem
B3),(4) control rods worth for initial core (benchmark prob-
lem B4).
3.1.2. Deviated Benchmark Description. After the OriginalHTR-10 physics benchmark problems had been defined andbefore the initial core loading, two conditions were changedfrom the benchmark, with respect to the initial core loadingand the first critical experiment. First, dummy balls thatwere to be loaded in the initial core were different fromthose that had been defined in the Original benchmark. Thegraphite pebbles prepared for the first criticality had twomain differences, which influence the neutronic calculation:density and impurities. The graphite pebbles prepared hada density of 1.84 g/cm3, larger than the value defined in theOriginal benchmark (1.73 g/cm3), and the equivalent boronimpurities were 0.125 ppm instead of 1.3 ppm.
Second, the first criticality experiment was made underatmospheric air, instead of helium,whichwas indicated in theOriginal benchmark.
When the participants of the CRP knew the deviationsof the Original benchmark, some calculations were repeatedwith new conditions and both results were analyzed in IAEA-TECDOC-1382 [3]. In order to compare our results with thepublished ones, these deviations were considered, causingchanges in the dummy pebble’s composition and in the core’satmosphere. Other conditions were kept with respect to theOriginal benchmark.
3.2. Simulation Results for the Original andDeviated Benchmarks
3.2.1. Initial Criticality. The benchmark problem B1 consistsin estimating the core critical height of the HTR-10. Theheight values were measured over the upper surface of the
discharge cone. In the Original and Deviated benchmarkproblems, it was considered that the temperature of thecoolant (heliumor atmospheric air) was 20∘C, and the controlrods and absorbent balls were completely removed.
The Original and Deviated benchmark problems B1 weresimulated using the proposed MCNPX model. A detailedgeometry of the HTR-10 pebbled bed, using a repetitivestructure with FCC arrangement and the established PF of0.61, was considered. A fuel-to-moderator ratio of 57%–43% was guaranteed reducing the size of dummy peb-bles. The double heterogeneity, that is, fuel pebbles in thecore and TRISO particles inside the pebbles (Model I),was included. Besides, an exact representation of all thereflector graphite blocks with the holes for the coolantchannels, control rods, and absorbent balls, which surroundthe pebbled bed, was considered. In the case of the Devi-ated benchmark, the changes indicated in Section 3.1.2 weredone.
The𝐾eff values were calculated for each loading height ofTable 3 and the critical height was obtained using the leastsquare method. In order to obtain the 𝐾eff results, a millionneutron histories were simulated, which ensures a statisticalerror (1 − 𝛿) less than 0.1%. The calculations were doneusing the cross sections libraries ENDF/B-VI with a core’stemperature of 27∘C (300K).
Table 5 shows the experimental and calculated results ofcritical height for theOriginal andDeviated benchmarks.Theparticipant countries in the CRP used different code systems(probabilistic and deterministic). In the Original benchmark,our results presented a better agreement with the experimen-tal critical height than other Monte Carlo calculations. Forthe Deviated benchmark, only few calculations were madewith Monte Carlo codes. However, a good agreement of ourmodel’s results was also obtained.
3.2.2. Temperature Coefficients. The scope of this problemwas to calculate the 𝐾eff of the full core (5m3), at core’stemperatures of 20∘C (B21), 120∘C (B22), and 250∘C (B23)with no control rods inserted. The standard cross sectionslibraries of MCNPX do not have these values of core’s tem-peratures ready; however, they could be obtained with NJOYcode.
In this work, the calculations were done using theavailable cross sections libraries for MCNPX, version 2.6e,obtained from ENDF/BVI library at core’s temperatures of27∘C (300K), 326.3∘C (600K), and 526.3∘C (800K), withhelium or atmospheric air as coolant and no control rods orabsorbent balls inserted. The 𝐾eff values for the B22 and B23problems were obtained by polynomial interpolation of thecalculated values for the available temperature libraries. Inthis way, a comparative analysis of the 𝐾eff behavior with thecore’s temperature was possible.
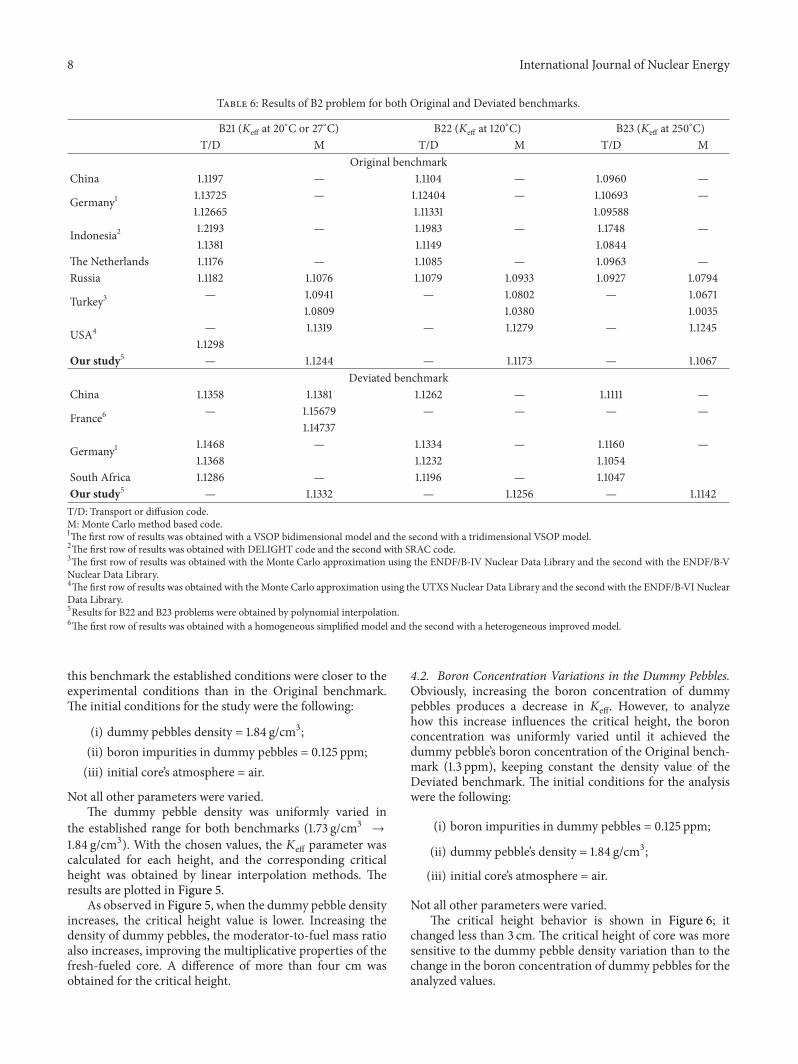
Table 6 shows our results of 𝐾eff as a function of thetemperature for the Original and Deviated benchmarks. Inaddition, results obtained with other code systems (proba-bilistic and deterministic) are presented.

International Journal of Nuclear Energy 7
Table 5: Critical height (cm) results for both Original and Deviated benchmarks.
Participant countries Original benchmark Deviated benchmarkDiffusion/transport Monte Carlo Diffusion/transport Monte Carlo
China 125.8 126.1 122.558 122.874
France1 — — — 115.36117.37
Germany2 124.2 — 121.0 —126.8 123.3
Indonesia3 107 — — —120
Japan 113 — — —The Netherlands 125.3 — 122.1 —Russia 136 137.3 — —South Africa — — 122.537 —
Turkey4 119.27 129.7 — —135.3
USA5 — 127.5 — —128
Our study — 124.15 — 121.21Experimental result for the critical height: 123.06.
1The first row of results was obtained with a homogeneous simplified model and the second with a heterogeneous improved model.2The first row of results was obtained with a VSOP bidimensional model and the second with a tridimensional VSOP model.3The first row of results was obtained with DELIGHT code and the second with SRAC code.4The first row of results was obtained with the Monte Carlo approximation using the ENDF/B-IV Nuclear Data Library and the second with the ENDF/B-VNuclear Data Library.5The first row of results was obtained with the Monte Carlo approximation using the UTXS Nuclear Data Library and the second with the ENDF/B-VI NuclearData Library.
In general, the obtained 𝐾eff values present good agree-ment with the initial calculations for all the temperature val-ues. However, the𝐾eff values present a better agreement withthe Chinese results, especially for the Deviated benchmark.
3.2.3. Calculation of Control Rods Worth for Full Core. Thereactivity worth of ten control rods fully inserted (B31) andone control rod fully inserted (B32, with the other remainingrods in withdrawal position), for full core and under heliumor air atmosphere at 20∘C, was calculated.
In our case, the calculation of 𝐾eff was done withENDF/B-VI library with a core’s temperature of 27∘C. Thereactivity worth was calculated by
𝜌𝑤=𝐾eff1 − 𝐾eff2𝐾eff1 ⋅ 𝐾eff2
, (1)
where 𝜌𝑤is the reactivity worth and 𝐾eff1 and 𝐾eff2 represent
the 𝐾eff values in the reactor when the rods are completelyinserted and when the rods are in withdrawal position,respectively.
Table 7 shows the results of the B3 problem for the Origi-nal and Deviated benchmarks, as well as the results obtainedwith other code systems (probabilistic and deterministic)used by the participant countries in the CRP. In general,a good agreement with initial calculations was obtained,especially with the Chinese results.
3.2.4. Calculation of Control Rod Worth for Initial Core.This problem includes calculating the reactivity worth of theten fully inserted control rods (B41) under helium or airatmosphere, with a core’s temperature of 20∘C and a loadingcore height of 126 cm. In the same way, the worth of one rod(B42) was calculated.
Table 8 shows the results of the B4 problem for bothOrig-inal and Deviated benchmarks. A good agreement betweenour results and the Monte Carlo Chinese results can beobserved.
4. Sensitivity Analysis
A sensitivity analysis of the parameters that differ from theDeviated benchmark to the Original benchmark was per-formed, to evaluate their possible influence on the differencesbetween the calculations and the experimental results.
One difference between the Deviated benchmark and theOriginal benchmarkwas given by the variation of the dummypebble’s composition.
4.1. Density Variations in the Dummy Pebbles. To evaluatethe influence of the dummy pebble’s density variation onthe results of the critical heights, the graphite density waschanged keeping constant the boron concentration value.TheDeviated benchmark was chosen for this study because in
8 International Journal of Nuclear Energy
Table 6: Results of B2 problem for both Original and Deviated benchmarks.
B21 (𝐾eff at 20∘C or 27∘C) B22 (𝐾eff at 120
∘C) B23 (𝐾eff at 250∘C)
T/D M T/D M T/D MOriginal benchmark
China 1.1197 — 1.1104 — 1.0960 —
Germany1 1.13725 — 1.12404 — 1.10693 —1.12665 1.11331 1.09588
Indonesia2 1.2193 — 1.1983 — 1.1748 —1.1381 1.1149 1.0844
The Netherlands 1.1176 — 1.1085 — 1.0963 —Russia 1.1182 1.1076 1.1079 1.0933 1.0927 1.0794
Turkey3 — 1.0941 — 1.0802 — 1.06711.0809 1.0380 1.0035
USA4 — 1.1319 — 1.1279 — 1.12451.1298
Our study5 — 1.1244 — 1.1173 — 1.1067Deviated benchmark
China 1.1358 1.1381 1.1262 — 1.1111 —
France6 — 1.15679 — — — —1.14737
Germany1 1.1468 — 1.1334 — 1.1160 —1.1368 1.1232 1.1054
South Africa 1.1286 — 1.1196 — 1.1047Our study5 — 1.1332 — 1.1256 — 1.1142T/D: Transport or diffusion code.M: Monte Carlo method based code.1The first row of results was obtained with a VSOP bidimensional model and the second with a tridimensional VSOP model.2The first row of results was obtained with DELIGHT code and the second with SRAC code.3The first row of results was obtained with the Monte Carlo approximation using the ENDF/B-IV Nuclear Data Library and the second with the ENDF/B-VNuclear Data Library.4The first row of results was obtained with theMonte Carlo approximation using the UTXS Nuclear Data Library and the second with the ENDF/B-VI NuclearData Library.5Results for B22 and B23 problems were obtained by polynomial interpolation.6The first row of results was obtained with a homogeneous simplified model and the second with a heterogeneous improved model.
this benchmark the established conditions were closer to theexperimental conditions than in the Original benchmark.The initial conditions for the study were the following:
(i) dummy pebbles density = 1.84 g/cm3;(ii) boron impurities in dummy pebbles = 0.125 ppm;(iii) initial core’s atmosphere = air.
Not all other parameters were varied.The dummy pebble density was uniformly varied in
the established range for both benchmarks (1.73 g/cm3 →1.84 g/cm3). With the chosen values, the 𝐾eff parameter wascalculated for each height, and the corresponding criticalheight was obtained by linear interpolation methods. Theresults are plotted in Figure 5.
As observed in Figure 5, when the dummy pebble densityincreases, the critical height value is lower. Increasing thedensity of dummy pebbles, the moderator-to-fuel mass ratioalso increases, improving the multiplicative properties of thefresh-fueled core. A difference of more than four cm wasobtained for the critical height.
4.2. Boron Concentration Variations in the Dummy Pebbles.Obviously, increasing the boron concentration of dummypebbles produces a decrease in 𝐾eff. However, to analyzehow this increase influences the critical height, the boronconcentration was uniformly varied until it achieved thedummy pebble’s boron concentration of the Original bench-mark (1.3 ppm), keeping constant the density value of theDeviated benchmark. The initial conditions for the analysiswere the following:
(i) boron impurities in dummy pebbles = 0.125 ppm;
(ii) dummy pebble’s density = 1.84 g/cm3;
(iii) initial core’s atmosphere = air.
Not all other parameters were varied.The critical height behavior is shown in Figure 6; it
changed less than 3 cm. The critical height of core was moresensitive to the dummy pebble density variation than to thechange in the boron concentration of dummy pebbles for theanalyzed values.

International Journal of Nuclear Energy 9
Table 7: Results of B3 problem for both Original and Deviated benchmarks.
Original benchmark Deviated benchmarkB31 (%) B32 (%) B31 (%) B32 (%)
T/D M T/D M T/D M T/D MChina 15.24 16.56 — 1.413 14.46 15.31 1.277 1.343
France1 — — — — — 13.06 — 1.3513.44 1.31
Germany 16.6 — 1.56 — 15.73 — 1.48 —Japan 18.0 — — — — — — —The Netherlands 11.86 — — — — — — —Russia 15.50 17.90 — — — — — —
Turkey2 — 18.73 — 2.5321.88 4.60
USA3 — 16.50 — — — — — —16.56
Our study — 14.75 — 1.32 — 14.18 — 1.531The first row of results was obtained with a homogeneous simplified model and the second with a heterogeneous improved model.2The first row of results was obtained with the Monte Carlo approximation using the ENDF/B-IV Nuclear Data Library and the second with the ENDF/B-VNuclear Data Library.The first row of results was obtained with DELIGHT code and the second with SRAC code.3The first row of results was obtained with the Monte Carlo approximation using the UTXS Nuclear Data Library and the second with the ENDF/B-VI NuclearData Library.
Table 8: Results of B4 problem for both Original and Deviated benchmarks.
Original benchmark Deviated benchmarkB41 (%) B42 (%) B41 (%) B42 (%)
T/D M T/D M T/D M T/D MChina 18.27 19.36 1.62 1.79 17.23 18.28 1.54 1.57
France1 — — — — — 13.66 — 1.5213.80
Germany 20.50 — 1.97 — 19.31 — 1.86 —The Netherlands 13.61 — — — — — — —Our study — 17.72 — 1.82 — 16.58 — 1.651The first row of results was obtained with a homogeneous simplified model.
126
125
124
123
122
121
1,72 1,74 1,76 1,78 1,80 1,82 1,84
Density (g/cm3)
Criti
cal h
eigh
t (cm
)
Figure 5: Critical height versus dummy pebble’s density.
123,5
123,0
122,5
122,0
121,5
121,00,0 0,2 0,4 0,6 0,8 1,0 1,2 1,4
Boron concentration (ppm)
124,0
Criti
cal h
eigh
t (cm
)
Figure 6: Critical height versus boron concentration of dummypebbles.

10 International Journal of Nuclear Energy
Table 9: Dry and humid air composition.
Element Humid air Dry airFraction Fraction
O2 0.223240 0.231781N2 0.712032 0.755268H2 0.064728 —C2 — 0.000124Ar — 0.012827
4.3. Variations in the Composition of the Core’s Atmosphere.Another parameter that could affect the results of the cal-culated benchmark is the uncertainty of air humidity thatreplaced the helium coolant of the core. For this reason, acomparison between the critical height results with the aircomposition given by the Deviated benchmark and with dryair was made. The humid air composition was calculatedaccording to the specifications given in IAEA-TECDOC-1382[3] for the Deviated benchmark and the dry air compositionwas obtained from [15].The compositions for both humid anddry air are given in Table 9. The rest of the parameters of theDeviated benchmark were kept unchanged.The values of𝐾effand the critical height for both compositions of the air aregiven in Table 10. The results showed that the compositionof the air in the studied range does not affect the criticalheight. In the study by Taiwo et al. [4], the change in𝐾eff fromsaturated air to totally dry air was found to be −3 ⋅ 10−5. Thisresult is consistent with our study.
4.4. Comparison between Critical Height Values Using theFCC and BCC Arrangements. The aim of this study wasto evaluate the possible influence of the arrangement used,FCC or BCC, on the critical height results. It is known thatpebbles are randomly loaded in the reactor’s core, but in ourcomputational model a fixed arrangement is assumed. Thecalculations were made for the Original benchmark.
The BCC and FCC unit cells have two and four pebbles,respectively, and they were simulated taking into account theparameters described in Section 2.
Table 11 shows the results of 𝐾eff for each configuration.The critical height values were calculated using cubic splinepolynomial interpolation.The obtained critical height for theBCC arrangement was 126.15 cm and it was 127.61 cm for theFCC.
The results showed that there are not significant differ-ences between both models. The calculated critical heightshave a relative error of 1.1%. This allows concluding thatboth models are equivalent for simulating the pebble bedwhole core. It is important to notice that for the FCCarrangement the calculations were carried out for ten heightvalues, whereas for the BCC arrangement eleven values wereemployed because of the smaller unit cell size. The mismatchof the calculated points makes it impossible to compare themone to one.
4.5. Comparison betweenModels I and II. Model II wasmadeto avoid the boundary effect, which occurs when the surface
Table 10: Critical height results for both dry and humid air for theFCC model.
Height (cm) Humid air Dry air𝐾eff
86.64810 0.85849 0.8589095.31291 0.89936 0.89989103.97772 0.93834 0.93774112.64253 0.96917 0.96972121.30734 1.00027 0.99910129.97215 1.02495 1.02394138.63696 1.04741 1.04870147.30177 1.06874 1.06829155.96658 1.08707 1.08748164.63169 1.10429 1.10404Critical height 121.23 121.62
of fuel region inside fuel pebble cuts the TRISO particleslocated near to boundary of fuel region inside fuel pebble(see Section 2). Model I does not consider this feature. Withthe aim of evaluating the influence of this approximation,the critical height results calculated by both models werecompared.
The BCC arrangement was used to simulate the pebblesinside the core. The 𝐾eff values were calculated for the coreheight values of Table 4, and the critical height was obtainedusing interpolation techniques. The𝐾eff behavior as functionof the core’s height, for the two models, is presented inFigure 7. It can be seen that almost all 𝐾eff values of thetwo models are very close one to one and the confidenceintervals for 68% (𝐾eff ± 𝛿) overlap (except for 130.6687 cmof height). The values of 𝐾eff were calculated ensuring astandard deviation value below 100 pcm. Accordingly, thecritical height values calculated by both models are the same.
We can conclude that the pebble boundary effects for thewhole core calculation of PBRs are negligible and are onlyimportant for cell calculations. This is an important result,taking into account the additional difficulties to generate thisspecial feature in the model.
5. Conclusions
The features of a detailed geometric computational model forpebble bed whole core analysis usingMCNPX code, 2.6e ver-sion, were discussed. The double heterogeneity of the pebblebed (fuel pebbles inside the core and the TRISO particlesinside the pebbles) was taken into account. The validation ofmodel was carried out using the HTR-10 benchmark.
The results obtained with the model, corresponding tothe solution of the four benchmark problems, are consistentwith the experimental results and initial calculations of theparticipant countries of the Coordinated Research Program.A very good agreement with the Chinese calculations wasobtained.
A sensitivity analysis of the parameters that differ fromthe Deviated benchmark to the Original benchmark was

International Journal of Nuclear Energy 11
Table 11: 𝐾eff values for different heights using BCC and FCC pebbles configurations.
BCC FCCHeight 𝐾eff Std. dev. Height 𝐾eff Std. dev.96.2822 0.89089 0.00090 86.64810 0.84136 0.00088103.1595 0.92115 0.00091 95.31291 0.88329 0.00089110.0368 0.94597 0.00087 103.97772 0.91968 0.00087116.9141 0.96954 0.00089 112.64253 0.95301 0.00087123.7914 0.99234 0.00091 121.30734 0.98135 0.00089130.6687 1.01476 0.00091 129.97215 1.00689 0.00089137.5460 1.03210 0.00088 138.63696 1.03129 0.00087144.4233 1.04923 0.00091 147.30177 1.05146 0.00088151.3006 1.06466 0.00091 155.96658 1.07036 0.00090158.1779 1.08043 0.00088 164.63169 1.08672 0.00088165.0552 1.09213 0.00090 — — —
1,141,121,101,081,061,041,021,000,98
0,96
0,94
110 120 130 140 150 160 170
Kef
f
Keff distribution using Model IKeff distribution using Model II
Interpolation curve for Model IInterpolation curve for Model II
Loading height (cm)
Figure 7: 𝐾eff as function of the core height for both Model I andModel II.
performed to evaluate their possible influence on the differ-ences between the calculations and the experimental results.The increase of the dummy pebble density and dummypebble boron concentration produces opposite effects on thebehavior of the critical height. This can make the Originaland Deviated benchmarks results not significantly different.The critical height of core was more sensitive to the change ofthe dummy pebble density than to the change of the dummypebble boron concentration in the analyzed value range.
Another parameter that could affect the results of thebenchmark is the uncertainty of air humidity that replacedthe helium coolant of the core.The analysismade showed thatthe variation of the composition of the air in the studied rangedoes not affect the value of the critical height.
The FCC and BCC configurations for the distributionof the pebbles inside the core were compared. The corre-sponding critical heights were calculated and there was no
significant difference between them, presenting a relativeerror of 1.1%.
Two models were evaluated for the CFPs distributioninside the pebbles. Model I ignores the boundary effectproduced by the intersection of the pebble’s surface and theCFPs located near the edge. In Model II, the CFPs near theedge are manually relocated in other planes to mitigate theboundary effect. The critical height of the HTR-10 core wascalculated for both models and the results were the same,showing that the boundary effect in the pebble is not aninfluential parameter in whole core calculations and bothmodels are equivalent.This is an important result, taking intoaccount the additional effort that requires the relocation ofthe CFPs.
The new detailed geometric computational model forwhole core calculation of PBRs using MCNPX, 2.6e ver-sion, allows performing more accurate neutronic analysis toimprove the accuracy of the design of the TADSEA.
Conflict of Interests
The authors declare that there is no conflict of interestsregarding the publication of this paper.
Acknowledgments
This work was made in the framework of the MES-CAPESproject: “Study of Advanced Nuclear Systems of PebbledBed Type, for the Transmutation of Long Life Waste andHydrogen Production withHigh Temperature Technologies.”The authors would like to thank the Brazilian agenciesCAPES (Higher Education Coordination Agency of Educa-tionMinistry) andCNPq (National Council for Scientific andTechnological Development) for the financial support for thiswork.
References
[1] P. Sabharwall, S. M. Bragg-Sitton, and C. Stoots, “Challengesin the development of high temperature reactors,” EnergyConversion and Management, vol. 74, pp. 574–581, 2013.

12 International Journal of Nuclear Energy
[2] G. J. Auwerda, J. L. Kloosterman, D. Lathouwers, and T. H. J. J.van der Hagen, “Effects of random pebble distribution on themultiplication factor in HTR pebble bed reactors,” Annals ofNuclear Energy, vol. 37, no. 8, pp. 1056–1066, 2010.
[3] IAEA–TECDOC–1382, Evaluation of High Temperature GasCooled Reactor Performance: Benchmark Analysis Related toInitial Testing of the HTTR and HTR–10, 2003.
[4] T. A. Taiwo, T. K. Kim, W. S. Yang et al., “Evaluation of hightemperature gas-cooled reactor physics experiments as VHTRbenchmark problems,” Tech. Rep. ANL-GenIV-059, ArgonneNational Laboratory, 2005.
[5] V. Seker and U. Colak, “HTR-10 full core first criticality analysiswith MCNP,” Nuclear Engineering and Design, vol. 222, no. 2-3,pp. 263–270, 2003.
[6] R. Plukiene and D. Ridikas, “Modelling of HTRs with MonteCarlo: fromahomogeneous to an exact heterogeneous corewithmicroparticles,” Annals of Nuclear Energy, vol. 30, no. 15, pp.1573–1585, 2003.
[7] A. Abanades and A. Perez-Navarro, “Engineering design stud-ies for the transmutation of nuclear wastes with a gas-cooledpebble-bed ADS,” Nuclear Engineering and Design, vol. 237, no.3, pp. 325–333, 2007.
[8] A. Abanades, C. Garcıa, L. Garcıa, A. Escriva, A. Perez-Navarro,and J. Rosales, “Application of gas-cooled Accelerator DrivenSystem (ADS) transmutation devices to sustainable nuclearenergy development,” Nuclear Engineering and Design, vol. 241,no. 6, pp. 2288–2294, 2011.
[9] L. Garcıa, J. Perez, C. Garcıa, A. Escriva, J. Rosales, and A.Abanades, “Calculation of the packing fraction in a pebble-bedADS and redesigning of the Transmutation Advanced Devicefor Sustainable Energy Applications (TADSEA),” Nuclear Engi-neering and Design, vol. 253, pp. 142–152, 2012.
[10] Y. M. Ferng and K.-Y. Lin, “Investigating effects of BCC andFCC arrangements on flow and heat transfer characteristics inpebbles through CFD methodology,” Nuclear Engineering andDesign, vol. 258, pp. 66–75, 2013.
[11] G. McKinney, J. Durkee, J. Hendricks et al., “MCNPX 2.6xfeatures,” LA-UR-07-2053, Los Alamos National Laboratory,2007.
[12] D. B. Pelowitz,MCNPXUser’sManual Version 2.5.0, LosAlamosNacional Laboratory, 2005.
[13] H.-C. Kim, S. H. Kim, and J. K. Kim, “A new strategy to simulatea random geometry in a pebble-bed core with the Monte Carlocode MCNP,” Annals of Nuclear Energy, vol. 38, no. 9, pp. 1877–1883, 2011.
[14] A. Abedi, N. Vosoughi, and M. B. Ghofrani, “An exact MCNPmodeling of pebble bed reactors,” World Academy of Science,Engineering and Technology, vol. 59, pp. 959–963, 2011.
[15] R. J. Mc Conn, C. J. Gesh, R. T. Pagh, R. A. Rucker, andR. G. Williams, Compendium of Material Composition Datafor Radiation Transport Modeling, Revision 1, Pacific NortwestNational Laboratory, US Department of Energy, 2011.

TribologyAdvances in
Hindawi Publishing Corporationhttp://www.hindawi.com Volume 2014
International Journal of
AerospaceEngineeringHindawi Publishing Corporationhttp://www.hindawi.com Volume 2014
FuelsJournal of
Hindawi Publishing Corporationhttp://www.hindawi.com Volume 2014
Journal ofPetroleum Engineering
Hindawi Publishing Corporationhttp://www.hindawi.com Volume 2014
Industrial EngineeringJournal of
Hindawi Publishing Corporationhttp://www.hindawi.com Volume 2014
Power ElectronicsHindawi Publishing Corporationhttp://www.hindawi.com Volume 2014
Advances in
CombustionJournal of
Hindawi Publishing Corporationhttp://www.hindawi.com Volume 2014
Journal of
Hindawi Publishing Corporationhttp://www.hindawi.com Volume 2014
Renewable Energy
Submit your manuscripts athttp://www.hindawi.com
Hindawi Publishing Corporationhttp://www.hindawi.com Volume 2014
StructuresJournal of
International Journal of
RotatingMachinery
Hindawi Publishing Corporationhttp://www.hindawi.com Volume 2014
EnergyJournal of
Hindawi Publishing Corporationhttp://www.hindawi.com Volume 2014
Hindawi Publishing Corporation http://www.hindawi.com
Journal ofEngineeringVolume 2014
Hindawi Publishing Corporation http://www.hindawi.com Volume 2014
International Journal ofPhotoenergy
Hindawi Publishing Corporationhttp://www.hindawi.com Volume 2014
Nuclear InstallationsScience and Technology of
Hindawi Publishing Corporationhttp://www.hindawi.com Volume 2014
Solar EnergyJournal of
Hindawi Publishing Corporationhttp://www.hindawi.com Volume 2014
Wind EnergyJournal of
Hindawi Publishing Corporationhttp://www.hindawi.com Volume 2014
Nuclear EnergyInternational Journal of
Hindawi Publishing Corporationhttp://www.hindawi.com Volume 2014
High Energy PhysicsAdvances in
The Scientific World JournalHindawi Publishing Corporation http://www.hindawi.com Volume 2014