
Research Article Automated Brain Tissue Classification by...
11
Hindawi Publishing Corporation ISRN Biomedical Imaging Volume 2013, Article ID 473437, 10 pages http://dx.doi.org/10.1155/2013/473437 Research Article Automated Brain Tissue Classification by Multisignal Wavelet Decomposition and Independent Component Analysis Sindhumol S., 1 Anil Kumar, 2 and Kannan Balakrishnan 1 1 Artificial Intelligence Lab, Department of Computer Applications, Cochin University of Science and Technology, Kochi 682022, India 2 Institute of Radiology and Imaging Sciences, Indira Gandhi Co-Operative Hospital, Kochi, Kerala 682020, India Correspondence should be addressed to Sindhumol S.; [email protected] Received 4 February 2013; Accepted 26 March 2013 Academic Editors: W. Hall, I. Karanasiou, and G. Waiter Copyright © 2013 Sindhumol S. et al. is is an open access article distributed under the Creative Commons Attribution License, which permits unrestricted use, distribution, and reproduction in any medium, provided the original work is properly cited. Multispectral analysis is a potential approach in simultaneous analysis of brain MRI sequences. However, conventional classification methods oſten fail to yield consistent accuracy in tissue classification and abnormality extraction. Feature extraction methods like Independent Component Analysis (ICA) have been effectively used in recent studies to improve the results. However, these methods were inefficient in identifying less frequently occurred features like small lesions. A new method, Multisignal Wavelet Independent Component Analysis (MW-ICA), is proposed in this work to resolve this issue. First, we applied a multisignal wavelet analysis on input multispectral data. en, reconstructed signals from detail coefficients were used in conjunction with original input signals to do ICA. Finally, Fuzzy C-Means (FCM) clustering was performed on generated results for visual and quantitative analysis. Reproducibility and accuracy of the classification results from proposed method were evaluated by synthetic and clinical abnormal data. To ensure the positive effect of the new method in classification, we carried out a detailed comparative analysis of reproduced tissues with those from conventional ICA. Reproduced small abnormalities were observed to give good accuracy/Tanimoto Index values, 98.69%/0.89, in clinical analysis. Experimental results recommend MW-ICA as a promising method for improved brain tissue classification. 1. Introduction Multispectral analysis of Magnetic Resonance Imaging (MRI) to access the relevant and complementary information from different sequences has been a widely discussed research topic for many years [1, 2]. MRI sequences like T1-weighted images (T1WI), T2-weighted images (T2WI), Proton Density Images (PDI), Fluid Attenuated Inversion Recovery (FLAIR), and so forth provide a huge repository of unique information on different tissues [2, 3]. For example, considerable contrast between Gray Matter (GM) and White Matter (WM) is available from T1WI. T2WI can give details of Cerebral Spinal Fluid (CSF) and abnormalities, whereas FLAIR images suppress CSF effects to give hyperintense lesions details. Simultaneous analysis of each sequence to collect the promi- nent pathological information is a tedious job for radiol- ogy experts. Computer-aided diagnosis using multispectral approach is helpful in this context to save time and to improve the accuracy and consistency of the clinical results [4]. But conventional algorithms used in normal data mining process are not efficient and robust to yield good results with expected clinical accuracy in multispectral analysis. Recent multispectral brain MRI analysis attempted to resolve this issue by improved feature extraction with statistical and mathematical concepts like probabilistic methods, fuzzy approaches, algebraic techniques, and so forth, [5–7]. A typical multispectral analysis system initializes with a collection of coregistered images as input data. Corre- sponding slices from each sequence forms each band in the multispectral suite as shown in Figure 1. Preprocessing steps like intensity inhomogeneity correction and noise removal [2] can be used to enhance the contrast and quality of the input images. Feature extraction and optimal selection of fea- tures are important in multispectral analysis, since accuracy and reliability of the classified results are highly affected by the selected feature sets [2]. Principal component analysis
Transcript of Research Article Automated Brain Tissue Classification by...
Hindawi Publishing CorporationISRN Biomedical ImagingVolume 2013 Article ID 473437 10 pageshttpdxdoiorg1011552013473437
Research ArticleAutomated Brain Tissue Classification by Multisignal WaveletDecomposition and Independent Component Analysis
Sindhumol S1 Anil Kumar2 and Kannan Balakrishnan1
1 Artificial Intelligence Lab Department of Computer Applications Cochin University of Science and Technology Kochi 682022 India2 Institute of Radiology and Imaging Sciences Indira Gandhi Co-Operative Hospital Kochi Kerala 682020 India
Correspondence should be addressed to Sindhumol S sindhumol09gmailcom
Received 4 February 2013 Accepted 26 March 2013
Academic Editors W Hall I Karanasiou and G Waiter
Copyright copy 2013 Sindhumol S et al This is an open access article distributed under the Creative Commons Attribution Licensewhich permits unrestricted use distribution and reproduction in any medium provided the original work is properly cited
Multispectral analysis is a potential approach in simultaneous analysis of brainMRI sequences However conventional classificationmethods often fail to yield consistent accuracy in tissue classification and abnormality extraction Feature extraction methods likeIndependentComponentAnalysis (ICA) have been effectively used in recent studies to improve the results However thesemethodswere inefficient in identifying less frequently occurred features like small lesions A newmethod Multisignal Wavelet IndependentComponent Analysis (MW-ICA) is proposed in this work to resolve this issue First we applied a multisignal wavelet analysison input multispectral data Then reconstructed signals from detail coefficients were used in conjunction with original inputsignals to do ICA Finally Fuzzy C-Means (FCM) clustering was performed on generated results for visual and quantitative analysisReproducibility and accuracy of the classification results from proposed method were evaluated by synthetic and clinical abnormaldata To ensure the positive effect of the newmethod in classification we carried out a detailed comparative analysis of reproducedtissues with those from conventional ICA Reproduced small abnormalities were observed to give good accuracyTanimoto Indexvalues 9869089 in clinical analysis Experimental results recommend MW-ICA as a promising method for improved braintissue classification
1 Introduction
Multispectral analysis ofMagnetic Resonance Imaging (MRI)to access the relevant and complementary information fromdifferent sequences has been awidely discussed research topicfor many years [1 2] MRI sequences like T1-weighted images(T1WI) T2-weighted images (T2WI) ProtonDensity Images(PDI) Fluid Attenuated Inversion Recovery (FLAIR) and soforth provide a huge repository of unique information ondifferent tissues [2 3] For example considerable contrastbetween Gray Matter (GM) and White Matter (WM) isavailable from T1WI T2WI can give details of CerebralSpinal Fluid (CSF) and abnormalities whereas FLAIR imagessuppress CSF effects to give hyperintense lesions detailsSimultaneous analysis of each sequence to collect the promi-nent pathological information is a tedious job for radiol-ogy experts Computer-aided diagnosis using multispectralapproach is helpful in this context to save time and to
improve the accuracy and consistency of the clinical results[4] But conventional algorithms used in normal data miningprocess are not efficient and robust to yield good resultswith expected clinical accuracy in multispectral analysisRecent multispectral brainMRI analysis attempted to resolvethis issue by improved feature extraction with statisticaland mathematical concepts like probabilistic methods fuzzyapproaches algebraic techniques and so forth [5ndash7]
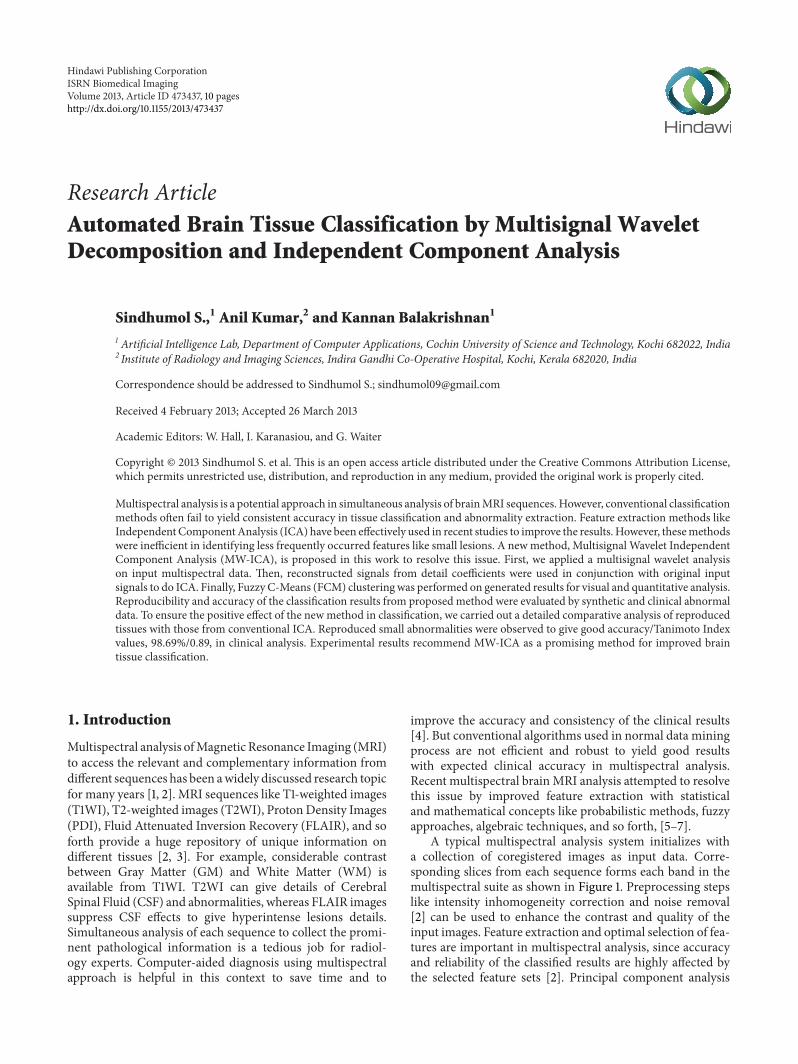
A typical multispectral analysis system initializes witha collection of coregistered images as input data Corre-sponding slices from each sequence forms each band in themultispectral suite as shown in Figure 1 Preprocessing stepslike intensity inhomogeneity correction and noise removal[2] can be used to enhance the contrast and quality of theinput images Feature extraction and optimal selection of fea-tures are important in multispectral analysis since accuracyand reliability of the classified results are highly affected bythe selected feature sets [2] Principal component analysis
2 ISRN Biomedical Imaging
Input MR Images
Preprocessing and
Feature extraction and
Training and
Multispectral image
Output classes
Feature sets
T1WIT2WI
PDIFLAIR
band selection
feature selection
classification
Figure 1 Typical multispectral analysis
[8] wavelets [9] and Independent Component Analysis(ICA) [10] are the common feature extraction techniques insupervised and unsupervised multispectral classifications [811] Unsupervised classifications like k-means clustering [8]Fuzzy-C-Means (FCM) clustering [7] and self-organizingmaps [8] were found to be yielding good results in automatedsegmentation and classification Artificial Neural Networks(ANN) [2 8] Support Vector Machines (SVM) [12] andensemble methods have contributed a lot in clinically trainedmodel preparation for pathological tissue analysis
This work focuses on improvement in automated multi-spectral brain MRI classification through enhanced featureanalysis Recent brain MRI studies using ICA [13 14] andits extensions like kernel ICA [13] overcomplete ICA [15]and so forth have demonstrated ICA as a good featureextraction method for normal and abnormal tissue analysisAs a global transform ICA gives more priority to globalfeatures thereby losing important information on local brainmatters in classification [16] Dependency of the input MRIimages also adversely affects the ICA based classificationresults Local ICA [17] and Wavelet based ICA extensions[16 18 19] have been introduced as a solution for these short-comings However the selection of decomposition levels andreconstruction errors on spatial wavelet analysis were foundto influence the accuracy and reliability of the reproducedresults in clinical analysis
An improved source separation method MultisignalWavelet Independent Component Analysis (MW-ICA) isproposed in this work for efficient automated brain tissue
analysis from multispectral MRI First local characteristicsfrom brainMRI images were extracted bymultisignal waveletanalysis High frequency components (detail coefficients) aremutually independent while low frequency components areweakly dependent [19] So detail coefficients were consideredin this work for wavelet reconstruction to retain the mutu-ally independent local details Reconstructed signals wereappended to original input signals to form an enhanced inputsignal set for ICA FCM [7 20] was then applied to resultsfrom ICA to do segmentation and classification Visual andquantitative analyses using synthetic and clinical data wereperformed to evaluate the improvement in tissue classifica-tion by MW-ICA over conventional ICA The variations inreproducibility of the newmethod for different wavelets werealso considered in this study Observed results demonstratedthe reproducibility and efficiency of the proposed method inlocal and global brain matter classification
The rest of the paper is organized as followsMaterials andmethods are explained in Section 2 Experiments and resultsare presented in Section 3 Several aspects of our work arediscussed in Section 4 Section 5 concludes the paper
2 Materials and Methods
21 Input Data Both synthetic and clinical images wereconsidered in the evaluation of the proposed systemThe syn-thetic MR images were collected from BrainWeb SimulatedBrainDatabase at theMcConnell Brain ImagingCentre of theMontreal Neurological Institute (MNI) McGill University(httpwwwbicmnimcgillcabrainweb) We selected 20slices (slices nos 90ndash109) of abnormal data set containingmultiple sclerosis (MS) details to form the multispectralsuite Axial T1-weighted images (T1WI) T2-weighted images(T2WI) and Proton Density Images (PDI) with parametersettings 1mm slice thickness intensity nonuniformity 20and noise level 0 were included in the set
Axial T1WI T2WI and FLAIR images from 28 abnormalcases were considered for clinical image analysis Threesample slices from each sequence showing traces of abnormaltissues were selected for each case and total 28 times 3multispec-tral image cubes were included in the analysis The brain MRimages were acquired by axial spin echo T1WIwith repetitiontime (TR) = 1600ms echo time (TE) = 89ms and T2WIwith TRTE = 4000ms95ms FLAIR images have TRTE =6000ms94ms inversion time (TI) = 20265ms Additionalparameters were slice gap 65mm thickness 5mm and thesize 227times 260 pixelsThe ground truth tissues in clinical caseswere collected frommanually segmented and labeled imagesunder the supervision of an experienced radiologist
22 Wavelet Analysis and Synthesis In this work imagesfrom each band in the multispectral cube were reshapedinto a 1D signal and a collection of those signals form MRImultisignal [19] were stored as a matrix organized rowwise(or columnwise) Wavelet transform of a signal is calculatedby projection of the signal onto shifted and scaled versionof a basic function [9] In the case of higher dimensionalsignals it can be done in spatial or spectral direction Mallatrsquos
ISRN Biomedical Imaging 3
High pass filter
Low pass
High pass filter
Low pass filter
1D multisignal
Dyadic decimation
filter
2 darr
2 darr
2 darr
2 darr
1198601
1198602
1198632
1198631
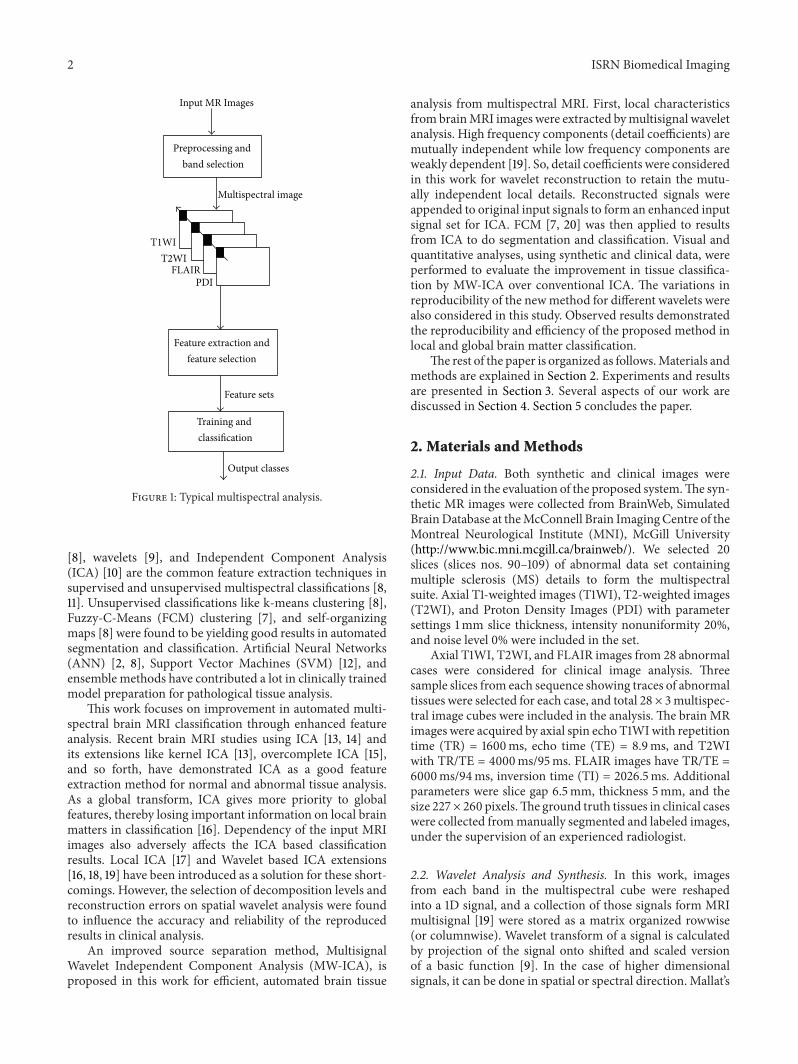
Figure 2 Multisignal wavelet analysis of multispectral data
multiresolution algorithm [9] for 1-D signal was extendedto multidimensional signals as shown in Figure 2 to domultisignal wavelet analysis in this work
A low pass filter and its corresponding high pass filter aresimultaneously applied on input multisignal at each level ldquo119894rdquoin its columndirection (spectral domain) Spectra are decom-posed into approximation coefficient119860
119894and detail coefficient
119863119894as shown in Figure 2 Irrelevant elements involved in the
signals are eliminated by a dyadic decimation which reducesthe original resolution into half of its length This proce-dure is recursively applied on approximation coefficients togive increasingly smoother versions of the original signalsWavelet transforms can preserve low frequency and highfrequency features through the explained multiresolutionanalysis Studies show that high frequency subband signalsare independent and low frequency subbands are weaklydependent [19] In this work only the local characteristicswere required to preserve for classification So independenthigh frequency subbands coefficients were considered in themultisignal wavelet reconstruction [9] Reverse process ofanalysis is adopted inwavelet synthesis or reconstruction [19]Wavelet decomposition involves filtering and downsamplingwhereas wavelet reconstruction involves upsampling andfiltering The decomposed spectral data is lengthened byinserting zeros between every two samples of the signal(upsampling) and inverse filtering is applied
Level of decomposition plays an important role in mul-tiresolution analysis Decomposing the spectra into toomanysmaller levels will result in subband signals with more localdetails in high pass components [19] making approximationcoefficients deviating a lot from original signals So thedecomposition level in this workwas restricted to the greatestinteger contained in log
2(119889) where ldquo119889rdquo is the dimension of
multispectral cube
23 Independent Component Analysis (ICA) ICA is a poten-tial and promising approach in structural and functionalMRI analysis [21] The main concept of this technique liesin unmixing a set of independent sources according to theirstatistical independency from a linearly mixed input signal[10] Let x be a column vector x = [119909
1 1199092 119909
119899]119879 where 119909
119894rsquos
are mixtures and s = [1199041 1199042 119904
119898]119879 be the sources Using
the vector-matrix notation the above mixing model can bewritten as
x = As (1)
where ldquoArdquo is the matrix with elements 119886119894119895 ldquoArdquo can be
estimated and its inverse ldquoWrdquo can be obtained to calculatethe independent components (ICs) by using
s =Wx (2)
Theoretically it tries to find a linear representation ofnongaussian data by the projection of observed data onthe rows of the matrix ldquoWrdquo (basis vectors) in which thetransformed components are statistically independent or asindependent as possible [10] The method for estimationof ldquoWrdquo is based on contrast (or objective) functions thatare calculated from some statistical properties of the dataThe minimization or maximization of these functions andthe relative adaptive change of the weights allow the finalestimation of ldquoWrdquo Several objective functions have beenproposed for the estimation of the projection matrix ldquoWrdquoThese functions are based on likelihood entropy mutualinformation or more frequently their approximations [1022]
In this work ldquoxrdquo is an 119871-dimensional pixel vector inthe input image cube which is linearly mixed by a set ofldquo119898rdquo statistically independent tissues or tumour information1199041 1199042 119904
119898 by means of a ldquo119871 times 119898rdquo mixing matrix ldquoArdquo as
in (1) FastICA algorithm [10] is applied on ldquoxrdquo to extractldquo119898rdquo unknown signal sources (tissues and lesions) from theimage cube It is considered as an over-complete problemsince 119871 lt 119898 that is there are fewer images than the sourcesto be unmixed According to linear system of equations thereexist many solutions to solve (1) and there is no way toselect best ICs to perform classification [21] If the numberof signal sources is greater than the number of ICs morethan one signal characteristics are accommodated in thesame IC Enhancing the inputmatrix by reconstructed signalsfrom detail coefficients in MW-ICA solves this issue to someextent
24 Fuzzy C-Means Clustering (FCM) It is a data clusteringtechnique introduced by Bezdec in 1981 [20] where each data
4 ISRN Biomedical Imaging
point belongs to a cluster to some degree that is specifiedby a fuzzy membership grade [23] Let X = (119909
1 1199092 119909
119873)
denotes an image with 119873 pixels to be partitioned into 119888clusters where 119909
119894represents multispectral (features) data and
ldquo119888rdquo is the number of clusters with 2 le 119888 lt 119899 The standardFCMobjective function for partitioning a dataset 119909
119896119873
119896=1into
ldquo119888rdquo clusters is given by [24]
119869119898=
119888
sum
119894=1
119873
sum
119896=1
119880119898
119894119896
1003817100381710038171003817119909119896minus V119894
1003817100381710038171003817
2 (3)
where V119894119888
119894=1are the centers of the clusters and the array
119880119894119896 119894 = 1 119888 119896 = 1 119873 is a partition matrix such
that
119880 isin 119880119894119896isin [0 1] |
119888
sum
119894=1
119880119894119896= 1 forall119896 0 lt
119873
sum
119896=1
119880119894119896lt 119873 forall119894
(4)
The parameter ldquo119898rdquo is a weighting exponent on eachfuzzy membership and it determines fuzziness amount ofthe resulting classification Gray level values are the mostcommonly used feature in image processing So FCM objec-tive function 119869
119898is minimized when high membership values
are assigned to pixels whose intensities are close to thecentroid of its particular class and low membership valuesare assigned when the point is far from the centroid [24]In the FCM algorithm the probability that a pixel belongsto a specific cluster depends only on the distance betweenthe pixel and each individual cluster center in the featuredomain Algorithm starts with an initial guess for each clustercentre and it converges to a solution for V
119894representing the
local minimum or a saddle point of the objective function119869119898 A detailed explanation of FCM theorem and algorithm
is available in [25]
25 Proposed Algorithm MW-ICA for Classification Wa-velet decomposition of the spectra and ICA are the coreconcepts used in this algorithm Major steps involved in thismethod are depicted in Figure 3 Co-registered correspond-ing images from different MRI sequences are used to form amultispectral suite Each pixel vector represents the spectralsignature of the area specified by that pixel Consider inputmultispectral image as a collection of spectral signaturesrepresented by ray passing through the pixel vector as shownin Figure 3 Apply 1-D multisignal wavelet decomposition tothese signals to divide the spectral domain into low frequencyand high frequency components as described in Section 22To retain the importance of the small features only the detailcoefficients are considered in wavelet reconstruction
The reconstructed signals are combined with input mul-tisignals and ICA using FASTICA [10] algorithm is appliedon newly formed dataset FCM clustering algorithm isapplied on each generated IC to classify the brain mattersautomatically The classified results are labeled by an expe-rienced radiologist for analysis of normal and abnormal
brain tissues The proposed algorithm can be summarized asfollows
Input MRI Images 1198681 1198682 1198683 1198684 and so forth representing
co-registered T1WI T2WI PDI FLAIR and so forth
Step 1 Create 119901-dimensional multispectral image cube119872 =
[1198681 1198682 1198683 1198684 119868
119901] from ldquo119901rdquo input images
Step 2 Reshape each image into its 1-D form and generate a119901-dimensional multisignal X
Step 3 Applymultisignal wavelet analysis onX to decomposethe signals into approximation coefficients and detail coeffi-cients
Step 4 Apply multisignal wavelet reconstruction algorithmon detail coefficients to obtain reconstructed signal Xlowast
Step 5 Expand X by appending Xlowast and form new inputmultisignal Xnew of dimension ldquo119899rdquo le 2119901
Step 6 Apply ICA on Xnew to generate ldquo119899rdquo unmixed compo-nents
Step 7 Reshape each component to corresponding 2D formand apply FCM algorithm
Step 8 Segmented results from Step 7 are classified intodifferent brain tissues for further analysis
26 Performance Measures Tanimoto Index sensitivityspecificity accuracy False Positive Rate (FPR) and error ratewere the measures used in quantitative analysis in this studyTanimoto Index the most commonly used measurement inmedical imaging [14] can be measured by comparing thereproduced tissues with ground truth using the formula
119879 =
|119860 cap 119861|
|119860 cup 119861|
(5)
where 119860 and 119861 are two datasets involved in the classificationcomparison Similarity checking of brain tissues CSF GMWM and tumor with corresponding ground truth wasperformed in this work using (5) Sensitivity specificityaccuracy error rate and False Positive Rate (FPR) werecalculated from confusion matrix [26] as follows
Sensitivity = (TP(TP + FN)) lowast 100Specificity = (TN(TN + FP)) lowast 100Accuracy = ((TP+TN)(TP+TN+FP+FN))lowast100FPR = FP(TN + FP) lowast 100Error Rate = (1 minus Accuracy) lowast 100
True Positive (TP) represents the number of correctlyidentified positive pixels (for example tumor) whereas FalsePositive (FP) gives the count of negative pixels (for examplenormal tissues) incorrectly identified as positive (tumor)Correctly identified negative pixels are measured as True
ISRN Biomedical Imaging 5
Independent Component
Multisignal wavelet
Inverse wavelet
Fuzzy C-Means
Multispectral images
1D multisignals
Normal and abnormal brain tissues
Detail coefficients
Unmixed results
decomposition
transform
clustering
Analysis
Figure 3 Proposed MW-ICA based classification
Negative (TN) and positive pixels incorrectly identified asnegative tissues are counted as False Negative (FN) Sensitiv-ity represents the proportion of actual positives (here tissueslike GM WM etc) correctly classified and specificity is theproportion of negatives (here other tissues and background)correctly identified
We used an additional method Bland-Altman analysis[27] to evaluate the agreement between measures from twomethods In the Bland-Altman plots difference between twomeasurements (the bias) is plotted against the average ofthose measurements In this work the reproduced lesionvolumes by ICA andMW-ICA were quantitatively comparedwith lesion volumes by the groundtruth using this method
3 Experiments and Results
The complete system for algorithm implementation andevaluation was done in Matlab 7 running on Windows 7The proposed method was evaluated by both synthetic andclinical MRI images described in Section 21 Co-registeredimages were selected for wavelet decomposition and ICANo image registration was required in the case of syntheticimages but Matlab based simple resizing and rotation wasapplied on clinical images to generate co-registered dataMultisignal 1-D wavelet analysis was applied on input signalsusing Matlab Wavelet Toolbox Wavelets from Daubechies[28] family were selected for detailed performance variationstudy for different wavelets FCM method provided in FuzzyLogic Toolbox was applied on generated ICs to do automaticsegmentation Feature extraction and classification by FCMwere themain steps in this study Quantitative and qualitativeanalyses were performed using reproduced results fromsynthetic and real data These experiments were repeated forconventional ICA based FCMalso After that we conducted acomparative study of two methods in the same environment
The observed results are presented and they are discussed inthe following sections
31 Synthetic Image Analysis Multiple sclerosis (MS) dataobtained from the BrainWeb Simulated Brain Database wasincluded in synthetic MR image analysis 20 multispectralimage sets were formed from axial T1-weighted images(T1WI) T2-weighted images (T2WI) and Proton DensityImages (PDI) with specifications described in Section 21Figure 4(a) shows images of slice no 105 for differentsequences T1WI shows WM and GM components T2WIgives details of CSF and White Matter lesions (WML) andPD images show abnormal features Reconstructed imagesfrom multisignal wavelet analysis are given in Figure 4(b)Results from MW-ICA and ICA are shown in Figures 4(c)and 4(d) respectively As described in Steps 5 and 6 of theproposed method total six ICs were generated from MW-ICA using Db12 wavelet Relevant four of them are shown inFigure 4(c) Details of the brain features provided by MW-ICA (Figure 4(c)) were found to be very specific in providingbrain matter details from each component showing CSFWMWML and GM features clearly in 1st 2nd 3rd and 4thICs respectively However it was observed from conventionalICA results (Figure 4(d)) that features of CSF andWMLwereaccumulated in 1st IC whereas proposed method clusteredCSF and WML into different classes Presence of WMLlocations inWM (Figure 4(d) 3rd IC) was not so clear in ICAresults
We analyzed the effect of these feature analysis methodsin FCM clustering for a given degree of membership 06and reproduced tissues are presented in Figure 5 Figure 5(a)shows MW-ICA based FCM results and ICA based FCMresults are shown in Figure 5(b) Each column represents aparticular brain tissue in the order of CSF GM WM andWML from left to rightThe best results by proposedmethod
6 ISRN Biomedical Imaging
(a)
(b)
(c)
(d)
Figure 4 ICA and MW-ICA results from synthetic image analysis(a) Synthetic Images T1WI T2WI and PDI from left to right(b) Reconstructed images from detail coefficients (c) Independentcomponents from proposed method (d) Conventional ICA results
were observed for small lesions and WM The presenceof abnormality in WM is clearly visible in Figure 5(a) 3rdcolumn MW-ICA based classification results gave moreinformation on lesion details (Figure 5(a)) than those fromICA based processing (Figure 5(b)) GM tissues (2nd col-umn) were found to be more specific in MW-ICA resultsbut traces of negative pixels were also found in the classifiedresults
To evaluate the improvement in MW-ICA based classi-fication a detailed quantitative analysis was performed with15 synthetic multispectral sets Average sensitivity specificityaccuracy False Positive Rate (FPR) error rate (all in )and Tanimoto Index (TI) values were measured for FCMclassifications based on ICA and MW-ICA for membershipdegree 08 Observed results are summarized in Table 1Experimental reports demonstrated the efficiency of theproposed method by yielding comparatively better resultsfor all tissues A drastic increase in Tanimoto Index andsensitivity observed in the case of WM lesions showing 093against 082 for TI and sensitivity increased from 8588 to9323 From visual and quantitative results it was observed
(a)
(b)
Figure 5 FCM Classification results in the order of CSF GM WMandWML from left to right (a) Results fromMW-ICA (b) Resultsfrom ICA
that MW-ICA could improve the reproducibility of localfeatures like small lesions in classification To confirm theefficiency and consistency of the proposed algorithm fordifferent wavelets db2 db4 db8 db12 db16 db24 and db32were also considered in quantitative analysis TI values anderror rate observed for GM WM and WML were plotted asshown in Figures 6(a) and 6(b) respectively 119883-axis showsDaubechies wavelets of different orders ldquo119873rdquo [28] FromFigure 6(a) Db4 is the best for WM and Db12 shows thenext best value For GM and lesion extraction Db12 exceedsDb4 Difference in error rate on variation of wavelet orders isavailable from Figure 6(b) For lesions least error rate valuewas observed for Db12 However Db4 showed the best valuesfor GM andWM
To interpret the performance improvement by MW-ICAover ICA statistically Bland-Altman analysis was performedon 20 synthetic multispectral sets The differences betweenlesion volumes (in mL) estimated from ICA based resultsand the groundtruth were first plotted against the averagesof bothmeasures (Figure 7(a))The agreement betweenMW-ICAand the groundtruthwas plotted as shown in Figure 7(b)The mean difference (bias or 119889) standard deviation (SD) ofthe differences and 95 limits of agreement (plusmn196 SD) werealso calculated Using ICA 119889 was 024mL with 95 limitsof agreement minus011mL to 058mL (Figure 7(a)) whereas thepoints were distributed closer to zero for MW-ICA Meanbias was observed as 005mL with 95 limits of agreementminus005mL to 016mL (Figure 7(b))
Visual and quantitative analyses by synthetic imagessupported the positive impact of MW-ICA in brain tissueclassification with relatively good normal and abnormalreproduced tissues In order to evaluate the efficiency of theproposed method in clinical analysis abnormal data from 28patients were selected and experimental results are discussedin the next section
32 Clinical Image Analysis The same sets of experimentsexplained in previous section were repeated for abnormal
ISRN Biomedical Imaging 7
0 5 10 15 20 25 30 3565
70
75
80
85
90
95Ta
nim
oto
Inde
x
LesionWMGM
Wavelets (dbN)
(a)
0 5 10 15 20 25 30 350
1
2
3
4
5
6
7
Erro
r rat
e
LesionWMGM
Wavelets (dbN)
(b)
Figure 6 Performance measure variations for Daubechies wavelets with different orders ldquo119873rdquo (a) Tanimoto Index (b) Error rate
1 15 2 25 3minus02
minus01
0
01
02
03
04
05
06
07
08
Average lesion volume from groundtruth and ICA (mL)
Diff
eren
ce in
lesio
n vo
lum
e (m
L)
Mean +196lowastSD
Mean minus196lowastSD
(a)
1 15 2 25 3minus01
0
005
01
015
02
025
03
Average lesion volume from groundtruth and MW-ICA (mL)
Diff
eren
ce in
lesio
n vo
lum
e (m
L)
minus005
Mean +196lowastSD
Mean minus196lowastSD
(b)
Figure 7 Bland-Altman plots showing the statistical agreement between lesion volumes obtained from groundtruth and (a) ICA basedclassification (b) MW-ICA based classification The dotted lines represent the mean and 95 limits of agreement
data to verify the clinical performance of the proposedmethod Three bands in multispectral image were formedfrom axial T1WI T2WI and FLAIR images with parametersand specification as discussed in Section 21 Total 28 times 3multispectral sets were resulted by selecting three differentabnormal slices for each case Figure 8(a) shows sampleinput images T1WI T2WI and FLAIR selected for visualanalysis WM details are available from T1WI T2WI showsCSF and abnormal points FLAIR images give informationon abnormal tissues No detailed information on GM wasavailable from these images ICA based FCMwas first applied
on this dataset Classified results with degree of membership09 are shown in Figure 8(b) We repeated MW-ICA basedFCM on the same dataset using Db12 wavelet Reproducedtissues CSF WM and abnormality are shown in Figure 8(c)from left to right Column wise comparison of Figures 8(b)and 8(c) can give a detailed picture of the improvement intissue classification by proposed method CSF details from1st column of Figure 8(b) is found to be more than thatfrom Figure 8(c) But ICA results in Figure 8(b) failed to givespecific details of abnormality in the 2nd and 3rd columnsVisual results demonstrated the efficiency of MW-ICA in
8 ISRN Biomedical Imaging
(a)
(b)
(c)
Figure 8 FCM Classification results in the order of CSF WM andWML from left to right (a) Clinical input images T1WI T2WI andFLAIR from left to right (b) ICA based results (c) MW-ICA basedresults
small feature analysis with highly specific WM and abnor-mal reproduced tissues Results from Figure 8(c) show thatabnormalities extracted by proposedmethod are very similarto those available from FLAIR image Its presence in WMis also located correctly by proposed method To ensure theefficiency of the newmethod in clinical analysis an elaboratestudy was performed with quantitative measurements likethe sensitivity specificity accuracy error rate (all in ) andTanimoto Index values Average measures from classificationof 84 multispectral slice sets along with standard deviationvalues (std) are summarized in Table 2
Table 2 results describe MW-ICA as a better approachcompared to ICA in brain tissue analysis Proposed methodgave very good results for all tissue except CSF ICA per-formed better in classification of CSF with average TI value066 plusmn 009 against 061 plusmn 001 but it shows large standarddeviations for sensitivity and Tanimoto measures In thecase of small abnormality analysis Tanimoto value improvedfrom 0792 plusmn 012 to 090 plusmn 007 Almost the same amountof improvement was observed in the case of WM analysisalso Consistency of the new method was confirmed by thereduction in standard deviations observed for almost allmeasures
Average results from three multispectral slice sets of asingle patient measured by ICA based classification andMW-ICA based analysis were used to study the variation inFalse Positive Rate Estimated results from 28 patients withstandard deviations are shown as error bars in Figure 9 for
CSF WM Lesion0
2
4
6
8
10
12
Brain matters
False
Pos
itive
Rat
e
MWICA + FCMICA + FCM
Figure 9 FPR comparison of segmented tissues usingMW-ICAandICA
CSFWM and abnormality CSF classification fromMW-ICAand ICA showed almost the same resultsHowever in the caseofWM and abnormality analysis comparatively lower valueswere observed for MW-ICA based analysis The significantreduction in FPR observed for MW-ICA based classificationin the case of abnormal tissues is a promising result in clinicalanalysis
4 Discussion
In this work we have proposed a new method MultisignalWavelet Independent Component Analysis (MW-ICA) forimproved feature extraction and brain tissue classificationfrom multispectral MRI ICA is a good preprocessing stepin multispectral classification It separates the mixed inputsignals into statistically independent components (ICs) fromwhich an improved brain tissue classification can be per-formed inMRI analysis [14] However it ignores small detailswhile processing massive amount of information As anattempt to resolve this issue high frequency components(detail coefficients) from multisignal wavelet analysis wereconsidered in this work in conjunction with input multisig-nals The algorithm was validated by both synthetic and realimages It was implemented as an automated technique inwhich the ICs were derived automatically from co-registeredimages Parameters like wavelet type and degree of member-ship were set as fixed in the initial settings The new methodsucceeded in unmixing each brain tissue into separate ICsfrom which a reliable automatic segmentation using FCMwas performed without any indexing In comparison withICs from widely used ICA method (Figure 4(d)) MW-ICA provides more tissue specific components (Figure 4(c))Lesion detection from ICA results was not very easy sinceCSF and lesion details were accumulated in first component
ISRN Biomedical Imaging 9
Table 1 Quantitative analysis of synthetic images
Feature analysis Sensitivity FPR Specificity Accuracy TI
CSF ICA 8418 076 9924 9718 075MW-ICA 8819 039 9961 9849 078
WM ICA 9953 199 9801 9831 090MW-ICA 9960 208 9692 9744 093
WML ICA 8588 007 9991 9961 082MW-ICA 9323 009 9991 9980 093
GM ICA 9528 513 9487 9492 082MW-ICA 9890 298 9703 9694 088
Table 2 Quantitative analysis of clinical images
Feature analysis Sensitivity (plusmnstd) Specificity (plusmnstd) Accuracy (plusmnstd) TI (plusmnstd)
CSF ICA 6628 (934) 9999 (002) 9521 (242) 066 (009)MW-ICA 6735 (547) 9852 (140) 9476 (281) 061 (001)
WM ICA 8550 (820) 9408 (436) 9237 (226) 070 (005)MW-ICA 8895 (714) 9483 (128) 9360 (218) 081 (001)
WML ICA 8490 (502) 9757 (222) 9731 (218) 072 (012)MW-ICA 9199 (388) 9888 (140) 9869 (138) 090 (007)
(Figure 4(d)) ICA results failed to locate the presence oflesions in WM (Figure 4(d) last column) because of back-ground dominating effects from global features
The reproduced tissues fromproposedmethodwere eval-uated qualitatively and quantitatively against groundtruthimages and ICA based results Classified brain tissues fromsynthetic images especially WM and WML were foundto be yielding more information with improved quality(Figure 5(a)) compared to ICA based results (Figure 5(b)) Itis further emphasized by the visual results from clinical casealso (Figure 7) Performance measures like TI sensitivityspecificity accuracy and so forth discussed in Section 26demonstrated the potential of MW-ICA based FCM inclassification of global and local features with relatively bettervalues compared to ICA based classification (Table 1) Tani-moto Indexsensitivity values 0939323 observed against0828588 for synthetic caseWMlesion analysis confirmedthe improvement in small object detection by MW-ICAImproved sensitivity and accuracy values observed for alltissues demonstrated the efficiency and robustness of the newalgorithm in clinical trials (Table 2) Increased average TIvalue from 072 to 090 and reduced FPR (Figure 9) supportthe effectiveness of the method in small abnormality anal-ysis Considerable reduction in standard deviation (Table 2and Figure 9) implies the consistency of MW-ICA basedclassification in clinical analysis Statistical interpretationof agreement between estimated synthetic lesion volumesby groundtruth and classifications using MW-ICA (andICA) was performed with Bland-Altman analysis A closeragreement with segmented brain volumes from groundtruthandMW-ICA supports the newmethod as a better approachcompared to ICA Bias was contained well within the twostandard deviations except for one sample (Figure 7(b))Improvement in MW-ICA over ICA was further confirmed
by the reduced mean bias (which is closer to zero) andshortened limits of agreement
Variation in quantitative measures TI and error ratefor different wavelets implied that wavelet selection has animportant role in quality of the results (Figure 6) Consider-ing the cost of feature extraction MW-ICA was observed totake more time We measured 045 seconds for ICA and 143seconds forMW-ICA in a typical clinical imaging analysis ona Windows 7 PC with Pentium Dual CPU of 20GHz2GBRAM It can be varied on different values of parameters likewavelet type degree of decomposition number of bands ininput signals and so forth which is to be explored in futureworks The common MR image artefacts like gaussian noiseillumination effects and so forth were not considered in thiswork
Experimental results support MW-ICA as a promisingapproach in classification of brain matters especially inthe case of small abnormalities Technically novelty of thealgorithm lies in exploiting the characteristics of the waveletsin extracting the local features and combining the resultswith input multisignal for improved segmentation and clas-sification Experimental results demonstrated it in clinicalanalysis of brain matters especially in locating small lesionsand their effect on other brain tissues A detailed analysis ofthe proposed method using optimal parameter selection andsupervised methods is under consideration as a future work
5 Conclusion
We presented a new Multisignal Wavelet ICA (MW-ICA)based classification to improve the performance of automatedmultispectral MRI analysis FCM clustering was used toinvestigate and evaluate the positive effect of the method in
10 ISRN Biomedical Imaging
brain tissue analysis Experimental results using synthetic andclinical data confirmed the efficiency and reproducibility ofthe proposed method in small abnormality analysis Com-parative analysis with ICA based classifications recommendsthatMW-ICA can be a good choice for automatic brain tissueclassification in clinical analysis Supervised classificationusingMW-ICA in noisy environments is under considerationas a future work
Acknowledgment
The authors sincerely thank the Institute of Radiology andImaging Sciences (IRIS) Pvt Ltd Kochi for supporting themwith the required medical guidance in this work
References
[1] M W Vannier R L Butterfield and D Jordan ldquoMultispectralanalysis of magnetic resonance imagesrdquo Radiology vol 154 no1 pp 221ndash224 1985
[2] L P Clarke R P Velthuizen M A Camacho et al ldquoMRIsegmentation methods and applicationsrdquo Magnetic ResonanceImaging vol 13 no 3 pp 343ndash368 1995
[3] Y Kvinnsland N Brekke T M Taxt and R Gruner ldquoMulti-spectral analysis of multimodal imagesrdquo Acta Oncologica vol48 no 2 pp 277ndash284 2009
[4] H Arimura T Magome Y Yamashita and D YamamotoldquoComputer-aided diagnosis systems for brain diseases in mag-netic resonance imagesrdquo Algorithms vol 2 no 3 pp 925ndash9522009
[5] C Valdes Hernandez Mdel P J Gallacher M E Bastin etal ldquoAutomatic segmentation of brain white matter and whitematter lesions in normal aging comparison of fivemultispectraltechniquesrdquo Magnetic Resonance Imaging vol 30 no 2 pp222ndash229 2012
[6] A Akselrod-Ballin M Galun J M Gomori et al ldquoAutomaticsegmentation and classification of multiple sclerosis in multi-channel MRIrdquo IEEE Transactions on Bio-Medical Engineeringvol 56 no 10 pp 2461ndash2469 2009
[7] R He S Datta B R Sajja and P A Narayana ldquoGeneralizedfuzzy clustering for segmentation of multi-spectral magneticresonance imagesrdquo Computerized Medical Imaging and Graph-ics vol 32 no 5 pp 353ndash366 2008
[8] C M Bishop Pattern Recognition and Machine LearningSpringer 2006
[9] S Mallat A Wavelet Tour of Signal Processing The Sparse WayAcademic Press 3rd edition 2008
[10] A Hyvarinen J Karhunen and E Oja Independent ComponentAnalysis John Wiley amp Sons New York NY USA 2001
[11] S Ozer D L Langer X Liu et al ldquoSupervised and unsupervisedmethods for prostate cancer segmentation with multispectralMRIrdquoMedical Physics vol 37 no 4 pp 1873ndash1883 2010
[12] V N Vapnik Statistical Learning Theory John Wiley amp SonsNew York NY USA 1998
[13] T Tateyama Z Nakao and Y W Chen ldquoClassification of brainmatters in MRI by Kernel Independent Component Analysisrdquoin Proceedings of the 4th International Conference on IntelligentInformation Hiding and Multiedia Signal Processing (IIH-MSPrsquo08) pp 713ndash716 August 2008
[14] J W Chai C C C Chen C M Chiang et al ldquoQuantitativeanalysis in clinical applications of brainMRI using independentcomponent analysis coupled with support vector machinerdquoJournal of Magnetic Resonance Imaging vol 32 no 1 pp 24ndash342010
[15] Y C Ouyang H M Chen J W Chai et al ldquoBand expansion-based over-complete independent component analysis for mul-tispectral processing of magnetic resonance imagesrdquo IEEETransactions on Biomedical Engineering vol 55 no 6 pp 1666ndash1677 2008
[16] H Han and X L Li ldquoMulti-resolution independent compo-nent analysis for high-performance tumor classification andbiomarker discoveryrdquo BMC Bioinformatics vol 12 no 1 articleS7 2011
[17] J Karhunen S Malaroiu and M Ilmoniemi ldquoLocal inde-pendent component analysis using clusteringrdquo InternationalJournal of Neural Systems vol 10 no 6 pp 439ndash451 2000
[18] J Walters-Williams and Y Li ldquoPerformance comparison ofknown ICA algorithms to a wavelet-ICA mergerrdquo Signal Pro-cessing vol 5 no 3 pp 80ndash92 2011
[19] S Kaewpijit J LMoigne andT El-Ghazawi ldquoAutomatic reduc-tion of hyperspectral imagery using wavelet spectral analysisrdquoIEEE Transactions on Geoscience and Remote Sensing vol 41no 4 pp 863ndash871 2003
[20] J C Bezdec Pattern Recognition with Fuzzy Objective FunctionAlgorithms Plenum Press New York NY USA 1981
[21] Y Ouyang H Chen J Chai et al ldquoIndependent componentanalysis for magnetic resonance image analysisrdquo EURASIPJournal on Advances in Signal Processing vol 2008 Article ID780656 2008
[22] J F Cardoso ldquoInfomax and maximum likelihood for blindsource separationrdquo IEEE Signal Processing Letters vol 4 no 4pp 112ndash114 1997
[23] X F Yang and B W Fei ldquoA multiscale and multiblock fuzzyC-means classification method for brain MR imagesrdquo MedicalPhysics vol 38 no 6 pp 2879ndash2891 2011
[24] D Zhang and C Chen ldquoA novel kernelized fuzzy c-meansalgorithm with application in medical image segmentationrdquoArtificial Intelligence in Medicine vol 32 pp 37ndash50 2004
[25] A O Boudraa S M R Dehak Y M Zhu C Pachai Y G Baoand J Grimaud ldquoAutomated segmentation of multiple sclerosislesions in multispectral MR imaging using fuzzy clusteringrdquoComputers in Biology and Medicine vol 30 no 1 pp 23ndash402000
[26] J Han and M Kamber Data Mining Concepts and TechniquesMorgan Kaufmann Publisher San Fransisco Calif USA 2ndedition 2006
[27] J M Bland and D G Altman ldquoStatistical methods for assessingagreement between two methods of clinical measurementrdquoLancet vol 1 pp 307ndash310 1986
[28] IDaubechiesTenLectures onWavelets SIAMPhiladelphia PaUSA 1992
International Journal of
AerospaceEngineeringHindawi Publishing Corporationhttpwwwhindawicom Volume 2014
RoboticsJournal of
Hindawi Publishing Corporationhttpwwwhindawicom Volume 2014
Hindawi Publishing Corporationhttpwwwhindawicom Volume 2014
Active and Passive Electronic Components
Control Scienceand Engineering
Journal of
Hindawi Publishing Corporationhttpwwwhindawicom Volume 2014
International Journal of
RotatingMachinery
Hindawi Publishing Corporationhttpwwwhindawicom Volume 2014
Hindawi Publishing Corporation httpwwwhindawicom
Journal ofEngineeringVolume 2014
Submit your manuscripts athttpwwwhindawicom
VLSI Design
Hindawi Publishing Corporationhttpwwwhindawicom Volume 2014
Hindawi Publishing Corporationhttpwwwhindawicom Volume 2014
Shock and Vibration
Hindawi Publishing Corporationhttpwwwhindawicom Volume 2014
Civil EngineeringAdvances in
Acoustics and VibrationAdvances in
Hindawi Publishing Corporationhttpwwwhindawicom Volume 2014
Hindawi Publishing Corporationhttpwwwhindawicom Volume 2014
Electrical and Computer Engineering
Journal of
Advances inOptoElectronics
Hindawi Publishing Corporation httpwwwhindawicom
Volume 2014
The Scientific World JournalHindawi Publishing Corporation httpwwwhindawicom Volume 2014
SensorsJournal of
Hindawi Publishing Corporationhttpwwwhindawicom Volume 2014
Modelling amp Simulation in EngineeringHindawi Publishing Corporation httpwwwhindawicom Volume 2014
Hindawi Publishing Corporationhttpwwwhindawicom Volume 2014
Chemical EngineeringInternational Journal of Antennas and
Propagation
International Journal of
Hindawi Publishing Corporationhttpwwwhindawicom Volume 2014
Hindawi Publishing Corporationhttpwwwhindawicom Volume 2014
Navigation and Observation
International Journal of
Hindawi Publishing Corporationhttpwwwhindawicom Volume 2014
DistributedSensor Networks
International Journal of
2 ISRN Biomedical Imaging
Input MR Images
Preprocessing and
Feature extraction and
Training and
Multispectral image
Output classes
Feature sets
T1WIT2WI
PDIFLAIR
band selection
feature selection
classification
Figure 1 Typical multispectral analysis
[8] wavelets [9] and Independent Component Analysis(ICA) [10] are the common feature extraction techniques insupervised and unsupervised multispectral classifications [811] Unsupervised classifications like k-means clustering [8]Fuzzy-C-Means (FCM) clustering [7] and self-organizingmaps [8] were found to be yielding good results in automatedsegmentation and classification Artificial Neural Networks(ANN) [2 8] Support Vector Machines (SVM) [12] andensemble methods have contributed a lot in clinically trainedmodel preparation for pathological tissue analysis
This work focuses on improvement in automated multi-spectral brain MRI classification through enhanced featureanalysis Recent brain MRI studies using ICA [13 14] andits extensions like kernel ICA [13] overcomplete ICA [15]and so forth have demonstrated ICA as a good featureextraction method for normal and abnormal tissue analysisAs a global transform ICA gives more priority to globalfeatures thereby losing important information on local brainmatters in classification [16] Dependency of the input MRIimages also adversely affects the ICA based classificationresults Local ICA [17] and Wavelet based ICA extensions[16 18 19] have been introduced as a solution for these short-comings However the selection of decomposition levels andreconstruction errors on spatial wavelet analysis were foundto influence the accuracy and reliability of the reproducedresults in clinical analysis
An improved source separation method MultisignalWavelet Independent Component Analysis (MW-ICA) isproposed in this work for efficient automated brain tissue
analysis from multispectral MRI First local characteristicsfrom brainMRI images were extracted bymultisignal waveletanalysis High frequency components (detail coefficients) aremutually independent while low frequency components areweakly dependent [19] So detail coefficients were consideredin this work for wavelet reconstruction to retain the mutu-ally independent local details Reconstructed signals wereappended to original input signals to form an enhanced inputsignal set for ICA FCM [7 20] was then applied to resultsfrom ICA to do segmentation and classification Visual andquantitative analyses using synthetic and clinical data wereperformed to evaluate the improvement in tissue classifica-tion by MW-ICA over conventional ICA The variations inreproducibility of the newmethod for different wavelets werealso considered in this study Observed results demonstratedthe reproducibility and efficiency of the proposed method inlocal and global brain matter classification
The rest of the paper is organized as followsMaterials andmethods are explained in Section 2 Experiments and resultsare presented in Section 3 Several aspects of our work arediscussed in Section 4 Section 5 concludes the paper
2 Materials and Methods
21 Input Data Both synthetic and clinical images wereconsidered in the evaluation of the proposed systemThe syn-thetic MR images were collected from BrainWeb SimulatedBrainDatabase at theMcConnell Brain ImagingCentre of theMontreal Neurological Institute (MNI) McGill University(httpwwwbicmnimcgillcabrainweb) We selected 20slices (slices nos 90ndash109) of abnormal data set containingmultiple sclerosis (MS) details to form the multispectralsuite Axial T1-weighted images (T1WI) T2-weighted images(T2WI) and Proton Density Images (PDI) with parametersettings 1mm slice thickness intensity nonuniformity 20and noise level 0 were included in the set
Axial T1WI T2WI and FLAIR images from 28 abnormalcases were considered for clinical image analysis Threesample slices from each sequence showing traces of abnormaltissues were selected for each case and total 28 times 3multispec-tral image cubes were included in the analysis The brain MRimages were acquired by axial spin echo T1WIwith repetitiontime (TR) = 1600ms echo time (TE) = 89ms and T2WIwith TRTE = 4000ms95ms FLAIR images have TRTE =6000ms94ms inversion time (TI) = 20265ms Additionalparameters were slice gap 65mm thickness 5mm and thesize 227times 260 pixelsThe ground truth tissues in clinical caseswere collected frommanually segmented and labeled imagesunder the supervision of an experienced radiologist
22 Wavelet Analysis and Synthesis In this work imagesfrom each band in the multispectral cube were reshapedinto a 1D signal and a collection of those signals form MRImultisignal [19] were stored as a matrix organized rowwise(or columnwise) Wavelet transform of a signal is calculatedby projection of the signal onto shifted and scaled versionof a basic function [9] In the case of higher dimensionalsignals it can be done in spatial or spectral direction Mallatrsquos
ISRN Biomedical Imaging 3
High pass filter
Low pass
High pass filter
Low pass filter
1D multisignal
Dyadic decimation
filter
2 darr
2 darr
2 darr
2 darr
1198601
1198602
1198632
1198631
Figure 2 Multisignal wavelet analysis of multispectral data
multiresolution algorithm [9] for 1-D signal was extendedto multidimensional signals as shown in Figure 2 to domultisignal wavelet analysis in this work
A low pass filter and its corresponding high pass filter aresimultaneously applied on input multisignal at each level ldquo119894rdquoin its columndirection (spectral domain) Spectra are decom-posed into approximation coefficient119860
119894and detail coefficient
119863119894as shown in Figure 2 Irrelevant elements involved in the
signals are eliminated by a dyadic decimation which reducesthe original resolution into half of its length This proce-dure is recursively applied on approximation coefficients togive increasingly smoother versions of the original signalsWavelet transforms can preserve low frequency and highfrequency features through the explained multiresolutionanalysis Studies show that high frequency subband signalsare independent and low frequency subbands are weaklydependent [19] In this work only the local characteristicswere required to preserve for classification So independenthigh frequency subbands coefficients were considered in themultisignal wavelet reconstruction [9] Reverse process ofanalysis is adopted inwavelet synthesis or reconstruction [19]Wavelet decomposition involves filtering and downsamplingwhereas wavelet reconstruction involves upsampling andfiltering The decomposed spectral data is lengthened byinserting zeros between every two samples of the signal(upsampling) and inverse filtering is applied
Level of decomposition plays an important role in mul-tiresolution analysis Decomposing the spectra into toomanysmaller levels will result in subband signals with more localdetails in high pass components [19] making approximationcoefficients deviating a lot from original signals So thedecomposition level in this workwas restricted to the greatestinteger contained in log
2(119889) where ldquo119889rdquo is the dimension of
multispectral cube
23 Independent Component Analysis (ICA) ICA is a poten-tial and promising approach in structural and functionalMRI analysis [21] The main concept of this technique liesin unmixing a set of independent sources according to theirstatistical independency from a linearly mixed input signal[10] Let x be a column vector x = [119909
1 1199092 119909
119899]119879 where 119909
119894rsquos
are mixtures and s = [1199041 1199042 119904
119898]119879 be the sources Using
the vector-matrix notation the above mixing model can bewritten as
x = As (1)
where ldquoArdquo is the matrix with elements 119886119894119895 ldquoArdquo can be
estimated and its inverse ldquoWrdquo can be obtained to calculatethe independent components (ICs) by using
s =Wx (2)
Theoretically it tries to find a linear representation ofnongaussian data by the projection of observed data onthe rows of the matrix ldquoWrdquo (basis vectors) in which thetransformed components are statistically independent or asindependent as possible [10] The method for estimationof ldquoWrdquo is based on contrast (or objective) functions thatare calculated from some statistical properties of the dataThe minimization or maximization of these functions andthe relative adaptive change of the weights allow the finalestimation of ldquoWrdquo Several objective functions have beenproposed for the estimation of the projection matrix ldquoWrdquoThese functions are based on likelihood entropy mutualinformation or more frequently their approximations [1022]
In this work ldquoxrdquo is an 119871-dimensional pixel vector inthe input image cube which is linearly mixed by a set ofldquo119898rdquo statistically independent tissues or tumour information1199041 1199042 119904
119898 by means of a ldquo119871 times 119898rdquo mixing matrix ldquoArdquo as
in (1) FastICA algorithm [10] is applied on ldquoxrdquo to extractldquo119898rdquo unknown signal sources (tissues and lesions) from theimage cube It is considered as an over-complete problemsince 119871 lt 119898 that is there are fewer images than the sourcesto be unmixed According to linear system of equations thereexist many solutions to solve (1) and there is no way toselect best ICs to perform classification [21] If the numberof signal sources is greater than the number of ICs morethan one signal characteristics are accommodated in thesame IC Enhancing the inputmatrix by reconstructed signalsfrom detail coefficients in MW-ICA solves this issue to someextent
24 Fuzzy C-Means Clustering (FCM) It is a data clusteringtechnique introduced by Bezdec in 1981 [20] where each data
4 ISRN Biomedical Imaging
point belongs to a cluster to some degree that is specifiedby a fuzzy membership grade [23] Let X = (119909
1 1199092 119909
119873)
denotes an image with 119873 pixels to be partitioned into 119888clusters where 119909
119894represents multispectral (features) data and
ldquo119888rdquo is the number of clusters with 2 le 119888 lt 119899 The standardFCMobjective function for partitioning a dataset 119909
119896119873
119896=1into
ldquo119888rdquo clusters is given by [24]
119869119898=
119888
sum
119894=1
119873
sum
119896=1
119880119898
119894119896
1003817100381710038171003817119909119896minus V119894
1003817100381710038171003817
2 (3)
where V119894119888
119894=1are the centers of the clusters and the array
119880119894119896 119894 = 1 119888 119896 = 1 119873 is a partition matrix such
that
119880 isin 119880119894119896isin [0 1] |
119888
sum
119894=1
119880119894119896= 1 forall119896 0 lt
119873
sum
119896=1
119880119894119896lt 119873 forall119894
(4)
The parameter ldquo119898rdquo is a weighting exponent on eachfuzzy membership and it determines fuzziness amount ofthe resulting classification Gray level values are the mostcommonly used feature in image processing So FCM objec-tive function 119869
119898is minimized when high membership values
are assigned to pixels whose intensities are close to thecentroid of its particular class and low membership valuesare assigned when the point is far from the centroid [24]In the FCM algorithm the probability that a pixel belongsto a specific cluster depends only on the distance betweenthe pixel and each individual cluster center in the featuredomain Algorithm starts with an initial guess for each clustercentre and it converges to a solution for V
119894representing the
local minimum or a saddle point of the objective function119869119898 A detailed explanation of FCM theorem and algorithm
is available in [25]
25 Proposed Algorithm MW-ICA for Classification Wa-velet decomposition of the spectra and ICA are the coreconcepts used in this algorithm Major steps involved in thismethod are depicted in Figure 3 Co-registered correspond-ing images from different MRI sequences are used to form amultispectral suite Each pixel vector represents the spectralsignature of the area specified by that pixel Consider inputmultispectral image as a collection of spectral signaturesrepresented by ray passing through the pixel vector as shownin Figure 3 Apply 1-D multisignal wavelet decomposition tothese signals to divide the spectral domain into low frequencyand high frequency components as described in Section 22To retain the importance of the small features only the detailcoefficients are considered in wavelet reconstruction
The reconstructed signals are combined with input mul-tisignals and ICA using FASTICA [10] algorithm is appliedon newly formed dataset FCM clustering algorithm isapplied on each generated IC to classify the brain mattersautomatically The classified results are labeled by an expe-rienced radiologist for analysis of normal and abnormal
brain tissues The proposed algorithm can be summarized asfollows
Input MRI Images 1198681 1198682 1198683 1198684 and so forth representing
co-registered T1WI T2WI PDI FLAIR and so forth
Step 1 Create 119901-dimensional multispectral image cube119872 =
[1198681 1198682 1198683 1198684 119868
119901] from ldquo119901rdquo input images
Step 2 Reshape each image into its 1-D form and generate a119901-dimensional multisignal X
Step 3 Applymultisignal wavelet analysis onX to decomposethe signals into approximation coefficients and detail coeffi-cients
Step 4 Apply multisignal wavelet reconstruction algorithmon detail coefficients to obtain reconstructed signal Xlowast
Step 5 Expand X by appending Xlowast and form new inputmultisignal Xnew of dimension ldquo119899rdquo le 2119901
Step 6 Apply ICA on Xnew to generate ldquo119899rdquo unmixed compo-nents
Step 7 Reshape each component to corresponding 2D formand apply FCM algorithm
Step 8 Segmented results from Step 7 are classified intodifferent brain tissues for further analysis
26 Performance Measures Tanimoto Index sensitivityspecificity accuracy False Positive Rate (FPR) and error ratewere the measures used in quantitative analysis in this studyTanimoto Index the most commonly used measurement inmedical imaging [14] can be measured by comparing thereproduced tissues with ground truth using the formula
119879 =
|119860 cap 119861|
|119860 cup 119861|
(5)
where 119860 and 119861 are two datasets involved in the classificationcomparison Similarity checking of brain tissues CSF GMWM and tumor with corresponding ground truth wasperformed in this work using (5) Sensitivity specificityaccuracy error rate and False Positive Rate (FPR) werecalculated from confusion matrix [26] as follows
Sensitivity = (TP(TP + FN)) lowast 100Specificity = (TN(TN + FP)) lowast 100Accuracy = ((TP+TN)(TP+TN+FP+FN))lowast100FPR = FP(TN + FP) lowast 100Error Rate = (1 minus Accuracy) lowast 100
True Positive (TP) represents the number of correctlyidentified positive pixels (for example tumor) whereas FalsePositive (FP) gives the count of negative pixels (for examplenormal tissues) incorrectly identified as positive (tumor)Correctly identified negative pixels are measured as True
ISRN Biomedical Imaging 5
Independent Component
Multisignal wavelet
Inverse wavelet
Fuzzy C-Means
Multispectral images
1D multisignals
Normal and abnormal brain tissues
Detail coefficients
Unmixed results
decomposition
transform
clustering
Analysis
Figure 3 Proposed MW-ICA based classification
Negative (TN) and positive pixels incorrectly identified asnegative tissues are counted as False Negative (FN) Sensitiv-ity represents the proportion of actual positives (here tissueslike GM WM etc) correctly classified and specificity is theproportion of negatives (here other tissues and background)correctly identified
We used an additional method Bland-Altman analysis[27] to evaluate the agreement between measures from twomethods In the Bland-Altman plots difference between twomeasurements (the bias) is plotted against the average ofthose measurements In this work the reproduced lesionvolumes by ICA andMW-ICA were quantitatively comparedwith lesion volumes by the groundtruth using this method
3 Experiments and Results
The complete system for algorithm implementation andevaluation was done in Matlab 7 running on Windows 7The proposed method was evaluated by both synthetic andclinical MRI images described in Section 21 Co-registeredimages were selected for wavelet decomposition and ICANo image registration was required in the case of syntheticimages but Matlab based simple resizing and rotation wasapplied on clinical images to generate co-registered dataMultisignal 1-D wavelet analysis was applied on input signalsusing Matlab Wavelet Toolbox Wavelets from Daubechies[28] family were selected for detailed performance variationstudy for different wavelets FCM method provided in FuzzyLogic Toolbox was applied on generated ICs to do automaticsegmentation Feature extraction and classification by FCMwere themain steps in this study Quantitative and qualitativeanalyses were performed using reproduced results fromsynthetic and real data These experiments were repeated forconventional ICA based FCMalso After that we conducted acomparative study of two methods in the same environment
The observed results are presented and they are discussed inthe following sections
31 Synthetic Image Analysis Multiple sclerosis (MS) dataobtained from the BrainWeb Simulated Brain Database wasincluded in synthetic MR image analysis 20 multispectralimage sets were formed from axial T1-weighted images(T1WI) T2-weighted images (T2WI) and Proton DensityImages (PDI) with specifications described in Section 21Figure 4(a) shows images of slice no 105 for differentsequences T1WI shows WM and GM components T2WIgives details of CSF and White Matter lesions (WML) andPD images show abnormal features Reconstructed imagesfrom multisignal wavelet analysis are given in Figure 4(b)Results from MW-ICA and ICA are shown in Figures 4(c)and 4(d) respectively As described in Steps 5 and 6 of theproposed method total six ICs were generated from MW-ICA using Db12 wavelet Relevant four of them are shown inFigure 4(c) Details of the brain features provided by MW-ICA (Figure 4(c)) were found to be very specific in providingbrain matter details from each component showing CSFWMWML and GM features clearly in 1st 2nd 3rd and 4thICs respectively However it was observed from conventionalICA results (Figure 4(d)) that features of CSF andWMLwereaccumulated in 1st IC whereas proposed method clusteredCSF and WML into different classes Presence of WMLlocations inWM (Figure 4(d) 3rd IC) was not so clear in ICAresults
We analyzed the effect of these feature analysis methodsin FCM clustering for a given degree of membership 06and reproduced tissues are presented in Figure 5 Figure 5(a)shows MW-ICA based FCM results and ICA based FCMresults are shown in Figure 5(b) Each column represents aparticular brain tissue in the order of CSF GM WM andWML from left to rightThe best results by proposedmethod
6 ISRN Biomedical Imaging
(a)
(b)
(c)
(d)
Figure 4 ICA and MW-ICA results from synthetic image analysis(a) Synthetic Images T1WI T2WI and PDI from left to right(b) Reconstructed images from detail coefficients (c) Independentcomponents from proposed method (d) Conventional ICA results
were observed for small lesions and WM The presenceof abnormality in WM is clearly visible in Figure 5(a) 3rdcolumn MW-ICA based classification results gave moreinformation on lesion details (Figure 5(a)) than those fromICA based processing (Figure 5(b)) GM tissues (2nd col-umn) were found to be more specific in MW-ICA resultsbut traces of negative pixels were also found in the classifiedresults
To evaluate the improvement in MW-ICA based classi-fication a detailed quantitative analysis was performed with15 synthetic multispectral sets Average sensitivity specificityaccuracy False Positive Rate (FPR) error rate (all in )and Tanimoto Index (TI) values were measured for FCMclassifications based on ICA and MW-ICA for membershipdegree 08 Observed results are summarized in Table 1Experimental reports demonstrated the efficiency of theproposed method by yielding comparatively better resultsfor all tissues A drastic increase in Tanimoto Index andsensitivity observed in the case of WM lesions showing 093against 082 for TI and sensitivity increased from 8588 to9323 From visual and quantitative results it was observed
(a)
(b)
Figure 5 FCM Classification results in the order of CSF GM WMandWML from left to right (a) Results fromMW-ICA (b) Resultsfrom ICA
that MW-ICA could improve the reproducibility of localfeatures like small lesions in classification To confirm theefficiency and consistency of the proposed algorithm fordifferent wavelets db2 db4 db8 db12 db16 db24 and db32were also considered in quantitative analysis TI values anderror rate observed for GM WM and WML were plotted asshown in Figures 6(a) and 6(b) respectively 119883-axis showsDaubechies wavelets of different orders ldquo119873rdquo [28] FromFigure 6(a) Db4 is the best for WM and Db12 shows thenext best value For GM and lesion extraction Db12 exceedsDb4 Difference in error rate on variation of wavelet orders isavailable from Figure 6(b) For lesions least error rate valuewas observed for Db12 However Db4 showed the best valuesfor GM andWM
To interpret the performance improvement by MW-ICAover ICA statistically Bland-Altman analysis was performedon 20 synthetic multispectral sets The differences betweenlesion volumes (in mL) estimated from ICA based resultsand the groundtruth were first plotted against the averagesof bothmeasures (Figure 7(a))The agreement betweenMW-ICAand the groundtruthwas plotted as shown in Figure 7(b)The mean difference (bias or 119889) standard deviation (SD) ofthe differences and 95 limits of agreement (plusmn196 SD) werealso calculated Using ICA 119889 was 024mL with 95 limitsof agreement minus011mL to 058mL (Figure 7(a)) whereas thepoints were distributed closer to zero for MW-ICA Meanbias was observed as 005mL with 95 limits of agreementminus005mL to 016mL (Figure 7(b))
Visual and quantitative analyses by synthetic imagessupported the positive impact of MW-ICA in brain tissueclassification with relatively good normal and abnormalreproduced tissues In order to evaluate the efficiency of theproposed method in clinical analysis abnormal data from 28patients were selected and experimental results are discussedin the next section
32 Clinical Image Analysis The same sets of experimentsexplained in previous section were repeated for abnormal
ISRN Biomedical Imaging 7
0 5 10 15 20 25 30 3565
70
75
80
85
90
95Ta
nim
oto
Inde
x
LesionWMGM
Wavelets (dbN)
(a)
0 5 10 15 20 25 30 350
1
2
3
4
5
6
7
Erro
r rat
e
LesionWMGM
Wavelets (dbN)
(b)
Figure 6 Performance measure variations for Daubechies wavelets with different orders ldquo119873rdquo (a) Tanimoto Index (b) Error rate
1 15 2 25 3minus02
minus01
0
01
02
03
04
05
06
07
08
Average lesion volume from groundtruth and ICA (mL)
Diff
eren
ce in
lesio
n vo
lum
e (m
L)
Mean +196lowastSD
Mean minus196lowastSD
(a)
1 15 2 25 3minus01
0
005
01
015
02
025
03
Average lesion volume from groundtruth and MW-ICA (mL)
Diff
eren
ce in
lesio
n vo
lum
e (m
L)
minus005
Mean +196lowastSD
Mean minus196lowastSD
(b)
Figure 7 Bland-Altman plots showing the statistical agreement between lesion volumes obtained from groundtruth and (a) ICA basedclassification (b) MW-ICA based classification The dotted lines represent the mean and 95 limits of agreement
data to verify the clinical performance of the proposedmethod Three bands in multispectral image were formedfrom axial T1WI T2WI and FLAIR images with parametersand specification as discussed in Section 21 Total 28 times 3multispectral sets were resulted by selecting three differentabnormal slices for each case Figure 8(a) shows sampleinput images T1WI T2WI and FLAIR selected for visualanalysis WM details are available from T1WI T2WI showsCSF and abnormal points FLAIR images give informationon abnormal tissues No detailed information on GM wasavailable from these images ICA based FCMwas first applied
on this dataset Classified results with degree of membership09 are shown in Figure 8(b) We repeated MW-ICA basedFCM on the same dataset using Db12 wavelet Reproducedtissues CSF WM and abnormality are shown in Figure 8(c)from left to right Column wise comparison of Figures 8(b)and 8(c) can give a detailed picture of the improvement intissue classification by proposed method CSF details from1st column of Figure 8(b) is found to be more than thatfrom Figure 8(c) But ICA results in Figure 8(b) failed to givespecific details of abnormality in the 2nd and 3rd columnsVisual results demonstrated the efficiency of MW-ICA in
8 ISRN Biomedical Imaging
(a)
(b)
(c)
Figure 8 FCM Classification results in the order of CSF WM andWML from left to right (a) Clinical input images T1WI T2WI andFLAIR from left to right (b) ICA based results (c) MW-ICA basedresults
small feature analysis with highly specific WM and abnor-mal reproduced tissues Results from Figure 8(c) show thatabnormalities extracted by proposedmethod are very similarto those available from FLAIR image Its presence in WMis also located correctly by proposed method To ensure theefficiency of the newmethod in clinical analysis an elaboratestudy was performed with quantitative measurements likethe sensitivity specificity accuracy error rate (all in ) andTanimoto Index values Average measures from classificationof 84 multispectral slice sets along with standard deviationvalues (std) are summarized in Table 2
Table 2 results describe MW-ICA as a better approachcompared to ICA in brain tissue analysis Proposed methodgave very good results for all tissue except CSF ICA per-formed better in classification of CSF with average TI value066 plusmn 009 against 061 plusmn 001 but it shows large standarddeviations for sensitivity and Tanimoto measures In thecase of small abnormality analysis Tanimoto value improvedfrom 0792 plusmn 012 to 090 plusmn 007 Almost the same amountof improvement was observed in the case of WM analysisalso Consistency of the new method was confirmed by thereduction in standard deviations observed for almost allmeasures
Average results from three multispectral slice sets of asingle patient measured by ICA based classification andMW-ICA based analysis were used to study the variation inFalse Positive Rate Estimated results from 28 patients withstandard deviations are shown as error bars in Figure 9 for
CSF WM Lesion0
2
4
6
8
10
12
Brain matters
False
Pos
itive
Rat
e
MWICA + FCMICA + FCM
Figure 9 FPR comparison of segmented tissues usingMW-ICAandICA
CSFWM and abnormality CSF classification fromMW-ICAand ICA showed almost the same resultsHowever in the caseofWM and abnormality analysis comparatively lower valueswere observed for MW-ICA based analysis The significantreduction in FPR observed for MW-ICA based classificationin the case of abnormal tissues is a promising result in clinicalanalysis
4 Discussion
In this work we have proposed a new method MultisignalWavelet Independent Component Analysis (MW-ICA) forimproved feature extraction and brain tissue classificationfrom multispectral MRI ICA is a good preprocessing stepin multispectral classification It separates the mixed inputsignals into statistically independent components (ICs) fromwhich an improved brain tissue classification can be per-formed inMRI analysis [14] However it ignores small detailswhile processing massive amount of information As anattempt to resolve this issue high frequency components(detail coefficients) from multisignal wavelet analysis wereconsidered in this work in conjunction with input multisig-nals The algorithm was validated by both synthetic and realimages It was implemented as an automated technique inwhich the ICs were derived automatically from co-registeredimages Parameters like wavelet type and degree of member-ship were set as fixed in the initial settings The new methodsucceeded in unmixing each brain tissue into separate ICsfrom which a reliable automatic segmentation using FCMwas performed without any indexing In comparison withICs from widely used ICA method (Figure 4(d)) MW-ICA provides more tissue specific components (Figure 4(c))Lesion detection from ICA results was not very easy sinceCSF and lesion details were accumulated in first component
ISRN Biomedical Imaging 9
Table 1 Quantitative analysis of synthetic images
Feature analysis Sensitivity FPR Specificity Accuracy TI
CSF ICA 8418 076 9924 9718 075MW-ICA 8819 039 9961 9849 078
WM ICA 9953 199 9801 9831 090MW-ICA 9960 208 9692 9744 093
WML ICA 8588 007 9991 9961 082MW-ICA 9323 009 9991 9980 093
GM ICA 9528 513 9487 9492 082MW-ICA 9890 298 9703 9694 088
Table 2 Quantitative analysis of clinical images
Feature analysis Sensitivity (plusmnstd) Specificity (plusmnstd) Accuracy (plusmnstd) TI (plusmnstd)
CSF ICA 6628 (934) 9999 (002) 9521 (242) 066 (009)MW-ICA 6735 (547) 9852 (140) 9476 (281) 061 (001)
WM ICA 8550 (820) 9408 (436) 9237 (226) 070 (005)MW-ICA 8895 (714) 9483 (128) 9360 (218) 081 (001)
WML ICA 8490 (502) 9757 (222) 9731 (218) 072 (012)MW-ICA 9199 (388) 9888 (140) 9869 (138) 090 (007)
(Figure 4(d)) ICA results failed to locate the presence oflesions in WM (Figure 4(d) last column) because of back-ground dominating effects from global features
The reproduced tissues fromproposedmethodwere eval-uated qualitatively and quantitatively against groundtruthimages and ICA based results Classified brain tissues fromsynthetic images especially WM and WML were foundto be yielding more information with improved quality(Figure 5(a)) compared to ICA based results (Figure 5(b)) Itis further emphasized by the visual results from clinical casealso (Figure 7) Performance measures like TI sensitivityspecificity accuracy and so forth discussed in Section 26demonstrated the potential of MW-ICA based FCM inclassification of global and local features with relatively bettervalues compared to ICA based classification (Table 1) Tani-moto Indexsensitivity values 0939323 observed against0828588 for synthetic caseWMlesion analysis confirmedthe improvement in small object detection by MW-ICAImproved sensitivity and accuracy values observed for alltissues demonstrated the efficiency and robustness of the newalgorithm in clinical trials (Table 2) Increased average TIvalue from 072 to 090 and reduced FPR (Figure 9) supportthe effectiveness of the method in small abnormality anal-ysis Considerable reduction in standard deviation (Table 2and Figure 9) implies the consistency of MW-ICA basedclassification in clinical analysis Statistical interpretationof agreement between estimated synthetic lesion volumesby groundtruth and classifications using MW-ICA (andICA) was performed with Bland-Altman analysis A closeragreement with segmented brain volumes from groundtruthandMW-ICA supports the newmethod as a better approachcompared to ICA Bias was contained well within the twostandard deviations except for one sample (Figure 7(b))Improvement in MW-ICA over ICA was further confirmed
by the reduced mean bias (which is closer to zero) andshortened limits of agreement
Variation in quantitative measures TI and error ratefor different wavelets implied that wavelet selection has animportant role in quality of the results (Figure 6) Consider-ing the cost of feature extraction MW-ICA was observed totake more time We measured 045 seconds for ICA and 143seconds forMW-ICA in a typical clinical imaging analysis ona Windows 7 PC with Pentium Dual CPU of 20GHz2GBRAM It can be varied on different values of parameters likewavelet type degree of decomposition number of bands ininput signals and so forth which is to be explored in futureworks The common MR image artefacts like gaussian noiseillumination effects and so forth were not considered in thiswork
Experimental results support MW-ICA as a promisingapproach in classification of brain matters especially inthe case of small abnormalities Technically novelty of thealgorithm lies in exploiting the characteristics of the waveletsin extracting the local features and combining the resultswith input multisignal for improved segmentation and clas-sification Experimental results demonstrated it in clinicalanalysis of brain matters especially in locating small lesionsand their effect on other brain tissues A detailed analysis ofthe proposed method using optimal parameter selection andsupervised methods is under consideration as a future work
5 Conclusion
We presented a new Multisignal Wavelet ICA (MW-ICA)based classification to improve the performance of automatedmultispectral MRI analysis FCM clustering was used toinvestigate and evaluate the positive effect of the method in
10 ISRN Biomedical Imaging
brain tissue analysis Experimental results using synthetic andclinical data confirmed the efficiency and reproducibility ofthe proposed method in small abnormality analysis Com-parative analysis with ICA based classifications recommendsthatMW-ICA can be a good choice for automatic brain tissueclassification in clinical analysis Supervised classificationusingMW-ICA in noisy environments is under considerationas a future work
Acknowledgment
The authors sincerely thank the Institute of Radiology andImaging Sciences (IRIS) Pvt Ltd Kochi for supporting themwith the required medical guidance in this work
References
[1] M W Vannier R L Butterfield and D Jordan ldquoMultispectralanalysis of magnetic resonance imagesrdquo Radiology vol 154 no1 pp 221ndash224 1985
[2] L P Clarke R P Velthuizen M A Camacho et al ldquoMRIsegmentation methods and applicationsrdquo Magnetic ResonanceImaging vol 13 no 3 pp 343ndash368 1995
[3] Y Kvinnsland N Brekke T M Taxt and R Gruner ldquoMulti-spectral analysis of multimodal imagesrdquo Acta Oncologica vol48 no 2 pp 277ndash284 2009
[4] H Arimura T Magome Y Yamashita and D YamamotoldquoComputer-aided diagnosis systems for brain diseases in mag-netic resonance imagesrdquo Algorithms vol 2 no 3 pp 925ndash9522009
[5] C Valdes Hernandez Mdel P J Gallacher M E Bastin etal ldquoAutomatic segmentation of brain white matter and whitematter lesions in normal aging comparison of fivemultispectraltechniquesrdquo Magnetic Resonance Imaging vol 30 no 2 pp222ndash229 2012
[6] A Akselrod-Ballin M Galun J M Gomori et al ldquoAutomaticsegmentation and classification of multiple sclerosis in multi-channel MRIrdquo IEEE Transactions on Bio-Medical Engineeringvol 56 no 10 pp 2461ndash2469 2009
[7] R He S Datta B R Sajja and P A Narayana ldquoGeneralizedfuzzy clustering for segmentation of multi-spectral magneticresonance imagesrdquo Computerized Medical Imaging and Graph-ics vol 32 no 5 pp 353ndash366 2008
[8] C M Bishop Pattern Recognition and Machine LearningSpringer 2006
[9] S Mallat A Wavelet Tour of Signal Processing The Sparse WayAcademic Press 3rd edition 2008
[10] A Hyvarinen J Karhunen and E Oja Independent ComponentAnalysis John Wiley amp Sons New York NY USA 2001
[11] S Ozer D L Langer X Liu et al ldquoSupervised and unsupervisedmethods for prostate cancer segmentation with multispectralMRIrdquoMedical Physics vol 37 no 4 pp 1873ndash1883 2010
[12] V N Vapnik Statistical Learning Theory John Wiley amp SonsNew York NY USA 1998
[13] T Tateyama Z Nakao and Y W Chen ldquoClassification of brainmatters in MRI by Kernel Independent Component Analysisrdquoin Proceedings of the 4th International Conference on IntelligentInformation Hiding and Multiedia Signal Processing (IIH-MSPrsquo08) pp 713ndash716 August 2008
[14] J W Chai C C C Chen C M Chiang et al ldquoQuantitativeanalysis in clinical applications of brainMRI using independentcomponent analysis coupled with support vector machinerdquoJournal of Magnetic Resonance Imaging vol 32 no 1 pp 24ndash342010
[15] Y C Ouyang H M Chen J W Chai et al ldquoBand expansion-based over-complete independent component analysis for mul-tispectral processing of magnetic resonance imagesrdquo IEEETransactions on Biomedical Engineering vol 55 no 6 pp 1666ndash1677 2008
[16] H Han and X L Li ldquoMulti-resolution independent compo-nent analysis for high-performance tumor classification andbiomarker discoveryrdquo BMC Bioinformatics vol 12 no 1 articleS7 2011
[17] J Karhunen S Malaroiu and M Ilmoniemi ldquoLocal inde-pendent component analysis using clusteringrdquo InternationalJournal of Neural Systems vol 10 no 6 pp 439ndash451 2000
[18] J Walters-Williams and Y Li ldquoPerformance comparison ofknown ICA algorithms to a wavelet-ICA mergerrdquo Signal Pro-cessing vol 5 no 3 pp 80ndash92 2011
[19] S Kaewpijit J LMoigne andT El-Ghazawi ldquoAutomatic reduc-tion of hyperspectral imagery using wavelet spectral analysisrdquoIEEE Transactions on Geoscience and Remote Sensing vol 41no 4 pp 863ndash871 2003
[20] J C Bezdec Pattern Recognition with Fuzzy Objective FunctionAlgorithms Plenum Press New York NY USA 1981
[21] Y Ouyang H Chen J Chai et al ldquoIndependent componentanalysis for magnetic resonance image analysisrdquo EURASIPJournal on Advances in Signal Processing vol 2008 Article ID780656 2008
[22] J F Cardoso ldquoInfomax and maximum likelihood for blindsource separationrdquo IEEE Signal Processing Letters vol 4 no 4pp 112ndash114 1997
[23] X F Yang and B W Fei ldquoA multiscale and multiblock fuzzyC-means classification method for brain MR imagesrdquo MedicalPhysics vol 38 no 6 pp 2879ndash2891 2011
[24] D Zhang and C Chen ldquoA novel kernelized fuzzy c-meansalgorithm with application in medical image segmentationrdquoArtificial Intelligence in Medicine vol 32 pp 37ndash50 2004
[25] A O Boudraa S M R Dehak Y M Zhu C Pachai Y G Baoand J Grimaud ldquoAutomated segmentation of multiple sclerosislesions in multispectral MR imaging using fuzzy clusteringrdquoComputers in Biology and Medicine vol 30 no 1 pp 23ndash402000
[26] J Han and M Kamber Data Mining Concepts and TechniquesMorgan Kaufmann Publisher San Fransisco Calif USA 2ndedition 2006
[27] J M Bland and D G Altman ldquoStatistical methods for assessingagreement between two methods of clinical measurementrdquoLancet vol 1 pp 307ndash310 1986
[28] IDaubechiesTenLectures onWavelets SIAMPhiladelphia PaUSA 1992
International Journal of
AerospaceEngineeringHindawi Publishing Corporationhttpwwwhindawicom Volume 2014
RoboticsJournal of
Hindawi Publishing Corporationhttpwwwhindawicom Volume 2014
Hindawi Publishing Corporationhttpwwwhindawicom Volume 2014
Active and Passive Electronic Components
Control Scienceand Engineering
Journal of
Hindawi Publishing Corporationhttpwwwhindawicom Volume 2014
International Journal of
RotatingMachinery
Hindawi Publishing Corporationhttpwwwhindawicom Volume 2014
Hindawi Publishing Corporation httpwwwhindawicom
Journal ofEngineeringVolume 2014
Submit your manuscripts athttpwwwhindawicom
VLSI Design
Hindawi Publishing Corporationhttpwwwhindawicom Volume 2014
Hindawi Publishing Corporationhttpwwwhindawicom Volume 2014
Shock and Vibration
Hindawi Publishing Corporationhttpwwwhindawicom Volume 2014
Civil EngineeringAdvances in
Acoustics and VibrationAdvances in
Hindawi Publishing Corporationhttpwwwhindawicom Volume 2014
Hindawi Publishing Corporationhttpwwwhindawicom Volume 2014
Electrical and Computer Engineering
Journal of
Advances inOptoElectronics
Hindawi Publishing Corporation httpwwwhindawicom
Volume 2014
The Scientific World JournalHindawi Publishing Corporation httpwwwhindawicom Volume 2014
SensorsJournal of
Hindawi Publishing Corporationhttpwwwhindawicom Volume 2014
Modelling amp Simulation in EngineeringHindawi Publishing Corporation httpwwwhindawicom Volume 2014
Hindawi Publishing Corporationhttpwwwhindawicom Volume 2014
Chemical EngineeringInternational Journal of Antennas and
Propagation
International Journal of
Hindawi Publishing Corporationhttpwwwhindawicom Volume 2014
Hindawi Publishing Corporationhttpwwwhindawicom Volume 2014
Navigation and Observation
International Journal of
Hindawi Publishing Corporationhttpwwwhindawicom Volume 2014
DistributedSensor Networks
International Journal of
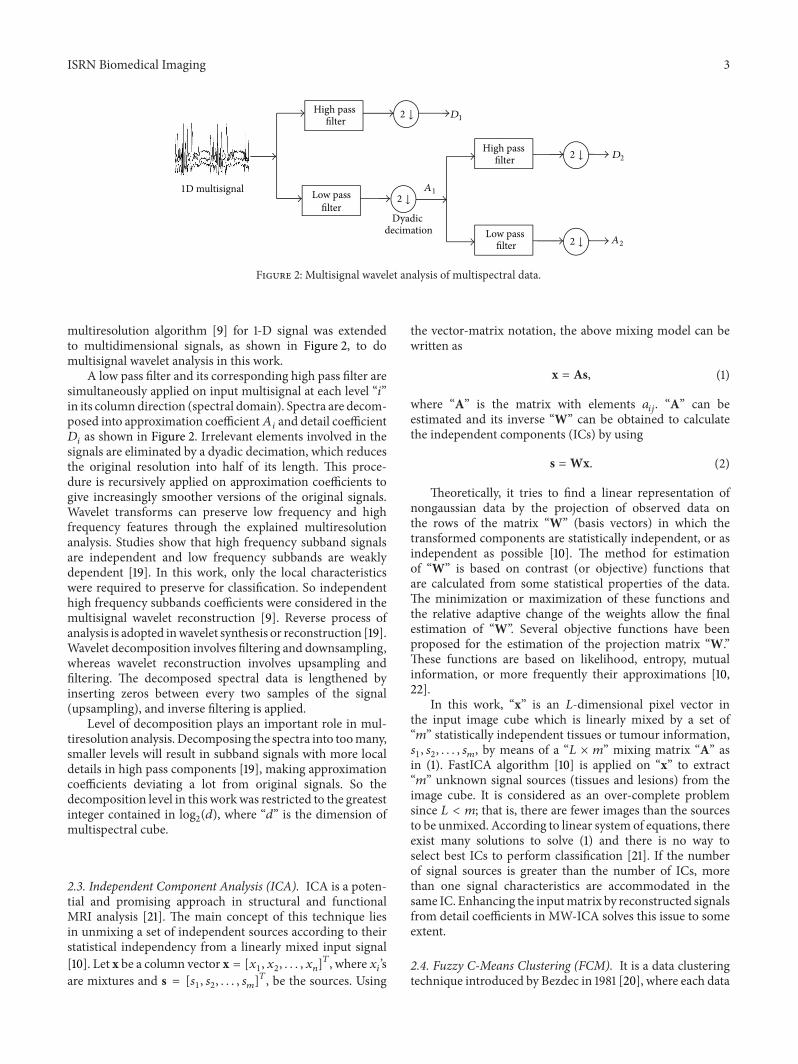
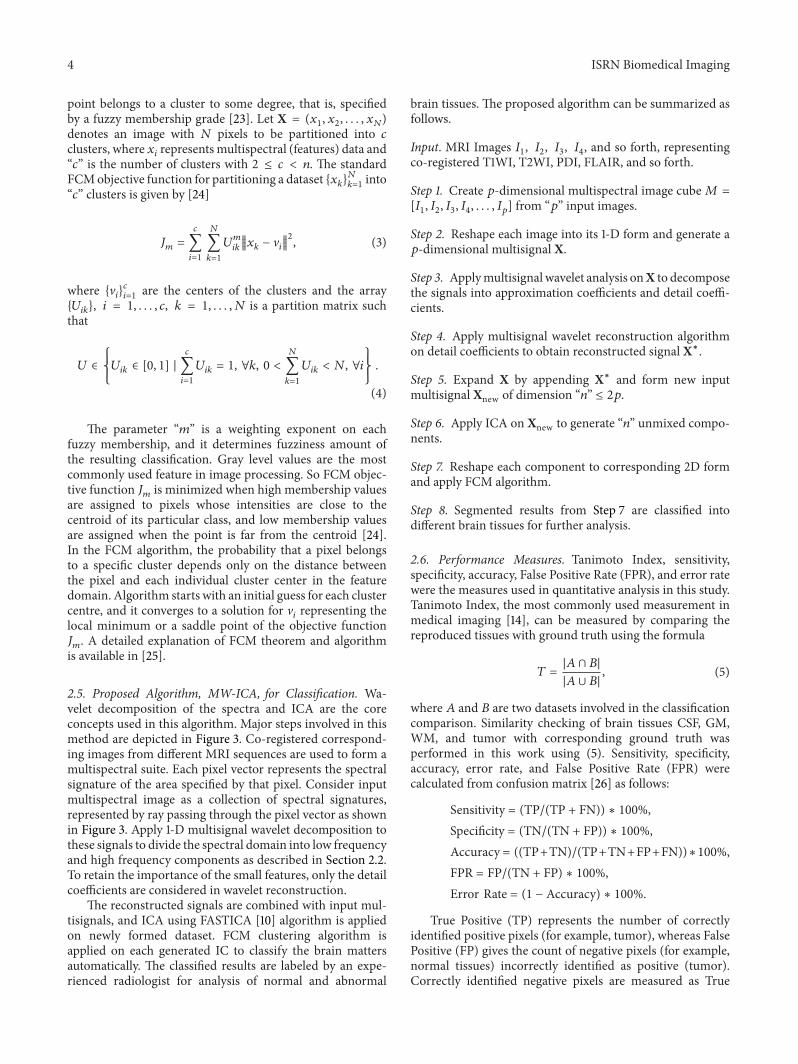
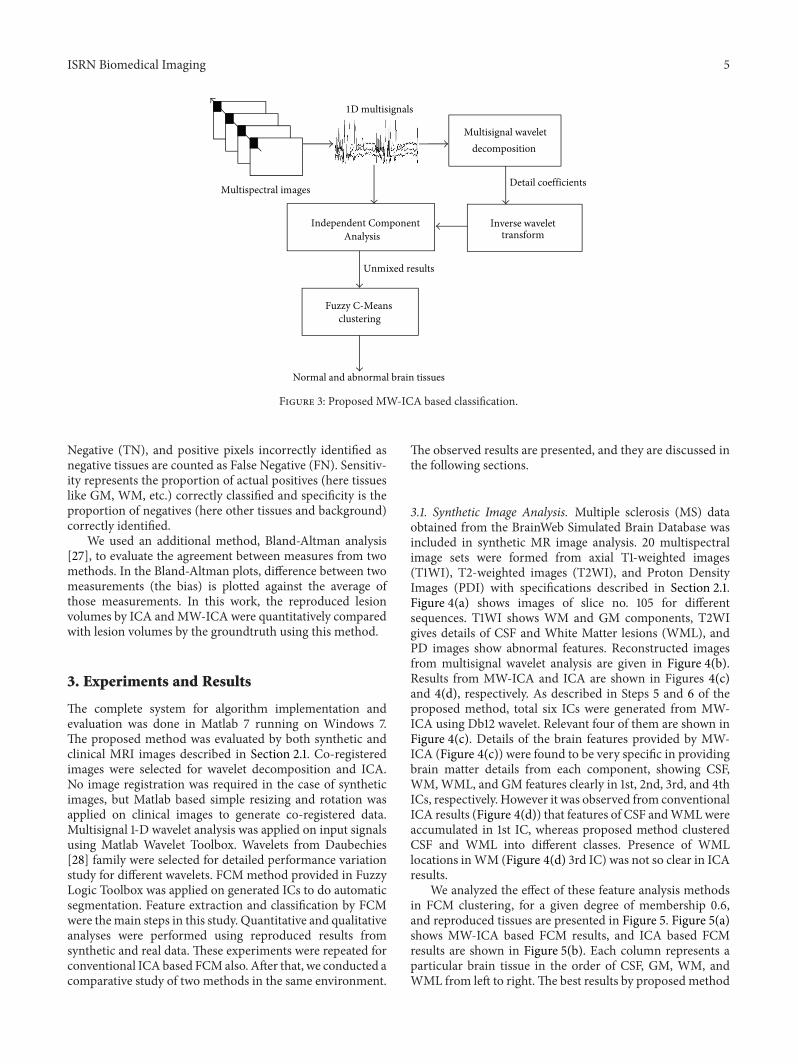
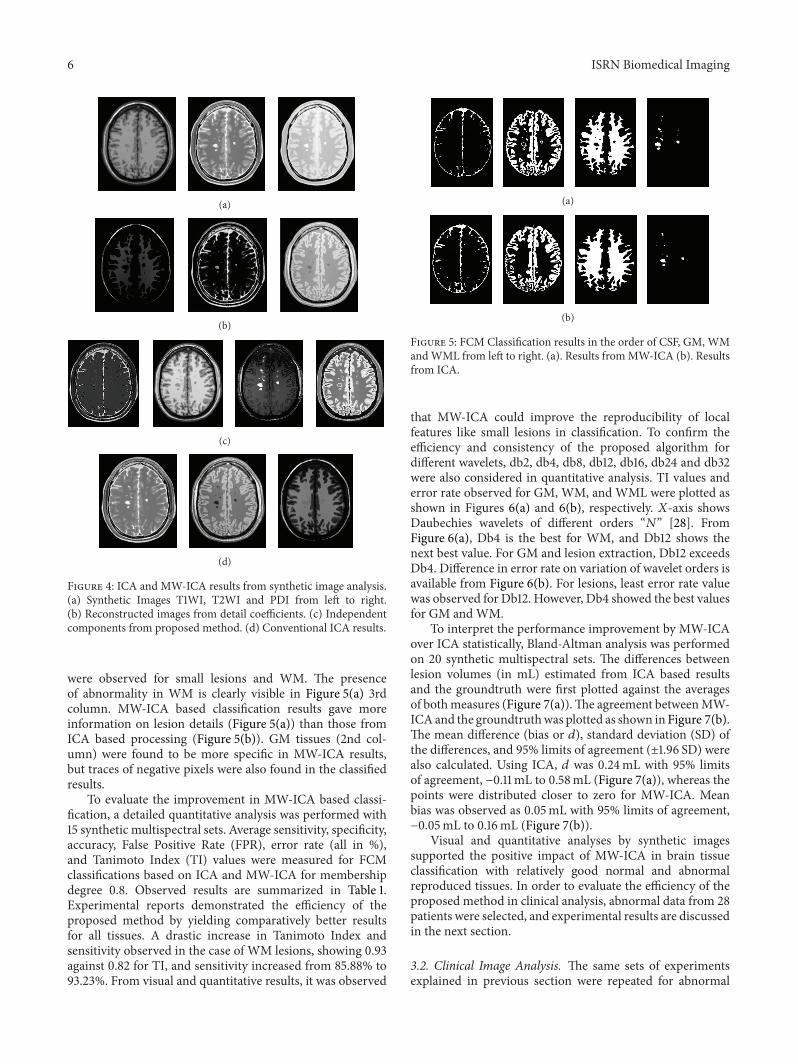
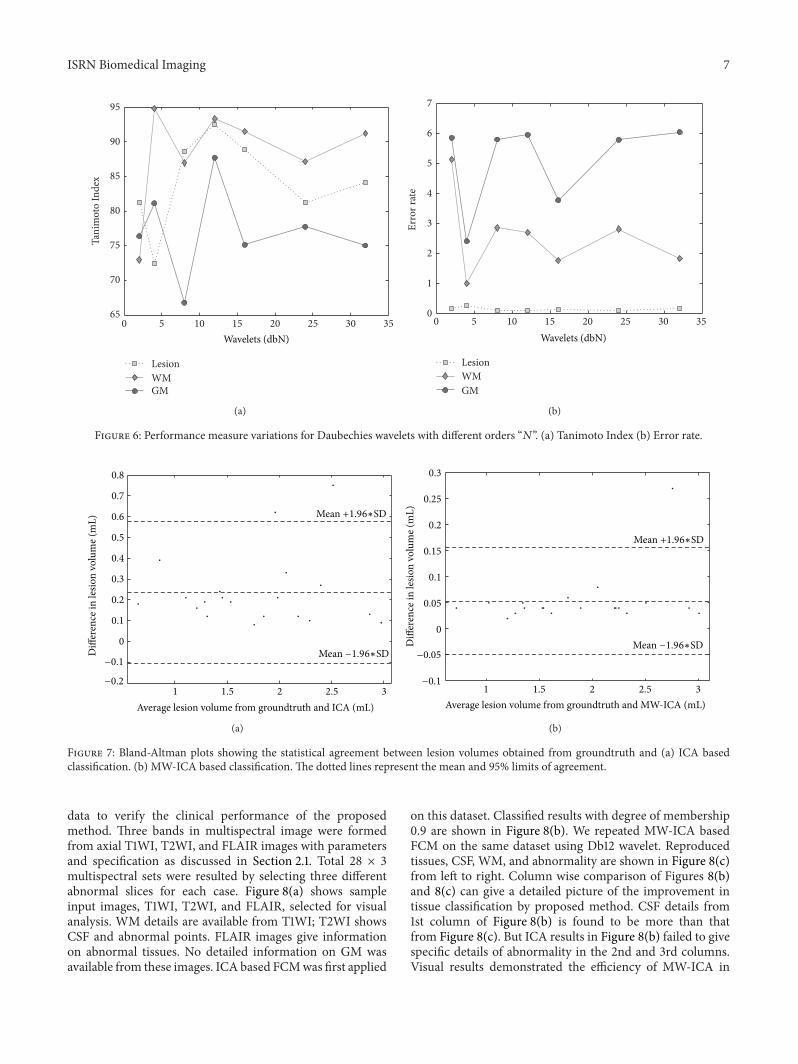
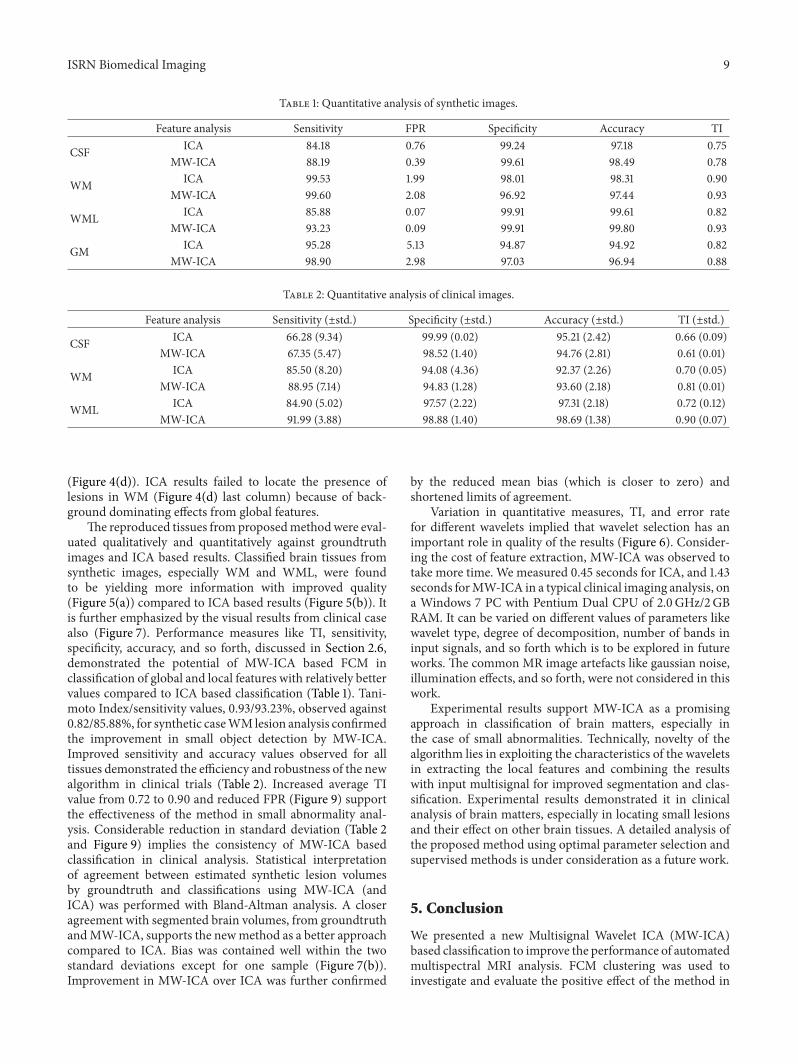

International Journal of
AerospaceEngineeringHindawi Publishing Corporationhttpwwwhindawicom Volume 2014
RoboticsJournal of
Hindawi Publishing Corporationhttpwwwhindawicom Volume 2014
Hindawi Publishing Corporationhttpwwwhindawicom Volume 2014
Active and Passive Electronic Components
Control Scienceand Engineering
Journal of
Hindawi Publishing Corporationhttpwwwhindawicom Volume 2014
International Journal of
RotatingMachinery
Hindawi Publishing Corporationhttpwwwhindawicom Volume 2014
Hindawi Publishing Corporation httpwwwhindawicom
Journal ofEngineeringVolume 2014
Submit your manuscripts athttpwwwhindawicom
VLSI Design
Hindawi Publishing Corporationhttpwwwhindawicom Volume 2014
Hindawi Publishing Corporationhttpwwwhindawicom Volume 2014
Shock and Vibration
Hindawi Publishing Corporationhttpwwwhindawicom Volume 2014
Civil EngineeringAdvances in
Acoustics and VibrationAdvances in
Hindawi Publishing Corporationhttpwwwhindawicom Volume 2014
Hindawi Publishing Corporationhttpwwwhindawicom Volume 2014
Electrical and Computer Engineering
Journal of
Advances inOptoElectronics
Hindawi Publishing Corporation httpwwwhindawicom
Volume 2014
The Scientific World JournalHindawi Publishing Corporation httpwwwhindawicom Volume 2014
SensorsJournal of
Hindawi Publishing Corporationhttpwwwhindawicom Volume 2014
Modelling amp Simulation in EngineeringHindawi Publishing Corporation httpwwwhindawicom Volume 2014
Hindawi Publishing Corporationhttpwwwhindawicom Volume 2014
Chemical EngineeringInternational Journal of Antennas and
Propagation
International Journal of
Hindawi Publishing Corporationhttpwwwhindawicom Volume 2014
Hindawi Publishing Corporationhttpwwwhindawicom Volume 2014
Navigation and Observation
International Journal of
Hindawi Publishing Corporationhttpwwwhindawicom Volume 2014
DistributedSensor Networks
International Journal of