Research Article A Bayesian Classifier Learning...
10
Hindawi Publishing Corporation Mathematical Problems in Engineering Volume 2013, Article ID 975953, 9 pages http://dx.doi.org/10.1155/2013/975953 Research Article A Bayesian Classifier Learning Algorithm Based on Optimization Model Sanyang Liu, Mingmin Zhu, and Youlong Yang Department of Mathematics, Xidian University, Xi’an 710071, China Correspondence should be addressed to Sanyang Liu; [email protected] Received 6 September 2012; Accepted 10 December 2012 Academic Editor: Cesar Cruz-Hernandez Copyright © 2013 Sanyang Liu et al. is is an open access article distributed under the Creative Commons Attribution License, which permits unrestricted use, distribution, and reproduction in any medium, provided the original work is properly cited. Naive Bayes classifier is a simple and effective classification method, but its attribute independence assumption makes it unable to express the dependence among attributes and affects its classification performance. In this paper, we summarize the existing improved algorithms and propose a Bayesian classifier learning algorithm based on optimization model (BC-OM). BC-OM uses the chi-squared statistic to estimate the dependence coefficients among attributes, with which it constructs the objective function as an overall measure of the dependence for a classifier structure. erefore, a problem of searching for an optimal classifier can be turned into finding the maximum value of the objective function in feasible fields. In addition, we have proved the existence and uniqueness of the numerical solution. BC-OM offers a new opinion for the research of extended Bayesian classifier. eoretical and experimental results show that the new algorithm is correct and effective. 1. Introduction With the development of information technology, in par- ticular the progress of network technology, multimedia technology and communication technology, massive data analysis, and processing become more and more important. Since Bayesian network as classifier has a solid mathemat- ical basis and takes the prior information of samples into consideration, it is now one of the hottest areas in machine learning and data mining fields. Moreover, it has been applied to a wide range of tasks such as natural spoken dialog systems, vision recognition, medical diagnosis, genetic regulatory network inference, and so forth [1–8]. Naive Bayes (NB) [9–11] is a simple and effective classification model. Although its performance can be comparable with other classification methods, such as decision trees and neural network, its attribute of independence assumption limits its real application. Extending its structure is a direct way to overcome the limitation of naive Bayes [12–14], since attribute dependencies can be explicitly represented by arcs. Tree- augmented naive Bayes (TAN) [9] is an extended tree-like naive Bayes in which the class node directly points to all attribute nodes and an attribute node can have only one parent from another attribute node. On this basis, Cheng et al. presented Bayesain-network-Augmented naive Bayes (BAN) [15, 16] which further expanded the tree-like structure of TAN classifier and allowed the dependency relation between any two attribute nodes. In constructing BAN, they use a scoring function based on the minimum description length principle. Unfortunately, the search for the best network is performed in the space of all possible networks, and the number of elements in this space increases exponentially with the number of nodes, finding the best structure is NP-hard [17, 18]. Based on above analysis, this paper presents a Bayesian classifier learning algorithm based on optimization model (BC-OM) for the first time, inspired by constraint-based Bayesian network structure learning method [19–22]. We discuss the classification principles of Bayesian classifier from a new view. Because chi-squared tests are a standard tool for measuring the dependency between pairs of variables [23], BC-OM first introduces the chi-squared statistic to define the dependence coefficients of variables. en, it uses the dependence coefficients to construct an overall measure of the dependence in a classifier structure, from which the objective function for our optimization model can be derived. erefore, a problem of searching for an optimal classifier can be turned into finding the maximum value of the objective
Transcript of Research Article A Bayesian Classifier Learning...
Hindawi Publishing CorporationMathematical Problems in EngineeringVolume 2013 Article ID 975953 9 pageshttpdxdoiorg1011552013975953
Research ArticleA Bayesian Classifier Learning Algorithm Based onOptimization Model
Sanyang Liu Mingmin Zhu and Youlong Yang
Department of Mathematics Xidian University Xirsquoan 710071 China
Correspondence should be addressed to Sanyang Liu liusanyang126com
Received 6 September 2012 Accepted 10 December 2012
Academic Editor Cesar Cruz-Hernandez
Copyright copy 2013 Sanyang Liu et al This is an open access article distributed under the Creative Commons Attribution Licensewhich permits unrestricted use distribution and reproduction in any medium provided the original work is properly cited
Naive Bayes classifier is a simple and effective classification method but its attribute independence assumption makes it unableto express the dependence among attributes and affects its classification performance In this paper we summarize the existingimproved algorithms and propose a Bayesian classifier learning algorithm based on optimization model (BC-OM) BC-OM usesthe chi-squared statistic to estimate the dependence coefficients among attributes with which it constructs the objective functionas an overall measure of the dependence for a classifier structure Therefore a problem of searching for an optimal classifier can beturned into finding the maximum value of the objective function in feasible fields In addition we have proved the existence anduniqueness of the numerical solution BC-OM offers a new opinion for the research of extended Bayesian classifierTheoretical andexperimental results show that the new algorithm is correct and effective
1 Introduction
With the development of information technology in par-ticular the progress of network technology multimediatechnology and communication technology massive dataanalysis and processing become more and more importantSince Bayesian network as classifier has a solid mathemat-ical basis and takes the prior information of samples intoconsideration it is now one of the hottest areas in machinelearning and data mining fields Moreover it has beenapplied to a wide range of tasks such as natural spokendialog systems vision recognitionmedical diagnosis geneticregulatory network inference and so forth [1ndash8] Naive Bayes(NB) [9ndash11] is a simple and effective classification modelAlthough its performance can be comparable with otherclassification methods such as decision trees and neuralnetwork its attribute of independence assumption limits itsreal application Extending its structure is a direct way toovercome the limitation of naive Bayes [12ndash14] since attributedependencies can be explicitly represented by arcs Tree-augmented naive Bayes (TAN) [9] is an extended tree-likenaive Bayes in which the class node directly points to allattribute nodes and an attribute node can have only oneparent fromanother attribute nodeOn this basis Cheng et al
presented Bayesain-network-Augmented naive Bayes (BAN)[15 16] which further expanded the tree-like structure ofTAN classifier and allowed the dependency relation betweenany two attribute nodes In constructing BAN they use ascoring function based on the minimum description lengthprinciple Unfortunately the search for the best network isperformed in the space of all possible networks and thenumber of elements in this space increases exponentially withthe number of nodes finding the best structure is NP-hard[17 18]
Based on above analysis this paper presents a Bayesianclassifier learning algorithm based on optimization model(BC-OM) for the first time inspired by constraint-basedBayesian network structure learning method [19ndash22] Wediscuss the classification principles of Bayesian classifier froma new view Because chi-squared tests are a standard tool formeasuring the dependency between pairs of variables [23]BC-OM first introduces the chi-squared statistic to definethe dependence coefficients of variables Then it uses thedependence coefficients to construct an overall measure ofthe dependence in a classifier structure from which theobjective function for our optimizationmodel can be derivedTherefore a problem of searching for an optimal classifier canbe turned into finding the maximum value of the objective
2 Mathematical Problems in Engineering
V2 V3
V1
V4 V5
(a) NB
V2 V3
V1
V4 V5
(b) TAN
V2 V3
V1
V4
V5
(c) BAN
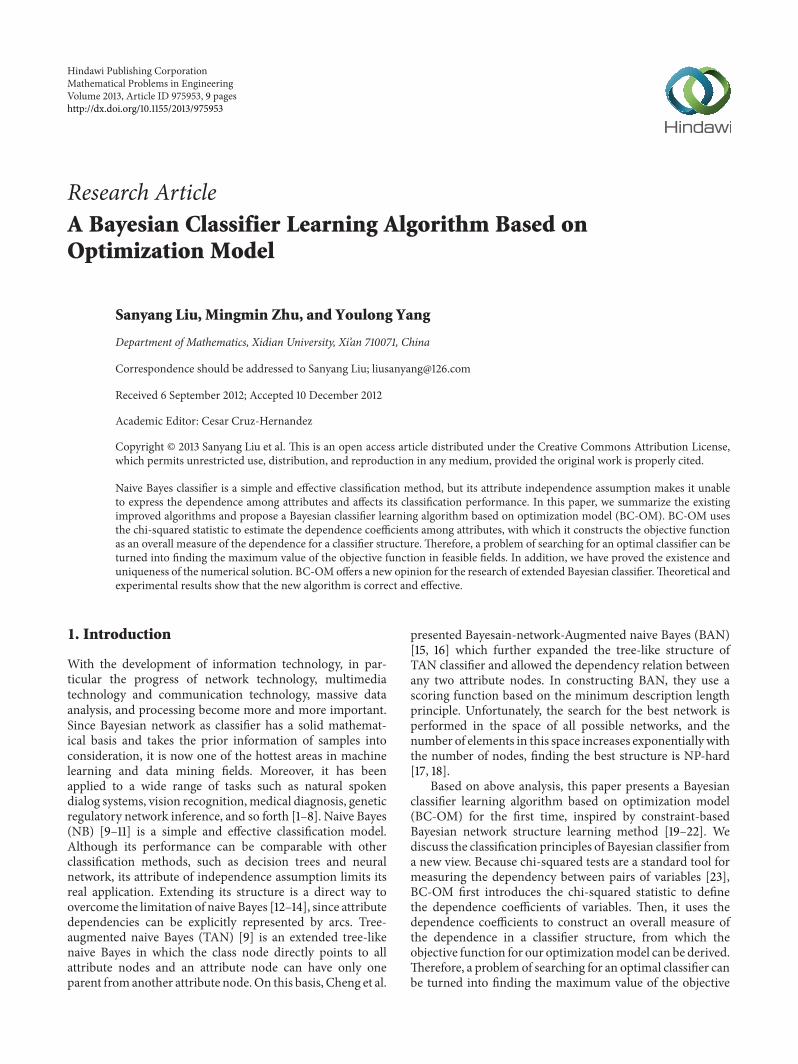
Figure 1 Illustration of NB TAN and BAN structures
function in feasible fields The function extremum corre-sponds to the best classifier Finally BC-OM improves theefficiency of classification and delete irrelevant or redundantattributes by using the d-separation rule of Bayesian networkTheoretical and experimental results show the proposedalgorithm is not only effective in improving the accuracy butalso has a high learning speed and simple solving procedure
The remainder of this paper is organized as followsSection 2 reviews the existing Bayesian network classifiersWe describe our algorithm and its theoretical proofs inSection 3 Section 4 details the experimental procedures andresults of the proposed algorithm Finally in Section 5 weconclude and outline our future work
2 Background
In this section we discuss previous work that is relevant tothis paper and describe some of the notations used firstlyWeuse boldface capital letters such asVEX for sets of variablesGeneral variables are denoted by italic capital letters or indexitalic capital letters 119883 119877 119881
minus
specific values taken by thesevariables are denoted 119909
minus
119903minus
119907minus
Specially we use the sameitalic letters119883119884119881
minus
for graph nodes which corresponds withthe random variables
Classification is a basic task in data analysis and patternrecognition that requires the construction of a classifier thatis a function that assigns a class label to instances describedby a set of attributes The induction of classifiers from datasets of preclassified instances is a central problem in machinelearning Let V = 119881
1
1198812
119881119899
represent the variable setwhich corresponds with the training data set 119863 We assumethat 119881
1
is the class variable and 1198812
1198813
119881119899
is the setof attribute variables Bayesian networks are often used forclassification problems in which themain task is to constructthe classifier structure 119866 from a given set of training datawith class labels and then compute the posterior probability119875119866
(1199071
| 1198812
1198813
119881119899
) where 1199071
is the value that 1198811
takesThus it only needs to predict the class with the highest valueof probability 119875
119866
(1199071
| 1198812
1198813
119881119899
) that is
1199071
lowast
= arg max119907
1isindom(119881
1)
119875119866
(1199071
| 1198812
1198813
119881119899
) (1)
According to Bayes theorem maximizing 119875119866
(1199071
| 1198812
1198813
119881119899
) is equivalent to maximizing119875(1199071
) sdot119875119866
(1198812
1198813
119881119899
| 1199071
)The difference between the existing Bayesian classifiers is thecomputing mode of 119875
119866
(sdot)
Figure 1 schematically illustrates the structures of theBayesian classifiers considered in this paper In naive Bayeseach attribute node has the class node as its parent butdoes not have any parent from attribute nodes Computing119875119866
(1198812
1198813
119881119899
| 1199071
) is equal toprod119899119894=2
119875119866
(119881119894
| 1199071
) Because thevalues of 119875
119866
(1199071
) and 119875119866
(119881119894
| 1199071
) can be easily estimated fromtraining examples naive Bayes is easy to construct Howeverits prerequisite of condition independence assumption anddata completeness limit its real application TAN takes thenaive Bayes and adds edges to it in which the class nodedirectly points to all attribute nodes and an attribute node canhave only one parent from another attribute node Comput-ing119875119866
(1198812
1198813
119881119899
| 1199071
) is equivalent toprod119899119894=2
119875119866
(119881119894
| 119881119895
1199071
)where119881
119895
isin 1198811
1198812
119881(119894minus1)
It is an efficient extend of naiveBayes BAN is a specific case of general Bayesian networkclassifier in which the class node also directly points to allattribute nodes but there is no limitation on the arcs amongattribute nodes (except that they do not form any directedcycle) It is clear that TAN and BAN are useful to modelcorrelations among attribute nodes that cannot be capturedby naive Bayes They embody a good tradeoff betweenthe equality of the approximation of correlations amongattributes and the computational complexity in the learningstage In addition existing algorithms using the same idea toconstruct the structure of Bayesian classifier which first learnthe dependent relationships among attribute variables usingBayesian network structure learning algorithm then add theclass variable as the root node of the network It is equivalentto learning the best Bayesian network among those in which1198811
is a root Thus even if we could improve the performanceof a naive Bayes classifier in this way the computational effortrequired may not be worthwhile
Based on above analysis this paper presents an optimiza-tion model to learn the structure of Bayesian classifier whichinspired by constraint-based Bayesian network structurelearning method It is the first time that a problem of struc-tural learning for a Bayesian classifier is transformed intoits related mathematical programming problem by definingobjective function and feasible region And we also propose anewmethod tomeasure the dependent relationships betweenattributes The theoretical basis of this method is establishedbyTheorem 1 [24]
Theorem 1 Given a data set 119863 and a variable set V = 1198811
1198812
119881119899
if the hypothesis that 119881119894
and 119881119895
are conditionally
Mathematical Problems in Engineering 3
independent given 119881119896
is true then the statistics 1198802119894119895|119896
= 2sum119886119887119888
119873119886119887119888
119894119895119896
log[119873119886119887119888119894119895119896
119873119888
119896
(119873119886119888
119894119896
119873119887119888
119895119896
)] approximates to a distribution1205942
(119897) with 119897 = (119903119894
minus1)(119903119895
minus1)119903119896
degrees of freedom where 119903119894
119903119895
and 119903119896
represent the number of configurations for the variables119881119894
119881119895
and 119881119896
respectively 119873119886119887119888119894119895119896
is the number of cases in 119863where 119881
119894
= 119886 119881119895
= 119887 and 119881119896
= 119888 119873119886119888119894119896
is the number of casesin119863 where119881
119894
= 119886 and119881119896
= 119888 and119873119888119896
is the number of cases in119863 where 119881
119896
= 119888
3 A Bayesian Classifier Learning AlgorithmBased on Optimization Model
31 Optimization Model Design In this subsection we givesome basic concepts and theorems which is the foundationof the method proposed in this paper
A Bayesian classifier is a graphical representation of ajoint probability distribution that includes two componentsOne is a directed acyclic graph 119866 = (VE) where the nodeset V = 119881
1
1198812
119881119899
represents the class and attributevariables and the edge set E represents direct dependencyrelationships between variables The other is a joint probabil-ity distribution Θ = 120579
119894
| 120579119894
= 119875(119881119894
| pa(119881119894
)) 119894 = 1 2 119899
that quantifies the effects of pa(119881119894
) has on the variable 119881119894
in119866 where pa(119881
119894
) = 119881119895
| 119881119895
rarr 119881119894
isin 119864 We assumethat 119881
1
is the class node and 1198812
1198813
119881119899
is the set ofattribute nodes The structure of 119866 reflects the underlyingprobabilistic dependence relations among the nodes and a setof assertions about conditional independenciesThe problemof data classification can be stated as follows the learning goalis first to find the classifier structure that best matches119863 andestimate the parameters using the training data set119863 then toassign class label to test instances Since119866 is a directed acyclicgraph it can be represented by a binary node-node adjacencymatrix119883 = (119909
119894119895
) Entry (119894 119895) is 1 if there is a directed arc fromnode 119894 to node 119895 and 0 otherwise That is
119909119894119895
= 1 if 119881
119894
997888rarr 119881119895
isin 119864
0 if 119881119894
997888rarr 119881119895
notin 119864(2)
Let 119877 = 119883 + 1198832
+ sdot sdot sdot + 119883119899 be the sum of powers of the
adjacency matrix Entry 119903119894119895
isin 119877 is equal to the number ofdirected paths from node 119881
119894
to node 119881119895
in the graph [25]We wish to be able to use a mathematical programming
formulation and this formulation requires that we are able tomeasure the impact of adding or removing a single arc fromthe network In order to approximate the impact of addingsuch an arc we define the dependence coefficient
Definition 2 Given a data set 119863 and a variable set V = 1198811
1198812
119881119899
we define the dependence coefficient 119888119894119895120572
betweenvariables119881
119894
and119881119895
as 119888119894119895120572
= min119896 = 119894119895
1198802
119894119895|119896
minus1205942
119894119895|119896120572
where1198802119894119895|119896
is the 1198802 statistics of 119881119894
and 119881119895
given 119881119896
1205942119894119895|119896120572
is the criticalvalue at the significance level 120572 of a 1205942 distribution with (119903
119894
minus
1)(119903119895
minus 1)119903119896
degrees of freedom
Obviously 119888119894119895120572
is a conservative estimate of the degree ofdependence between two nodes If 119888
119894119895120572
gt 0 then regardless
of the other variable involved there is statistically significantdependence between 119881
119894
and 119881119895
so there should be an arcbetween them If 119888
119894119895120572
lt 0 then there is at least one way ofconditioning the relationship so that significant dependenceis not present We define 119862 = (119888
119894119895
) the dependence coefficientmatrix corresponding to the variable set V that is
119888119894119895
= 119888119894119895120572
if 119894 = 119895
0 otherwise(3)
Lemma 3 Given a data set 119863 and a variable set V 119881119894
and 119881119895
are locally conditionally independent at the significance level 120572if and only if there is a node 119881
119896
isin V such that 1198802119894119895|119896
lt 1205942
119894119895|119896120572
The proof of Lemma 3 can be obtained directly byDefinition 2 and chi-square hypothesis test According toLemma 3 119881
119894
and 119881119895
are locally conditionally independentat the significance level 120572 if and only if there is a node119881119896
isin V such that 119888119894119895
lt 0 Further 119881119894
and 119881119895
are globallyconditionally independent at the significance level 120572 if andonly if 1198802
119894119895|119896
lt 1205942
119894119895|119896120572
for any 119896 = 119894 119895 Based on this we usethe dependence coefficients to construct an overall measureof the dependence which will be treated as the objectivefunction for our mathematical program
Definition 4 For a Bayesian classifier with adjacency matrix119883 = (119909
119894119895
) the global dependence measure of the network isgiven by
F (119883 120572) =
119899
sum
119894=1
119899
sum
119895=1119895 = 119894
119888119894119895
119909119894119895
(4)
According to the measure of Definition 4 if119881119894
and119881119895
areconditionally independent by Lemma 3 119888
119894119895
lt 0 and henceadding an arc between 119881
119894
and 119881119895
decreases the value of FThus we wish to find the feasible solution which increasesF The optimal solution corresponds to the best classifierstructure We next explain what constitutes feasible network
Given the variable set V = 1198811
1198812
119881119899
1198811
is the classnode and 119881
119894
119894 = 2 119899 is the set of attribute nodes Adirected network is a feasible classifier structure if and onlyif the following conditions are satisfied
(1) for any attribute node 119881119894
isin V 119894 = 2 119899 there is nodirected edge from 119881
119894
to 1198811
(2) for any node 119881
119894
isin V 119894 = 1 2 119899 there is nodirected path from 119881
119894
to 119881119894
namely the graph isacyclic
(3) there exists at least one attribute node 119881119894
isin V 119894 =2 119899 which is dependent with class node 119881
1
namely there is an attribute node 119881
119894
such that 119881119894
canbe reached from 119881
1
by a directed path
In order to incorporate the requirements of the abovethree conditions into a mathematical programming formu-lation we express them by the following constrains
(1) sum119899119894=2
1199091198941
= 0
4 Mathematical Problems in Engineering
(1) Input Data set119863 Variable set V = (1198811
1198812
119881119899
) (1198811
is the class node and others are attributenodes)
(2) For any pair of variable 119881119894
and 119881119895
contained in V calculate the dependence coefficient 119888119894119895
byDefinition 2
(3) Solve the mathematical programming (OM) and obtain the optimal solution119883lowast = (119909119894119895
)(4) Build the classifier structure 119866lowast = (V Elowast) by119883lowast = (119909
119894119895
)(5) For any variable 119881
119894
isin V 119894 = 1 if there is a subset Z sub V 1198811
119881119894
such that Z d-separates 119881119894
and1198811
then delete 119881119894
in 119866lowast update 119866lowast as V = V 119881119894
Elowast = Elowast 119881119894
rarr 119881119895
or 119881119895
rarr 119881119894
119881119895
isin adj(119881119894
)(6) Output The built classifier 119866lowast = (V Elowast)
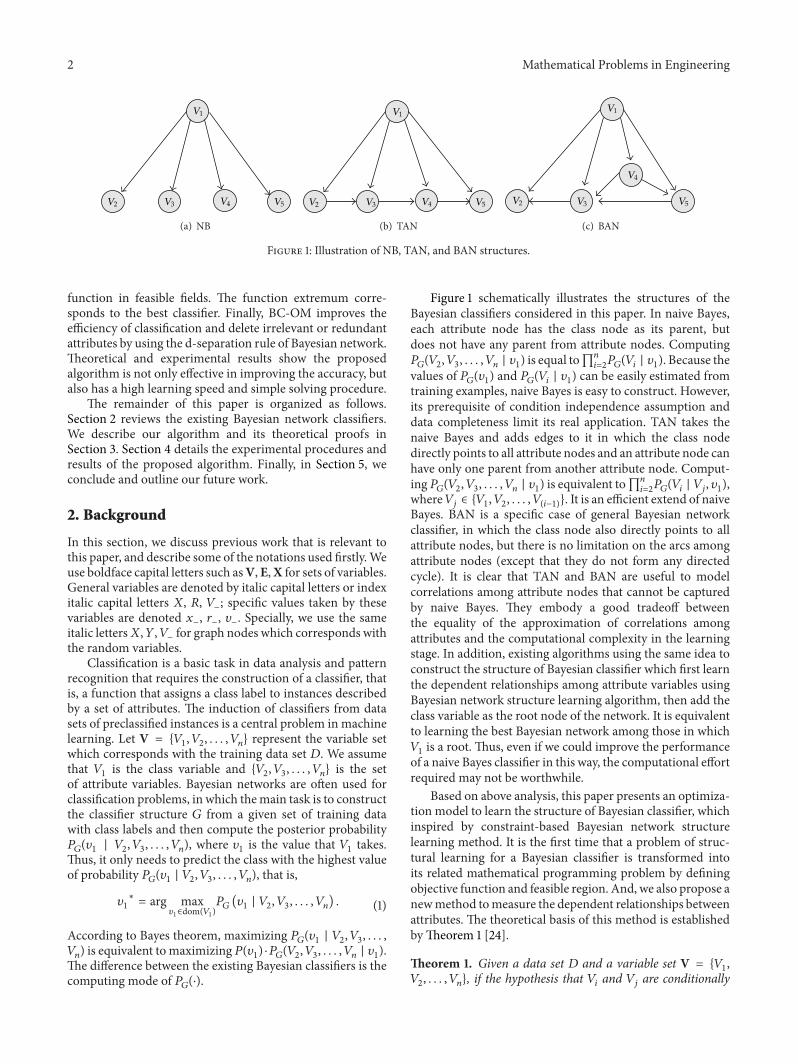
Algorithm 1 BC-OM
(2) sum119899119894=1
119903119894119894
= 0(3) sum119899119895=2
1199031119895
ge 1
The feasible classifiers are those that satisfy constrains (1)ndash(3)Thus learning best Bayesian classifier can be transformedinto the following related mathematical programming prob-lem where the objective function is a global dependencemeasure of the network and the feasible region is the set ofclassifiers with reachability constrains (1)ndash(3) that is
max F (119883 120572) =
119899
sum
119894=1
119899
sum
119895=1119895 = 119894
119888119894119895
119909119894119895
st119899
sum
119894=2
1199091198941
= 0
119899
sum
119894=1
119903119894119894
= 0
119899
sum
119895=2
1199031119895
ge 1
119909119894119895
isin 0 1
(OM)
32 BC-OMAlgorithmand Its Correctness In this subsectionwe present the main algorithm of this paper Our methodstarts with finding the best Bayesian classifier by solving theabove optimization model Second we use the d-separationrule of Bayesian network to delete irrelevant or redundantattributes in the network which have low dependence degreewith the class variable The parameters of modified networkcan be estimated Third classification is done by applyingobtained classifier to predict the class label of test dataWe prove the correctness of proposed method under thefaithfulness assumption for the data distribution
Given a directed acyclic graph 119866 = (VE) where V is thenode set and E the set of directed edges A path 120588 betweentwo distinct nodes 119881
1
and 119881119897
is a sequence of distinct nodesin which the first node is 119881
1
the last one is 119881119897
and twoconsecutive nodes are connected by an edge that is 120588 =
1198811
1198901
1198812
sdot sdot sdot 119890119897minus1
119881119897
where 119890119894
denotes 119881119894
rarr 119881119894+1
or 119881119894
larr 119881119894+1
for 119894 = 1 2 (119897 minus 1)
Definition 5 A path 120588 is said to be d-separated by a set Z in adirected acyclic graph 119866 if and only if (1) 120588 contains a ldquohead-to-tail meetingrdquo 119881
119894
rarr 119881119895
rarr 119881119896
or a ldquotail-to-tail meetingrdquo119881119894
larr 119881119895
rarr 119881119896
such that the middle node 119881119895
is in Z or (2) 120588
contains a ldquohead-to-head meetingrdquo119881119894
rarr 119881119895
larr 119881119896
such thatthe middle node 119881
119895
is not in Z and no descendant of 119881119895
is inZ Specially two distinct sets of nodes X and Y are said to bed-separated by a set Z in 119866 if Z d-separates every path fromany node in X to any node in Y [26]
In this paper we assume that all the distributions arecompatible with 119866 [27] We also assume that all indepen-dencies of a probability distribution of variables in V canbe checked by d-separations of 119866 called the faithfulnessassumption [26] The faithfulness assumption means thatall independencies and conditional independencies amongvariables can be represented by 119866 Now we formally describeour method in the following Algorithm 1
From the detailed steps of BC-OM we can see that BC-OM classifier relaxes the restrictions on condition variableand further meets the need of practical application Since itsnetwork structure is similar to that of BANrsquos BC-OM doesnot need to build all possible networks in which class nodeis a root and removes irrelevant or redundant nodes fromthe network before the process of estimating the networkparameters which greatly reduces the calculation for poste-rior probability of class variable In fact the training processof BC-OM is different from other BN classifiers Its main taskis to solve the mathematical programming (OM) To createthe dependence coefficient matrix corresponding to (OM)BC-OM needs to compute the conditional statistics 1198802
119894119895|119896
Moreover just as other constraint based algorithms themaincost of BC-OM is the number of conditional independencetests for computing the dependence coefficients of any twovariables in step 2 The number of conditional independencetests is 1198622
119899
sdot 1198621
119899minus2
and the computing complexity is 119874(1198993)The total complexity of BC-OM is bound by 119874(1198993 sdot 119873)where 119899 is the number of variables in the network and 119873is the number of cases in data set 119863 In principle BC-OM is a structure-extension-based algorithm In BC-OMwe essentially extend the structure of TAN by relaxing theparent set of each attribute nodeThus the resulting structureis more complex than TAN but more simple than BANTherefore BC-OM is a good tradeoff between the modelcomplexity and accuracy compared with TAN and BANNext we prove the correctness of BC-OM algorithm underthe faithfulness assumption
The next two results establish the existence and unique-ness properties of solution to (OM)
Mathematical Problems in Engineering 5
Theorem 6 Let X = (119909119894119895
)119899times119899
| 119909119894119895
isin 0 1 There alwaysexists an119883 isin X such that 119883 is a feasible point of (OM)
Proof Given the set of variables119881 = 1198811
1198812
119881119899
where1198811
is the class variable and 1198812
119881119899
are the attribute variablesWe give a matrix119883 as follows
119909119894119895
= 1 119894 = 1 119895 = 2 119899
0 otherwise(5)
Obviously the adjacency matrix 119883 always satisfies the con-strains (1)ndash(3) In fact the graph represented by119883 is theNaiveBayes classifier Thus119883 is a feasible solution of (OM)
According to Theorem 6 we can prove that there exists afeasible classifier which satisfy constrains (1)ndash(3) Theorem 7further shows that such classifier is unique under certaincondition
Theorem 7 Let 119883lowast be the optimal solution of (OM) 1198621
=
119888119894119895
| 119909119894119895
= 1 and 1198622
= 119888119894119895
| 119909119894119895
= 0 be the coefficientsets where 119909
119894119895
is the element of119883lowast119883lowast is the unique solution of(OM) if and only if any element in 119862
1
cannot be expressed asthe sum of any number of elements in 119862
2
Proof Without loss of generality we suppose by reductionto absurdity that 119883(1) and 119883(2) are two optimal solutions of(OM)The values of the objective function is the same in bothsolutions that is
119899
sum
119894=1
119899
sum
119895=1119895 = 119894
119888119894119895
119909(1)
119894119895
=
119899
sum
119894=1
119899
sum
119895=1119895 = 119894
119888119894119895
119909(2)
119894119895
(6)
997904rArr
119899
sum
119894=1
119899
sum
119895=1119895 = 119894
119888119894119895
(119909(1)
119894119895
minus 119909(2)
119894119895
) = 0 (7)
Let 119862(1)1
= 119888119894119895
| 119909(1)
119894119895
= 1 119862(1)2
= 119888119894119895
| 119909(1)
119894119895
= 0 Accordingto the assumption of 119883(1) = 119883(2) and 119909(1)
119894119895
119909(2)119894119895
isin 0 1 theremust exist 1 le 119894
0
1198950
le 119899 such that 119909(1)119894
0119895
0
minus 119909(2)
119894
0119895
0
= 1 namely119909(1)
119894
0119895
0
= 1 119909(2)
119894
0119895
0
= 0 Then by (7)
119888119894
0119895
0
+ sum
119894 = 119894
0
sum
119895 = 119895
0
119888119894119895
(119909(1)
119894119895
minus 119909(2)
119894119895
) = 0 (8)
Since
119909(1)
119894119895
minus 119909(2)
119894119895
=
1 119909(1)
119894119895
= 1 119909(2)
119894119895
= 0
0 119909(1)
119894119895
= 119909(2)
119894119895
minus1 119909(1)
119894119895
= 0 119909(2)
119894119895
= 1
(9)
then by (8) there must exist 119888119894
1119895
1
119888119894
119896119895
119896
isin 119862(1)
2
such that119909(1)
119894
119903119895
119903
minus119909(2)
119894
119903119895
119903
= minus1 119903 = 1 119896 and 119888119894
0119895
0
+sum119896
119903=1
119888119894
119903119895
119903
(119909(1)
119894
119903119895
119903
minus119909(2)
119894
119903119895
119903
) =
0 namely
119888119894
0119895
0
=
119896
sum
119903=1
119888119894
119903119895
119903
(10)
where 119909(1)119894
0119895
0
= 1 119909(1)
119894
119903119895
119903
= 0 119903 = 1 119896 This contradictswith the known condition that any element in 119862(1)
1
cannot beexpressed as the sum of any number of elements in 119862(1)
2
Theorem 8 Let 119866 = (VE) V = (1198811
1198812
119881119899
) be theclassifier structure obtained by step 4 of BC-OM where 119881
1
is the class variable and 1198812
119881119899
are attribute variables119866lowast
= (VlowastElowast) denotes the final output of BC-OM then theclassification results obtained by 119866 and 119866lowast are consistent
Proof Without loss of generality suppose (1198891198942
119889119894119899
) is anexample to be classified The classifier represented by 119866 isgiven as follows
119907lowast
1
= arg max119907
1isindom(119881
1)
119901 (1199071
| 1199072
= 1198891198942
119907119899
= 119889119894119899
) (11)
We write the right side of (11) as 119901(1199071
| 1199072
119907119899
) in shortWe can suppose that 119896 redundant variables were deleted instep 5 of BC-OM say the last 119896 variables 119881
119899minus119896+1
119881119899minus119896+2
119881119899
Then Vlowast = 1198811
1198812
119881119899minus119896
According to step 51198812
119881119899minus119896
d-separates 1198811
and 119881119899minus119896+1
119881119899
Thus1198811
is conditional independent with 119881119899minus119896+1
119881119899
given1198812
119881119899minus119896
Equation (11) can be reduced as follows
119907lowast
1
= arg max119907
1isindom(119881
1)
119901 (1199071
1199072
119907119899
)
119901 (1199072
119907119899
)
lArrrArr 119907lowast
1
= arg max119907
1isindom(119881
1)
119901 (1199071
1199072
119907119899
)
lArrrArr 119907lowast
1
= arg max119907
1isindom(119881
1)
119901 (1199071
119907119899minus119896+1
119907119899
| 1199072
119907119899minus119896
)
sdot 119901 (1199072
119907119899minus119896
)
lArrrArr 119907lowast
1
= arg max119907
1isindom(119881
1)
119901 (1199071
| 1199072
119907119899minus119896
)
sdot 119901 (119907119899minus119896+1
119907119899
| 1199072
119907119899minus119896
)
lArrrArr 119907lowast
1
= arg max119907
1isindom(119881
1)
119901 (1199071
| 1199072
119907119899minus119896
)
(12)
We get the results
Theorem 8 reveals that it is effective and correct to removeredundant or irrelevant attributes using d-separation ruleand the performance of Bayesian classifier can be improved
4 Experimental Results
We run our experiments on 20 data sets from the UCI repos-itory of Machine Learning datasets [28] which represent awide range of domains and data characteristics Table 1 showsthe description of the 20 data sets which are ordered byascending number of samples In our experiments missingvalues are replaced with the modes and means of thecorresponding attribute values from the available data Forexample if the sex of someone is missing it can be replacedby the mode (the value with the highest frequency) of thesexes of all the others Besides we manually delete three
6 Mathematical Problems in Engineering
Table 1 Descriptions of UCI datasets used in the experiments
NO Dataset Instances Attributes Classes Missing value (NY)1 Shuttle 15 6 2 N2 Balloon 16 4 2 N3 Lenses 24 4 3 N4 Soybean (small) 47 35 4 N5 Post-patient 90 8 3 Y6 Zoo 101 17 7 N7 Hayes-roth 132 5 3 N8 Iris 150 4 3 N9 Glass 214 10 7 N10 Heart 267 22 2 N11 Ionosphere 351 34 2 N12 Monkrsquos 432 7 2 N13 Vote 435 16 2 Y14 Balance-scale 625 5 3 N15 Tic-tac-toe 958 9 2 N16 Car-evaluation 1728 6 4 N17 Chess (kr-vs-kp) 3196 36 2 N18 Mushroom 8124 22 2 Y19 Nursery 12960 8 5 N20 Letter 20000 16 26 N
useless attributes the attribute ldquoID numberrdquo in the datasetldquoGlassrdquo the attribute ldquonamerdquo in the dataset ldquoHayes-rothrdquo andthe attribute ldquoanimal namerdquo in the dataset ldquoZoordquo
The experimental platform is a personal computer withPentium 4 306GHz CPU 099GB memory and WindowsXP Our implementation is based on the BayesNet Toolboxfor Matlab [29] which provides source code to performseveral operations on Bayesian networks The purpose ofthese experiments is to compare the performance of theproposed BC-OM with Naive Bayes TAN and BAN in termsof classifier accuracy The accuracy of each model is basedon the percentage of successful predictions on the test setsof each data set In all experiments the accuracy of eachmodel on each data set are obtained via 10 runs of 5-fold crossvalidation Runs with the various algorithms are carried outon the same training sets and evaluated on the same test setsIn particular the cross-validation folds are the same for all theexperiments on each data set Finally we compared relatedalgorithms via two-tailed 119905-test with a 95 percent confidencelevel According to the statistical theory we speak of tworesults for a data set as being ldquosignificantly differentrdquo only ifthe probability of significant difference is at least 95 percent[30]
Table 2 shows the accuracy (and standard deviation ofaccuracy) of each model on each data set and the averagevalues and standard deviation on all data sets are summarizedat the bottom of the table In each row the best of thefour classifier results are displayed in bold If anotherrsquosperformance is not significantly different from the best itis also highlighted but if the differences between all fourclassifies are not statistically significant then none of them
is highlighted From our experiments we can see that BC-OM is best in 6 cases NB TAN and BAN are best in 65 and 3 cases respectively When the number of samples islarger than 400 the performance of TAN and BAN is betterthan that of NB and BC-OM is best Although it can be seenthat the performance of BC-OM and TAN becomes similaras the sample size increase BC-OM has a higher accuracyon average From a general point of view we can see thatfrom the first data set to the last one the highlighted numberschange from few to even more in the sixth column of Table 2It means the advantage of BC-OM is more evident with theincrease of data size
Table 3 shows the compared results of two-tailed 119905-testin which each entry 119908119905119897 means that the model in thecorresponding row wins in 119908 data sets ties in 119905 data setsand loses in 119897 data sets compared to the model in thecorresponding column From Table 3 we can see that BC-OM significantly outperforms NB (9 wins and 4 losses)TAN (12 wins and 5 losses) and BAN (11 wins and 5 losses)in accuracy Figures 2 3 and 4 show two scatter-plotscomparing BC-OMwith NB TAN and BAN respectively Inthe scatter plot each point represents a data set where the 119909coordinate of a point is the percentage of misclassificationsaccording to NB or TAN or BAN and the 119910 coordinate isthe percentage of misclassifications according to BC-OMThus points below the diagonal line correspond to datasets on which BC-OM performs better From Figures 2and 3 we can see that BC-OM generally outperforms NBand TAN as is also demonstrated in Table 3 It providesstrong evidence that BC-OM is performing well against theother two classifiers both in terms of accuracy as well as
Mathematical Problems in Engineering 7
Table 2 The detailed experimental results on accuracy and standard deviation
NO Dataset NB TAN BAN BC-OM1 Shuttle 8352 plusmn 585 8533 plusmn 703 8443 plusmn 683 8233 plusmn 594
2 Balloon 8915 plusmn 306 8516 plusmn 315 8716 plusmn 292 8375 plusmn 357
3 Lenses 9256 plusmn 244 9325 plusmn 285 8967 plusmn 316 9112 plusmn 302
4 Soybean (small) 9091 plusmn 235 8498 plusmn 316 8736 plusmn 244 8974 plusmn 323
5 Post-patient 8029 plusmn 339 7994 plusmn 347 8126 plusmn 356 8012 plusmn 348
6 Zoo 9346 plusmn 512 9521 plusmn 478 9434 plusmn 516 9488 plusmn 509
7 Hayes-roth 8182 plusmn 527 8734 plusmn 489 8458 plusmn 374 8455 plusmn 356
8 Iris 9413 plusmn 612 9347 plusmn 665 9381 plusmn 680 8907 plusmn 725
9 Glass 6602 plusmn 988 5967 plusmn 952 5832 plusmn 998 5696 plusmn 981
10 Heart 8241 plusmn 662 8253 plusmn 701 8265 plusmn 703 8153 plusmn 691
11 Ionosphere 9054 plusmn 403 9061 plusmn 398 9145 plusmn 414 9099 plusmn 48212 Monkrsquos 8428 plusmn 114 8329 plusmn 129 8379 plusmn 123 8664 plusmn 10213 Vote 9488 plusmn 357 9037 plusmn 334 9263 plusmn 398 9097 plusmn 295
14 Balance-scale 9091 plusmn 151 8497 plusmn 244 8794 plusmn 231 9077 plusmn 18515 Tic-tac-toe 7011 plusmn 445 7316 plusmn 447 7574 plusmn 483 7621 plusmn 38216 Car-evaluation 8495 plusmn 274 9344 plusmn 189 892 plusmn 102 9542 plusmn 10317 Chess (kr-vs-kp) 8788 plusmn 191 9168 plusmn 166 9027 plusmn 112 9265 plusmn 1418 Mushroom 9285 plusmn 056 9989 plusmn 01 9637 plusmn 076 9991 plusmn 0119 Nursery 9054 plusmn 114 9407 plusmn 129 9231 plusmn 123 8995 plusmn 109
20 Letter 6932 plusmn 397 7758 plusmn 183 7345 plusmn 167 7766 plusmn 201Average 8685 plusmn 481 8663 plusmn 37 8569 plusmn 369 8676 plusmn 357
Table 3 The compared results of two-tailed 119905-test on accuracy withthe 95 percent confidence level
119908119905119897 NB TAN BANTAN 1334 mdash mdashBAN 1244 1055 mdashBC-OM 974 1235 1145
the percentage of misclassifications Figure 4 also shows BC-OM outperforming BAN though the difference in perfor-mance is not as marked as in the results of Figures 2 and 3 Inother words the performance of BC-OM and BAN is similarin terms of the percentage ofmisclassificationsHowever BC-OMhas a higher accuracy and amore simple graph structurewhich suggests that BC-OM is able to handle very large datasets and is a more promising classifier
5 Conclusions
In many real-world applications classification is oftenrequired to make optimal decisions In this paper we sum-marize the existing improved algorithms for naive Bayesand propose a novel Bayesian classifier model BC-OM Weconducted a systematic experimental study on a number ofUCI datasetsThe experimental results show that BC-OMhasa better performance compared to the other state-of-the-artmodels for augmenting naive Bayes It is clear that in somesituations it would be useful to model correlations among
0 5 10 15 20 25 30 35 40 45 500
5
10
15
20
25
30
35
40
45
50
BC
-OM
err
or
NB error
Figure 2 Relative errors of BC-OM and NB
attributes BC-OM is a good tradeoff between the quality ofthe approximation of correlations among attributes and thecomputational complexity in the learning stage Consideringits simplicity BC-OM is a promisingmodel that could be usedin many field
In addition we use the chi-squared statistic to estimatethe dependence coefficients among attributes from datasetWe believe that the use of more sophisticated methods couldimprove the performance of the current BC-OM and make
8 Mathematical Problems in Engineering
0 5 10 15 20 25 30 35 40 45 500
5
10
15
20
25
30
35
40
45
50
TAN error
BC
-OM
err
or
Figure 3 Relative errors of BC-OM and TAN
BC
-OM
err
or
0
5
10
15
20
25
30
35
40
45
50
0 5 10 15 20 25 30 35 40 45 50
BAN error
Figure 4 Relative errors of BC-OM and BAN
its advantage stronger This is the main research direction forour future work
Acknowledgments
This work was supported by the National Natural ScienceFoundation of China (nos 60974082 and 61075055) theNational Funds of China for Young Scientists (no 11001214)and the Fundamental Research Funds for the Central Univer-sities (no K5051270013)
References
[1] Z Cai S Sun S Si and B Yannou ldquoIdentifying product failurerate based on a conditional Bayesian network classifierrdquo ExpertSystems with Applications vol 38 no 5 pp 5036ndash5043 2011
[2] D C Kim X Wang C R Yang and J Gao ldquoLearningbiological network using mutual information and conditionalindependencerdquo BMC Bioinformatics vol 11 no 3 article S92010
[3] N C Hsieh and L P Hung ldquoA data driven ensemble classifierfor credit scoring analysisrdquo Expert Systems with Applicationsvol 37 no 1 pp 534ndash545 2010
[4] S Mukherjee and N Sharma ldquoIntrusion detection using naiveBayes classifier with feature reductionrdquo Procedia Technologyvol 4 pp 119ndash128 2012
[5] Y Sun Y Y Tang S XDing S P Lv andY F Cui ldquoDiagnose themild cognitive impairment by constructing Bayesian networkwithmissing datardquo Expert Systems with Applications vol 38 no1 pp 442ndash449 2011
[6] V Aquaro M Bardoscia R Bellotti A Consiglio F de Carloand G Ferri ldquoA Bayesian networks approach to operationalriskrdquo Physica A vol 389 no 8 pp 1721ndash1728 2010
[7] S Nikolajewa R Pudimat M Hiller M Platzer and RBackofen ldquoBioBayesNet a web server for feature extractionand Bayesian network modeling of biological sequence datardquoNucleic acids research vol 35 pp W688ndash693 2007
[8] I Ben-Gal A Shani A Gohr et al ldquoIdentification of transcrip-tion factor binding siteswith variable-order BayesiannetworksrdquoBioinformatics vol 21 no 11 pp 2657ndash2666 2005
[9] N Friedman D Geiger andMGoldszmidt ldquoBayesian networkclassifiersrdquoMachine Learning vol 29 no 2-3 pp 131ndash163 1997
[10] P Langley W Iba and K Thompson ldquoAn analysis of Bayesianclassifiersrdquo in Proceedings of the 10th National Conference onArtificial Intelligence P Rosenbloom and P Szolovits Eds pp223ndash228 AAAI Press Menlo Park Calif USA 1992
[11] M Minsky ldquoSteps toward artificial intelligencerdquo Proceedings ofthe Institute of Radio Engineers vol 49 pp 8ndash30 1961
[12] L Jiang H Zhang and Z Cai ldquoA novel bayes model hiddennaive bayesrdquo IEEE Transactions on Knowledge and Data Engi-neering vol 21 no 10 pp 1361ndash1371 2009
[13] A A Balamurugan R Rajaram S Pramala S Rajalakshmi CJeyendran and J Dinesh Surya Prakash ldquoNB+ an improvedNaive Bayesian algorithmrdquo Knowledge-Based Systems vol 24no 5 pp 563ndash569 2011
[14] L Jiang Z Cai D Wang and H Zhang ldquoImproving treeaugmented naive Bayes for class probability estimationrdquo Know-ledge-Based Systems vol 26 pp 239ndash245 2012
[15] J Cheng and R Greiner ldquoComparing Bayesian network clas-sifiersrdquo in Proceedings of the 15th Conference on Uncertainty inArtificial Intelligence K B Laskey and H Prade Eds pp 101ndash108 Morgan Kaufmann San Francisco Calif USA 1999
[16] M G Madden ldquoOn the classification performance of TAN andgeneral Bayesian networksrdquo Knowledge-Based Systems vol 22no 7 pp 489ndash495 2009
[17] J Pearl Probabilistic Reasoning in Intelligent Systems MorganKaufmann San Francisco Calif USA 1988
[18] D M Chickering ldquoLearning Bayesian networks is NP-Com-pleterdquo inLearning FromData Artificial Intelligence and StatisticsV D Fisher and H Lenz Eds pp 121ndash130 Springer New YorkNY USA 1996
[19] C Borgelt ldquoA conditional independence algorithm for learningundirected graphical modelsrdquo Journal of Computer and SystemSciences vol 76 no 1 pp 21ndash33 2010
[20] A M MartacuteJnez-RodracuteJguez J H May and L G VargasldquoAn optimization-based approach for the design of Bayesiannetworksrdquo Mathematical and Computer Modelling vol 48 no7-8 pp 1265ndash1278 2008
[21] L M de Campos ldquoA scoring function for learning Bayesiannetworks based on mutual information and conditional inde-pendence testsrdquo Journal ofMachine Learning Research vol 7 pp2149ndash2187 2006
Mathematical Problems in Engineering 9
[22] X W Chen G Anantha and X T Lin ldquoImproving bayesiannetwork structure learning with mutual information-basednode ordering in the K2 algorithmrdquo IEEE Transactions onKnowledge and Data Engineering vol 20 no 5 pp 628ndash6402008
[23] W J Conover Practical Nonparametric Statistics John Wiley ampSons New York NY USA 1999
[24] S Kullback Information Theory and Statistics Dover 1968[25] G Chartrand and P Zhang Introduction to Graph Theory
McGraw-Hill New York NY USA 2005[26] R E Neapolitan Learning Bayesian Networks Prentice Hall
Englewood Cliffs NJ USA 2004[27] DM Chickering andCMeek ldquoOn the incompatibility of faith-
fulness and monotone DAG faithfulnessrdquo Artificial Intelligencevol 170 no 8-9 pp 653ndash666 2006
[28] A Frank and A Asuncion UCI Machine Learning RepositoryUniversity of California School of Information and ComputerScience Irvine Calif USA 2010 httparchiveicsucieduml
[29] K P Murphy BaysNetToolbox For Matlab 2007 httpscodegooglecompbnt
[30] J Demsar ldquoStatistical comparisons of classifiers over multipledata setsrdquo Journal of Machine Learning Research vol 7 pp 1ndash302006
Submit your manuscripts athttpwwwhindawicom
Hindawi Publishing Corporationhttpwwwhindawicom Volume 2014
MathematicsJournal of
Hindawi Publishing Corporationhttpwwwhindawicom Volume 2014
Mathematical Problems in Engineering
Hindawi Publishing Corporationhttpwwwhindawicom
Differential EquationsInternational Journal of
Volume 2014
Applied MathematicsJournal of
Hindawi Publishing Corporationhttpwwwhindawicom Volume 2014
Probability and StatisticsHindawi Publishing Corporationhttpwwwhindawicom Volume 2014
Journal of
Hindawi Publishing Corporationhttpwwwhindawicom Volume 2014
Mathematical PhysicsAdvances in
Complex AnalysisJournal of
Hindawi Publishing Corporationhttpwwwhindawicom Volume 2014
OptimizationJournal of
Hindawi Publishing Corporationhttpwwwhindawicom Volume 2014
CombinatoricsHindawi Publishing Corporationhttpwwwhindawicom Volume 2014
International Journal of
Hindawi Publishing Corporationhttpwwwhindawicom Volume 2014
Operations ResearchAdvances in
Journal of
Hindawi Publishing Corporationhttpwwwhindawicom Volume 2014
Function Spaces
Abstract and Applied AnalysisHindawi Publishing Corporationhttpwwwhindawicom Volume 2014
International Journal of Mathematics and Mathematical Sciences
Hindawi Publishing Corporationhttpwwwhindawicom Volume 2014
The Scientific World JournalHindawi Publishing Corporation httpwwwhindawicom Volume 2014
Hindawi Publishing Corporationhttpwwwhindawicom Volume 2014
Algebra
Discrete Dynamics in Nature and Society
Hindawi Publishing Corporationhttpwwwhindawicom Volume 2014
Hindawi Publishing Corporationhttpwwwhindawicom Volume 2014
Decision SciencesAdvances in
Discrete MathematicsJournal of
Hindawi Publishing Corporationhttpwwwhindawicom
Volume 2014 Hindawi Publishing Corporationhttpwwwhindawicom Volume 2014
Stochastic AnalysisInternational Journal of
2 Mathematical Problems in Engineering
V2 V3
V1
V4 V5
(a) NB
V2 V3
V1
V4 V5
(b) TAN
V2 V3
V1
V4
V5
(c) BAN
Figure 1 Illustration of NB TAN and BAN structures
function in feasible fields The function extremum corre-sponds to the best classifier Finally BC-OM improves theefficiency of classification and delete irrelevant or redundantattributes by using the d-separation rule of Bayesian networkTheoretical and experimental results show the proposedalgorithm is not only effective in improving the accuracy butalso has a high learning speed and simple solving procedure
The remainder of this paper is organized as followsSection 2 reviews the existing Bayesian network classifiersWe describe our algorithm and its theoretical proofs inSection 3 Section 4 details the experimental procedures andresults of the proposed algorithm Finally in Section 5 weconclude and outline our future work
2 Background
In this section we discuss previous work that is relevant tothis paper and describe some of the notations used firstlyWeuse boldface capital letters such asVEX for sets of variablesGeneral variables are denoted by italic capital letters or indexitalic capital letters 119883 119877 119881
minus
specific values taken by thesevariables are denoted 119909
minus
119903minus
119907minus
Specially we use the sameitalic letters119883119884119881
minus
for graph nodes which corresponds withthe random variables
Classification is a basic task in data analysis and patternrecognition that requires the construction of a classifier thatis a function that assigns a class label to instances describedby a set of attributes The induction of classifiers from datasets of preclassified instances is a central problem in machinelearning Let V = 119881
1
1198812
119881119899
represent the variable setwhich corresponds with the training data set 119863 We assumethat 119881
1
is the class variable and 1198812
1198813
119881119899
is the setof attribute variables Bayesian networks are often used forclassification problems in which themain task is to constructthe classifier structure 119866 from a given set of training datawith class labels and then compute the posterior probability119875119866
(1199071
| 1198812
1198813
119881119899
) where 1199071
is the value that 1198811
takesThus it only needs to predict the class with the highest valueof probability 119875
119866
(1199071
| 1198812
1198813
119881119899
) that is
1199071
lowast
= arg max119907
1isindom(119881
1)
119875119866
(1199071
| 1198812
1198813
119881119899
) (1)
According to Bayes theorem maximizing 119875119866
(1199071
| 1198812
1198813
119881119899
) is equivalent to maximizing119875(1199071
) sdot119875119866
(1198812
1198813
119881119899
| 1199071
)The difference between the existing Bayesian classifiers is thecomputing mode of 119875
119866
(sdot)
Figure 1 schematically illustrates the structures of theBayesian classifiers considered in this paper In naive Bayeseach attribute node has the class node as its parent butdoes not have any parent from attribute nodes Computing119875119866
(1198812
1198813
119881119899
| 1199071
) is equal toprod119899119894=2
119875119866
(119881119894
| 1199071
) Because thevalues of 119875
119866
(1199071
) and 119875119866
(119881119894
| 1199071
) can be easily estimated fromtraining examples naive Bayes is easy to construct Howeverits prerequisite of condition independence assumption anddata completeness limit its real application TAN takes thenaive Bayes and adds edges to it in which the class nodedirectly points to all attribute nodes and an attribute node canhave only one parent from another attribute node Comput-ing119875119866
(1198812
1198813
119881119899
| 1199071
) is equivalent toprod119899119894=2
119875119866
(119881119894
| 119881119895
1199071
)where119881
119895
isin 1198811
1198812
119881(119894minus1)
It is an efficient extend of naiveBayes BAN is a specific case of general Bayesian networkclassifier in which the class node also directly points to allattribute nodes but there is no limitation on the arcs amongattribute nodes (except that they do not form any directedcycle) It is clear that TAN and BAN are useful to modelcorrelations among attribute nodes that cannot be capturedby naive Bayes They embody a good tradeoff betweenthe equality of the approximation of correlations amongattributes and the computational complexity in the learningstage In addition existing algorithms using the same idea toconstruct the structure of Bayesian classifier which first learnthe dependent relationships among attribute variables usingBayesian network structure learning algorithm then add theclass variable as the root node of the network It is equivalentto learning the best Bayesian network among those in which1198811
is a root Thus even if we could improve the performanceof a naive Bayes classifier in this way the computational effortrequired may not be worthwhile
Based on above analysis this paper presents an optimiza-tion model to learn the structure of Bayesian classifier whichinspired by constraint-based Bayesian network structurelearning method It is the first time that a problem of struc-tural learning for a Bayesian classifier is transformed intoits related mathematical programming problem by definingobjective function and feasible region And we also propose anewmethod tomeasure the dependent relationships betweenattributes The theoretical basis of this method is establishedbyTheorem 1 [24]
Theorem 1 Given a data set 119863 and a variable set V = 1198811
1198812
119881119899
if the hypothesis that 119881119894
and 119881119895
are conditionally
Mathematical Problems in Engineering 3
independent given 119881119896
is true then the statistics 1198802119894119895|119896
= 2sum119886119887119888
119873119886119887119888
119894119895119896
log[119873119886119887119888119894119895119896
119873119888
119896
(119873119886119888
119894119896
119873119887119888
119895119896
)] approximates to a distribution1205942
(119897) with 119897 = (119903119894
minus1)(119903119895
minus1)119903119896
degrees of freedom where 119903119894
119903119895
and 119903119896
represent the number of configurations for the variables119881119894
119881119895
and 119881119896
respectively 119873119886119887119888119894119895119896
is the number of cases in 119863where 119881
119894
= 119886 119881119895
= 119887 and 119881119896
= 119888 119873119886119888119894119896
is the number of casesin119863 where119881
119894
= 119886 and119881119896
= 119888 and119873119888119896
is the number of cases in119863 where 119881
119896
= 119888
3 A Bayesian Classifier Learning AlgorithmBased on Optimization Model
31 Optimization Model Design In this subsection we givesome basic concepts and theorems which is the foundationof the method proposed in this paper
A Bayesian classifier is a graphical representation of ajoint probability distribution that includes two componentsOne is a directed acyclic graph 119866 = (VE) where the nodeset V = 119881
1
1198812
119881119899
represents the class and attributevariables and the edge set E represents direct dependencyrelationships between variables The other is a joint probabil-ity distribution Θ = 120579
119894
| 120579119894
= 119875(119881119894
| pa(119881119894
)) 119894 = 1 2 119899
that quantifies the effects of pa(119881119894
) has on the variable 119881119894
in119866 where pa(119881
119894
) = 119881119895
| 119881119895
rarr 119881119894
isin 119864 We assumethat 119881
1
is the class node and 1198812
1198813
119881119899
is the set ofattribute nodes The structure of 119866 reflects the underlyingprobabilistic dependence relations among the nodes and a setof assertions about conditional independenciesThe problemof data classification can be stated as follows the learning goalis first to find the classifier structure that best matches119863 andestimate the parameters using the training data set119863 then toassign class label to test instances Since119866 is a directed acyclicgraph it can be represented by a binary node-node adjacencymatrix119883 = (119909
119894119895
) Entry (119894 119895) is 1 if there is a directed arc fromnode 119894 to node 119895 and 0 otherwise That is
119909119894119895
= 1 if 119881
119894
997888rarr 119881119895
isin 119864
0 if 119881119894
997888rarr 119881119895
notin 119864(2)
Let 119877 = 119883 + 1198832
+ sdot sdot sdot + 119883119899 be the sum of powers of the
adjacency matrix Entry 119903119894119895
isin 119877 is equal to the number ofdirected paths from node 119881
119894
to node 119881119895
in the graph [25]We wish to be able to use a mathematical programming
formulation and this formulation requires that we are able tomeasure the impact of adding or removing a single arc fromthe network In order to approximate the impact of addingsuch an arc we define the dependence coefficient
Definition 2 Given a data set 119863 and a variable set V = 1198811
1198812
119881119899
we define the dependence coefficient 119888119894119895120572
betweenvariables119881
119894
and119881119895
as 119888119894119895120572
= min119896 = 119894119895
1198802
119894119895|119896
minus1205942
119894119895|119896120572
where1198802119894119895|119896
is the 1198802 statistics of 119881119894
and 119881119895
given 119881119896
1205942119894119895|119896120572
is the criticalvalue at the significance level 120572 of a 1205942 distribution with (119903
119894
minus
1)(119903119895
minus 1)119903119896
degrees of freedom
Obviously 119888119894119895120572
is a conservative estimate of the degree ofdependence between two nodes If 119888
119894119895120572
gt 0 then regardless
of the other variable involved there is statistically significantdependence between 119881
119894
and 119881119895
so there should be an arcbetween them If 119888
119894119895120572
lt 0 then there is at least one way ofconditioning the relationship so that significant dependenceis not present We define 119862 = (119888
119894119895
) the dependence coefficientmatrix corresponding to the variable set V that is
119888119894119895
= 119888119894119895120572
if 119894 = 119895
0 otherwise(3)
Lemma 3 Given a data set 119863 and a variable set V 119881119894
and 119881119895
are locally conditionally independent at the significance level 120572if and only if there is a node 119881
119896
isin V such that 1198802119894119895|119896
lt 1205942
119894119895|119896120572
The proof of Lemma 3 can be obtained directly byDefinition 2 and chi-square hypothesis test According toLemma 3 119881
119894
and 119881119895
are locally conditionally independentat the significance level 120572 if and only if there is a node119881119896
isin V such that 119888119894119895
lt 0 Further 119881119894
and 119881119895
are globallyconditionally independent at the significance level 120572 if andonly if 1198802
119894119895|119896
lt 1205942
119894119895|119896120572
for any 119896 = 119894 119895 Based on this we usethe dependence coefficients to construct an overall measureof the dependence which will be treated as the objectivefunction for our mathematical program
Definition 4 For a Bayesian classifier with adjacency matrix119883 = (119909
119894119895
) the global dependence measure of the network isgiven by
F (119883 120572) =
119899
sum
119894=1
119899
sum
119895=1119895 = 119894
119888119894119895
119909119894119895
(4)
According to the measure of Definition 4 if119881119894
and119881119895
areconditionally independent by Lemma 3 119888
119894119895
lt 0 and henceadding an arc between 119881
119894
and 119881119895
decreases the value of FThus we wish to find the feasible solution which increasesF The optimal solution corresponds to the best classifierstructure We next explain what constitutes feasible network
Given the variable set V = 1198811
1198812
119881119899
1198811
is the classnode and 119881
119894
119894 = 2 119899 is the set of attribute nodes Adirected network is a feasible classifier structure if and onlyif the following conditions are satisfied
(1) for any attribute node 119881119894
isin V 119894 = 2 119899 there is nodirected edge from 119881
119894
to 1198811
(2) for any node 119881
119894
isin V 119894 = 1 2 119899 there is nodirected path from 119881
119894
to 119881119894
namely the graph isacyclic
(3) there exists at least one attribute node 119881119894
isin V 119894 =2 119899 which is dependent with class node 119881
1
namely there is an attribute node 119881
119894
such that 119881119894
canbe reached from 119881
1
by a directed path
In order to incorporate the requirements of the abovethree conditions into a mathematical programming formu-lation we express them by the following constrains
(1) sum119899119894=2
1199091198941
= 0
4 Mathematical Problems in Engineering
(1) Input Data set119863 Variable set V = (1198811
1198812
119881119899
) (1198811
is the class node and others are attributenodes)
(2) For any pair of variable 119881119894
and 119881119895
contained in V calculate the dependence coefficient 119888119894119895
byDefinition 2
(3) Solve the mathematical programming (OM) and obtain the optimal solution119883lowast = (119909119894119895
)(4) Build the classifier structure 119866lowast = (V Elowast) by119883lowast = (119909
119894119895
)(5) For any variable 119881
119894
isin V 119894 = 1 if there is a subset Z sub V 1198811
119881119894
such that Z d-separates 119881119894
and1198811
then delete 119881119894
in 119866lowast update 119866lowast as V = V 119881119894
Elowast = Elowast 119881119894
rarr 119881119895
or 119881119895
rarr 119881119894
119881119895
isin adj(119881119894
)(6) Output The built classifier 119866lowast = (V Elowast)
Algorithm 1 BC-OM
(2) sum119899119894=1
119903119894119894
= 0(3) sum119899119895=2
1199031119895
ge 1
The feasible classifiers are those that satisfy constrains (1)ndash(3)Thus learning best Bayesian classifier can be transformedinto the following related mathematical programming prob-lem where the objective function is a global dependencemeasure of the network and the feasible region is the set ofclassifiers with reachability constrains (1)ndash(3) that is
max F (119883 120572) =
119899
sum
119894=1
119899
sum
119895=1119895 = 119894
119888119894119895
119909119894119895
st119899
sum
119894=2
1199091198941
= 0
119899
sum
119894=1
119903119894119894
= 0
119899
sum
119895=2
1199031119895
ge 1
119909119894119895
isin 0 1
(OM)
32 BC-OMAlgorithmand Its Correctness In this subsectionwe present the main algorithm of this paper Our methodstarts with finding the best Bayesian classifier by solving theabove optimization model Second we use the d-separationrule of Bayesian network to delete irrelevant or redundantattributes in the network which have low dependence degreewith the class variable The parameters of modified networkcan be estimated Third classification is done by applyingobtained classifier to predict the class label of test dataWe prove the correctness of proposed method under thefaithfulness assumption for the data distribution
Given a directed acyclic graph 119866 = (VE) where V is thenode set and E the set of directed edges A path 120588 betweentwo distinct nodes 119881
1
and 119881119897
is a sequence of distinct nodesin which the first node is 119881
1
the last one is 119881119897
and twoconsecutive nodes are connected by an edge that is 120588 =
1198811
1198901
1198812
sdot sdot sdot 119890119897minus1
119881119897
where 119890119894
denotes 119881119894
rarr 119881119894+1
or 119881119894
larr 119881119894+1
for 119894 = 1 2 (119897 minus 1)
Definition 5 A path 120588 is said to be d-separated by a set Z in adirected acyclic graph 119866 if and only if (1) 120588 contains a ldquohead-to-tail meetingrdquo 119881
119894
rarr 119881119895
rarr 119881119896
or a ldquotail-to-tail meetingrdquo119881119894
larr 119881119895
rarr 119881119896
such that the middle node 119881119895
is in Z or (2) 120588
contains a ldquohead-to-head meetingrdquo119881119894
rarr 119881119895
larr 119881119896
such thatthe middle node 119881
119895
is not in Z and no descendant of 119881119895
is inZ Specially two distinct sets of nodes X and Y are said to bed-separated by a set Z in 119866 if Z d-separates every path fromany node in X to any node in Y [26]
In this paper we assume that all the distributions arecompatible with 119866 [27] We also assume that all indepen-dencies of a probability distribution of variables in V canbe checked by d-separations of 119866 called the faithfulnessassumption [26] The faithfulness assumption means thatall independencies and conditional independencies amongvariables can be represented by 119866 Now we formally describeour method in the following Algorithm 1
From the detailed steps of BC-OM we can see that BC-OM classifier relaxes the restrictions on condition variableand further meets the need of practical application Since itsnetwork structure is similar to that of BANrsquos BC-OM doesnot need to build all possible networks in which class nodeis a root and removes irrelevant or redundant nodes fromthe network before the process of estimating the networkparameters which greatly reduces the calculation for poste-rior probability of class variable In fact the training processof BC-OM is different from other BN classifiers Its main taskis to solve the mathematical programming (OM) To createthe dependence coefficient matrix corresponding to (OM)BC-OM needs to compute the conditional statistics 1198802
119894119895|119896
Moreover just as other constraint based algorithms themaincost of BC-OM is the number of conditional independencetests for computing the dependence coefficients of any twovariables in step 2 The number of conditional independencetests is 1198622
119899
sdot 1198621
119899minus2
and the computing complexity is 119874(1198993)The total complexity of BC-OM is bound by 119874(1198993 sdot 119873)where 119899 is the number of variables in the network and 119873is the number of cases in data set 119863 In principle BC-OM is a structure-extension-based algorithm In BC-OMwe essentially extend the structure of TAN by relaxing theparent set of each attribute nodeThus the resulting structureis more complex than TAN but more simple than BANTherefore BC-OM is a good tradeoff between the modelcomplexity and accuracy compared with TAN and BANNext we prove the correctness of BC-OM algorithm underthe faithfulness assumption
The next two results establish the existence and unique-ness properties of solution to (OM)
Mathematical Problems in Engineering 5
Theorem 6 Let X = (119909119894119895
)119899times119899
| 119909119894119895
isin 0 1 There alwaysexists an119883 isin X such that 119883 is a feasible point of (OM)
Proof Given the set of variables119881 = 1198811
1198812
119881119899
where1198811
is the class variable and 1198812
119881119899
are the attribute variablesWe give a matrix119883 as follows
119909119894119895
= 1 119894 = 1 119895 = 2 119899
0 otherwise(5)
Obviously the adjacency matrix 119883 always satisfies the con-strains (1)ndash(3) In fact the graph represented by119883 is theNaiveBayes classifier Thus119883 is a feasible solution of (OM)
According to Theorem 6 we can prove that there exists afeasible classifier which satisfy constrains (1)ndash(3) Theorem 7further shows that such classifier is unique under certaincondition
Theorem 7 Let 119883lowast be the optimal solution of (OM) 1198621
=
119888119894119895
| 119909119894119895
= 1 and 1198622
= 119888119894119895
| 119909119894119895
= 0 be the coefficientsets where 119909
119894119895
is the element of119883lowast119883lowast is the unique solution of(OM) if and only if any element in 119862
1
cannot be expressed asthe sum of any number of elements in 119862
2
Proof Without loss of generality we suppose by reductionto absurdity that 119883(1) and 119883(2) are two optimal solutions of(OM)The values of the objective function is the same in bothsolutions that is
119899
sum
119894=1
119899
sum
119895=1119895 = 119894
119888119894119895
119909(1)
119894119895
=
119899
sum
119894=1
119899
sum
119895=1119895 = 119894
119888119894119895
119909(2)
119894119895
(6)
997904rArr
119899
sum
119894=1
119899
sum
119895=1119895 = 119894
119888119894119895
(119909(1)
119894119895
minus 119909(2)
119894119895
) = 0 (7)
Let 119862(1)1
= 119888119894119895
| 119909(1)
119894119895
= 1 119862(1)2
= 119888119894119895
| 119909(1)
119894119895
= 0 Accordingto the assumption of 119883(1) = 119883(2) and 119909(1)
119894119895
119909(2)119894119895
isin 0 1 theremust exist 1 le 119894
0
1198950
le 119899 such that 119909(1)119894
0119895
0
minus 119909(2)
119894
0119895
0
= 1 namely119909(1)
119894
0119895
0
= 1 119909(2)
119894
0119895
0
= 0 Then by (7)
119888119894
0119895
0
+ sum
119894 = 119894
0
sum
119895 = 119895
0
119888119894119895
(119909(1)
119894119895
minus 119909(2)
119894119895
) = 0 (8)
Since
119909(1)
119894119895
minus 119909(2)
119894119895
=
1 119909(1)
119894119895
= 1 119909(2)
119894119895
= 0
0 119909(1)
119894119895
= 119909(2)
119894119895
minus1 119909(1)
119894119895
= 0 119909(2)
119894119895
= 1
(9)
then by (8) there must exist 119888119894
1119895
1
119888119894
119896119895
119896
isin 119862(1)
2
such that119909(1)
119894
119903119895
119903
minus119909(2)
119894
119903119895
119903
= minus1 119903 = 1 119896 and 119888119894
0119895
0
+sum119896
119903=1
119888119894
119903119895
119903
(119909(1)
119894
119903119895
119903
minus119909(2)
119894
119903119895
119903
) =
0 namely
119888119894
0119895
0
=
119896
sum
119903=1
119888119894
119903119895
119903
(10)
where 119909(1)119894
0119895
0
= 1 119909(1)
119894
119903119895
119903
= 0 119903 = 1 119896 This contradictswith the known condition that any element in 119862(1)
1
cannot beexpressed as the sum of any number of elements in 119862(1)
2
Theorem 8 Let 119866 = (VE) V = (1198811
1198812
119881119899
) be theclassifier structure obtained by step 4 of BC-OM where 119881
1
is the class variable and 1198812
119881119899
are attribute variables119866lowast
= (VlowastElowast) denotes the final output of BC-OM then theclassification results obtained by 119866 and 119866lowast are consistent
Proof Without loss of generality suppose (1198891198942
119889119894119899
) is anexample to be classified The classifier represented by 119866 isgiven as follows
119907lowast
1
= arg max119907
1isindom(119881
1)
119901 (1199071
| 1199072
= 1198891198942
119907119899
= 119889119894119899
) (11)
We write the right side of (11) as 119901(1199071
| 1199072
119907119899
) in shortWe can suppose that 119896 redundant variables were deleted instep 5 of BC-OM say the last 119896 variables 119881
119899minus119896+1
119881119899minus119896+2
119881119899
Then Vlowast = 1198811
1198812
119881119899minus119896
According to step 51198812
119881119899minus119896
d-separates 1198811
and 119881119899minus119896+1
119881119899
Thus1198811
is conditional independent with 119881119899minus119896+1
119881119899
given1198812
119881119899minus119896
Equation (11) can be reduced as follows
119907lowast
1
= arg max119907
1isindom(119881
1)
119901 (1199071
1199072
119907119899
)
119901 (1199072
119907119899
)
lArrrArr 119907lowast
1
= arg max119907
1isindom(119881
1)
119901 (1199071
1199072
119907119899
)
lArrrArr 119907lowast
1
= arg max119907
1isindom(119881
1)
119901 (1199071
119907119899minus119896+1
119907119899
| 1199072
119907119899minus119896
)
sdot 119901 (1199072
119907119899minus119896
)
lArrrArr 119907lowast
1
= arg max119907
1isindom(119881
1)
119901 (1199071
| 1199072
119907119899minus119896
)
sdot 119901 (119907119899minus119896+1
119907119899
| 1199072
119907119899minus119896
)
lArrrArr 119907lowast
1
= arg max119907
1isindom(119881
1)
119901 (1199071
| 1199072
119907119899minus119896
)
(12)
We get the results
Theorem 8 reveals that it is effective and correct to removeredundant or irrelevant attributes using d-separation ruleand the performance of Bayesian classifier can be improved
4 Experimental Results
We run our experiments on 20 data sets from the UCI repos-itory of Machine Learning datasets [28] which represent awide range of domains and data characteristics Table 1 showsthe description of the 20 data sets which are ordered byascending number of samples In our experiments missingvalues are replaced with the modes and means of thecorresponding attribute values from the available data Forexample if the sex of someone is missing it can be replacedby the mode (the value with the highest frequency) of thesexes of all the others Besides we manually delete three
6 Mathematical Problems in Engineering
Table 1 Descriptions of UCI datasets used in the experiments
NO Dataset Instances Attributes Classes Missing value (NY)1 Shuttle 15 6 2 N2 Balloon 16 4 2 N3 Lenses 24 4 3 N4 Soybean (small) 47 35 4 N5 Post-patient 90 8 3 Y6 Zoo 101 17 7 N7 Hayes-roth 132 5 3 N8 Iris 150 4 3 N9 Glass 214 10 7 N10 Heart 267 22 2 N11 Ionosphere 351 34 2 N12 Monkrsquos 432 7 2 N13 Vote 435 16 2 Y14 Balance-scale 625 5 3 N15 Tic-tac-toe 958 9 2 N16 Car-evaluation 1728 6 4 N17 Chess (kr-vs-kp) 3196 36 2 N18 Mushroom 8124 22 2 Y19 Nursery 12960 8 5 N20 Letter 20000 16 26 N
useless attributes the attribute ldquoID numberrdquo in the datasetldquoGlassrdquo the attribute ldquonamerdquo in the dataset ldquoHayes-rothrdquo andthe attribute ldquoanimal namerdquo in the dataset ldquoZoordquo
The experimental platform is a personal computer withPentium 4 306GHz CPU 099GB memory and WindowsXP Our implementation is based on the BayesNet Toolboxfor Matlab [29] which provides source code to performseveral operations on Bayesian networks The purpose ofthese experiments is to compare the performance of theproposed BC-OM with Naive Bayes TAN and BAN in termsof classifier accuracy The accuracy of each model is basedon the percentage of successful predictions on the test setsof each data set In all experiments the accuracy of eachmodel on each data set are obtained via 10 runs of 5-fold crossvalidation Runs with the various algorithms are carried outon the same training sets and evaluated on the same test setsIn particular the cross-validation folds are the same for all theexperiments on each data set Finally we compared relatedalgorithms via two-tailed 119905-test with a 95 percent confidencelevel According to the statistical theory we speak of tworesults for a data set as being ldquosignificantly differentrdquo only ifthe probability of significant difference is at least 95 percent[30]
Table 2 shows the accuracy (and standard deviation ofaccuracy) of each model on each data set and the averagevalues and standard deviation on all data sets are summarizedat the bottom of the table In each row the best of thefour classifier results are displayed in bold If anotherrsquosperformance is not significantly different from the best itis also highlighted but if the differences between all fourclassifies are not statistically significant then none of them
is highlighted From our experiments we can see that BC-OM is best in 6 cases NB TAN and BAN are best in 65 and 3 cases respectively When the number of samples islarger than 400 the performance of TAN and BAN is betterthan that of NB and BC-OM is best Although it can be seenthat the performance of BC-OM and TAN becomes similaras the sample size increase BC-OM has a higher accuracyon average From a general point of view we can see thatfrom the first data set to the last one the highlighted numberschange from few to even more in the sixth column of Table 2It means the advantage of BC-OM is more evident with theincrease of data size
Table 3 shows the compared results of two-tailed 119905-testin which each entry 119908119905119897 means that the model in thecorresponding row wins in 119908 data sets ties in 119905 data setsand loses in 119897 data sets compared to the model in thecorresponding column From Table 3 we can see that BC-OM significantly outperforms NB (9 wins and 4 losses)TAN (12 wins and 5 losses) and BAN (11 wins and 5 losses)in accuracy Figures 2 3 and 4 show two scatter-plotscomparing BC-OMwith NB TAN and BAN respectively Inthe scatter plot each point represents a data set where the 119909coordinate of a point is the percentage of misclassificationsaccording to NB or TAN or BAN and the 119910 coordinate isthe percentage of misclassifications according to BC-OMThus points below the diagonal line correspond to datasets on which BC-OM performs better From Figures 2and 3 we can see that BC-OM generally outperforms NBand TAN as is also demonstrated in Table 3 It providesstrong evidence that BC-OM is performing well against theother two classifiers both in terms of accuracy as well as
Mathematical Problems in Engineering 7
Table 2 The detailed experimental results on accuracy and standard deviation
NO Dataset NB TAN BAN BC-OM1 Shuttle 8352 plusmn 585 8533 plusmn 703 8443 plusmn 683 8233 plusmn 594
2 Balloon 8915 plusmn 306 8516 plusmn 315 8716 plusmn 292 8375 plusmn 357
3 Lenses 9256 plusmn 244 9325 plusmn 285 8967 plusmn 316 9112 plusmn 302
4 Soybean (small) 9091 plusmn 235 8498 plusmn 316 8736 plusmn 244 8974 plusmn 323
5 Post-patient 8029 plusmn 339 7994 plusmn 347 8126 plusmn 356 8012 plusmn 348
6 Zoo 9346 plusmn 512 9521 plusmn 478 9434 plusmn 516 9488 plusmn 509
7 Hayes-roth 8182 plusmn 527 8734 plusmn 489 8458 plusmn 374 8455 plusmn 356
8 Iris 9413 plusmn 612 9347 plusmn 665 9381 plusmn 680 8907 plusmn 725
9 Glass 6602 plusmn 988 5967 plusmn 952 5832 plusmn 998 5696 plusmn 981
10 Heart 8241 plusmn 662 8253 plusmn 701 8265 plusmn 703 8153 plusmn 691
11 Ionosphere 9054 plusmn 403 9061 plusmn 398 9145 plusmn 414 9099 plusmn 48212 Monkrsquos 8428 plusmn 114 8329 plusmn 129 8379 plusmn 123 8664 plusmn 10213 Vote 9488 plusmn 357 9037 plusmn 334 9263 plusmn 398 9097 plusmn 295
14 Balance-scale 9091 plusmn 151 8497 plusmn 244 8794 plusmn 231 9077 plusmn 18515 Tic-tac-toe 7011 plusmn 445 7316 plusmn 447 7574 plusmn 483 7621 plusmn 38216 Car-evaluation 8495 plusmn 274 9344 plusmn 189 892 plusmn 102 9542 plusmn 10317 Chess (kr-vs-kp) 8788 plusmn 191 9168 plusmn 166 9027 plusmn 112 9265 plusmn 1418 Mushroom 9285 plusmn 056 9989 plusmn 01 9637 plusmn 076 9991 plusmn 0119 Nursery 9054 plusmn 114 9407 plusmn 129 9231 plusmn 123 8995 plusmn 109
20 Letter 6932 plusmn 397 7758 plusmn 183 7345 plusmn 167 7766 plusmn 201Average 8685 plusmn 481 8663 plusmn 37 8569 plusmn 369 8676 plusmn 357
Table 3 The compared results of two-tailed 119905-test on accuracy withthe 95 percent confidence level
119908119905119897 NB TAN BANTAN 1334 mdash mdashBAN 1244 1055 mdashBC-OM 974 1235 1145
the percentage of misclassifications Figure 4 also shows BC-OM outperforming BAN though the difference in perfor-mance is not as marked as in the results of Figures 2 and 3 Inother words the performance of BC-OM and BAN is similarin terms of the percentage ofmisclassificationsHowever BC-OMhas a higher accuracy and amore simple graph structurewhich suggests that BC-OM is able to handle very large datasets and is a more promising classifier
5 Conclusions
In many real-world applications classification is oftenrequired to make optimal decisions In this paper we sum-marize the existing improved algorithms for naive Bayesand propose a novel Bayesian classifier model BC-OM Weconducted a systematic experimental study on a number ofUCI datasetsThe experimental results show that BC-OMhasa better performance compared to the other state-of-the-artmodels for augmenting naive Bayes It is clear that in somesituations it would be useful to model correlations among
0 5 10 15 20 25 30 35 40 45 500
5
10
15
20
25
30
35
40
45
50
BC
-OM
err
or
NB error
Figure 2 Relative errors of BC-OM and NB
attributes BC-OM is a good tradeoff between the quality ofthe approximation of correlations among attributes and thecomputational complexity in the learning stage Consideringits simplicity BC-OM is a promisingmodel that could be usedin many field
In addition we use the chi-squared statistic to estimatethe dependence coefficients among attributes from datasetWe believe that the use of more sophisticated methods couldimprove the performance of the current BC-OM and make
8 Mathematical Problems in Engineering
0 5 10 15 20 25 30 35 40 45 500
5
10
15
20
25
30
35
40
45
50
TAN error
BC
-OM
err
or
Figure 3 Relative errors of BC-OM and TAN
BC
-OM
err
or
0
5
10
15
20
25
30
35
40
45
50
0 5 10 15 20 25 30 35 40 45 50
BAN error
Figure 4 Relative errors of BC-OM and BAN
its advantage stronger This is the main research direction forour future work
Acknowledgments
This work was supported by the National Natural ScienceFoundation of China (nos 60974082 and 61075055) theNational Funds of China for Young Scientists (no 11001214)and the Fundamental Research Funds for the Central Univer-sities (no K5051270013)
References
[1] Z Cai S Sun S Si and B Yannou ldquoIdentifying product failurerate based on a conditional Bayesian network classifierrdquo ExpertSystems with Applications vol 38 no 5 pp 5036ndash5043 2011
[2] D C Kim X Wang C R Yang and J Gao ldquoLearningbiological network using mutual information and conditionalindependencerdquo BMC Bioinformatics vol 11 no 3 article S92010
[3] N C Hsieh and L P Hung ldquoA data driven ensemble classifierfor credit scoring analysisrdquo Expert Systems with Applicationsvol 37 no 1 pp 534ndash545 2010
[4] S Mukherjee and N Sharma ldquoIntrusion detection using naiveBayes classifier with feature reductionrdquo Procedia Technologyvol 4 pp 119ndash128 2012
[5] Y Sun Y Y Tang S XDing S P Lv andY F Cui ldquoDiagnose themild cognitive impairment by constructing Bayesian networkwithmissing datardquo Expert Systems with Applications vol 38 no1 pp 442ndash449 2011
[6] V Aquaro M Bardoscia R Bellotti A Consiglio F de Carloand G Ferri ldquoA Bayesian networks approach to operationalriskrdquo Physica A vol 389 no 8 pp 1721ndash1728 2010
[7] S Nikolajewa R Pudimat M Hiller M Platzer and RBackofen ldquoBioBayesNet a web server for feature extractionand Bayesian network modeling of biological sequence datardquoNucleic acids research vol 35 pp W688ndash693 2007
[8] I Ben-Gal A Shani A Gohr et al ldquoIdentification of transcrip-tion factor binding siteswith variable-order BayesiannetworksrdquoBioinformatics vol 21 no 11 pp 2657ndash2666 2005
[9] N Friedman D Geiger andMGoldszmidt ldquoBayesian networkclassifiersrdquoMachine Learning vol 29 no 2-3 pp 131ndash163 1997
[10] P Langley W Iba and K Thompson ldquoAn analysis of Bayesianclassifiersrdquo in Proceedings of the 10th National Conference onArtificial Intelligence P Rosenbloom and P Szolovits Eds pp223ndash228 AAAI Press Menlo Park Calif USA 1992
[11] M Minsky ldquoSteps toward artificial intelligencerdquo Proceedings ofthe Institute of Radio Engineers vol 49 pp 8ndash30 1961
[12] L Jiang H Zhang and Z Cai ldquoA novel bayes model hiddennaive bayesrdquo IEEE Transactions on Knowledge and Data Engi-neering vol 21 no 10 pp 1361ndash1371 2009
[13] A A Balamurugan R Rajaram S Pramala S Rajalakshmi CJeyendran and J Dinesh Surya Prakash ldquoNB+ an improvedNaive Bayesian algorithmrdquo Knowledge-Based Systems vol 24no 5 pp 563ndash569 2011
[14] L Jiang Z Cai D Wang and H Zhang ldquoImproving treeaugmented naive Bayes for class probability estimationrdquo Know-ledge-Based Systems vol 26 pp 239ndash245 2012
[15] J Cheng and R Greiner ldquoComparing Bayesian network clas-sifiersrdquo in Proceedings of the 15th Conference on Uncertainty inArtificial Intelligence K B Laskey and H Prade Eds pp 101ndash108 Morgan Kaufmann San Francisco Calif USA 1999
[16] M G Madden ldquoOn the classification performance of TAN andgeneral Bayesian networksrdquo Knowledge-Based Systems vol 22no 7 pp 489ndash495 2009
[17] J Pearl Probabilistic Reasoning in Intelligent Systems MorganKaufmann San Francisco Calif USA 1988
[18] D M Chickering ldquoLearning Bayesian networks is NP-Com-pleterdquo inLearning FromData Artificial Intelligence and StatisticsV D Fisher and H Lenz Eds pp 121ndash130 Springer New YorkNY USA 1996
[19] C Borgelt ldquoA conditional independence algorithm for learningundirected graphical modelsrdquo Journal of Computer and SystemSciences vol 76 no 1 pp 21ndash33 2010
[20] A M MartacuteJnez-RodracuteJguez J H May and L G VargasldquoAn optimization-based approach for the design of Bayesiannetworksrdquo Mathematical and Computer Modelling vol 48 no7-8 pp 1265ndash1278 2008
[21] L M de Campos ldquoA scoring function for learning Bayesiannetworks based on mutual information and conditional inde-pendence testsrdquo Journal ofMachine Learning Research vol 7 pp2149ndash2187 2006
Mathematical Problems in Engineering 9
[22] X W Chen G Anantha and X T Lin ldquoImproving bayesiannetwork structure learning with mutual information-basednode ordering in the K2 algorithmrdquo IEEE Transactions onKnowledge and Data Engineering vol 20 no 5 pp 628ndash6402008
[23] W J Conover Practical Nonparametric Statistics John Wiley ampSons New York NY USA 1999
[24] S Kullback Information Theory and Statistics Dover 1968[25] G Chartrand and P Zhang Introduction to Graph Theory
McGraw-Hill New York NY USA 2005[26] R E Neapolitan Learning Bayesian Networks Prentice Hall
Englewood Cliffs NJ USA 2004[27] DM Chickering andCMeek ldquoOn the incompatibility of faith-
fulness and monotone DAG faithfulnessrdquo Artificial Intelligencevol 170 no 8-9 pp 653ndash666 2006
[28] A Frank and A Asuncion UCI Machine Learning RepositoryUniversity of California School of Information and ComputerScience Irvine Calif USA 2010 httparchiveicsucieduml
[29] K P Murphy BaysNetToolbox For Matlab 2007 httpscodegooglecompbnt
[30] J Demsar ldquoStatistical comparisons of classifiers over multipledata setsrdquo Journal of Machine Learning Research vol 7 pp 1ndash302006
Submit your manuscripts athttpwwwhindawicom
Hindawi Publishing Corporationhttpwwwhindawicom Volume 2014
MathematicsJournal of
Hindawi Publishing Corporationhttpwwwhindawicom Volume 2014
Mathematical Problems in Engineering
Hindawi Publishing Corporationhttpwwwhindawicom
Differential EquationsInternational Journal of
Volume 2014
Applied MathematicsJournal of
Hindawi Publishing Corporationhttpwwwhindawicom Volume 2014
Probability and StatisticsHindawi Publishing Corporationhttpwwwhindawicom Volume 2014
Journal of
Hindawi Publishing Corporationhttpwwwhindawicom Volume 2014
Mathematical PhysicsAdvances in
Complex AnalysisJournal of
Hindawi Publishing Corporationhttpwwwhindawicom Volume 2014
OptimizationJournal of
Hindawi Publishing Corporationhttpwwwhindawicom Volume 2014
CombinatoricsHindawi Publishing Corporationhttpwwwhindawicom Volume 2014
International Journal of
Hindawi Publishing Corporationhttpwwwhindawicom Volume 2014
Operations ResearchAdvances in
Journal of
Hindawi Publishing Corporationhttpwwwhindawicom Volume 2014
Function Spaces
Abstract and Applied AnalysisHindawi Publishing Corporationhttpwwwhindawicom Volume 2014
International Journal of Mathematics and Mathematical Sciences
Hindawi Publishing Corporationhttpwwwhindawicom Volume 2014
The Scientific World JournalHindawi Publishing Corporation httpwwwhindawicom Volume 2014
Hindawi Publishing Corporationhttpwwwhindawicom Volume 2014
Algebra
Discrete Dynamics in Nature and Society
Hindawi Publishing Corporationhttpwwwhindawicom Volume 2014
Hindawi Publishing Corporationhttpwwwhindawicom Volume 2014
Decision SciencesAdvances in
Discrete MathematicsJournal of
Hindawi Publishing Corporationhttpwwwhindawicom
Volume 2014 Hindawi Publishing Corporationhttpwwwhindawicom Volume 2014
Stochastic AnalysisInternational Journal of
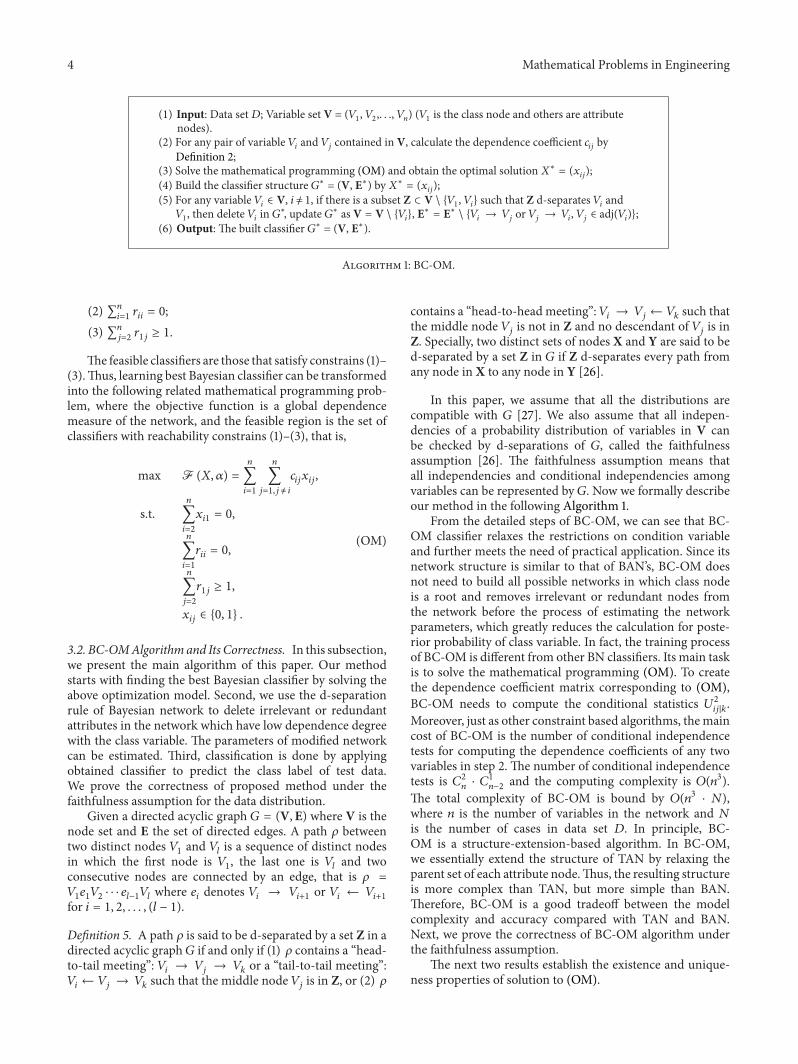
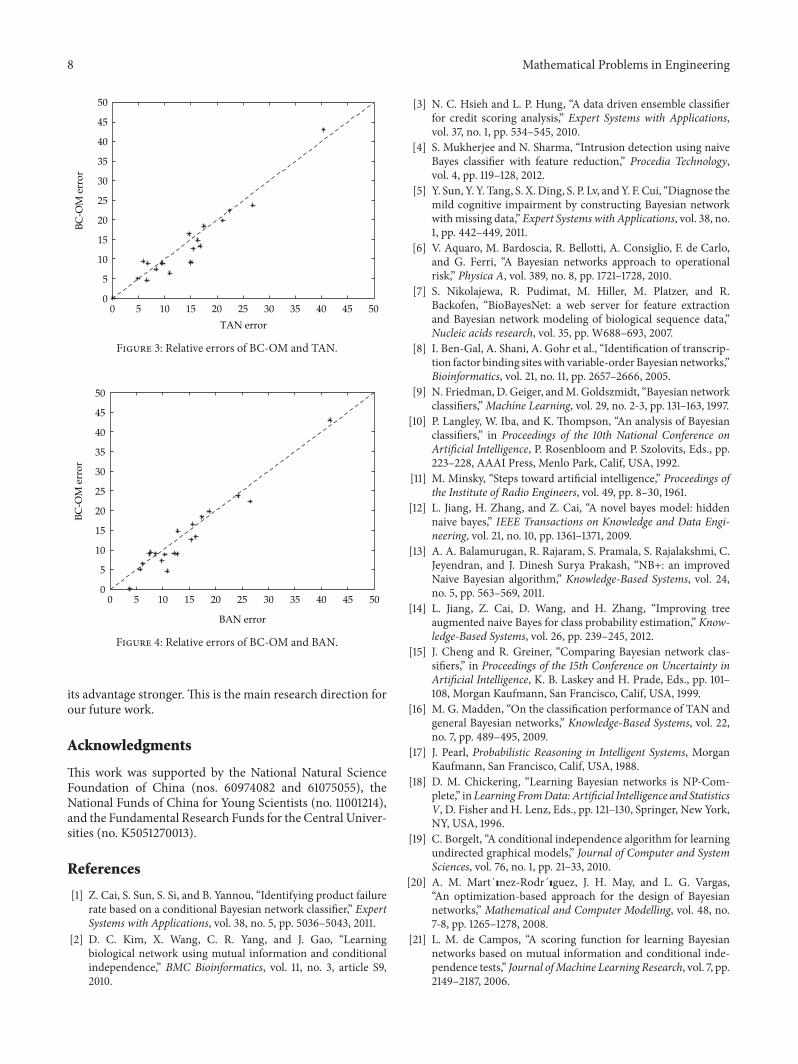