Research about consumers and nutrition labelling
18
Research about consumers and nutrition labelling Research Designs Three basic questions that are asked in nutritional labelling research are: • What is going on in society with regards to labels?, i.e. descriptive research; • How do people use labels?, i.e. exploratory research; • Why do people use labels the way they do?, i.e. explanatory research. The function of a research design is to ensure that the evidence obtained enables us to answer the initial question as unambiguously as possible 1 . Designing research means choosing the most appropriate methods to answer the research questions of interest. Data and methods are to be selected so that the research questions can be answered. It is usually impossible to study all the people in the population that you are interested in. Research thus needs to be conducted with a group of people that reflects the population you are interested in studying. Selecting this group is called sampling (see Table 1), the goal of which is to select a small-scale group that is representative of the group you are interested in. If the group selected contains people that are not your target population or you have not included people who are your target population you will be in danger of collecting biased data. A way of minimizing this risk of sampling error is to select a random sample; this is called “probability sampling”. The extent to which the findings from a study can be extended beyond the data collected is called the “external validity”. Researchers do not always adopt random samples, i.e. “non-probability sampling”. In this case researchers decide the criteria by which they will select the sample, e.g. convenience or some systematic criteria. In order to adequately judge research results, it important to understand the process by which research participants have been selected. 1 De Vaus D (2001) Research Design in Social Research. Thousand Oaks: Sage Publications.
Transcript of Research about consumers and nutrition labelling

Research about consumers and nutrition labelling
Research Designs Three basic questions that are asked in nutritional labelling research are:
• What is going on in society with regards to labels?, i.e. descriptive research; • How do people use labels?, i.e. exploratory research; • Why do people use labels the way they do?, i.e. explanatory research.
The function of a research design is to ensure that the evidence obtained enables us to answer the initial question as unambiguously as possible1. Designing research means choosing the most appropriate methods to answer the research questions of interest. Data and methods are to be selected so that the research questions can be answered.
It is usually impossible to study all the people in the population that you are interested in. Research thus needs to be conducted with a group of people that reflects the population you are interested in studying. Selecting this group is called sampling (see Table 1), the goal of which is to select a small-scale group that is representative of the group you are interested in. If the group selected contains people that are not your target population or you have not included people who are your target population you will be in danger of collecting biased data. A way of minimizing this risk of sampling error is to select a random sample; this is called “probability sampling”. The extent to which the findings from a study can be extended beyond the data collected is called the “external validity”. Researchers do not always adopt random samples, i.e. “non-probability sampling”. In this case researchers decide the criteria by which they will select the sample, e.g. convenience or some systematic criteria. In order to adequately judge research results, it important to understand the process by which research participants have been selected.
1 De Vaus D (2001) Research Design in Social Research. Thousand Oaks: Sage Publications.

Table 1. Examples of sampling methods
Sampling approach
Examples of this type of sampling that have been used in food labelling research
Strategy for selecting sample
Examples of food labelling studies
Simple random sampling
Every member of the population being studied has an equal chance of being selected.
In a study examining longitudinal trends in use of nutrition information among Canadians. Goodman and colleagues2 used a plus-digit, random-digit dialing process to select the households to take part.
Systematic selection (interval sampling)
This method is used when a stream of representative people are available, e.g. shoppers in a particular store
In an in-store observational study assessing the impact of NLEA-mandated labels on consumers’ search for nutrition information, Balasubramanian and Cole3 positioned observers in the aisles for three product categories in 3 chain grocery stores. Data collection was distributed across the time of day and day of the week.
Stratified sampling (proportional and disproportional): the population studied is divided into groups (“strata”)
In this method the population is divided into non-overlapping groups and samples are taken from within these groups
Probability sampling uses random selection to ensure that all members of the group of interest have an equal chance of being selected to participate in the study
Clustered This method is used when the population of interest is
2 Goodman S, Hammond D, Pillo‐Blocka F, Glanville T;Jenkins R (2011) Use of nutritional information in Canada: National trends between 2004 and 2008. Journal of Nutrition Education and Behavior, 43, 356‐365 3 Balasubramanian SK, Cole C (2002) Consumers' search and use of nutrition information: the challenge and promise of the Nutrition Labelling and Education Act. Journal of Marketing, 66, 112‐127.

Table 1. Examples of sampling methods
Sampling approach
Examples of this type of sampling that have been used in food labelling research
Strategy for selecting sample
Examples of food labelling studies
sampling large and widely geographically dispersed. Clusters within the population are randomly selected, e.g. cities.
Convenience sampling
Participants will be those that the researcher has relatively “easy” access to, e.g. use of students.
In a study that looked to identify correlates of nutrition label reading, Kreuter, Scharff, Brennan, Lukwago4 used a convenience sample of patients in doctor’s waiting rooms. The clinics in which the research was conducted in clinics known to have a high volume of patients.
Aikmana, Mina and Graham5 used undergraduate students in an experimental study examining people’s perceptions of the healthiness of foods depicted in various ways, including a food’s nutritional information.
Purposive (nonprobability) sampling methods, i.e. sampling with a purpose in mind, usually interest in particular groups
Snowball sampling
Participants meeting the study requirements will recommend others with the same characteristics, e.g. members of a club. The method is used when trying to access difficult to reach
In a study examining how interested and competent families in using nutritional information on food labels, Nørgaard and Brunsø6 recruited families through contacts at primary schools
4 Kreuter MW, Brennan LK, Scharff DP, Lukwago SN (1997) Do nutrition label readers eat healthier diets? Behavioural correlates of adults' use of food labels. American Journal of Preventive Medicine 13(4), 277‐283. 5 Aikman SN, Min KE, Graham D (2006) Food attitudes, eating behavior, and the information underlying food attitudes. Appetite, 47, 111‐114 6 Nørgaard MK, Brunsø K (2009) Families' use of nutritional information on food labels. Food Quality and Preference, 20, 597‐606.
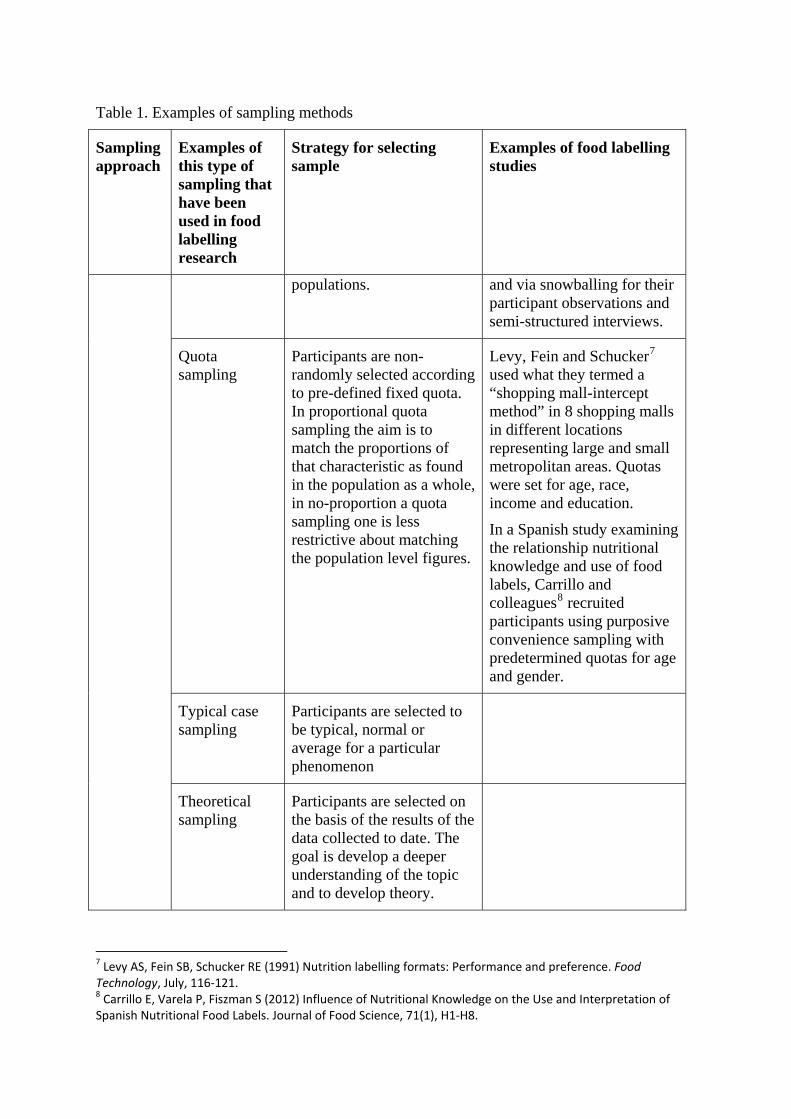
Table 1. Examples of sampling methods
Sampling approach
Examples of this type of sampling that have been used in food labelling research
Strategy for selecting sample
Examples of food labelling studies
populations. and via snowballing for their participant observations and semi-structured interviews.
Quota sampling
Participants are non-randomly selected according to pre-defined fixed quota. In proportional quota sampling the aim is to match the proportions of that characteristic as found in the population as a whole, in no-proportion a quota sampling one is less restrictive about matching the population level figures.
Levy, Fein and Schucker7 used what they termed a “shopping mall-intercept method” in 8 shopping malls in different locations representing large and small metropolitan areas. Quotas were set for age, race, income and education.
In a Spanish study examining the relationship nutritional knowledge and use of food labels, Carrillo and colleagues8 recruited participants using purposive convenience sampling with predetermined quotas for age and gender.
Typical case sampling
Participants are selected to be typical, normal or average for a particular phenomenon
Theoretical sampling
Participants are selected on the basis of the results of the data collected to date. The goal is develop a deeper understanding of the topic and to develop theory.
7 Levy AS, Fein SB, Schucker RE (1991) Nutrition labelling formats: Performance and preference. Food Technology, July, 116‐121. 8 Carrillo E, Varela P, Fiszman S (2012) Influence of Nutritional Knowledge on the Use and Interpretation of Spanish Nutritional Food Labels. Journal of Food Science, 71(1), H1‐H8.

Research methods9
Three main types of research methods are qualitative, quantitative and mixed methods. Qualitative and quantitative designs should not be viewed as polar opposites but as different ends of a continuum with mixed methods in the middle as it incorporates elements of both qualitative and quantitative approaches. These approaches can differ in:
(1) the basic philosophical assumptions the researchers bring to the research,
(2) types of research strategies used in the research (e.g. qualitative case studies or quantitative experiments) and
(3) the specific methods employed in conducting these strategies (e.g. collecting data quantitatively on instruments versus collecting data qualitatively through observing a setting).
Quantitative methods are predetermined, instrument based questions that may contain performance data, attitude data, observational data and census data that are statically analysed with statistical interpretation.
Qualitative methods employ emerging methods with open-ended questions and may contain interview data, observation data, document data and audio-visual data that undergo text and image analysis with themes and pattern interpretation.
Mixed methods used both predetermined and emerging methods with open and closed questions to gather multiple forms of data drawing from all possibilities. Statistical and text analysis are conducted with across databases interpretation.
Criteria for selecting a research design will depend on the research problem, the personal experience of the researcher and the researcher’s audience.
Qualitative research Qualitative research is a means of exploring and understanding the meaning individuals or groups ascribe to a social or human problem. The process of research involves emerging questions and procedures. Where data is typically collected in the participant’s setting. Data is analysed inductively building from particular to general themes and the researcher making interpretations of the meaning of the data. The report structure is flexible. Researchers support an inductive style, a focus on individual meaning and the importance of interpreting the complexity of a situation. Qualitative strategies include:
Ethnography where the researcher studies an intact cultural group in a natural setting over a prolonged period of time by collecting, primarily, observational and interview data.
Grounded theory where the researcher derives a general, abstract theory of a process, action, or interaction grounded in the views of the participants. This involves using multiple stages of data collection and the refinement and interrelationship of categories of information.
9 An online research methods guide can be found here: Trochim, W. M. The Research Methods Knowledge Base, 2nd Edition. Internet WWW page, at URL: <http://www.socialresearchmethods.net/kb/> (version current as of October 20, 2006).
The International Consortium for the Advancement of Academic Publication (ICAAP) provides links to free resources for program evaluation and social research methods here: http://gsociology.icaap.org/methods/

Case studies where a program, event, activity, process, or one or more individuals are investigated in depth. Case studies are bounded by time or activity and researchers collect detailed information using a variety of data collection procedures over a sustained period of time.
Phenomenological research where the researcher identifies the essence of human experience about a phenomenon as described by the participants by studying a small number of subjects through extensive and prolonged engagement to develop patterns and relationships of meaning.
Narrative research where the researcher studies lives of individuals by asking on or more individuals to provide stories about their lives. These stories are then retold and restoried by the researcher onto a narrative chronology.
Quantitative research Quantitative research is a means of testing objective theories by examining the relationship among variables. These variables can be measured typically on instruments so that the numbered data can be analysed using statistical procedures. The final report is structured. Researchers have assumptions about testing theories deductively building in protection against bias, controlling for alternative explanations and being able to generalise and replicate findings. Quantitative strategies include:
• Survey research that provides numerical description of trends, attitudes or opinions of a population by studying a sample of that population. It includes cress-sectional and longitudinal studies using questionnaires or structured interviews for data collection with the intent of generalisation from a sample to a population.
• Experimental research that seeks to determine if a specific intervention or treatment influences an outcome. The impact is assessed by providing the intervention or treatment to one group and withholding it from another and then determining how both groups scored on an outcome. Experiments include true experiments, with the random assignment of subjects to intervention or treatment condition and quasi-experiments that use nonrandomized designs and single-subject designs.
Mixed methods research Mixed methods research is an approach that combines both qualitative and quantitative forms in its assumptions and approaches. It’s not simply using both qualitative and quantitative data; it involves the use of both approaches in tandem so that the overall strength of the study is greater than either individual approach.
Types of studies
Experimental studies Conducting experiments allows researchers to judge whether an intervention or treatment, e.g. exposure to nutritional labelling changes an outcome variable (e.g. perception, liking, understanding, inference-making, decision-making, behaviour). In a nutrition labelling experiment we are interested in in whether the availability of labelling or the type of labelling (i.e. the “independent variable”, the variable that is being manipulated, it is the cause and is being controlled: "What do I change?") has an effect on behaviour or some other variable (i.e.

the “dependent variable”, the variable that is not being manipulated, it is being effected: "What do I observe?"). In other words researchers manipulate an independent variable in an experiment to observe the effect on behaviour, or in some cases other variables that precede behaviour, as assessed by the dependent variable.
A control group is the group of people with which the people receiving the intervention or treatment, e.g. nutritional labelling is compared, i.e. it serves as a reference. The control group is similar to the experimental group except that it does not receive the experimental treatment. Experimental control allows researchers to draw conclusions about the independent variable caused the observed changes in the dependent variable, i.e. “Does nutrition labelling have an effect on understanding or behaviour?”.
In an experiment participant are randomly assigned to the different intervention or treatment groups. This randomization cancels out factors other than the independent and dependent variables being studied, thus making it possible to determine whether there is a cause and effect relationship between the dependent and independent variables.
Figure 5. Types of experimental designs.
An experimental design is used to test the impact of an intervention or treatment on an outcome controlling for all other factors that might influence that outcome. Experimental design identifies the type of experimental design to be used (i.e. pre-experimental designs, true experiments, quasi experiments, single-subject experiment) and what is being compared in the experiment. Group randomisation and having a control group are core elements of an experiment (see Figure 5). There are however studies that do not have control groups, these are called pre-experiments (see Figures 5-9) and quasi-experiments (see Figures 5 and 10).

Figure 6. “Single group post-test only” pre-experimental design.
Figure 7. “Post-test-only non-equivalent groups” pre-experimental design.
Figure 8. “Pre-test post-test single group” pre-experimental design.
Figure 9. “Alternative treatment post-test-only with non-equivalent groups” pre-experimental design.
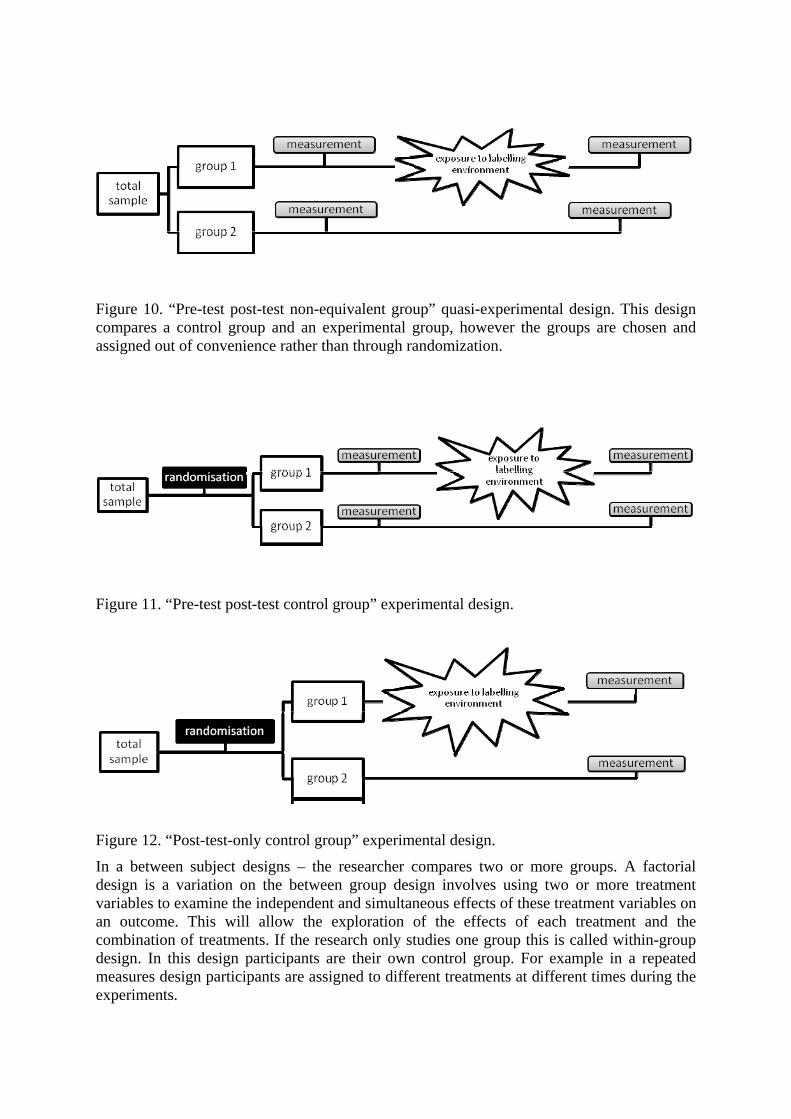
Figure 10. “Pre-test post-test non-equivalent group” quasi-experimental design. This design compares a control group and an experimental group, however the groups are chosen and assigned out of convenience rather than through randomization.
Figure 11. “Pre-test post-test control group” experimental design.
Figure 12. “Post-test-only control group” experimental design.
In a between subject designs – the researcher compares two or more groups. A factorial design is a variation on the between group design involves using two or more treatment variables to examine the independent and simultaneous effects of these treatment variables on an outcome. This will allow the exploration of the effects of each treatment and the combination of treatments. If the research only studies one group this is called within-group design. In this design participants are their own control group. For example in a repeated measures design participants are assigned to different treatments at different times during the experiments.

An example of a study with a within subjects “Post-test-only” experimental design is the study carried out by Viswanathan, Hastak and Gau10 who conducted an experiment to test the efficacy of graphical presentation formats for low-literate consumers. Four presentation formats were tested. Two of these labels were the “average” and “%Daily Value” formats and two were graphical formats for presenting summary information were created - the graphical range format and the graphical rating format. The researchers hypothesized that:
• those respondents with higher levels of literacy to make better judgments of healthfulness based on the nutrition facts panel relative to respondents with lower levels of literacy, regardless of presentation format of the nutrition information[
• literacy level would interact with presentation format in influencing comprehension of nutrition information;
• for those respondents with lower levels of literacy, summary information presented in graphical formats would be more effective in communicating product healthiness than summary information presented in non-graphical formats, and
• for respondents with higher levels of literacy, all four of the formats were expected to be equally effective.
The design was a 4 (label format) by 3 (literacy level) between subjects design. Respondents were sequentially exposed to and then rated three different brands of potato chips (healthful, neutral, and unhealthful) on overall healthfulness as well on specific nutrients (fat, calories, etc).
Strengths of experimental studies:
The research is often carried out in a place can be carefully controlled. It is thus easier to estimate the true effect of the variable of interest on the outcome of interest.
Weaknesses of experimental studies:
The extent to which the study findings can be extended beyond the data collected, the “external validity” can be compromised due to the frequent use of non-random samples and the artificial nature of the experimental context.
Cross-sectional surveys Survey research11 designs allow for the quantitative or numeric description of variables and allow the researcher to make claims about a population, e.g. what percentage of the population claims to use label, understands labels or actually uses labels. From the sample results the researcher generalizes or makes claims about the population. Survey design should address the purpose of the survey and how will the data be collected. Possible ways of collecting data include self-administered questionnaires (i.e. completed by respondents themselves), that can be completed on paper or via a computer (online survey delivery
10 Viswanathan M, Hastak M, Gau R (2009) Understanding and Facilitating the Usage of Nutritional Labels by Low‐Literate Consumers. Advances in Consumer Research, 8, 200‐201. 11 "What is a Survey" booklet [http://www.whatisasurvey.info/overview.htm]: This booklet is written primarily for non‐specialists and is free of charge. Its overall goal is to improve survey literacy among individuals who participate in National Opinion Research Center (NORC) Surveys or use NORC survey results. The material is taken from the American Statistical Association series of the same name that was designed to promote a better understanding of what is involved in carrying out sample surveys ‐ especially those aspects that have to be taken into account in evaluating the results of surveys
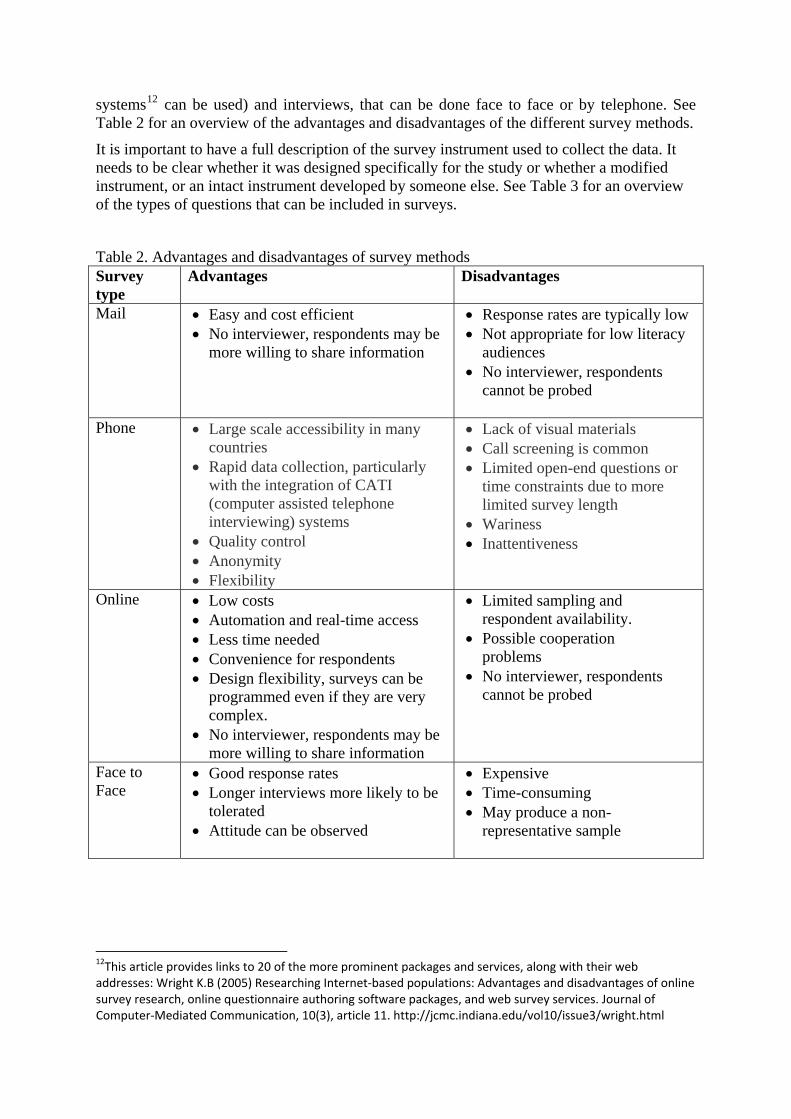
systems12 can be used) and interviews, that can be done face to face or by telephone. See Table 2 for an overview of the advantages and disadvantages of the different survey methods.
It is important to have a full description of the survey instrument used to collect the data. It needs to be clear whether it was designed specifically for the study or whether a modified instrument, or an intact instrument developed by someone else. See Table 3 for an overview of the types of questions that can be included in surveys.
Table 2. Advantages and disadvantages of survey methods Survey type
Advantages Disadvantages
Mail • Easy and cost efficient • No interviewer, respondents may be
more willing to share information
• Response rates are typically low • Not appropriate for low literacy
audiences • No interviewer, respondents
cannot be probed
Phone • Large scale accessibility in many countries
• Rapid data collection, particularly with the integration of CATI (computer assisted telephone interviewing) systems
• Quality control • Anonymity • Flexibility
• Lack of visual materials • Call screening is common • Limited open-end questions or
time constraints due to more limited survey length
• Wariness • Inattentiveness
Online • Low costs • Automation and real-time access • Less time needed • Convenience for respondents • Design flexibility, surveys can be
programmed even if they are very complex.
• No interviewer, respondents may be more willing to share information
• Limited sampling and respondent availability.
• Possible cooperation problems
• No interviewer, respondents cannot be probed
Face to Face
• Good response rates • Longer interviews more likely to be
tolerated • Attitude can be observed
• Expensive • Time-consuming • May produce a non-
representative sample
12This article provides links to 20 of the more prominent packages and services, along with their web addresses: Wright K.B (2005) Researching Internet‐based populations: Advantages and disadvantages of online survey research, online questionnaire authoring software packages, and web survey services. Journal of Computer‐Mediated Communication, 10(3), article 11. http://jcmc.indiana.edu/vol10/issue3/wright.html

Table 3. Types of survey questions, adapted from: Source: Instructional Assessment Resources (IAR) www.utexas.edu/academic/ctl/assessment/iar/teaching/plan/method/survey/survey_tables_questiontypes.pdf) Question Type
Open-ended (essay or short-answer)
Close-ended (multiple-choice or
yes/no)
Partial open-ended (multiple-choice with
‘other’ option)
Scaled Ranking
Uses • Discover relevant issues • Obtain a full range of
responses • Explore respondents’
views in-depth
• Ask many questions in a short time period
• Assess learning or attitudes when issues are clear
• Measure knowledge or ability
• Ask many questions in a short time period
• Assess learning or attitudes when issues are clear and identifiable
• Discover relevant issues
• Determine the degree of a response, opinion, or position
• Determine the relative importance to respondents of various options
• Choose among various options
Advantages • Identifies issues most relevant to respondents
• Generates new ideas about topic
• Clarifies respondents’ positions
• Provides detail and depth
• Fast and easy to complete
• Enables automated data entry
• Facilitates data analysis and summary of data
• Enables respondents to create their own response if choices do not represent their preferred response
• Generates new ideas about topic
• Fast and easy to complete
• Provides a more precise measure than yes/no or true/false items
• Fast and easy to complete
• Enables automated data entry
• Allows respondents to indicate the relative importance of choices
• Enables automated data entry
Disadvantages • More time, thought, and communication skill needed to complete
• Time-consuming data entry
• May generate incomplete or irrelevant data
• Complicates data
• Limits response options
• May omit a preferred answer
• Requires moderate knowledge of the topic to write appropriate questions and
• Requires moderate knowledge of the topic to write appropriate questions and responses
• Lacks detail and depth • Complicates data
analysis and summary
• Requires moderate knowledge of the topic to write appropriate questions
• More difficult to answer
• Limits number of response options
• May omit a respondent’s preferred answer
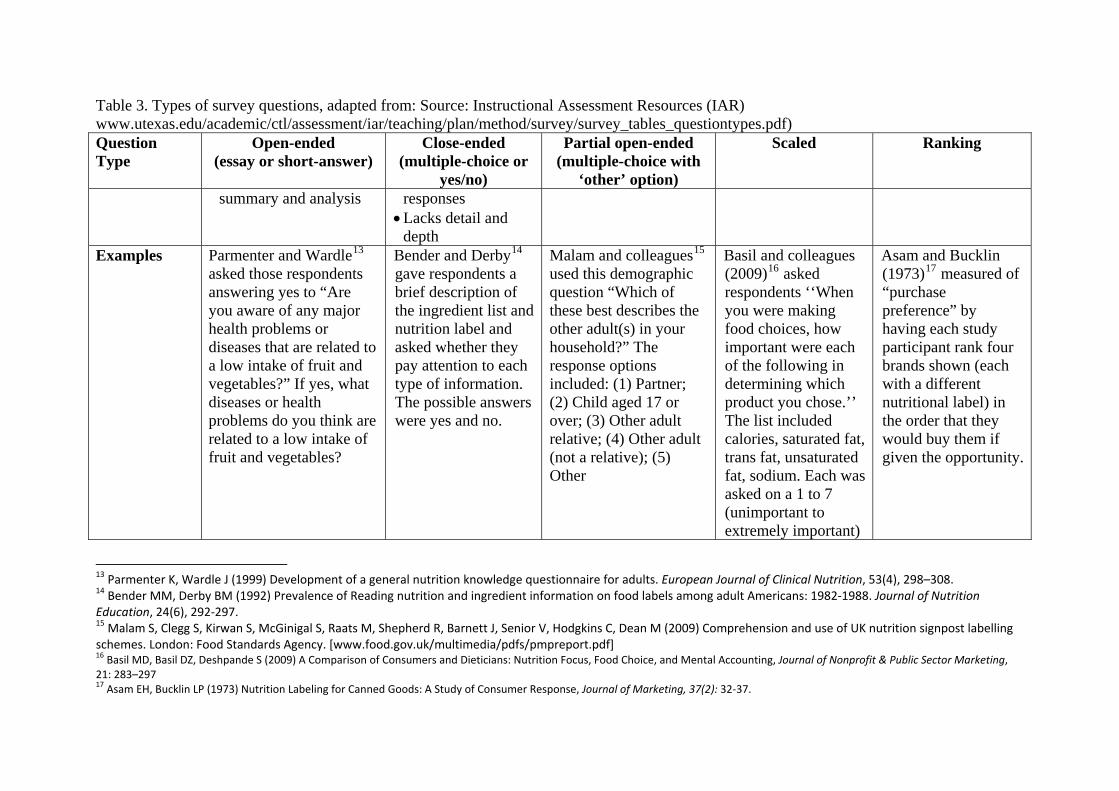
Table 3. Types of survey questions, adapted from: Source: Instructional Assessment Resources (IAR) www.utexas.edu/academic/ctl/assessment/iar/teaching/plan/method/survey/survey_tables_questiontypes.pdf) Question Type
Open-ended (essay or short-answer)
Close-ended (multiple-choice or
yes/no)
Partial open-ended (multiple-choice with
‘other’ option)
Scaled Ranking
summary and analysis responses • Lacks detail and
depth Examples Parmenter and Wardle13
asked those respondents answering yes to “Are you aware of any major health problems or diseases that are related to a low intake of fruit and vegetables?” If yes, what diseases or health problems do you think are related to a low intake of fruit and vegetables?
Bender and Derby14 gave respondents a brief description of the ingredient list and nutrition label and asked whether they pay attention to each type of information. The possible answers were yes and no.
Malam and colleagues15 used this demographic question “Which of these best describes the other adult(s) in your household?” The response options included: (1) Partner; (2) Child aged 17 or over; (3) Other adult relative; (4) Other adult (not a relative); (5) Other
Basil and colleagues (2009)16 asked respondents ‘‘When you were making food choices, how important were each of the following in determining which product you chose.’’ The list included calories, saturated fat, trans fat, unsaturated fat, sodium. Each was asked on a 1 to 7 (unimportant to extremely important)
Asam and Bucklin (1973)17 measured of “purchase preference” by having each study participant rank four brands shown (each with a different nutritional label) in the order that they would buy them if given the opportunity.
13 Parmenter K, Wardle J (1999) Development of a general nutrition knowledge questionnaire for adults. European Journal of Clinical Nutrition, 53(4), 298–308. 14 Bender MM, Derby BM (1992) Prevalence of Reading nutrition and ingredient information on food labels among adult Americans: 1982‐1988. Journal of Nutrition Education, 24(6), 292‐297. 15 Malam S, Clegg S, Kirwan S, McGinigal S, Raats M, Shepherd R, Barnett J, Senior V, Hodgkins C, Dean M (2009) Comprehension and use of UK nutrition signpost labelling schemes. London: Food Standards Agency. [www.food.gov.uk/multimedia/pdfs/pmpreport.pdf] 16 Basil MD, Basil DZ, Deshpande S (2009) A Comparison of Consumers and Dieticians: Nutrition Focus, Food Choice, and Mental Accounting, Journal of Nonprofit & Public Sector Marketing, 21: 283–297 17 Asam EH, Bucklin LP (1973) Nutrition Labeling for Canned Goods: A Study of Consumer Response, Journal of Marketing, 37(2): 32‐37.

Table 3. Types of survey questions, adapted from: Source: Instructional Assessment Resources (IAR) www.utexas.edu/academic/ctl/assessment/iar/teaching/plan/method/survey/survey_tables_questiontypes.pdf) Question Type
Open-ended (essay or short-answer)
Close-ended (multiple-choice or
yes/no)
Partial open-ended (multiple-choice with
‘other’ option)
Scaled Ranking
scale.
Advantages of survey research18:
• The research produces data based on real-world observations (empirical data).
• The breadth of coverage of many people or events means that it is more likely than some other approaches to obtain data based on a representative sample, and can therefore be generalizable to a population.
• Surveys can produce a large amount of data in a short time for a fairly low cost. Researchers can therefore set a finite time-span for a project, which can assist in planning and delivering end results.
Disadvantages of survey research19:
• The significance of the data can become neglected if the researcher focuses too much on the range of coverage to the exclusion of an adequate account of the implications of those data for relevant issues, problems, or theories.
• The data that are produced are likely to lack details or depth on the topic being investigated.
• Securing a high response rate to a survey can be hard to control, particularly when it is carried out by post, but is also difficult when the survey is carried out face-to-face or over the telephone.
Group discussions A focus group is defined as a carefully planned discussion designed to obtain perceptions of a defined area of interest in a permissive, nonthreatening environment20. The focus group presents a natural environment where participants are influencing and influenced by others - just as they do in real life. The researcher serves several functions in the focus group: moderating, listening, observing, and eventually analysing using an inductive process.
The topics of discussion in a focus group are carefully predetermined and sequenced based on an analysis of the situation. This analysis includes an in-depth study of the event, experience or topic in order to describe the context of the experience and ingredients or components of the experience. The questions are placed in an understandable and logical order.
Focus groups produce qualitative data that provide insights into the attitudes, perceptions and opinions of participants. These results are solicited through open-ended questions where respondents are able to choose the manner in which they respond and from observations of those respondents in a group discussion. The discussions are audio taped and transcribed. Careful and systematic analysis of the discussions provides clues and insights as to how a product, service or opportunity is perceived. The researcher derives understanding based on the discussion as opposed to testing or confirming preconceived hypothesis or theory.
Strengths of group discussions:
• It is a socially orientated research procedure that captures the dynamic interaction
18 Kelley K, Clark B, Brown V, Sitzia J (2003) Good practice in the conduct and reporting of survey research. International Journal for Quality in Health Care, 15(3):261–266. 19 Kelley K, Clark B, Brown V, Sitzia J (2003) Good practice in the conduct and reporting of survey research. International Journal for Quality in Health Care, 15(3): 261–266. 20Krueger RA (1994) Focus groups: A practical guide for applied research. Second Edition. Newbury Park, CA: Sage.

between individuals in a group
• The format allows the moderator to probe – the flexibility to explore unanticipated issues
• It has high face validity
• It is relatively low cost to run
• It can provide speedy results
• It can increase the sample size of qualitative results
Weaknesses of group discussions:
• You have less control than in an interview as participants interact and influence each other
• Data may be more difficult to analyse as comments must be analysed and interpreted in context
• Needs a carefully trained moderator to achieve good results
• Groups can vary significantly so need a reasonable number to balance the idiosyncrasies of individual sessions
• Groups may be difficult to assemble
• Discussion must be conducted in a conversation friendly environment so may have to pay participants for their travel/time/inconvenience etc.
Behavioural Observations Observational techniques include the ‘accompanied shop technique’ was originally developed in the consumer sciences as a way of modelling decision-making, where it is generally known as “shopping with consumers”. In this literature it has been used in a range of contexts where the results provide some encouragement of its potential in the current venture. Alexis, Haines and Simon’s21 investigation into why price differences failed to predict women’s clothing purchases demonstrated the method’s ability to elicit the less tangible factors influencing decisions and reveal how they interact with more obvious influences. King’s22 (1969) work a year later showed shoppers’ ability and willingness to usefully articulate their choices as they make them.
These early studies also illustrate the flexibility of the basic accompanied shop concept, demonstrating the ways it can be customised to address the research questions to hand. For example, because Alexis and colleagues23 were specifically interested in the factors that moderated the effect of price on dress purchases they allocated participants specific amounts
21 Alexis M, Haines G, Simon L (1968) Consumer Information Processing: the Case of Women’s Clothing. In King R (ed) Marketing and the New Science of Planning: Proceedings of the 1968 American Marketing Association Fall Educators’ Conference, 28, 197‐205. 22 King R (1969) A study of the Problem of Building a Model to Stimulate the Cognitive Processes of a Shopper in a Supermarket. In Haines G (ed) Consumer Behaviour: Learning Models of Purchasing. The Free Press, New York, 22‐67 23 Alexis M, Haines G, Simon L (1968) Consumer Information Processing: the Case of Women’s Clothing. In King R (ed) Marketing and the New Science of Planning: Proceedings of the 1968 American Marketing Association Fall Educators’ Conference, 28, 197‐205.

of money and instructed them to shop within certain product categories. King, on the other hand, avoided imposing any external constraints on shopping behaviour to preserve the validity of exercise, though he also interacted frequently with his shoppers, exerting a degree of influence which arguably bought that same validity into question.
The need to avoid interfering with the shopping process whilst still capturing relevant data is a difficulty inherent in the technique which researchers have addressed in many different ways with varying degrees of success. More hands-off solutions to this problem have included equipping shop assistants with microphones (e.g. Pennington, 196824) and interviewing shoppers immediately upon leaving the supermarket (e.g. Hills, Granbois and Patterson, 197325) although neither of these approaches allows immediate access to consumer reasoning around purchasing decisions.
Outside the realm of consumer research, more recent studies conducted in public health and food science contexts also indicate the potential of this technique in exploring reasoning around the food purchases of allergic shoppers. For example Higginson, Rayner, Draper and Kirk26 found think aloud protocols to be highly effective in discovering which aspects of food labels shoppers engage with.
The widespread use of think aloud protocols in various forms can arguably be traced back to Dunker’s27 work on productive thinking, via Ericsson and Simon’s28 attempts to restore verbal data to its rightful place in scientific research. The latter emphasise the crucial distinction between explanations of actions still held in short term memory and retrospective accounts of past decisions. In many cases thinking aloud tends to be used as one component of a broader methodology and thus often escapes being assessed as a technique in its own right29. The extent to which thinking aloud is assumed to provide insight into actual reasoning processes is likewise rarely addressed beyond what can be implied from the ways in which different researchers have chosen to use it. A key aspect of the variability in how thinking aloud is applied is whether or not it is followed by an interview. Branch30 finds that think aloud exercises and interviews after the fact, which she calls “think afters”, generate very different kinds of data and are best used in conjunction with each other.
Strengths of behavioural observations31:
• Provide direct information about behaviour of individuals and groups
• Permit evaluator to enter into and understand situation/context
• Provide good opportunities for identifying unanticipated outcomes
24 Pennington A (1968) Customer‐Salesman Bargaining Behaviour in Retail Transactions. Journal of Marketing Research, 5, 255‐262. 25 Hills G, Granbois D, Patterson J (1973) Black Consumer Perceptions of Food Store Attributes. Journal of Marketing, 37, 47‐57. 26 Higginson C, Rayner M, Draper S, Kirk T (2002) The Nutrition Label – Which information is Looked At? Nutrition and Food Science, 32, 145‐152. 27 Dunker K (1945) On Problem‐Solving, In Dashiell J (ed) (reprint 1976). Psychological Monographs, The American Psychological Assocation, Inc, Washington DC, 58, 1‐114. 28 Ericsson K, Simon H (1984) Protocol analysis – Verbal Reports as Data, Cambridge Massachusetts. 29 Nielsen J, Clemmensen T, Yssing (2002) Getting Access to What Goes on in People’s Heads? – Reflections on the Think‐aloud Technique. Nordic Conference of Computer‐Human Interaction, October 19‐23, 2002. 30 Branch J (2000) Investigating the Information‐seeking Processes of Adolescents: The Value of Using Think Alouds and Think Afters. Library and Information Science Research, 22(4) 371‐392 31 Frechtling, J. (2002). The 2002 user‐friendly handbook for project evaluation. [http://www.nsf.gov/pubs/2002/nsf02057/start.htm]

• Exist in natural, unstructured, and flexible setting
• Disadvantages of behavioural observations:
Weaknesses of behavioural observations32:
• Expensive and time consuming
• Need well-qualified, highly trained observers; may need to be content experts.
• May affect behaviour of participants.
• Selective perception of observer may distort data.
• Investigator has little control over situation.
• Behaviour or set of behaviours observed may be atypical.
32 Alouds and Think Afters. Library and Information Science Research, 22(4) 371‐392 32 Frechtling, J. (2002). The 2002 user‐friendly handbook for project evaluation. [http://www.nsf.gov/pubs/2002/nsf02057/start.htm]