
REPUBLIC OF KENYA MINISTRY OF PUBLIC HEALTH AND SANITATION …
78
MINISTRY OF PUBLIC HEALTH AND SANITATION REPUBLIC OF KENYA National Nutrition Action Plan 2012-2017
Transcript of REPUBLIC OF KENYA MINISTRY OF PUBLIC HEALTH AND SANITATION …
Nutrition Matters, Your Right, Your Role, Act Now
MINISTRY OF PUBLIC HEALTH AND SANITATION
REPUBLIC OF KENYA
National Nutrition Action Plan
2012-2017

Nutrition is Key, take up your role, Act now
Contents
List of Abbreviations and Acronyms iiiForeword vAcknowledgement viExecutive Summary viiChapter 1. Introduction 1 1.1 National Context policy framework 1 1.2 Nutrition Situation in Kenya 2 1.3 National Nutrition Response 4 1.4 Challenges 5Chapter 2. Nutrition Action Plan(2012-2017) 7 2.1 Background Information 7 2.2 Rationale 8 2. 3 Purpose of Nutrition Action Plan 9 2.4 Strategic Objectives 9 2.4.1 Strategic Objective 1 10 2.4.2 Strategic Objective 2 11 2.4.3 Strategic Objective 3 13 2.4.4. Strategic Objective 4 13 2.4.5 Strategic Objective 5 14 2.4.6 Strategic Objective 6 16 2.4.7 Strategic Objective 7 17 2.4.8 Strategic Objective 8 18 2.4.9 Strategic Objective 9 19 2.4.10. Strategic Objective 10 20 2.4.11 Strategic Objective 11 20 2.4 Coordination 21Chapter 3. Monitoring and Evaluation Plan 23 3.1 Monitoring 23 3.2 Evaluation 24Chapter 4. Annexes 27 Annex 1: Activity Implementation Matrix 27 Annex 2: Performance Monitoring and Evaluation Plan 47 Annex 3: Financial Resources Input In Kenya Shillings In Million 54References 62Tables and Figures Figure 1: Malnutrition trends in Kenya by gender 2Figure 2: Micronutrient Deficiencies in Kenya 3

Nutrition is Key, take up your role, Act now iii
List of Abbreviations and Acronyms
ACSM Advocacy Communication and Social Mobilization
AWP Annual Work Plan
COTU Central Organization of Trade Unions
BCC Behavior Change Communication
BFCI Baby Friendly Community Initiative
BFHI Baby Friendly Hospital Initiative
BMI Body Mass Index
CBO Community Based Organization
CHANIS Child Health and Nutrition Information System
CHEWs Community Health Extension Workers
CHMT County Health Management Committee
CHW Community Health worker
CSO Civil Society Organization
EBF Exclusive Breastfeeding
ECD Early Childhood Development
ERS Economic Recovery Strategy
FKE Federation of Kenya Employers
FNSS Food and Nutrition Security Strategy
GoK Government of Kenya
HIV Human Immunodeficiency Virus
HMIS Health Management Information Systems
HW Health Worker
ICN International Conference on Nutrition
IDA Iron Deficiency Anemia
IEC Information, Education and Communication
IFA Iron Folic Acid
IYCF Infant and Young Children Feeding
iv National Nutrition Action Plan 2012-2017
IYCN Infant and Young Children Nutrition
KARI Kenya Agricultural Research Institute
KDHS Kenya Demographic and Health Survey
KEBS Kenya Bureau of Standards
KEMRI Kenya Medical Research Institute
KEPSA Kenya Private Sector Alliance
KIHBS Kenya Integrated Household Budget Survey
KIRDI Kenya Industrial Research and Development Institute
KNBS Kenya National Bureau of Statistics
M&E Monitoring and Evaluation
MDG Millennium Development Goals
MOA Ministry of Agriculture
MOF Ministry of Fisheries
MOGC&SS Ministry of Gender, Children and Social Development
MOH Ministry of Health
MOLD Ministry of Livestock Development
MOT Ministry of Trade
MTEF Medium Term Expenditure Framework
MTP Medium Term Plan
MUAC Mid-Upper Arm Circumference
NFNSP National Food and Nutrition Security Policy
NGO Non-Governmental Organization
NNAP National Nutrition Action Plan
SO Strategic Objective
UN United Nations
UNICEF United Nations Children Fund
VAD Vitamin A Deficiency
Nutrition is Key, take up your role, Act now v
Foreword
Malnutrition in Kenya remains a big public health problem. Kenya has high stunting rates (35%) and is currently experiencing a rise in diet-related non-communicable diseases, such as diabetes, cancers, kidney and liver complications that are attributed to the consumption of foods low in fibre and high in fats and sugars. This double burden on malnutrition is serious and without deliberate and concerted effort, will lead to increased loss of productivity and lives.
The high burden of malnutrition in Kenya is not only a threat to achieving Millennium Development Goals (MDGs) and Vision 2030 but also a clear indication of inadequate realization of human rights. Reducing malnutrition in Kenya is not just a health priority but also a political choice that calls for a multi-sectoral focus driven by a political will that acknowledges the integral role that nutrition plays in ensuring a healthy population and productive workforce. Communities must be empowered to claim their right to good nutrition and guided to play their role towards realizing this right.
The solutions to malnutrition are practical, basic and have to be applied at scale and prioritized in the national development agenda. Kenya has shown renewed commitment to nutrition which is well articulated in the Food and Nutrition Security Policy and Kenya Health Strategic Plan. Therefore, development of this National Nutrition Action Plan (NNAP) provides practical guidance to implementation of Kenya’s commitments to nutrition. The NNAP provides a framework for coordinated implementation of high impact nutrition intervention by government and nutrition stakeholders for maximum impacts at all levels. Most of these interventions are part of Scaling Up Nutrition (SUN) actions that are being implemented globally to accelerate efforts towards meeting MDG 4 and 5. The NNAP is aligned to government’s Medium Term Plans (MTPs) to facilitate mainstreaming of the nutrition budgeting process into national development plans, and hence, allocation of resources to nutrition programmes.
The Ministry of Public Health and Sanitation shall be directly in charge of coordinating the implementation of the plan at the national level. However, under the new governance system in Kenya, there will be devolved coordination systems at the county levels, which will feed into the national level coordination unit. At each of the two levels, nutrition stakeholders will play a crucial role in execution of the plan. I call upon all of us to take action now.
Hon. Beth Mugo E.G.H., MPMinister for Public Health and Sanitation
vi National Nutrition Action Plan 2012-2017
Acknowledgement
The Division of Nutrition acknowledges the valuable contributions of various stakeholders in the development of the National Nutrition Action Plan 2012-2017. We express our sincere gratitude and indebtedness to UNICEF Kenya, USAID/MCHIP and Micronutrient Initiative, Save the Children UK and World Vision for the technical and financial support in developing and finalizing of this nutrition action plan. Further, we highly appreciate European Commission Humanitarian Aid Office (ECHO) for the financial support.
This action plan started with preliminary nutrition situation analysis which provided guidance on key areas of focus and contributed to the development of the first draft for review during the stakeholder workshop. We also acknowledge contributions from all the partners who participated in the stakeholder workshops to contribute to the situation analysis and build consensus on the strategic areas of the action plan, who included Development partners GAIN, World Food Programme, and World Health Organization: the following universities Egerton, University of Nairobi, Paediatrics, Community Health and Nursing departments, Kenyatta University, Jomo Kenyatta University of Agriculture and Technology, Kenya Methodist, Moi University and Mount Kenya. The Ministries of Agriculture, Education, Gender and Social Services, Planning and National Development, Medical Services, Northern Kenya and Other Arid Lands: The National Council for Children’s Services, Kenya Medical Training College, the Private Sector through Kenya National Fortification Alliance and the following government and non-governmental organizations: Kenya Medical Research Institute, Kenyatta National Hospital. Kenya Bureau of Standards, Kenya Nutritionists and Dieticians Institute, Implementing partners namely, Concern Worldwide, World Vision, Merlin, Kenya Red Cross, Action Aid, Action Against Hunger, Non Governmental organizations: Path IYCN, ICS Africa, International Baby Food Action Network, Central Organization of Trade Union, Kenya Human Rights Commission and Consumer Information Network, Kenya Network for Women with Aids.
The following persons are specially appreciated for drafting and final editing of the action plan: Lucy Gathigi, Grace Gichohi, Leila Odhiambo, Maina Mwai, Evelyn Kikechi, Valerie Wambani from the Division of Nutrition, Evelyn Matiri USAID/MCHIP, Esther Kariuki Micronutrient Initiative, Joyce Owigar, World Food Programme and Ruth Situma, UNICEF.
Last, but not least, the Division of Nutrition greatly appreciates the enabling environment provided by the Permanent Secretary, Mr. Mark Bor, the Director Public Health and Sanitation, Dr. Sharif and the Head, Department of Family Health, Dr. Wamae, that enabled us to mobilize the necessary resources to accomplish this task.
Terrie Wefwafwa HSCHead, Division of Nutrition
Nutrition is Key, take up your role, Act now vii
Executive Summary
Kenya’s food and nutrition security agenda espoused in the Food and Nutrition Security Policy (FNSP) developed Food and Nutrition Security Strategy (FNSS) identifies key priority areas which if implemented could greatly contribute to realization of optimal nutrition in Kenya. This 2012-2017 National Nutrition Action Plan (NNAP) is based on these blue prints, conducted nutrition situation analysis and proposals from extensive consultations with nutrition stakeholders. That informed the development of strategic objectives and corresponding intervention activities.
The purpose of the NNAP is to provide a framework for coordinated implementation of nutrition intervention activities by the government and nutrition stakeholders. The Plan has been developed at a time when the government of Kenya is stepping up efforts to realize Millennium Development Goals through implementation of High impact Nutrition interventions (HiNi). The HiNi interventions include: exclusive breastfeeding, timely complementary feeding, iron folate, vitamin A and zinc supplementation, hand washing, deworming, food fortification and management of moderate and severe acute malnutrition. Therefore, the proposed activities have been aligned to the overall efforts of meeting these Goals. However, greater emphasis is on the activities that are expected to result in achievement of MDGs 1,2,3,4,5 and 6 that have direct impact on the health of children and women of reproductive age (15-49 years). It is expected that implementation of the Plan will contribute to increased commitment, partnerships and networking as well as resource mobilization efforts among nutrition stakeholders towards achieving these goals. Also the NPA is aligned to government’s Medium Term Plans (MTPs) in facilitating mainstreaming of the nutrition budgeting process into national development plans and allocation of resources to nutrition programmes.
The Plan has been organized into chapters as follows: Chapter 1 provides introduction whereby there is presentation of the nutrition situation analysis in Kenya, on-going and recent responses and the main challenges. The strategic issues lead activities, and their expected outcomes are presented in Chapter 2. Chapter 3 describes the monitoring and evaluation approach including target setting for the Plan. The financial arrangements and the estimated budget are covered in Chapter 4. In Annex I, a matrix of strategic objectives, indicators and implementers as well as main interventions proposed for each of the 8 strategic issues is provided. In Annex II, the matrix of M & E targets and time-frames are presented for each strategic objective.
viii National Nutrition Action Plan 2012-2017
The 14 priority nutrition areas spelt out in the Food and Nutrition Security Strategy (FNSS) provided a conceptual guide to the development of this Plan of Action, which further identifies 11 strategic objectives each with corresponding activities and expected outcomes as follows:
i. Improve nutritional status of women of reproductive age (15-49 years): Improving the health of women of reproductive age is prioritized against the backdrop of worrying health trends among women. Nationally, one-quarter (25%) of women aged 15-49 are overweight or obese. This condition is largely associated with non-communicable dietary diseases such as hypertension and diabetes mellitus. Other nutritional conditions of concern among women include micronutrient deficiency. Intervention activities contributing to this strategic objective include; carrying out nutrition education on consumption of healthy foods during pregnancy and strengthening supplementation of iron and folate in pregnant women. These activities are expected to result in; reduced mortality, anemia, micronutrient deficiency, low birth weight and obesity.
ii. Improve nutrition status of children under five: This is to be achieved through lead activities such as enhanced exclusive breastfeeding, timely introduction of complementary foods and micronutrient supplementation. The expected net effect of these interventions is reduced stunting, wasting, anemia, obesity, underweight and ultimately, infant mortality.
iii. Reduce the prevalence of micronutrient deficiencies in the population: Prevalence of micronutrient deficiencies in the population is becoming a matter of concern to the government. This concern is the basis of inclusion of this strategic issue in the plan. Among the activities to be implemented to respond to this issue include; creating awareness on food fortification, supplementation and food based approaches as well as scaling up fortification of widely consumed food stuffs.
Nutrition is Key, take up your role, Act now ix
iv. Prevent deterioration of nutritional status and save lives of vulnerable groups in emergencies. The population in ASAL areas, whom a large proportion are nomadic livestock keepers, are almost wholly dependent on their livestock for food security. In order to address the underlying causes of food insecurity and vulnerability for these populations, activities must be implemented which take into account the seasonality of food availability and the extent to which the health of livestock, conflict and migratory patterns influence their nutritional status. Some of these activities could include supplementation of livestock feed and water to enhance milk production and working closely with other ministries to enhance livelihood diversification and the safeguarding of animal health.
v. Improve access to quality curative nutrition services. Nutrition care and support during illness is a key component of care which aims at preventing further deterioration of nutritional status and saving lives of persons affected. There is need to strengthen the capacity of institutions to provide optimal curative nutrition services.
vi. Improve prevention, management and control of diet related NCDs. The Kenya Health Sector Development Plan has outlined a key objective on halting and reversing the rising burden of non communicable conditions. This it is to be achieved by ensuring clear strategies for implementation to address all the identified non communicable conditions in the country. It has been recognized that some of these NCDs are diet related and hence the need to provide guidance on prevention and control measures to reduce morbidity and mortality and save on health costs.
vii. Improve nutrition in schools and other institutions: Improved nutrition in schools and other institutions is expected to contribute to the overall national efforts of promoting optimal nutrition. The activities proposed for action include; conducting a situation analysis on school/ institutional feeding and reviewing existing guidelines for school/institutional feeding to promote adequate nutrition.
x National Nutrition Action Plan 2012-2017
viii. Improve knowledge, attitudes and practices on optimal nutrition: The importance of this strategic issue is to have provision of information as a precursor in adoption of positive attitude and practices on optimal nutrition by Kenyans. This is to be realized through development, dissemination and implementation of a national nutrition Information, Education and Communication/Behavior Change Communication (IEC/BCC) strategy. In addition, this would involve training service providers on IEC/BCC and advocacy skills. This strategic issue is expected to contribute to improved nutrition practices in the lifecycle/lifespan.
ix. Strengthen the nutrition surveillance, monitoring and evaluation systems: Nutrition monitoring and evaluation systems will be strengthened to enhance benefits of standardized M&E tools for effective reporting and planning. Among the activities to be implemented include finalizing M & E framework for the nutrition sector based on this National Nutrition Action Plan (2012-2017).
x. Enhance evidence-based decision-making through operations research: Evidence-based decision-making through operations research is to be enhanced for purposes of strengthening the foundation of informed nutrition programme development and service provision.
xi. Strengthen coordination and partnerships among the key nutrition actors: The importance of harnessing synergy in the efforts of the nutrition stakeholders is recognized in this strategic issue. Identification of partners in WASH, education, health and livelihoods sectors with which partnerships can be formed will result in greater impact of nutrition activities implemented across the stakeholder sectors.
All of the strategic issues presented as strategic objectives, their corresponding activities, indicators, implementers and time-frame are detailed in the matrix (Annex 1) in the plan.
Nutrition is Key, take up your role, Act now xi
Coordination of implementation of this Plan falls within the coordination mechanism of the agreed upon Food Security and Nutrition Strategy 2008. Under this Strategy, the Ministry responsible for health shall be directly in charge of coordinating the implementation of the Plan at national level. However, under the new governance system in Kenya, there will be devolved coordination systems at the county levels, which will feed into the national level coordination unit. At each of the two levels, nutrition stakeholders will play a crucial role in the execution of the Plan.
A national system for monitoring and evaluating (M&E) of the Plan is an important component and is detailed in the matrix (Annex 2) in the plan. The M&E framework aims at meeting information needs of different stakeholders and will be implemented through a national structure comprising a Technical Working Group under the direction of the Division of Nutrition. The M&E framework present targets to be achieved for each strategic objective’s expected outcomes and outputs and for some strategic objectives, the outputs only.
The targets have been arrived at based on analysis of the target trends in health sector in Kenya and other countries.
This Nutrition Action Plan also provides an estimation of the total resources required to achieve the goal and objectives outlined in the Food Security and Nutrition Policy. The cost estimates cover the five years (2012-2017) of implementation. The costs are based on an ideal situation and standard costing models rather than past and ongoing programmatic experiences. Overall, the projected total cost for implementing the activities of the Plan for next five years is KSH 69 billion.

xii National Nutrition Action Plan 2012-2017
Chapter 1.0 Introduction
1.1 National Context Policy FrameworkSince the year 2003, Kenya has been building a solid foundation of becoming globally competitive and prosperous in its economy. These efforts have been realized through implementation of the Economic Recovery Strategy (ERS) covering the period 2003-2007. This strategy focused on restoration of economic growth, rehabilitation and expansion of infrastructure, equity and poverty reduction, and improving governance. It is the successful implementation of ERS that paved way for Vision 2030, which aims to transform Kenya into a globally competitive and prosperous nation with a high quality of life. The Vision 2030 has social, political governance and economic pillars. Under the social pillar, the health sector is identified as critical in maintaining a healthy working population, necessary for the increased labor production that Kenya requires in order to match its global competitors. Similarly, Kenya’s commitment to the realization of health-focused Millennium Development Goals (MDGs) 1, 3, 4, 5, 6 and 7 is expected to contribute to the goal of having a healthy population. Nutrition is critical for survival, health and development. Investing in nutrition will enable the country to make significant progress in achieving targets of MDGs 1, 4, 5, and 6 which are directly related to improvement of nutrition status of children and women the political governance pillar too, has direct bearing on the Kenyans’ health in general and nutrition in particular. One of the pillar’s successful flagship projects has been promulgation of the new constitution. Under the economic and social bill of rights, every Kenyan has a right to adequate food of acceptable quality as well as clean and safe water in adequate quantities. Further, the constitution stipulates that every child has the right to basic nutrition, shelter and healthcare. Enshrining the right to food, basic nutrition and healthcare in the constitution marks a radical shift in programme development and implementation around these issues. And the government takes greater responsibility in ensuring that the right is enjoyed by the Kenyans.
Government of Kenya has developed the food and nutrition security policy an overarching policy to address nutrition security in the country. This policy places nutrition central to human development in the country; emphasizes the need to ensure of right to nutrition as a constitutional right, recognizes disparities in nutrition and provides relevant policy directions; ensures multi-sectoral approach to addressing malnutrition in the country; ensures life-cycle approach to nutrition security and ensures evidence based planning and resource allocation.
The KHSSP’s goal is ‘accelerating attainment of health impact goals’. The sector aims to attain this through focusing on implementation of a broad base of health and related services that will impact on health of Kenya. Indeed the main emphasis will be placed on implementing interventions, and
Nutrition Matters, Your Right, Your Role, Act Now 11Nutrition Matters, Your Right, Your Role, Act Now
2 National Nutrition Action Plan 2012-2017
prioritizing investments relating to maternal and newborn health, as it is the major impact area for which progress was not attained in the previous strategic plan. This Nutrition action plan recognizes the importance of the first 1000 days of a child’s life and aims to prioritize high impact nutrition interventions which will impact on reduction of morbidity and mortality. The High impact Nutrition interventions are recommended as part of Scaling Up Nutrition (SUN) Framework, with evidence from the Lancet series 2008 of well tested and low cost interventions which protect the nutrition of vulnerable individuals and communities and benefit millions of people if incorporated in food security, agriculture, social protection, health and educational programmes.
With the growing burden of over nutrition, Kenya is committed to the 63rd WHA resolution to reduce 25% of premature deaths as result of NCDs by 2025, promote active aging and engage in partnerships to reduce NCDs. Reversing NCDs is also central to the KHSSP III health outcomes.
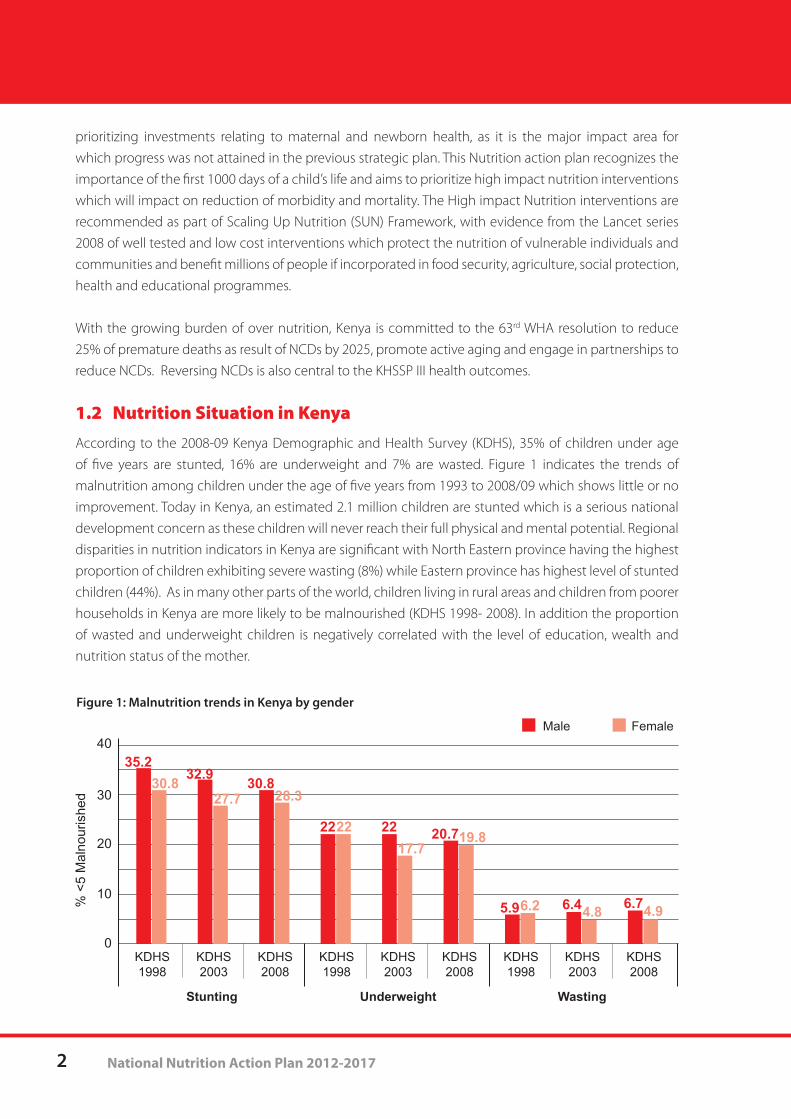
1.2 Nutrition Situation in KenyaAccording to the 2008-09 Kenya Demographic and Health Survey (KDHS), 35% of children under age of five years are stunted, 16% are underweight and 7% are wasted. Figure 1 indicates the trends of malnutrition among children under the age of five years from 1993 to 2008/09 which shows little or no improvement. Today in Kenya, an estimated 2.1 million children are stunted which is a serious national development concern as these children will never reach their full physical and mental potential. Regional disparities in nutrition indicators in Kenya are significant with North Eastern province having the highest proportion of children exhibiting severe wasting (8%) while Eastern province has highest level of stunted children (44%). As in many other parts of the world, children living in rural areas and children from poorer households in Kenya are more likely to be malnourished (KDHS 1998- 2008). In addition the proportion of wasted and underweight children is negatively correlated with the level of education, wealth and nutrition status of the mother.
Figure 1: Malnutrition trends in Kenya by gender
0
10
20
30
% <
5 M
alno
uris
hed
4035.2
32.9 30.8
22 22 20.7
5.9 6.4 6.7
30.827.7 28.3
2217.7
19.8
6.2 4.8 4.9
KDHS1998
KDHS2003
KDHS2008
KDHS1998
Male Female
KDHS2003
UnderweightStunting Wasting
KDHS2008
KDHS1998
KDHS2003
KDHS2008
Nutrition is Key, take up your role, Act now 3
Kenya is increasingly faced with diet-related non-communicable diseases, especially in urban areas. These are mainly caused by excessive energy intake associated with purchased meals and processed foods, and decreasing levels of physical activity in urban settings. Changing lifestyles and eating habits have resulted in non-communicable diseases including cardiovascular, cancers, diabetes which are closely related to obesity and represent a significant development challenge. The health consequences of obesity related diseases range from premature death to disabilities that reduce the quality of life. Evidence from the KDHS (2008-09) indicates increasing prevalence of overweight and obesity. Analysis of obesity among pre-school children indicates that approximately 18% are overweight while 4% are obese. The proportion of women aged 15-49 who are overweight and obese has increased from 23% in 2003 to 25% in 2008-09. Nairobi has the highest prevalence of overweight and obese at 41% among women and 3rd to 5th wealth quintile being the most affected. Being overweight and obese are risk factors for non-communicable diseases such as hypertension, diabetes and cardiovascular diseases. According to WHO 28 % of all deaths result from NCD’s. Currently, the prevalence of diabetes is 4.2%, while 12.7% of the population is hypertensive. Cancer incidence is estimated to be 28,000 annually, while the annual mortality is 21,000 people.
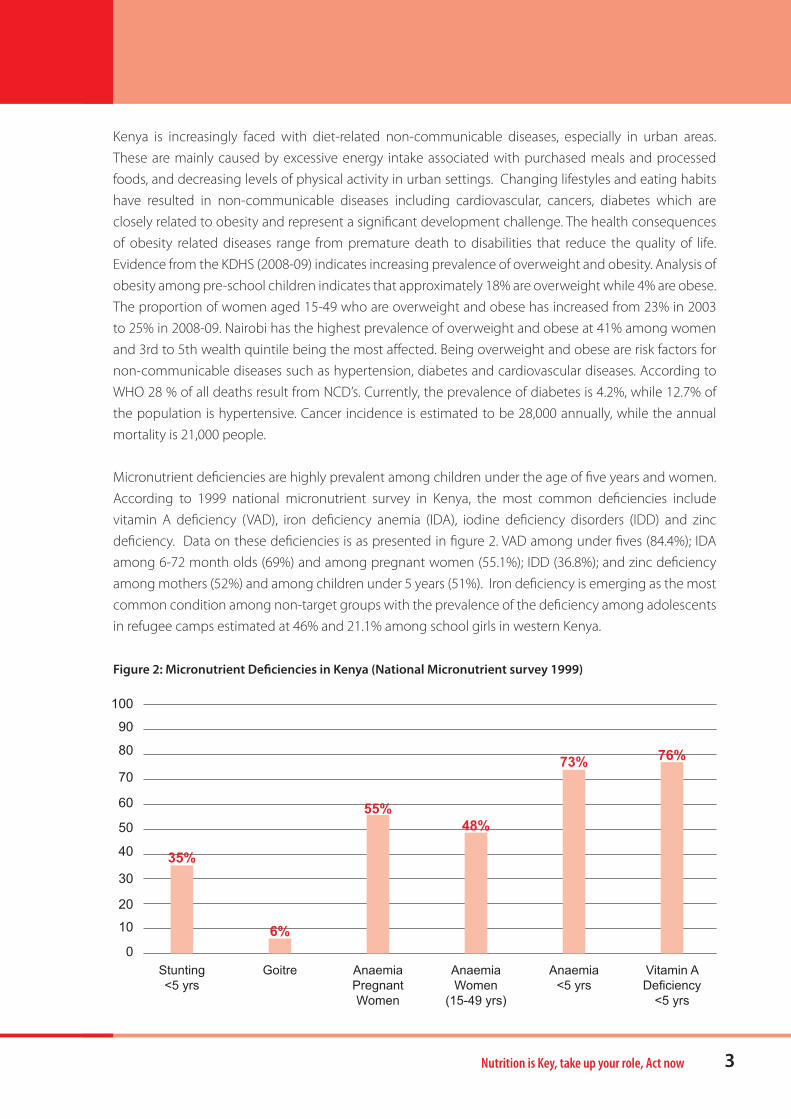
Micronutrient deficiencies are highly prevalent among children under the age of five years and women. According to 1999 national micronutrient survey in Kenya, the most common deficiencies include vitamin A deficiency (VAD), iron deficiency anemia (IDA), iodine deficiency disorders (IDD) and zinc deficiency. Data on these deficiencies is as presented in figure 2. VAD among under fives (84.4%); IDA among 6-72 month olds (69%) and among pregnant women (55.1%); IDD (36.8%); and zinc deficiency among mothers (52%) and among children under 5 years (51%). Iron deficiency is emerging as the most common condition among non-target groups with the prevalence of the deficiency among adolescents in refugee camps estimated at 46% and 21.1% among school girls in western Kenya.
Figure 2: Micronutrient Deficiencies in Kenya (National Micronutrient survey 1999)
100
0
10
20
30
40
50
60
70
80
90
35%
6%
55%48%
73% 76%
Stunting <5 yrs
Goitre Anaemia Pregnant Women
Anaemia Women
(15-49 yrs)
Anaemia <5 yrs
Vitamin A Deficiency
<5 yrs
4 National Nutrition Action Plan 2012-2017
With reference to data on infant and young child nutrition, KDHS 1998, 2003 and 2008-09 show that the median duration of breastfeeding has remained at 21 months. KDHS 2008/09 also indicates a significant improvement in exclusive breastfeeding (EBF) of children less than six months of age at32%compared to 11% in 2003.
Malnutrition is the single greatest contributor to child mortality at 53% (WHO 2010). The immediate causes of malnutrition are inadequate food intake and disease while the underlying causes include poor maternal/child care practices, household food insecurity, inadequate health services.
1.3 National Nutrition Response There have been several policy and programmatic efforts aimed at addressing the nutrition problems in Kenya. The FNS policy is in place as a sessional paper No 1 of 2012 and has been used to develop the FNSS 2012-2017 and the National Nutrition Action Plan 2012-2017. In 2010, the government and partners agreed to focus additional resources in the country to scale-up evidence-based High Impact Nutrition Interventions. The nutrition sector is being coordinated through Nutrition Interagency Coordinating Committee (NICC) with four subcommittees, namely, Maternal Infant and Young Child Nutrition, Nutrition Technical Forum, National Micronutrient Deficiency Control Council, Healthy Diets and Lifestyle plus Research, Monitoring and Evaluation. The NICC has mobilized resources from the developmental partners to support implementation of nutrition interventions. Government resources allocation for nutrition is at 2.0% of the health budget.
Nutrition is Key, take up your role, Act now 5
1.4 ChallengesThere is low understanding of linkage between national food security, basic education, and water and sanitation strategies on one hand and nutrition on the other. Furthermore, programme strategies are vertical in nature and lack nutrition as an outcome indicator. As a result, there is need to sensitize policy makers and programmers on the causal factors of malnutrition and influence them to address malnutrition in a holistic approach and broad manner. There is also need for organized coordination and collaboration of the different sectors in relation to nutrition objectives. Moreover, some pieces of legislations, nutrition-related policies, strategies and guidelines need urgent review to align them to the current Constitution.
In spite of the high malnutrition rates and disease burden in the country, the government’s budgetary allocation for health sector, at 7% for financial year 2009/2010, still falls below the 15% standard stipulated in the Abuja declaration. This compares poorly with countries such as Rwanda and Botswana with over 15% health financing. The government’s contribution to health financing has remained low and unchanging, resulting in increased reliance on donor financing especially for programmes targeting children and women. The budgeting processes of Medium Term Expenditure Framework (MTEF) and Annual Operations Plan (AWPs) are elaborate and provide good opportunity for the Nutrition Division to lobby for increased funding towards nutrition programmes. Therefore, there is need to streamline the top-bottom Resource Allocation Criteria Formula and consequent adoption of bottom-up Annual Operation Plan process by the government.
The human resource gap for nutritionists and dieticians within public health facilities and at community level is critical and needs immediate action. According to the Kenya Nutrition and Dieticians Institute, there are 1290 nutritionists, with 600 of them in public health facilities. This translates to 1 nutritionist for every 31,000 people.
Kenya has numerous nutrition stakeholders including government ministries, United Nations (UN) agencies, donors, private and public teaching and research institutions, nutrition working groups and professional associations, and the private sector. However, even with so many players in nutrition, little positive impact, including impact from implementation of high impact nutrition interventions, has been realized from nutrition interventions. This, in part, is attributed to challenges arising from coordination of the nutrition programmes in different sectors, the short-term nature of interventions which mainly target emergency situations and the lack of holistic programming leading to interventions with limited scope and impact. These issues call for sector-wide approaches to nutrition programming in the country.
6 National Nutrition Action Plan 2012-2017
Chapter 2Nutrition Action Plan (2012-2017)
2.1 Background Information Since independence in 1963, the government of Kenya (GoK) has developed policies and programmes to address nutrition issues based on the national situation analysis. International initiatives, too, have been crucial in shaping the direction of nutrition efforts in the country. For instance, the International Conference on Nutrition (ICN) held in Rome in December 1992, provided an opportunity for re-assessment of Kenya’s nutrition strategies, thereby forming a strong basis for the development of 1994-1997 National Nutrition Action Plan (NNAP) for Kenya. Lessons learnt from the implementation of the 1994-1997 NPA as well as the assessment of the existing and emerging nutrition issues led to the formulation of the Food and Nutrition Security Policy (FNSP) and implementing of its strategy in the year 2008.
The Food and Nutrition Security Strategy highlights fourteen (14) priority nutrition areas to be addressed towards achieving the bigger nutrition agenda in Kenya. The priority areas include; micronutrient deficiency prevention and control, nutrition promotion, Institutional feeding, nutrition and infection, diet-related non-communicable diseases, emergency management, recovery and long term management; and data collection and management on nutrition, cross-sectoral data analysis on food and nutrition and information, education and communication. The Strategy proposes implementation of nutrition interventions through a life-cycle approach. Lifecycle approach to nutrition challenges is defined as an evidence-based approach that explores nutritional foundations, the growth, development and normal functioning of individuals through each stage of life and/or at all age groups. The approach provides a detailed account of the nutritional needs throughout the life cycle and highlights the special nutritional features of each of these stages. The objectives of life cycle are to improve women’s nutrition throughout their lifecycle; promote optimal infant and young child feeding practices; promote appropriate nutrition for school children and adolescents; promote healthy lifestyles across the population; and improve nutrition care and support for the elderly. FSNS provides a conceptual guide to the development of this nutrition action plan which has further identified eleven (11) strategic objectives each with corresponding activity and expected outcomes.
7Nutrition Matters, Your Right, Your Role, Act Now
8 National Nutrition Action Plan 2012-2017
2.2 RationaleSituation analysis rates of child/infant mortality rates and maternal mortality) Maternal deaths have increased from 414/100,000 live births (KDHS 2003) to 488/100,000 live birth (KDHS 2008/9). No significant positive change is observed in most nutrition indicators over the last 10 years. This leads to not only mortality but also poor quality of lives. Improving nutritional status and reducing vitamin and mineral deficiencies are integral to achieving the Millennium Development Goals and the Kenya’s Vision 2030.
While Kenya has adopted a set of high impact nutrition interventions1, the coverage of these interventions remains very low due to inadequate resources and low prioritization of nutrition as reflected by low investment in nutrition. Investment in nutrition programmes is not commensurate to its critical role in reducing child mortality. It has to be recognized that attainment of MDG Goals, meaningful economic development and achievement of the 2030 vision will not happen without an urgent improvement in nutrition. Nutrition interventions that have proven to be cost effective, feasible and to have impact by preventing malnutrition before it happens should be brought to scale. Therefore the Nutrition Action Plan is practical tool that presents an opportunity to accelerate action towards achieving MDGs and Vision 2030. The Nutrition Action Plan will also be used as a resource mobilization tool by nutrition stakeholders and a guide to investment to cost effective nutrition interventions.
It is however appreciated that the achievement of the targeted MDGs by this Plan can only be realized if synergy in nutrition and other health programmes including water and sanitation, HIV&AIDS and malaria prevention and control is harnessed. This Plan is, therefore, to be implemented within the framework of integrated approach by the Ministry responsible for health. In addition, linkages with efforts in other development sectors notably agriculture, water, education and industry will be strengthened so as to contribute to the realization of targeted achievements by this Plan to address underlying causes of malnutrition.
For each of the key intervention activities identified in the activity matrix of the Plan, there are lead implementing and supporting agencies. This is to ensure that lead agencies are held accountable for the implementation of the Plan. The Plan is aligned to the government’s Medium Term Plans (MTPs) to ensure that the government factors the Plan’s intervention activities into its planning and budgeting processes, leading to allocation of financial resources to nutrition programme activities.
1 HighImpactInterventionsadoptedinKenyainclude:Breastfeedingpromotion,complementaryfeedingforinfantsaftertheageofsixmonths,improvedhygienepracticesincludedhandwashing,VitaminAsupplementation,zincsupplementationfordiarrheamanagement,multiplemicronutrient,de-worming,iron-folicacidsupplementationforpregnantwomen,saltiodization,ironfortificationofstaplefoods,preventionortreatmentformoderateundernutritionandtreatmentofsevereacutemalnutrition
9Nutrition is Key, take up your role, Act now
2. 3 Purpose of Nutrition Action PlanThis Plan has been developed to operationalize the strategies outlined in the Food Security and Nutrition policy 2012. It serves as a road map for coordinated implementation of nutrition interventions by the government and nutrition stakeholders across development sectors for maximum impact.
2.4 Strategic ObjectivesThis section highlights 11 strategic objectives that need to be addressed in order to realize the goal of promoting and improving nutrition status of all Kenyans. These objectives include the following:i. To improve the nutritional status of women of reproductive age (15-49 years)ii. To improve the nutritional status of children under 5 years of ageiii. To reduce the prevalence of micronutrient deficiencies in the populationiv. To prevent deterioration of nutritional status and save lives of vulnerable groups in emergenciesv. To improve access to quality curative nutrition services vi. To improve prevention, management and control of diet related NCDsvii. To improve nutrition in schools, public and private institutionsviii. To improve nutrition knowledge attitudes and practices among the populationix. To strengthen the nutrition surveillance, monitoring and evaluation systemsx. To enhance evidence-based decision-making through researchxi. To Strengthen coordination and partnerships among the key nutrition actors and mobilize essential
resources.
10 National Nutrition Action Plan 2012-2017
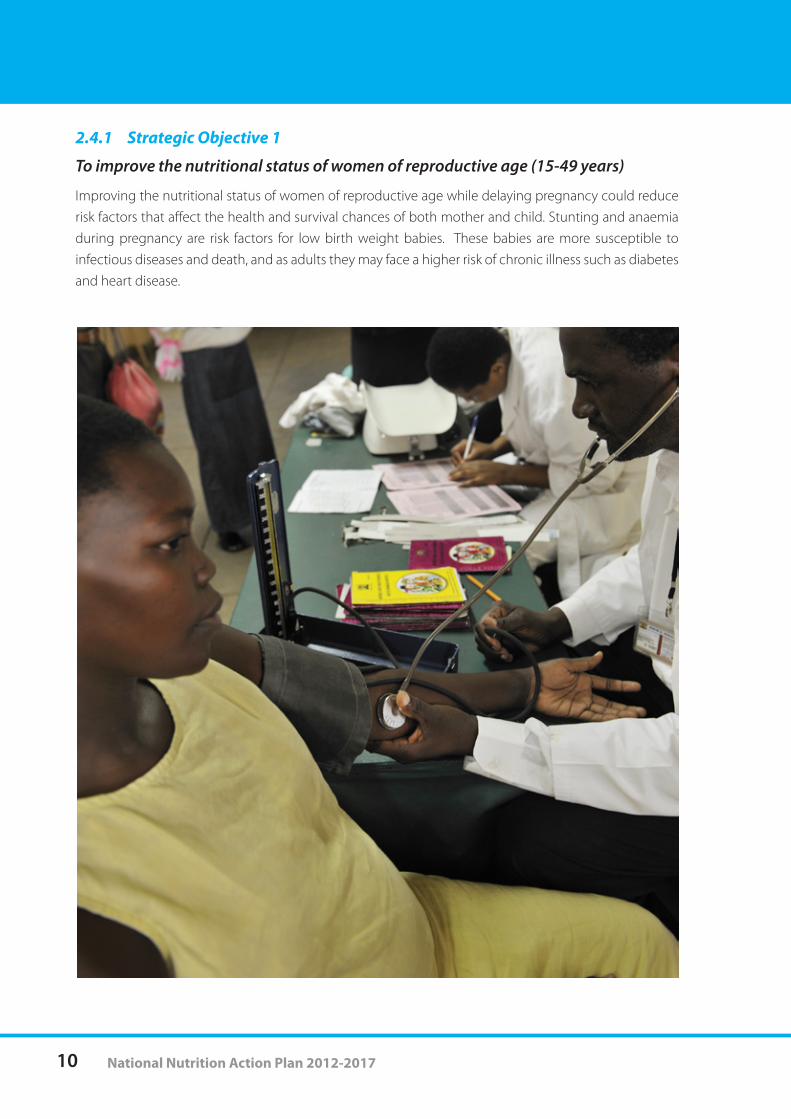
2.4.1 Strategic Objective 1
To improve the nutritional status of women of reproductive age (15-49 years)
Improving the nutritional status of women of reproductive age while delaying pregnancy could reduce risk factors that affect the health and survival chances of both mother and child. Stunting and anaemia during pregnancy are risk factors for low birth weight babies. These babies are more susceptible to infectious diseases and death, and as adults they may face a higher risk of chronic illness such as diabetes and heart disease.
11Nutrition is Key, take up your role, Act now
The main causes of malnutrition among WRA include sub-optimal feeding practices especially during pregnancy, heavy workload, and low micronutrient intake during pregnancy. The plan focuses on activities that will ensure that women of reproductive age receive adequate micro and macro nutrients.
Priority Areas• PromotehealthydietarypracticesamongWRA• Promoteadequatemicronutrientintake• Promoteroutineweightmonitoringandappropriatecounselingforpregnantwomen• Promoteappropriatemanagementofmalnutritionofpregnantandlactatingwomen• EnsurethatallHIVpositivemothersarecounseledongoodnutritionpractices.• Strengthenthecapacityofhealthfacilitiestoadequatelyoffermaternalnutritionservices.
Expected outcome: Improved nutritional status of women of reproductive age.
2.4.2 Strategic Objective 2To improve the nutritional status of children under 5 years of age
Malnutrition remains a major threat to the survival, growth and development of children in Kenya. Poor nutrition in infancy and early childhood increases the risk of infant child morbidity and mortality, diminished cognitive and physical development marked by poor performance in school. Malnutrition also impacts on productivity later in life. One of the indicators used to assess progress towards MDG 1 and 4 is the prevalence of underweight among children under the age of 5 years old. Malnutrition in children can be attributed to a variety of factors including poor infant and young child feeding practices, poor maternal nutrition, low access to adequate and diversified diets, childhood illnesses and inadequate access to health and nutrition services.
This Plan focuses on activities that will contribute to the exploitation of the critical ‘window of opportunity’ from pre-pregnancy until two years of age as endorsed in the 2010 UN summit resolution on nutrition. According to Lancet Nutrition Series published in 2008, if the package of Essential Nutrition Interventions is effectively accessed by mothers from the conception period and children up to two years of age and implemented on a wider scale, in the short run, infant mortality would reduce by 25%, maternal mortality by 20% and chronic malnutrition/stunting in children by 30%.
Priority Areas • Promoteexclusivebreastfeedingforthefirstsixmonthsofbaby’slife• Promoteoptimalcomplementaryfeedingwithcontinuedbreastfeedingforatleasttwoyears• Provideappropriatemicronutrientsupplementstochildrenunderfiveyears• Strengthengrowthmonitoringandpromotionforchildrenunderfiveyearsofage• Strengthenreferralmechanismandlinkagebetweenthecommunityandhealthfacility.• Developanationalmonitoringplanfornutritioncommodities• Ensurefoodsafetyofnutritioncommodities.
12 National Nutrition Action Plan 2012-2017
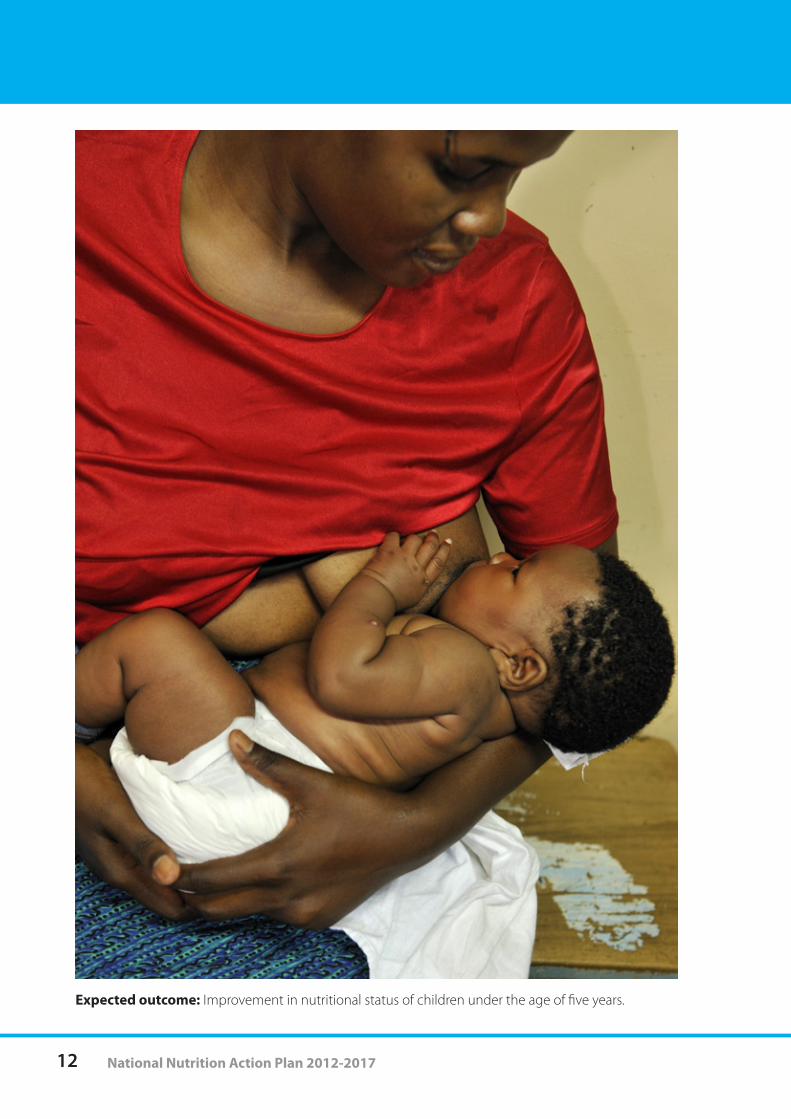
Expected outcome: Improvement in nutritional status of children under the age of five years.
13Nutrition is Key, take up your role, Act now
2.4.3 Strategic Objective 3To reduce the prevalence of micronutrient deficiencies in the population
Micronutrient deficiencies are of public health concern due to their devastating effect on the physical and mental well-being of the population. They are also a risk factor for increased morbidity and mortality among children under five years, pregnant and lactating women. The main causes of micronutrient deficiencies include poor dietary diversification, infections such as malaria and food insecurity. There are national micronutrient guidelines highlighting key strategies used in prevention and control of micronutrient deficiencies. These include supplementation, food fortification, and promotion of dietary diversification and public health measures such as de-worming and malaria control. The National Micronutrient Deficiency Control Council and the Kenya National Food Fortification Alliance are the national coordinating structures for the micronutrient deficiency control program.
Some of the programmatic challenges experienced are inadequate resources, documentation and monitoring, stock outs of commodities and inadequate knowledge on importance of micronutrients among health service providers and the general population. This strategic objective, therefore, focuses on the need to ensure that the population receives adequate amounts of micronutrients, through dietary diversification, supplementation and fortification at all levels in the country.
Priority areas• Review,developandimplementnationalmicronutrientdeficiencycontrolstrategyandguidelines• Capacitybuildingofserviceprovidersonmicronutrientsdeficiencypreventionandcontrol• Advocateandcreateawarenessonfoodfortification,supplementationanddietarydiversification• Strengthenthenationalfoodfortificationprogram• Strengthenthenationalmicronutrientsupplementationprogram• Strengthenmonitoringandevaluationsystemsforthemicronutrientstrategies• Integratemicronutrientpreventionandcontrolstrategiesinthecommunitystrategy
Expected Outcome: Reduced prevalence of micronutrient deficiencies in the population.
2.4.4 Strategic Objective 4To prevent deterioration of nutritional status and save lives of vulnerable groups in emergencies
The main catastrophes that lead to emergencies in Kenya include drought, flood, fires, landslides and internal and cross-border civil strife. These emergencies result in loss of human lives, livestock, and livelihoods, and deterioration of health and nutrition status of the affected population. Children, women and the elderly are most vulnerable groups during the crisis period and therefore require urgent attention.Nutrition Technical Forum (NTF) is the national coordinating structure for the food security and emergency nutrition program in the nutrition sector. At district level, the districts NTFs have the same mandate. However, these structures require strengthening for effective emergency preparedness and response. Other challenges that require attention include weak multi-sectoral coordination of efforts
14 National Nutrition Action Plan 2012-2017Kenya National Nutrition Plan of Action 2012-2017
by government, partners and key stakeholders, inadequate disaster preparedness, delayed response to emergencies, poor adherence to guidelines on emergency commodities, resource constraints and poor linkages of short term efforts with long term programs such as food security initiatives, High Impact Nutrition Interventions and disease control.
This strategic objective will focus on effective disaster preparedness, response and management of nutrition emergencies. This calls for the need to harness all the required resources from all stakeholders to plan implement and monitor the response plan put in place.
Priority areas• Review,developandimplementguidelinesfordisasterpreparedness,responseandmanagementof
nutrition emergencies. • StrengthenthecapacityofcountyNTFtodevelopandimplementemergencyresponseplans• Createpublicawarenessontheimportanceofnutritioninemergencyatalllevel• Strengthencoordinationmechanismsinemergencysituationsatnationalandcountylevel• Strengthenmonitoringandevaluationsystemsinemergencysituations.• Strengthenlogisticsmanagementandsupplychainsystemforfoodandnon-fooditems• Resourcemobilizationfortimelyresponse
Expected Outcome: Timely and coordinated response to minimize consequences of emergency on health and nutritional status of affected populations.
Expected output: Nutrition monitoring and evaluation systems will be strengthened, allowing more programme managers to appreciate the benefits of standardized M&E tools for effective reporting and planning. 2.4.5 Strategic Objective 5 To improve access to quality curative nutrition services
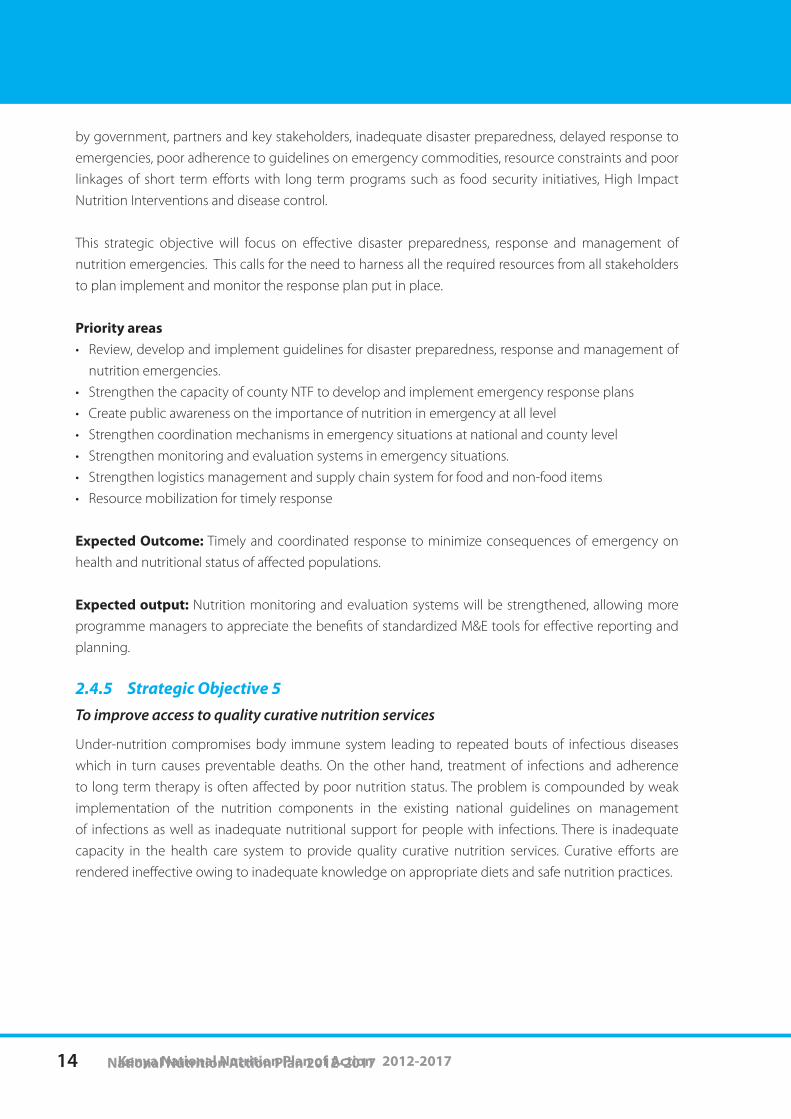
Under-nutrition compromises body immune system leading to repeated bouts of infectious diseases which in turn causes preventable deaths. On the other hand, treatment of infections and adherence to long term therapy is often affected by poor nutrition status. The problem is compounded by weak implementation of the nutrition components in the existing national guidelines on management of infections as well as inadequate nutritional support for people with infections. There is inadequate capacity in the health care system to provide quality curative nutrition services. Curative efforts are rendered ineffective owing to inadequate knowledge on appropriate diets and safe nutrition practices.
15Nutrition is Key, take up your role, Act now
Priority Areas • Review,developandimplementnationalguidelinesandstandardsofnutritionalcareinmanagement
of common diseases. • Strengthenthecapacityofhealthcaresystemstoprovideoptimalcurativenutritionservices• Resourcemobilizationfornutritionalcareandtreatmentforinfections• Strengthenmonitoringandevaluationofcurativenutritionservices• Ensurefoodsafetyofnutritioncommodities. Expected Outcome: • Improvedaccesstoqualitycurativenutritionservices• Improvedcurerate.
16 National Nutrition Action Plan 2012-2017
2.4.6 Strategic Objective 6To improve prevention, management and control of diet related Non Communicable Diseases
The prevalence of diet related non-communicable diseases has been on the increase, especially in urban area. This increase has been caused by lifestyle changes characterized by excessive intake of highly refined and high-fat foods, sugar and salt, coupled with limited physical activity. As a result, the burden of morbidity, disability and mortality attributable to these diseases is high. Being overweight and obese are risk factors for non-communicable diseases such as hypertension, diabetes and cardiovascular diseases. Some of the key programmatic challenges include inadequate data collection and reporting, limited screening of the population, inadequate knowledge among health care provider and general population, resource constraints and lack of comprehensive strategy and guidelines for prevention, management and control of diet related NCD.
This strategic objective addresses the need to promote healthy diets and physical activity across the population using the lifecycle approach with the view of reversing the rising trends of non communicable diseases.
Priority Areas• Review,developandimplementcomprehensivestrategyandguidelinesforprevention,management
and control of diet related NCDs• Capacitybuildingforserviceprovidersonprevention,managementandcontrolofdietrelatedNCDs• Createpublicawarenessontheimportanceofprevention,managementandcontrolofdietrelated
NCDs using the national ACSM• Strengthencoordinationmechanismsforhealthydietandlifestyleprogramsatnationalandcounty
level• StrengthenmonitoringandevaluationsystemsfordietrelatedNCDs.
Expected outcome: Improved prevention, management and control of diet related NCDs.
17Nutrition is Key, take up your role, Act now
2.4.7 Strategic Objective 7 To improve nutrition in schools, public and private institutions
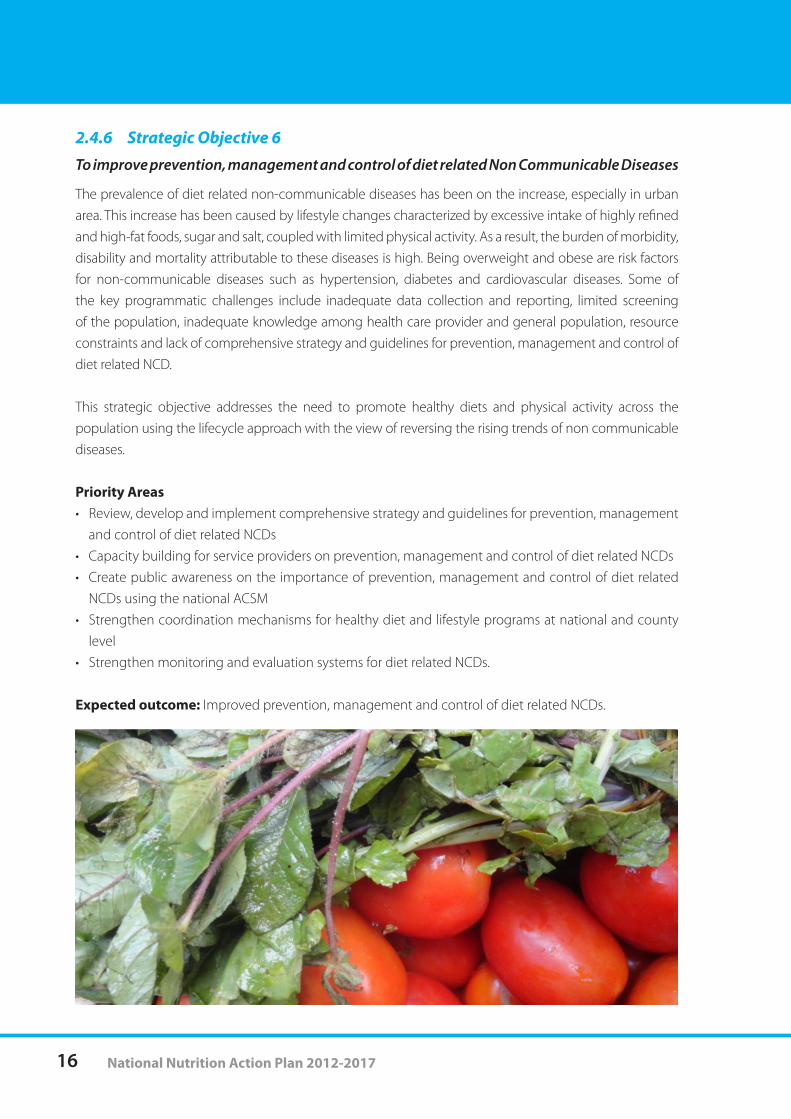
Though policies and guidelines exist, they are inadequate in coverage of the institutions. In addition, the guidelines are not adequately adhered to in realization of optimal nutrition in schools and other institutions in Kenya, therefore, presenting a serious challenge. This may partly be attributed to inadequacy in adherence to nutrition policies and guidelines that are in place. In addition, it is possible that there is inadequate knowledge on optimal nutrition within institutions. Malnutrition in early childhood affects school enrolment, retention, and overall performance. Good nutrition is therefore, essential to realize the learning potential of children and to maximize returns to educational investments.
Nutrition education and promotion of good nutrition practices in schools are known to have a significant effect in fostering healthy eating habits. Schools provide an ideal setting to promote good nutrition practices early in life since they reach a high proportion of children and adolescents. The School Health and nutrition policy emphasizes the promotion of school gardens to enhance integration of nutrition interventions into routine school activities. However there is need to fully implement the school health and nutrition policy and scale up activities in the counties in order to strengthen the nutrition component.The nutritional challenge facing various institutional dietary needs are related to the quantities and types of food provided (quality). There is need to ensure that energy, protein, vitamin and minerals are provided in the diets, to meet the Recommended Dietary Allowances (RDA) of individuals.
In the face of these challenges, schools and other institutions need support to provide effective nutrition knowledge, care and nutritious food. Working with local communities to involve administrators, civil society, private sector and media is also vital in addressing these challenges.
18 National Nutrition Action Plan 2012-2017
Priority areas• Review,developandimplementnutritionalguidelinesforschoolsandotherinstitutions.• Mobilizenutritionstakeholders’commitmenttowardssustaininginstitutionalfeedingprogrammes• Integratenutritioneducationinschoolcurriculumatalllevels.• Mainstreambasicnutritiontraininginallschoolsandotherinstitutions• Implementappropriatenutritioninterventionsinschoolsandotherinstitutions• Strengthenmonitoringandevaluationofnutritioninterventionsinschoolandotherinstitutions
Expected outcome: Improved nutritional status of the population in schools and other institutions.
2.4.8 Strategic Objective 8To improve nutrition knowledge attitudes and practices among the population
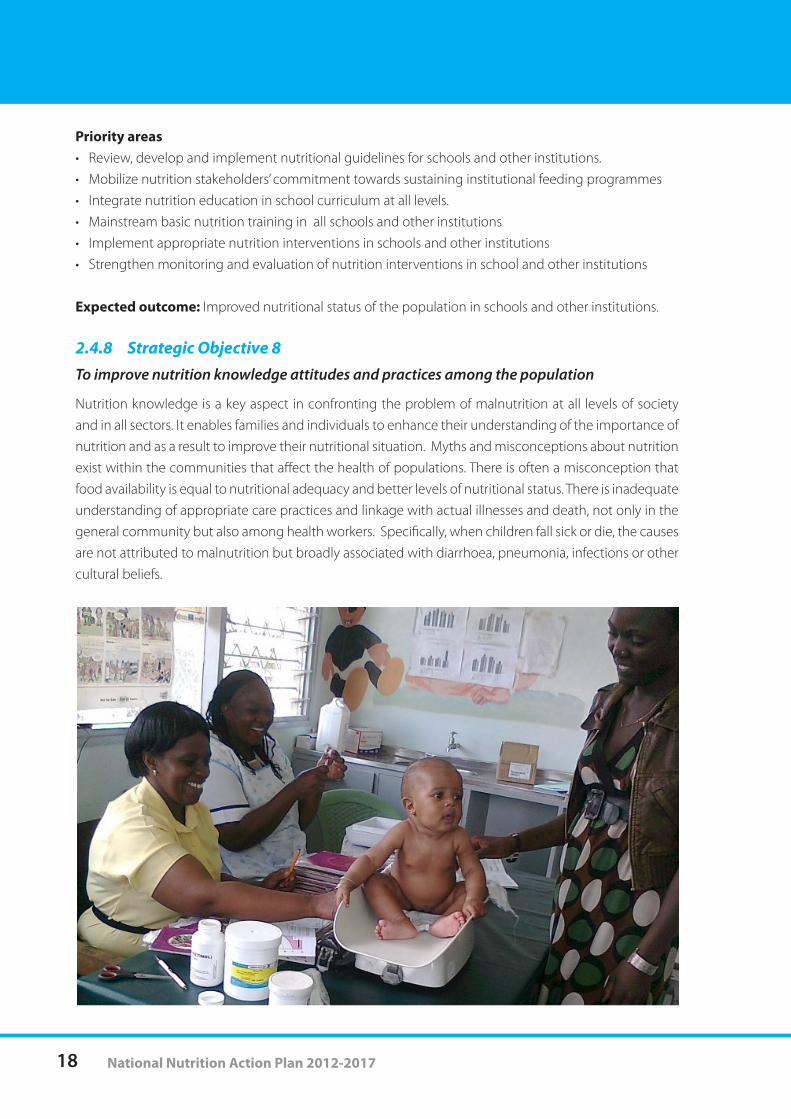
Nutrition knowledge is a key aspect in confronting the problem of malnutrition at all levels of society and in all sectors. It enables families and individuals to enhance their understanding of the importance of nutrition and as a result to improve their nutritional situation. Myths and misconceptions about nutrition exist within the communities that affect the health of populations. There is often a misconception that food availability is equal to nutritional adequacy and better levels of nutritional status. There is inadequate understanding of appropriate care practices and linkage with actual illnesses and death, not only in the general community but also among health workers. Specifically, when children fall sick or die, the causes are not attributed to malnutrition but broadly associated with diarrhoea, pneumonia, infections or other cultural beliefs.
19Nutrition is Key, take up your role, Act now
Education systems at various levels do not transfer adequate nutrition knowledge aimed at influencing life-long dietary practices. Improving nutrition will require enhancing knowledge, attitude and practices of all stakeholders and of the general public. This will require building the capacity of frontline field staff, including teachers, extension agents, health practitioners and other service providers to incorporate nutritional and food safety considerations and messages into their routine work. Their knowledge and understanding must be adequate in both depth and scope to handle the many facets of nutrition issues. To address these challenges, an advocacy and communication strategy focusing on appropriate diets and lifestyles will be developed and disseminated to the community.
Priority areas • Conduct formative andperiodic assessments on the status of nutrition knowledge, attitude and
practices in the general population.• Develop, disseminate and implement national nutrition advocacy, communication and social
mobilization (ACSM) strategy at all levels.• Capacitybuildingforserviceprovidersonnutrition,includingcommunicationandadvocacyskills.• NutritionDaysmarkednationally and in all counties (WorldBreastfeedingWeek,African Foodand
Nutrition Security Day, Iodine Deficiency Disorders Day, Malezi Bora, among others)• Promotemeasurestoensurefoodsafetyatalllevels
Expected outcome: Improved nutrition knowledge, attitudes and practices in the general population.
2.4.9 Strategic Objective 9To strengthen nutrition surveillance, monitoring and evaluation systems
Nutrition monitoring and evaluation systems are essential in measuring program performance and evaluating the impact of interventions. These systems include routine recording and reporting of nutrition services integrated in the existing health information system and periodic surveys and also assessments. Nutrition surveillance provides information for routine monitoring of nutritional status and early warning for disaster mitigation.
There are nutrition indicators and data elements that are being collected through the District Health Information System; however there are awareness gaps on these indicators among the health care workers and the data managers resulting in incomplete reporting. Routine monitoring of nutritional status requires improvement in data tools and management (collection, analysis, reporting and dissemination). In addition, the early warning system in Arid and Semi arid areas and the national early warning systems require strengthening.
Feedback on surveillance, monitoring and evaluation is necessary to ensure that this information contributes towards identifying specific nutrition requirements and timely provision of services to the areas of greatest need. Actions under this strategic objective therefore aim at addressing these problems in nutrition surveillance, monitoring and evaluation systems in the country.
20 National Nutrition Action Plan 2012-2017
Priority areas • OperationalisethenutritionMonitoringandevaluationframeworkforthenutritionsector.• Review,developanddisseminateguidelinesandtoolsonsurveillance,monitoringandevaluation• Strengthenfeedbackmechanismsonnutritioninformationamongnutritionstakeholders• TrainmanagersandserviceprovidersonuseofDHISandinterpretationofM&Edata.• Strengthentheintegrationofnutritionindicatorsintheexistingintegrateddiseasesurveillancesystem.• Promoteuseofappropriatetechnologytoenhancequalityofdatacollected Expected outcome: Enhanced quality and timeliness of data collected for effective decision making.
2.4.10 Strategic Objective 10 To enhance evidence-based decision-making through research
Evidence of best practices has to be generated involving research for better solutions to nutrition problems. Programme design should therefore, be based on assessment of the nutrition situation and of the resources that can be mobilized to address the gaps. One of the gaps is that research findings are not adequately used to inform nutrition program design and implementation. There are many nutrition-related studies that have been conducted that have not been widely disseminated to assist in decision making at all levels. With decentralization of nutrition care and services in Kenya, there is need to conduct research at county level to guide in designing specific programs. Under this strategic objective, specific focus will be the identification of priority research areas and advocacy to expand evidence-based solutions at all levels.
Priority areas• Strengthen/establishresearchcoordinationmechanismsatnationalandcountylevels• Resourcemobilizationtoaddresscriticalgapsinnutritionresearch• Conductneed-basedresearchtoinformpolicy,programmedesignandimplementation• Strengthenthecapacityofrelevantresearchinstitutionstoconductnutritionresearch.
Expected outcome: Enhanced evidence-based decision-making through research in program design and implementation.
2.4.11 Strategic Objective 11To strengthen coordination and partnerships among the key nutrition actors
The causes of malnutrition are multi-sectrol in nature and therefore require a broad range of actors including; Planning (human development), Agriculture (food security), Industry and Trade (food availability), Economy (purchasing power), Women and Children Development (family empowerment), Education (knowledge and skill), Manpower/Workforce (productivity) and Socio-culture (nutritional behavior).
21Nutrition is Key, take up your role, Act now
Implementation of nutrition interventions by different sectors is not well coordinated resulting in duplication of efforts. Nutrition programmes therefore need to look beyond the health sector and must be addressed through integrated approach for successful achievement of its goal.
The success of this Nutrition Plan therefore depends, to a large degree, on multi-sectoral coordination of actions in nutrition at all levels.
Priority Areas• Strengthenmulti-sectoralcoordinationmechanismsandnetworksfornutritionatalllevels.• Settingofclearmandatesandresponsibilitiesfornutritionstakeholdersatdifferentlevels.• Advocate andmobilize financial and human resources for nutrition coordination and partnership
activities at all levels• Holdanddocumentregularjointplanningandreviewmeetingstoaligntheannualnutritionplanning
process to the nutrition action plan.
Expected outcomeIncreased human, financial and material resource allocation for nutrition interventions.
2.4 CoordinationCoordination of implementation of this Plan shall fall within the coordination mechanism of the agreed upon Food and Nutrition Security Strategy 2012. Under this Strategy, the Ministry responsible for health shall be directly in charge of coordinating the implementation of this National Nutrition Action Plan at national level through Nutrition Interagency Coordinating Committee (NICC) and the technical working groups. However, under the new governance system in Kenya, there will be devolved coordination mechanisms at the county levels. Each county and ward will have its own Food and Nutrition Security Secretariats. The role of the county and ward Secretariats will be to coordinate and monitor all food and nutrition activities in their respective geographical areas. Ward secretariat will report to the County secretariat which in turn will report to the National Food and Nutrition Security Secretariat. At all the levels, nutrition stakeholders will play a crucial role in the execution of this NNAP through established coordination structures.
The coordination activities will entail, among others;• ReceivingprogressreportontheimplementationofthePlanandorganizingfordisseminationamong
the stakeholders for informed decision-making• Organizingforumsforexperiencesharingbythestakeholdersonbest-practices• MonitoringandEvaluationoftheimplementationofNNAP• Providingenablingenvironment for the implementationof theNNAPby thestakeholders; thiswill
entail resource mobilization towards implementation of the Plan as well as influencing policies and legislations that support implementation of the Plan.
22 National Nutrition Action Plan 2012-201722 National Nutrition Action Plan 2012-2017
23Nutrition is Key, take up your role, Act now
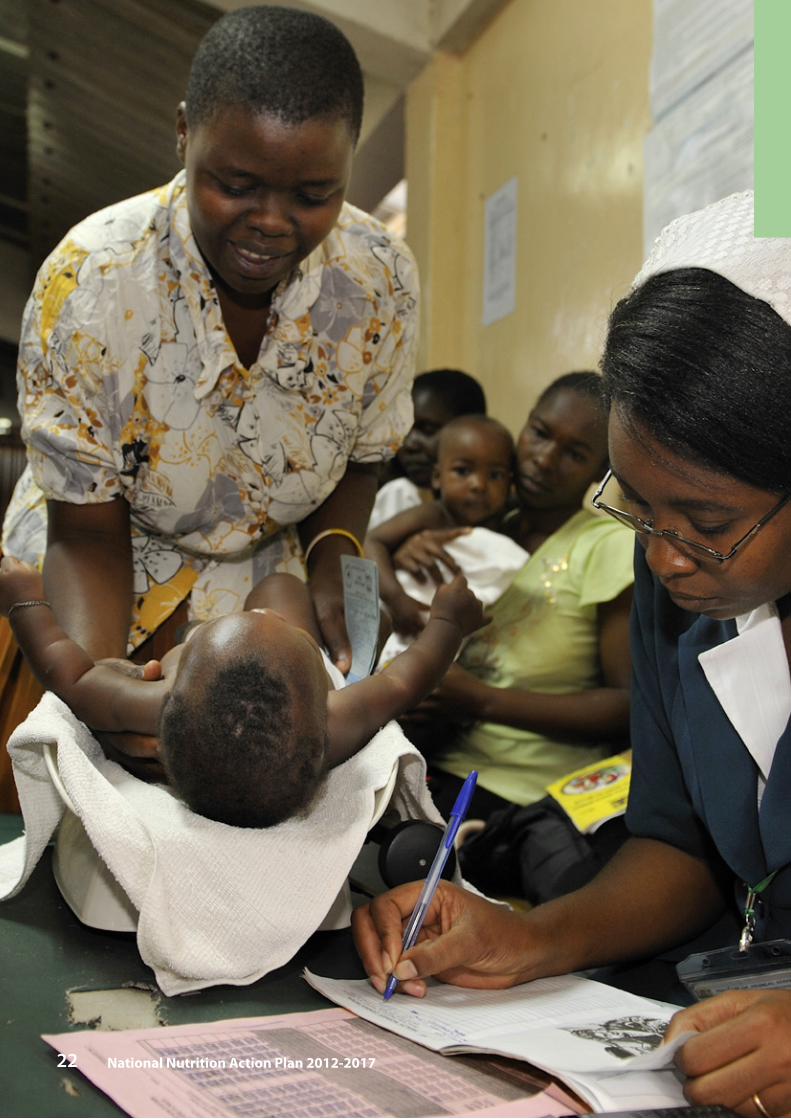
Chapter 3Monitoring and Evaluation Plan
A system for monitoring and evaluation (M&E) is a critical component of the implementation of this Action Plan as such a system will enable tracking of programme implementation. The Nutrition M&E framework 2012-2017 developed in line with this action plan will aim at meeting the information needs of different stakeholders; that is policy makers, donors, Civil Society Organization (CSOs), research and academic institutions, development partners, media and the general public. The objective of M&E is to inform decision-making in the areas of accountability, activity implementation, allocation of resources and policy at National, County, sub-county and Health facility level. In order to achieve this objective various stakeholders in the implementation of the Plan of Action, will be encouraged to;• Ensuretimelyavailabilityofdata• Analyzethedata,disseminateandpromoteuseofthefindings• Ensureproperstorage,reliableaccessandeaseretrievalbydifferentusers
Further, the M&E for this action plan;• IntegratesandutilizesNationalM&EsystemsincludingDistrictHealth Informationsoftware(DHIS)
and Kenya demographic health surveys (KDHS) to ensure adequate provision of more disaggregated data so as to facilitate monitoring and evaluation at all levels.
• Aimstocollectandanalyzequalitativeinformationandincreaseparticipatorymonitoring.• Is guided by operational research and analysis programmes to evaluate changes towards desired
outcomes and targets
3.1 Monitoring Monitoring is the process of collecting data on on-going programme/project/activity analyzing, interpreting and using it to modify implementation so that it (implementation) proceeds according to plan. Monitoring of the activities in the action plan will be done through routine collection, collation, analyzing, interpretation and dissemination of data using standardized tools. The frequency of monitoring the activities will be undertaken monthly, quarterly and annually.
24 National Nutrition Action Plan 2012-2017
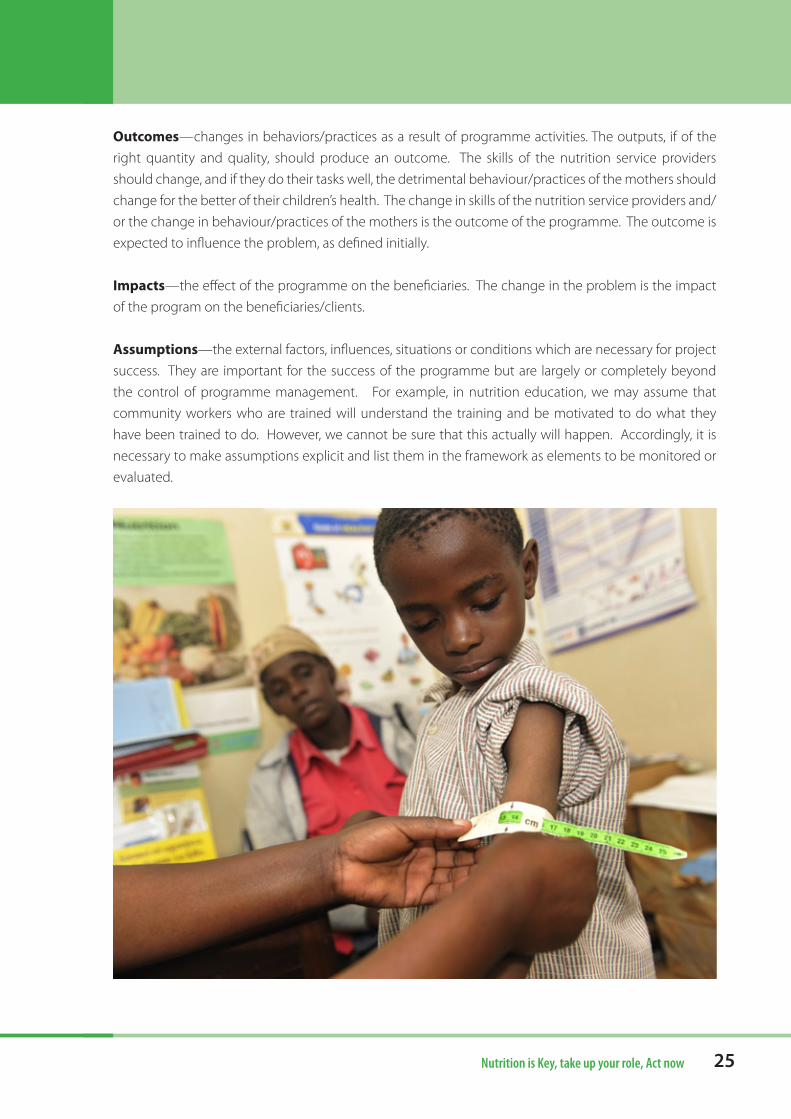
3.2 EvaluationEvaluation is the process of collecting data on on-going, completed or yet-to-start programme, analyzing and interpreting the data for purposes of determining the value of the programme. Evaluation for the activities in the plan will be done at formative stage, mid-way and end of project. Methods for evaluation will include assessments and surveys. Where possible emphasis will be on integrated nutrition evaluations with other national surveys like the KDHS, Kenya Integrated Household Budget Survey (KIHBS) Annex 2 presents performance-target based monitoring and evaluation plan. The plan highlights both output and outcome indicators to be tracked, the year and value of the baseline situation of the indicator parameter, targets to be achieved in each year of the Action Plan implementation, source of M&E data and the agency responsible for M&E activities. Both the output and outcome indicators are derived from the strategic objectives of the Action Plan. The indicators have been arrived at through analysis of trends of the targets in the health sector in Kenya and other countries. Specifically, the analysis takes into account targets set previously, efforts that were put in place to achieve the targets including policy, legislations programmes, institutional arrangements and financial resources. The analysis focused on efforts in health sector as set out in the KHSSP and the FNSP and other sectors notably agriculture, water, livestock, education and fisheries that contribute to realization of the goals of national nutrition agenda.
The following are brief definitions of elements that comprise a sound monitoring and evaluation framework:Inputs—all those resources that go into the programme at the onset or start-up phase or during the implementation to help the programme achieve its objectives. The inputs (the number and qualifications of personnel, the financial resources, the institutional set-up, timing, etc.) must be designed as to meet the problem. The inputs should be distributed to meet all needy groups and be accessible financially, socially and technically. If this does not happen the outputs may not be met.
Outputs—all the goods and services delivered to the target population by the programme. Programme inputs have to be transformed into outputs. The quantity and quality of the outputs is very important. For instance, if one programme input were the training of nutrition service providers, the outputs are the number of trained nutrition service providers. The quality of the training should also be “adequate,” otherwise just training them would not help in effectively meeting the needs of the community.
It should also be understood that having very well-trained staff or people does not necessarily generate programme delivery nor impact. Success and impact are created by making sure that the trained personnel are enabled to do the work that they were trained for.
25Nutrition is Key, take up your role, Act now
Outcomes—changes in behaviors/practices as a result of programme activities. The outputs, if of the right quantity and quality, should produce an outcome. The skills of the nutrition service providers should change, and if they do their tasks well, the detrimental behaviour/practices of the mothers should change for the better of their children’s health. The change in skills of the nutrition service providers and/or the change in behaviour/practices of the mothers is the outcome of the programme. The outcome is expected to influence the problem, as defined initially.
Impacts—the effect of the programme on the beneficiaries. The change in the problem is the impact of the program on the beneficiaries/clients.
Assumptions—the external factors, influences, situations or conditions which are necessary for project success. They are important for the success of the programme but are largely or completely beyond the control of programme management. For example, in nutrition education, we may assume that community workers who are trained will understand the training and be motivated to do what they have been trained to do. However, we cannot be sure that this actually will happen. Accordingly, it is necessary to make assumptions explicit and list them in the framework as elements to be monitored or evaluated.
26 National Nutrition Action Plan 2012-201726 National Nutrition Action Plan 2012-2017
27Nutrition is Key, take up your role, Act now
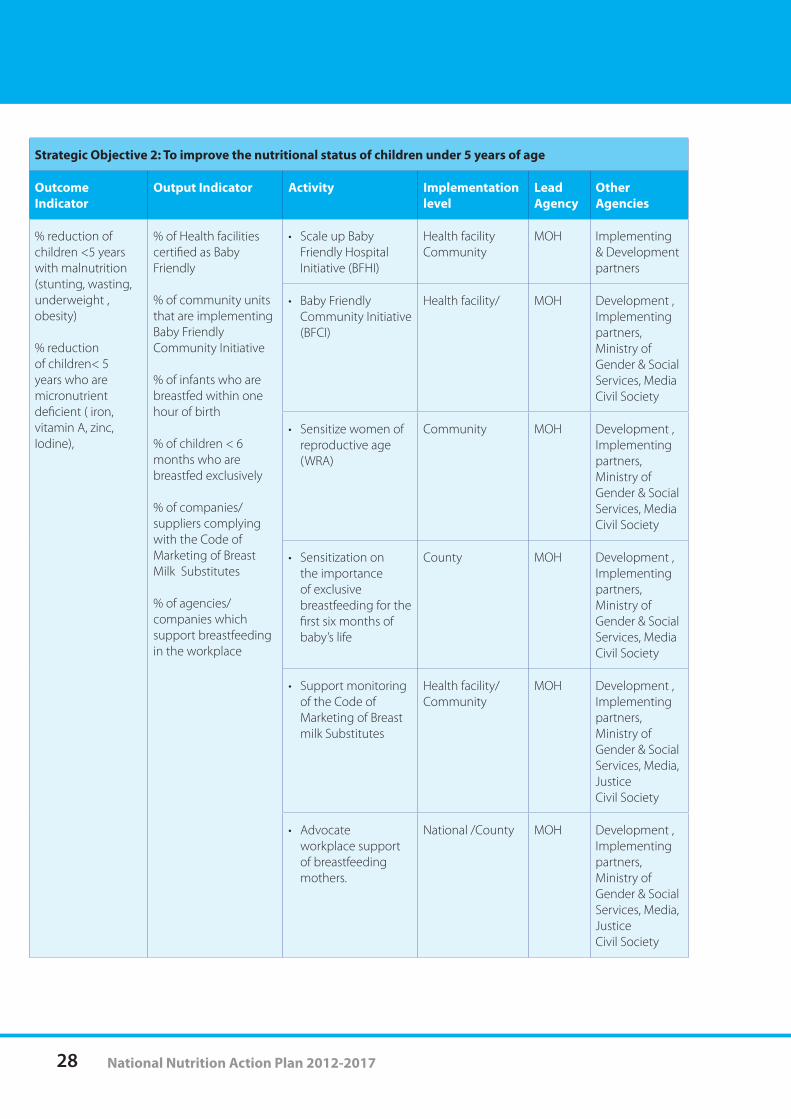
Chapter 4AnnexesAnnex 1: Activity Implementation Matrix
Strategic Objective 1: To improve the nutritional status of women of reproductive age (15-49 years)
Outcome Indicator
Output Indicator Activity Implementation level
Lead Agency
Other Agencies
% reduction of Vitamin A deficiency among women of reproductive age.
% reduction of iron deficiency among women of reproductive age.
% reduction of iodine deficiency among women of reproductive age.
% reduction of overweight and obesity among women of reproductive age.
% reduction of zinc deficiency among women of reproductive age.
% reduction underweight among women of reproductive age.
% of pregnant women who take iron and folic acid supplements for at least 90 days during pregnancy.
• ProvideIFAsupplements to adolescent girls and pregnant women.
County MOH MoE, Development , Implementing partners
% of pregnant and lactating women with MUAC < 21 cm receiving supplementary food.
• Providesupplementary foods to pregnant and lactating women according to the admission criteria on integrated management of acute malnutrition guidelines.
County MOH KEMSA, Development , Implementing partners
% of pregnant women monitored for their weight.
• Conductroutineweight Monitoring and appropriate counseling for the pregnant women
County MOH Development , Implementing partners,
Proportion of health facilities with nutrition commodities and equipment for maternal nutrition interventions
• Procureanddistribute nutritional commodities and equipment to health facilities.
National / County MOH KEMSA, Development , Implementing partners,
• Conductnutritioneducation on healthy dietary practices to Women of reproductive age.
County MOH Development , Implementing partners, Media
No. of maternal nutrition guidelines disseminated in use at county level
• Review,develop,print and disseminate and distribute guidelines
National MOH Development , Implementing partners, Media
28 National Nutrition Action Plan 2012-2017
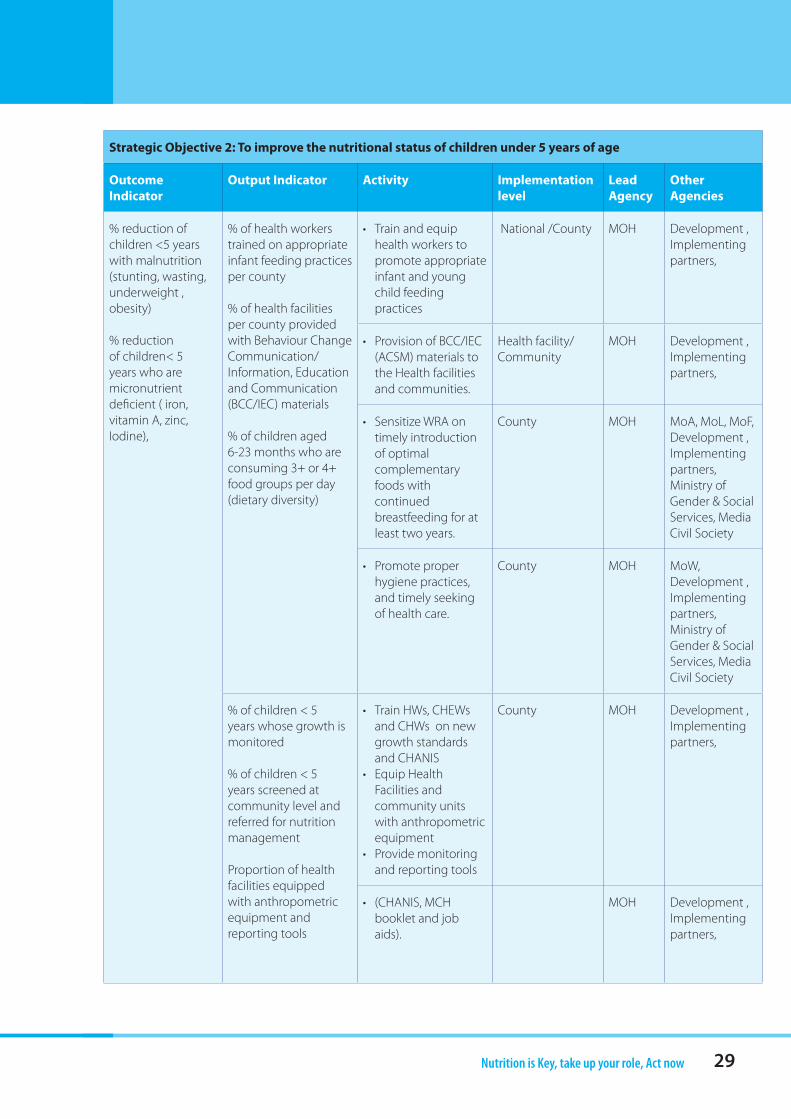
Strategic Objective 2: To improve the nutritional status of children under 5 years of age
Outcome Indicator
Output Indicator Activity Implementation level
Lead Agency
Other Agencies
% reduction of children <5 years with malnutrition (stunting, wasting, underweight , obesity)
% reduction of children< 5 years who are micronutrient deficient ( iron, vitamin A, zinc, Iodine),
% of Health facilities certified as Baby Friendly % of community units that are implementing Baby Friendly Community Initiative
% of infants who are breastfed within one hour of birth
% of children < 6 months who are breastfed exclusively
% of companies/suppliers complying with the Code of Marketing of Breast Milk Substitutes
% of agencies/companies which support breastfeeding in the workplace
• ScaleupBabyFriendly Hospital Initiative (BFHI)
Health facilityCommunity
MOH Implementing & Development partners
• BabyFriendlyCommunity Initiative (BFCI)
Health facility/ MOH Development , Implementing partners, Ministry of Gender & Social Services, MediaCivil Society
• Sensitizewomenofreproductive age (WRA)
Community MOH Development , Implementing partners, Ministry of Gender & Social Services, Media Civil Society
• Sensitizationonthe importance of exclusive breastfeeding for the first six months of baby’s life
County MOH Development , Implementing partners, Ministry of Gender & Social Services, Media Civil Society
• Supportmonitoringof the Code of Marketing of Breast milk Substitutes
Health facility/ Community
MOH Development , Implementing partners, Ministry of Gender & Social Services, Media, Justice Civil Society
• Advocateworkplace support of breastfeeding mothers.
National /County MOH Development , Implementing partners, Ministry of Gender & Social Services, Media, Justice Civil Society
29Nutrition is Key, take up your role, Act now
Strategic Objective 2: To improve the nutritional status of children under 5 years of age
Outcome Indicator
Output Indicator Activity Implementation level
Lead Agency
Other Agencies
% reduction of children <5 years with malnutrition (stunting, wasting, underweight , obesity)
% reduction of children< 5 years who are micronutrient deficient ( iron, vitamin A, zinc, Iodine),
% of health workers trained on appropriate infant feeding practices per county
% of health facilities per county provided with Behaviour Change Communication/ Information, Education and Communication (BCC/IEC) materials
% of children aged 6-23 months who are consuming 3+ or 4+ food groups per day (dietary diversity)
• Trainandequiphealth workers to promote appropriate infant and young child feeding practices
National /County MOH Development , Implementing partners,
• ProvisionofBCC/IEC(ACSM) materials to the Health facilities and communities.
Health facility/ Community
MOH Development , Implementing partners,
• SensitizeWRAontimely introduction of optimal complementary foods with continued breastfeeding for at least two years.
County MOH MoA, MoL, MoF, Development , Implementing partners, Ministry of Gender & Social Services, Media Civil Society
• Promoteproperhygiene practices, and timely seeking of health care.
County MOH MoW, Development , Implementing partners, Ministry of Gender & Social Services, MediaCivil Society
% of children < 5 years whose growth is monitored
% of children < 5 years screened at community level and referred for nutrition management
Proportion of health facilities equipped with anthropometric equipment and reporting tools
• TrainHWs,CHEWsand CHWs on new growth standards and CHANIS
• EquipHealthFacilities and community units with anthropometric equipment
• Providemonitoringand reporting tools
County MOH Development , Implementing partners,
• (CHANIS,MCHbooklet and job aids).
MOH Development , Implementing partners,
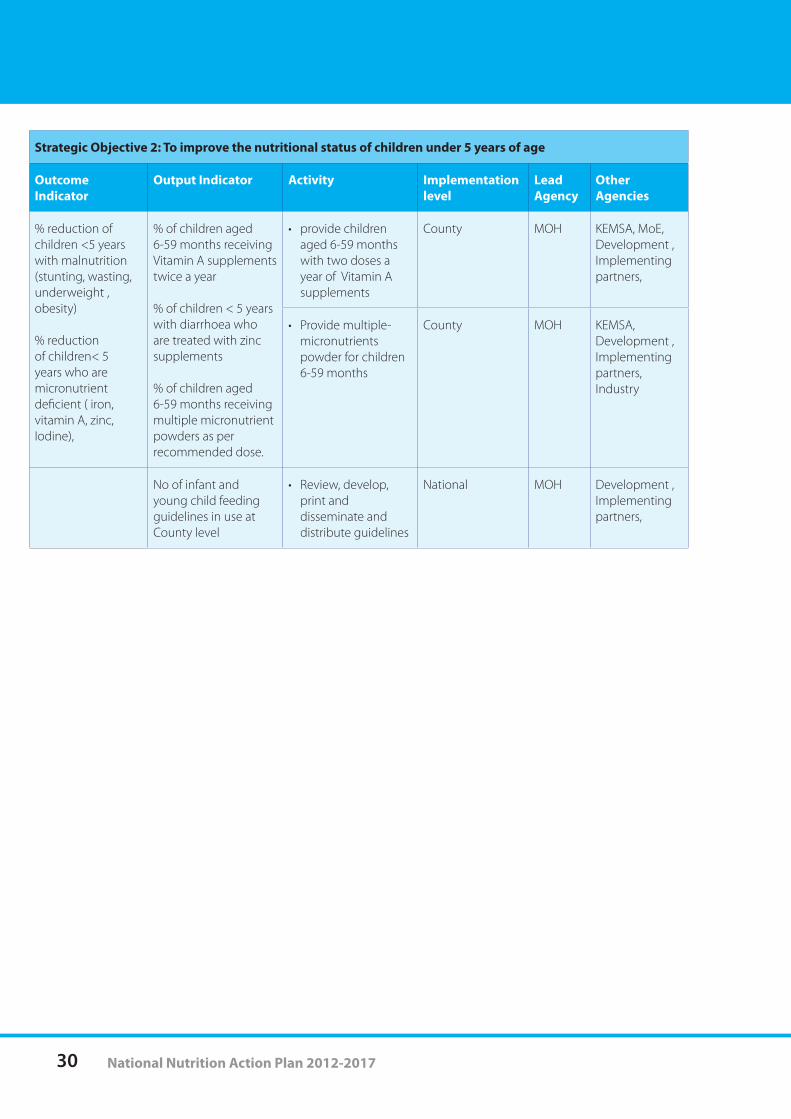
30 National Nutrition Action Plan 2012-2017
Strategic Objective 2: To improve the nutritional status of children under 5 years of age
Outcome Indicator
Output Indicator Activity Implementation level
Lead Agency
Other Agencies
% reduction of children <5 years with malnutrition (stunting, wasting, underweight , obesity)
% reduction of children< 5 years who are micronutrient deficient ( iron, vitamin A, zinc, Iodine),
% of children aged 6-59 months receiving Vitamin A supplements twice a year
% of children < 5 years with diarrhoea who are treated with zinc supplements
% of children aged 6-59 months receiving multiple micronutrient powders as per recommended dose.
• providechildrenaged 6-59 months with two doses a year of Vitamin A supplements
County MOH KEMSA, MoE, Development , Implementing partners,
• Providemultiple-micronutrients powder for children 6-59 months
County MOH KEMSA, Development , Implementing partners, Industry
No of infant and young child feeding guidelines in use at County level
• Review,develop,print and disseminate and distribute guidelines
National MOH Development , Implementing partners,
31Nutrition is Key, take up your role, Act now
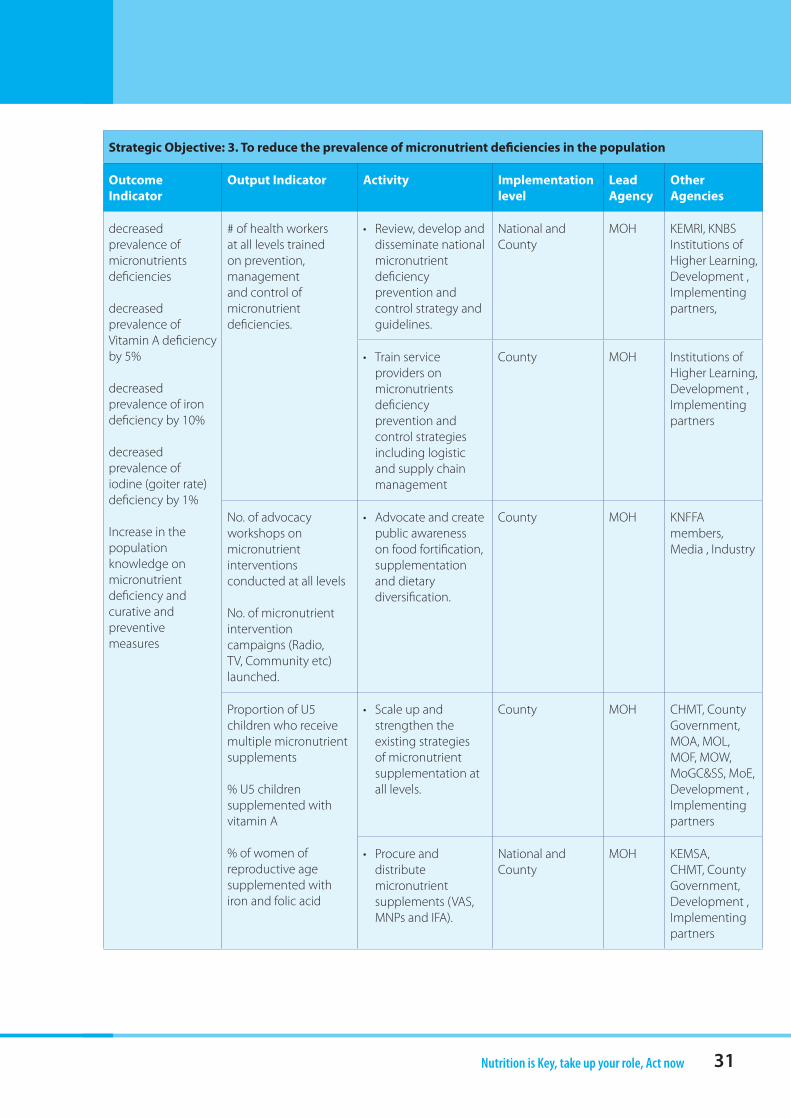
Strategic Objective: 3. To reduce the prevalence of micronutrient deficiencies in the population
Outcome Indicator
Output Indicator Activity Implementation level
Lead Agency
Other Agencies
decreased prevalence of micronutrients deficiencies
decreased prevalence of Vitamin A deficiency by 5%
decreased prevalence of iron deficiency by 10%
decreased prevalence of iodine (goiter rate) deficiency by 1%
Increase in the population knowledge on micronutrient deficiency and curative and preventive measures
# of health workers at all levels trained on prevention, management and control of micronutrient deficiencies.
• Review,developanddisseminate national micronutrient deficiency prevention and control strategy and guidelines.
National and County
MOH KEMRI, KNBS Institutions of Higher Learning, Development , Implementing partners,
• Trainserviceproviders on micronutrients deficiency prevention and control strategies including logistic and supply chain management
County MOH Institutions of Higher Learning, Development , Implementing partners
No. of advocacy workshops on micronutrient interventions conducted at all levels
No. of micronutrient intervention campaigns (Radio, TV, Community etc) launched.
• Advocateandcreatepublic awareness on food fortification, supplementation and dietary diversification.
County MOH KNFFA members, Media , Industry
Proportion of U5 children who receive multiple micronutrient supplements
% U5 children supplemented with vitamin A
% of women of reproductive age supplemented with iron and folic acid
• Scaleupandstrengthen the existing strategies of micronutrient supplementation at all levels.
County MOH CHMT, County Government, MOA, MOL, MOF, MOW, MoGC&SS, MoE, Development , Implementing partners
• Procureanddistribute micronutrient supplements (VAS, MNPs and IFA).
National and County
MOH KEMSA, CHMT, County Government, Development , Implementing partners
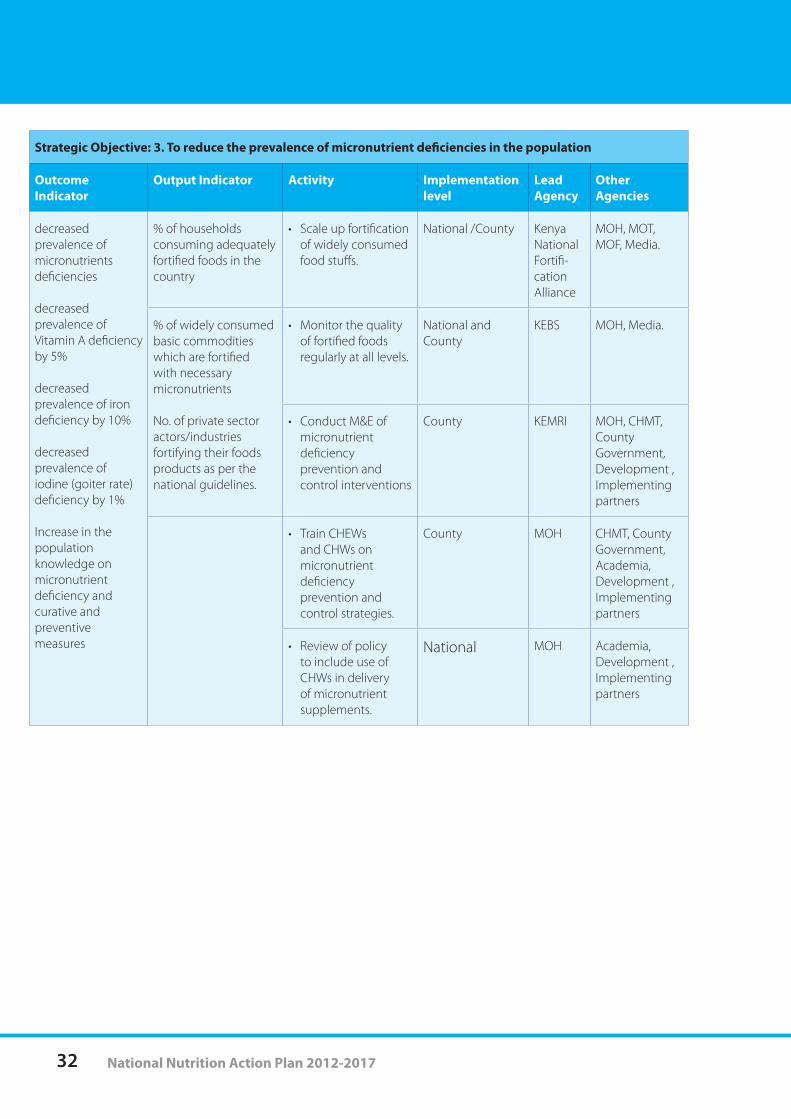
32 National Nutrition Action Plan 2012-2017
Strategic Objective: 3. To reduce the prevalence of micronutrient deficiencies in the population
Outcome Indicator
Output Indicator Activity Implementation level
Lead Agency
Other Agencies
decreased prevalence of micronutrients deficiencies
decreased prevalence of Vitamin A deficiency by 5%
decreased prevalence of iron deficiency by 10%
decreased prevalence of iodine (goiter rate) deficiency by 1%
Increase in the population knowledge on micronutrient deficiency and curative and preventive measures
% of households consuming adequately fortified foods in the country
• Scaleupfortificationof widely consumed food stuffs.
National /County Kenya National Fortifi-cation Alliance
MOH, MOT, MOF, Media.
% of widely consumed basic commodities which are fortified with necessary micronutrients
No. of private sector actors/industries fortifying their foods products as per the national guidelines.
• Monitorthequalityof fortified foods regularly at all levels.
National and County
KEBS MOH, Media.
• ConductM&Eofmicronutrient deficiency prevention and control interventions
County KEMRI MOH, CHMT, County Government, Development , Implementing partners
• TrainCHEWsand CHWs on micronutrient deficiency prevention and control strategies.
County MOH CHMT, County Government, Academia, Development , Implementing partners
• Reviewofpolicyto include use of CHWs in delivery of micronutrient supplements.
National MOH Academia, Development , Implementing partners
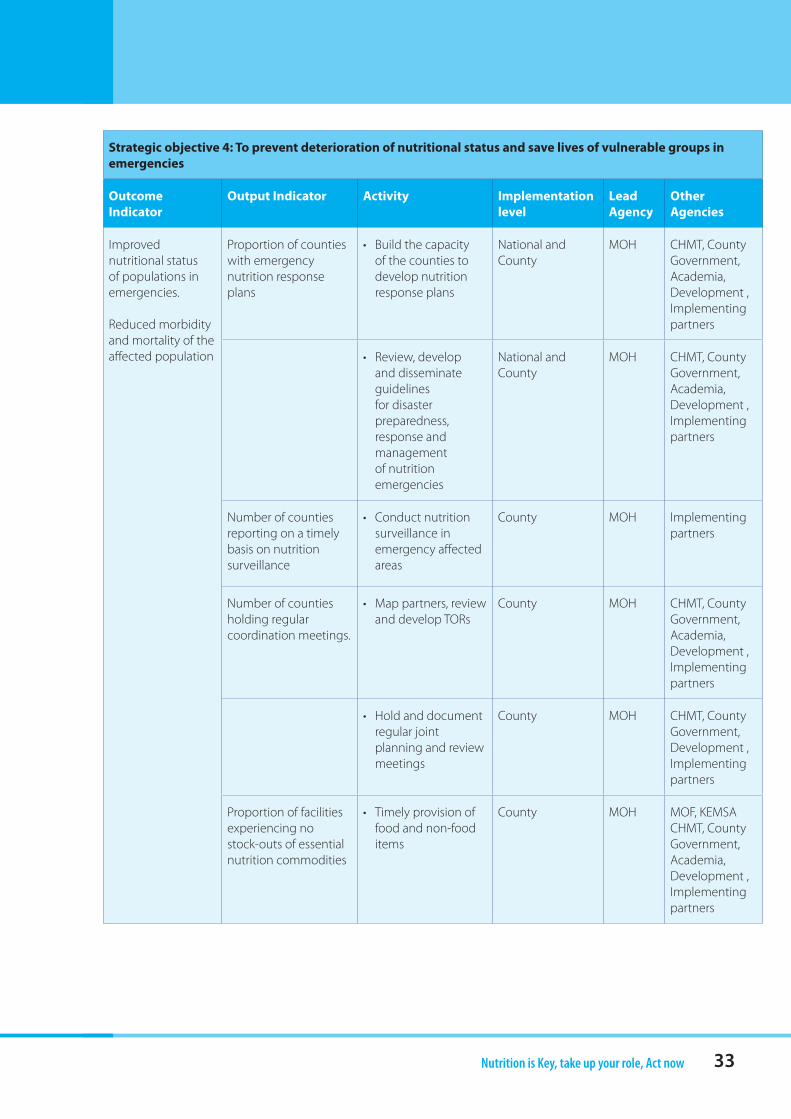
33Nutrition is Key, take up your role, Act now
Strategic objective 4: To prevent deterioration of nutritional status and save lives of vulnerable groups in emergencies
Outcome Indicator
Output Indicator Activity Implementation level
Lead Agency
Other Agencies
Improved nutritional status of populations in emergencies.
Reduced morbidity and mortality of the affected population
Proportion of counties with emergency nutrition response plans
• Buildthecapacityof the counties to develop nutrition response plans
National and County
MOH CHMT, County Government, Academia, Development , Implementing partners
• Review,developand disseminate guidelines for disaster preparedness, response and management of nutrition emergencies
National and County
MOH CHMT, County Government, Academia, Development , Implementing partners
Number of counties reporting on a timely basis on nutrition surveillance
• Conductnutritionsurveillance in emergency affected areas
County MOH Implementing partners
Number of counties holding regular coordination meetings.
• Mappartners,reviewand develop TORs
County MOH CHMT, County Government, Academia, Development , Implementing partners
• Holdanddocumentregular joint planning and review meetings
County MOH CHMT, County Government, Development , Implementing partners
Proportion of facilities experiencing no stock-outs of essential nutrition commodities
• Timelyprovisionoffood and non-food items
County MOH MOF, KEMSA CHMT, County Government, Academia, Development , Implementing partners
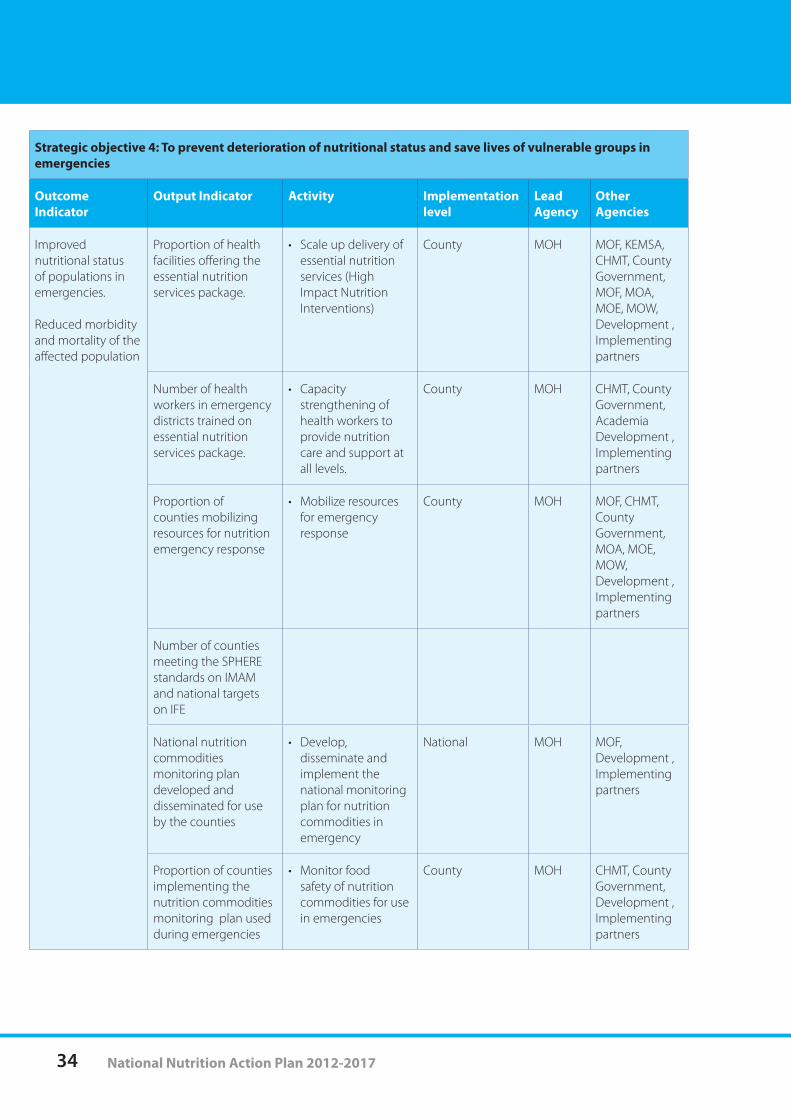
34 National Nutrition Action Plan 2012-2017
Strategic objective 4: To prevent deterioration of nutritional status and save lives of vulnerable groups in emergencies
Outcome Indicator
Output Indicator Activity Implementation level
Lead Agency
Other Agencies
Improved nutritional status of populations in emergencies.
Reduced morbidity and mortality of the affected population
Proportion of health facilities offering the essential nutrition services package.
• Scaleupdeliveryofessential nutrition services (High Impact Nutrition Interventions)
County MOH MOF, KEMSA, CHMT, County Government, MOF, MOA, MOE, MOW, Development , Implementing partners
Number of health workers in emergency districts trained on essential nutrition services package.
• Capacitystrengthening of health workers to provide nutrition care and support at all levels.
County MOH CHMT, County Government, Academia Development , Implementing partners
Proportion of counties mobilizing resources for nutrition emergency response
• Mobilizeresourcesfor emergency response
County MOH MOF, CHMT, County Government, MOA, MOE, MOW, Development , Implementing partners
Number of counties meeting the SPHERE standards on IMAM and national targets on IFE
National nutrition commodities monitoring plan developed and disseminated for use by the counties
• Develop,disseminate and implement the national monitoring plan for nutrition commodities in emergency
National MOH MOF, Development , Implementing partners
Proportion of counties implementing the nutrition commodities monitoring plan used during emergencies
• Monitorfoodsafety of nutrition commodities for use in emergencies
County MOH CHMT, County Government, Development , Implementing partners
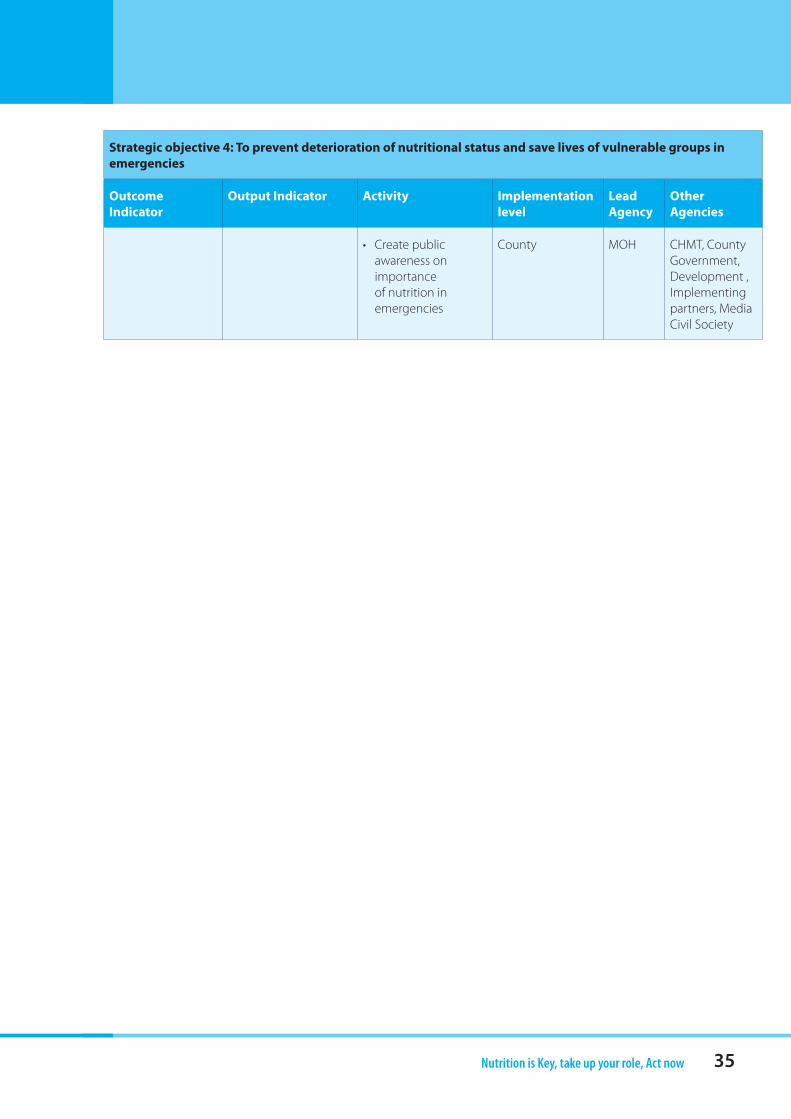
35Nutrition is Key, take up your role, Act now
Strategic objective 4: To prevent deterioration of nutritional status and save lives of vulnerable groups in emergencies
Outcome Indicator
Output Indicator Activity Implementation level
Lead Agency
Other Agencies
• Createpublicawareness on importance of nutrition in emergencies
County MOH CHMT, County Government, Development , Implementing partners, Media Civil Society
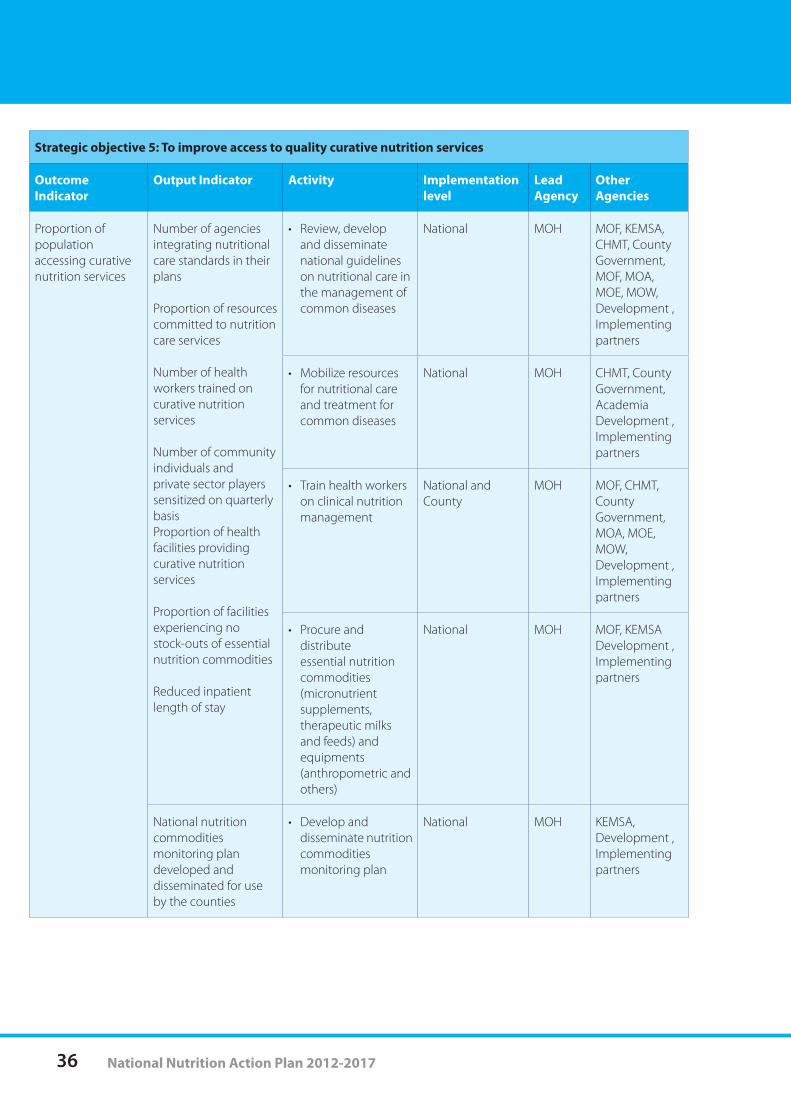
36 National Nutrition Action Plan 2012-2017
Strategic objective 5: To improve access to quality curative nutrition services
Outcome Indicator
Output Indicator Activity Implementation level
Lead Agency
Other Agencies
Proportion of population accessing curative nutrition services
Number of agencies integrating nutritional care standards in their plans
Proportion of resources committed to nutrition care services
Number of health workers trained on curative nutrition services
Number of community individuals and private sector players sensitized on quarterly basis Proportion of health facilities providing curative nutrition services
Proportion of facilities experiencing no stock-outs of essential nutrition commodities
Reduced inpatient length of stay
• Review,developand disseminate national guidelines on nutritional care in the management of common diseases
National MOH MOF, KEMSA, CHMT, County Government, MOF, MOA, MOE, MOW, Development , Implementing partners
• Mobilizeresourcesfor nutritional care and treatment for common diseases
National MOH CHMT, County Government, Academia Development , Implementing partners
• Trainhealthworkerson clinical nutrition management
National and County
MOH MOF, CHMT, County Government, MOA, MOE, MOW, Development , Implementing partners
• Procureanddistribute essential nutrition commodities (micronutrient supplements, therapeutic milks and feeds) and equipments (anthropometric and others)
National MOH MOF, KEMSA Development , Implementing partners
National nutrition commodities monitoring plan developed and disseminated for use by the counties
• Developanddisseminate nutrition commodities monitoring plan
National MOH KEMSA, Development , Implementing partners
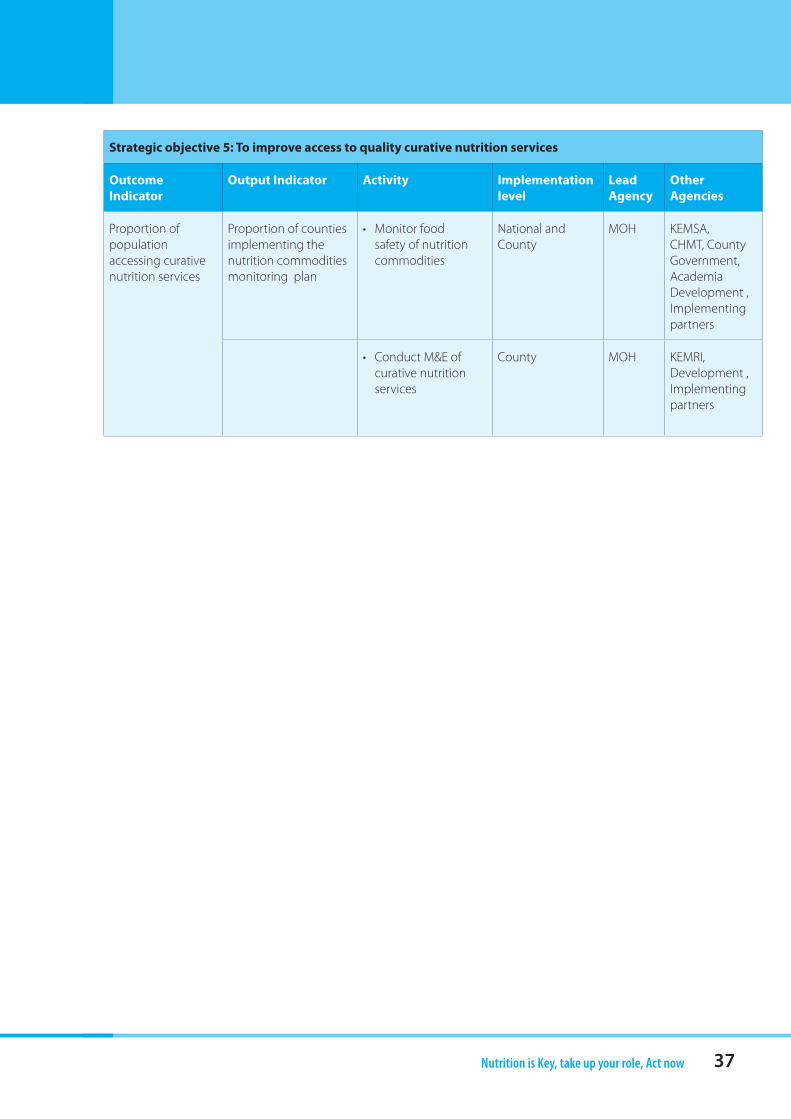
37Nutrition is Key, take up your role, Act now
Strategic objective 5: To improve access to quality curative nutrition services
Outcome Indicator
Output Indicator Activity Implementation level
Lead Agency
Other Agencies
Proportion of population accessing curative nutrition services
Proportion of counties implementing the nutrition commodities monitoring plan
• Monitorfoodsafety of nutrition commodities
National and County
MOH KEMSA, CHMT, County Government, Academia Development , Implementing partners
• ConductM&Eofcurative nutrition services
County MOH KEMRI, Development , Implementing partners
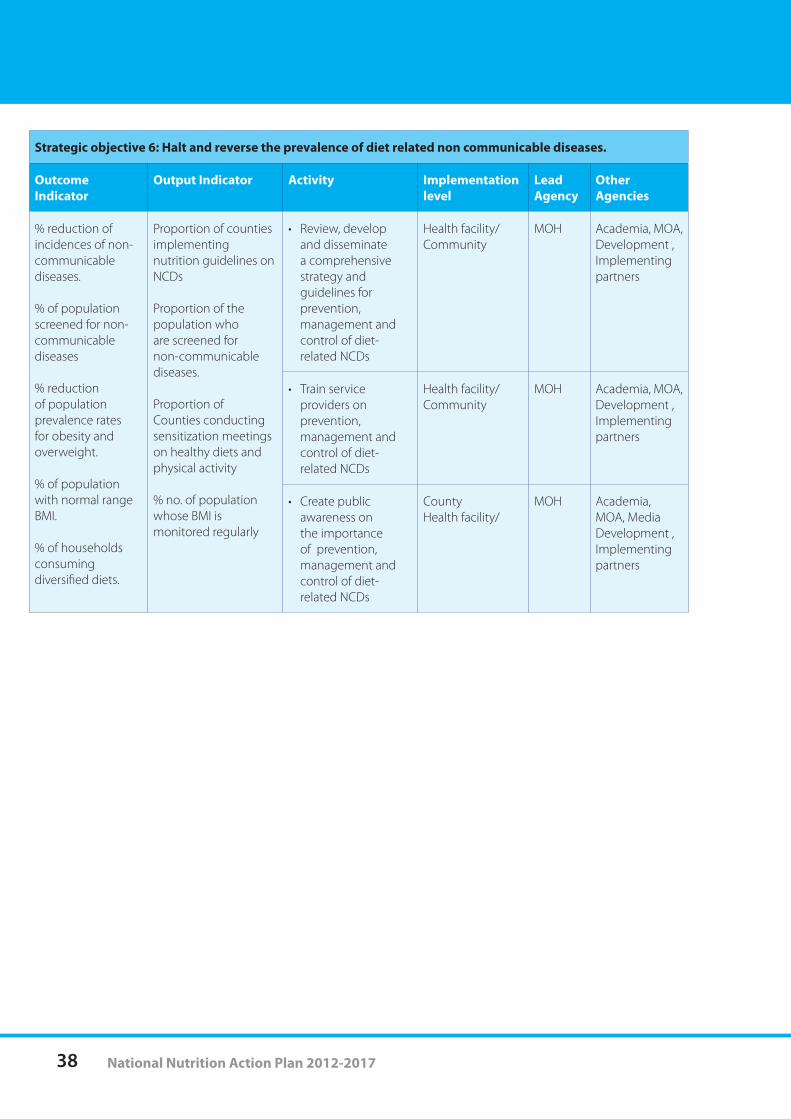
38 National Nutrition Action Plan 2012-2017
Strategic objective 6: Halt and reverse the prevalence of diet related non communicable diseases.
Outcome Indicator
Output Indicator Activity Implementation level
Lead Agency
Other Agencies
% reduction of incidences of non-communicable diseases.
% of population screened for non-communicable diseases
% reduction of population prevalence rates for obesity and overweight.
% of population with normal range BMI.
% of households consuming diversified diets.
Proportion of counties implementing nutrition guidelines on NCDs
Proportion of the population who are screened for non-communicable diseases.
Proportion of Counties conducting sensitization meetings on healthy diets and physical activity
% no. of population whose BMI is monitored regularly
• Review,developand disseminate a comprehensive strategy and guidelines for prevention, management and control of diet-related NCDs
Health facility/ Community
MOH Academia, MOA, Development , Implementing partners
• Trainserviceproviders on prevention, management and control of diet-related NCDs
Health facility/ Community
MOH Academia, MOA, Development , Implementing partners
• Createpublicawareness on the importance of prevention, management and control of diet-related NCDs
CountyHealth facility/
MOH Academia, MOA, Media Development , Implementing partners
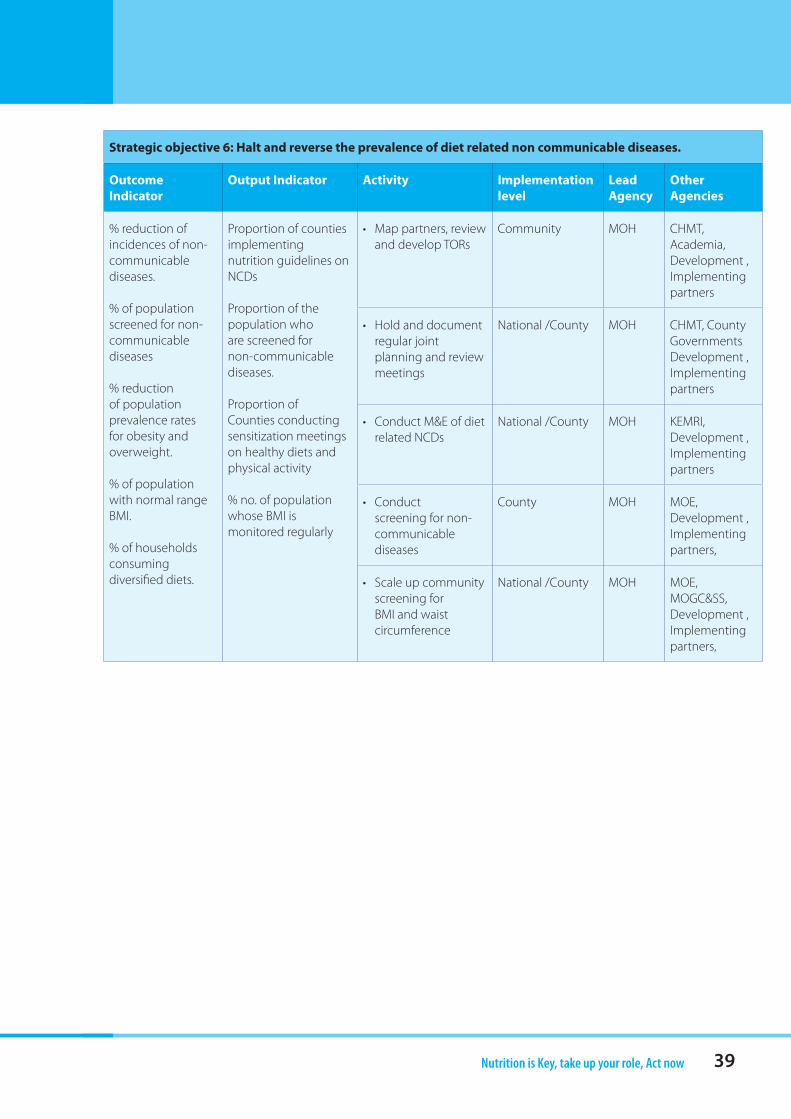
39Nutrition is Key, take up your role, Act now
Strategic objective 6: Halt and reverse the prevalence of diet related non communicable diseases.
Outcome Indicator
Output Indicator Activity Implementation level
Lead Agency
Other Agencies
% reduction of incidences of non-communicable diseases.
% of population screened for non-communicable diseases
% reduction of population prevalence rates for obesity and overweight.
% of population with normal range BMI.
% of households consuming diversified diets.
Proportion of counties implementing nutrition guidelines on NCDs
Proportion of the population who are screened for non-communicable diseases.
Proportion of Counties conducting sensitization meetings on healthy diets and physical activity
% no. of population whose BMI is monitored regularly
• Mappartners,reviewand develop TORs
Community MOH CHMT, Academia, Development , Implementing partners
• Holdanddocumentregular joint planning and review meetings
National /County MOH CHMT, County Governments Development , Implementing partners
• ConductM&Eofdietrelated NCDs
National /County MOH KEMRI, Development , Implementing partners
• Conductscreening for non-communicable diseases
County MOH MOE, Development , Implementing partners,
• Scaleupcommunityscreening for BMI and waist circumference
National /County MOH MOE, MOGC&SS, Development , Implementing partners,
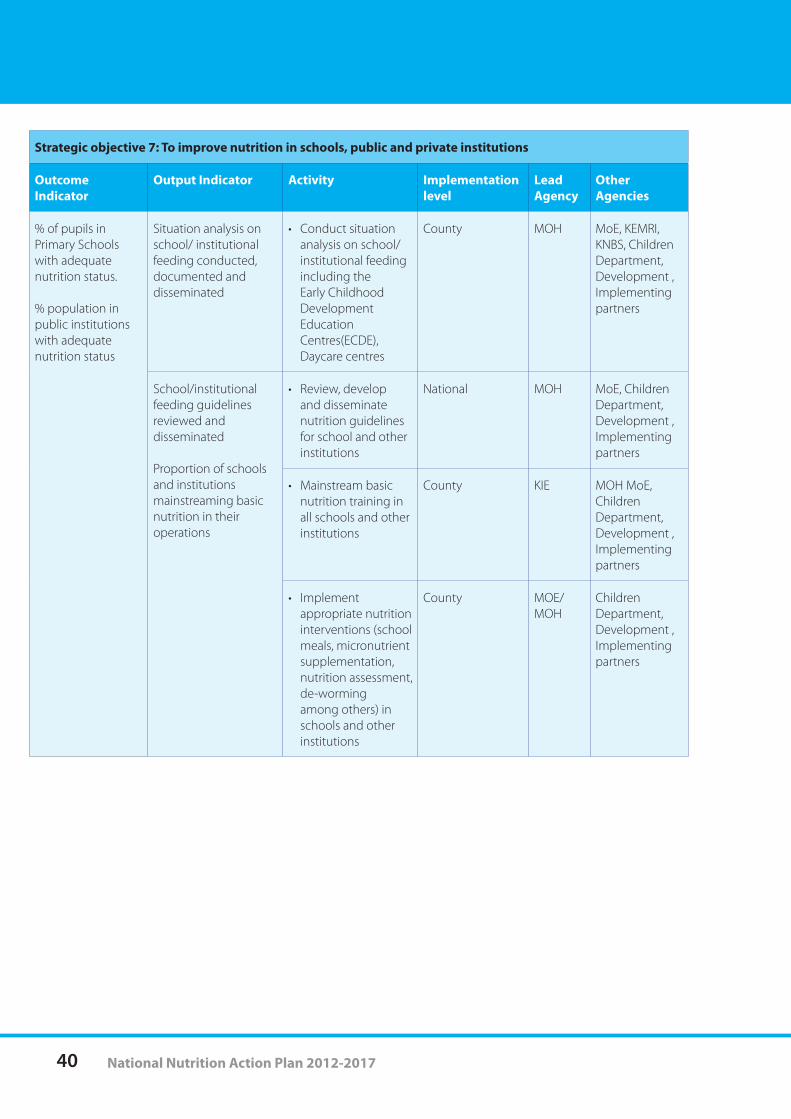
40 National Nutrition Action Plan 2012-2017
Strategic objective 7: To improve nutrition in schools, public and private institutions
Outcome Indicator
Output Indicator Activity Implementation level
Lead Agency
Other Agencies
% of pupils in Primary Schools with adequate nutrition status. % population in public institutions with adequate nutrition status
Situation analysis on school/ institutional feeding conducted, documented and disseminated
• Conductsituationanalysis on school/ institutional feeding including the Early Childhood Development Education Centres(ECDE), Daycare centres
County MOH MoE, KEMRI, KNBS, Children Department, Development , Implementing partners
School/institutional feeding guidelines reviewed and disseminated
Proportion of schools and institutions mainstreaming basic nutrition in their operations
• Review,developand disseminate nutrition guidelines for school and other institutions
National MOH MoE, Children Department, Development , Implementing partners
• Mainstreambasicnutrition training in all schools and other institutions
County KIE MOH MoE, Children Department, Development , Implementing partners
• Implementappropriate nutrition interventions (school meals, micronutrient supplementation, nutrition assessment, de-worming among others) in schools and other institutions
County MOE/MOH
Children Department, Development , Implementing partners
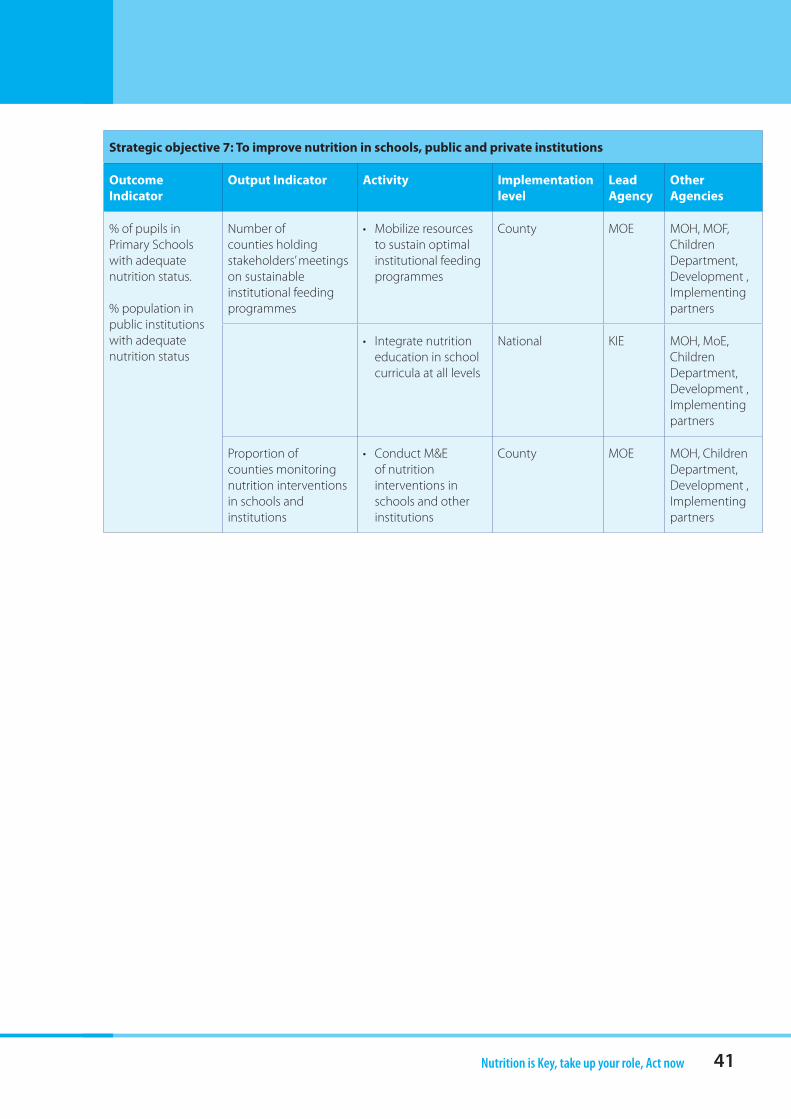
41Nutrition is Key, take up your role, Act now
Strategic objective 7: To improve nutrition in schools, public and private institutions
Outcome Indicator
Output Indicator Activity Implementation level
Lead Agency
Other Agencies
% of pupils in Primary Schools with adequate nutrition status. % population in public institutions with adequate nutrition status
Number of counties holding stakeholders’ meetings on sustainable institutional feeding programmes
• Mobilizeresourcesto sustain optimal institutional feeding programmes
County MOE MOH, MOF, Children Department, Development , Implementing partners
• Integratenutritioneducation in school curricula at all levels
National KIE MOH, MoE, Children Department, Development , Implementing partners
Proportion of counties monitoring nutrition interventions in schools and institutions
• ConductM&Eof nutrition interventions in schools and other institutions
County MOE MOH, Children Department, Development , Implementing partners
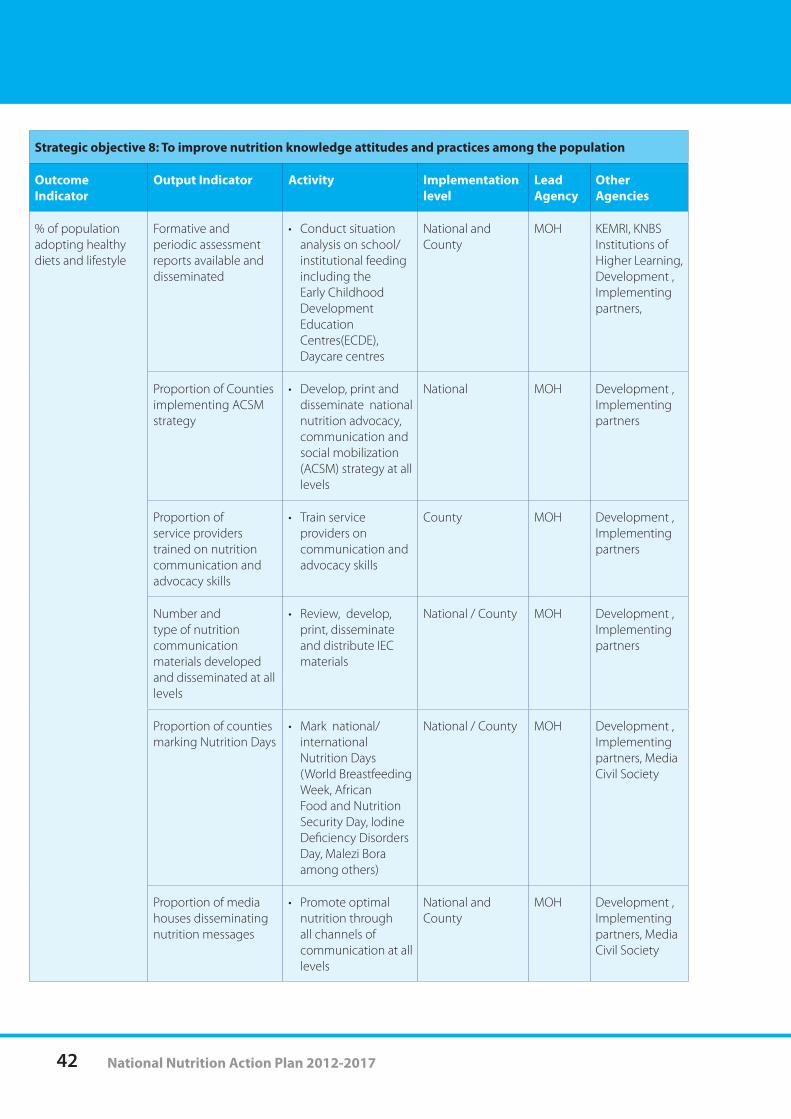
42 National Nutrition Action Plan 2012-2017
Strategic objective 8: To improve nutrition knowledge attitudes and practices among the population
Outcome Indicator
Output Indicator Activity Implementation level
Lead Agency
Other Agencies
% of population adopting healthy diets and lifestyle
Formative and periodic assessment reports available and disseminated
• Conductsituationanalysis on school/ institutional feeding including the Early Childhood Development Education Centres(ECDE), Daycare centres
National and County
MOH KEMRI, KNBS Institutions of Higher Learning, Development , Implementing partners,
Proportion of Counties implementing ACSM strategy
• Develop,printanddisseminate national nutrition advocacy, communication and social mobilization (ACSM) strategy at all levels
National MOH Development , Implementing partners
Proportion of service providers trained on nutrition communication and advocacy skills
• Trainserviceproviders on communication and advocacy skills
County MOH Development , Implementing partners
Number and type of nutrition communication materials developed and disseminated at all levels
• Review,develop,print, disseminate and distribute IEC materials
National / County MOH Development , Implementing partners
Proportion of counties marking Nutrition Days
• Marknational/international Nutrition Days (World Breastfeeding Week, African Food and Nutrition Security Day, Iodine Deficiency Disorders Day, Malezi Bora among others)
National / County MOH Development , Implementing partners, MediaCivil Society
Proportion of media houses disseminating nutrition messages
• Promoteoptimalnutrition through all channels of communication at all levels
National and County
MOH Development , Implementing partners, Media Civil Society
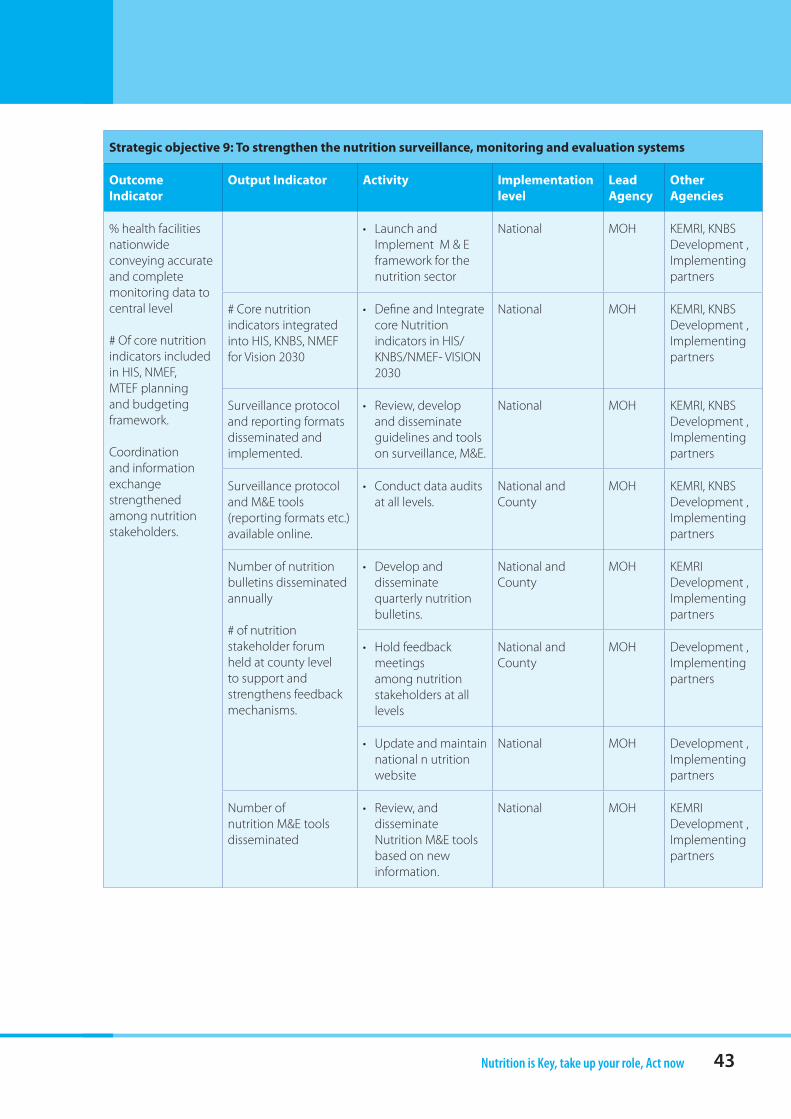
43Nutrition is Key, take up your role, Act now
Strategic objective 9: To strengthen the nutrition surveillance, monitoring and evaluation systems
Outcome Indicator
Output Indicator Activity Implementation level
Lead Agency
Other Agencies
% health facilities nationwide conveying accurate and complete monitoring data to central level
# Of core nutrition indicators included in HIS, NMEF, MTEF planning and budgeting framework.
Coordination and information exchange strengthened among nutrition stakeholders.
• LaunchandImplement M & E framework for the nutrition sector
National MOH KEMRI, KNBS Development , Implementing partners
# Core nutrition indicators integrated into HIS, KNBS, NMEF for Vision 2030
• DefineandIntegratecore Nutrition indicators in HIS/KNBS/NMEF- VISION 2030
National MOH KEMRI, KNBS Development , Implementing partners
Surveillance protocol and reporting formats disseminated and implemented.
• Review,developand disseminate guidelines and tools on surveillance, M&E.
National MOH KEMRI, KNBS Development , Implementing partners
Surveillance protocol and M&E tools (reporting formats etc.) available online.
• Conductdataauditsat all levels.
National and County
MOH KEMRI, KNBS Development , Implementing partners
Number of nutrition bulletins disseminated annually
# of nutrition stakeholder forum held at county level to support and strengthens feedback mechanisms.
• Developanddisseminate quarterly nutrition bulletins.
National and County
MOH KEMRI Development , Implementing partners
• Holdfeedbackmeetings among nutrition stakeholders at all levels
National and County
MOH Development , Implementing partners
• Updateandmaintainnational n utrition website
National MOH Development , Implementing partners
Number of nutrition M&E tools disseminated
• Review,anddisseminate Nutrition M&E tools based on new information.
National MOH KEMRI Development , Implementing partners
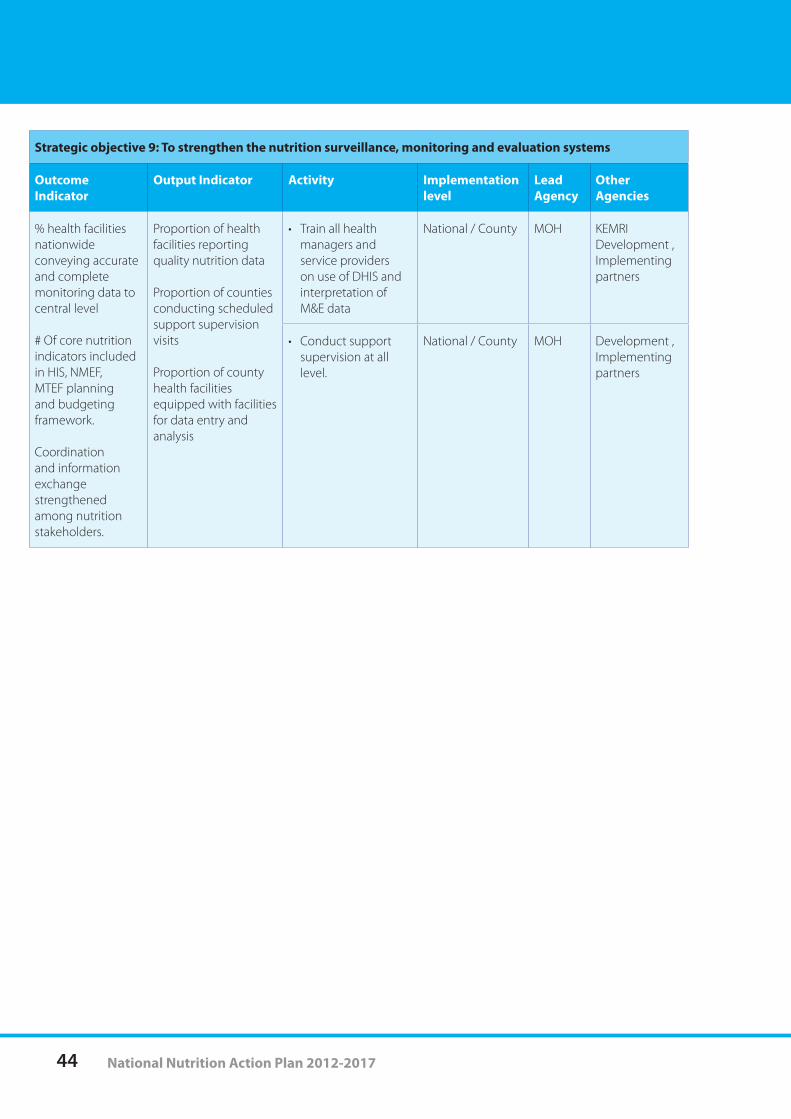
44 National Nutrition Action Plan 2012-2017
Strategic objective 9: To strengthen the nutrition surveillance, monitoring and evaluation systems
Outcome Indicator
Output Indicator Activity Implementation level
Lead Agency
Other Agencies
% health facilities nationwide conveying accurate and complete monitoring data to central level
# Of core nutrition indicators included in HIS, NMEF, MTEF planning and budgeting framework.
Coordination and information exchange strengthened among nutrition stakeholders.
Proportion of health facilities reporting quality nutrition data
Proportion of counties conducting scheduled support supervision visits
Proportion of county health facilities equipped with facilities for data entry and analysis
• Trainallhealthmanagers and service providers on use of DHIS and interpretation of M&E data
National / County MOH KEMRI Development , Implementing partners
• Conductsupportsupervision at all level.
National / County MOH Development , Implementing partners
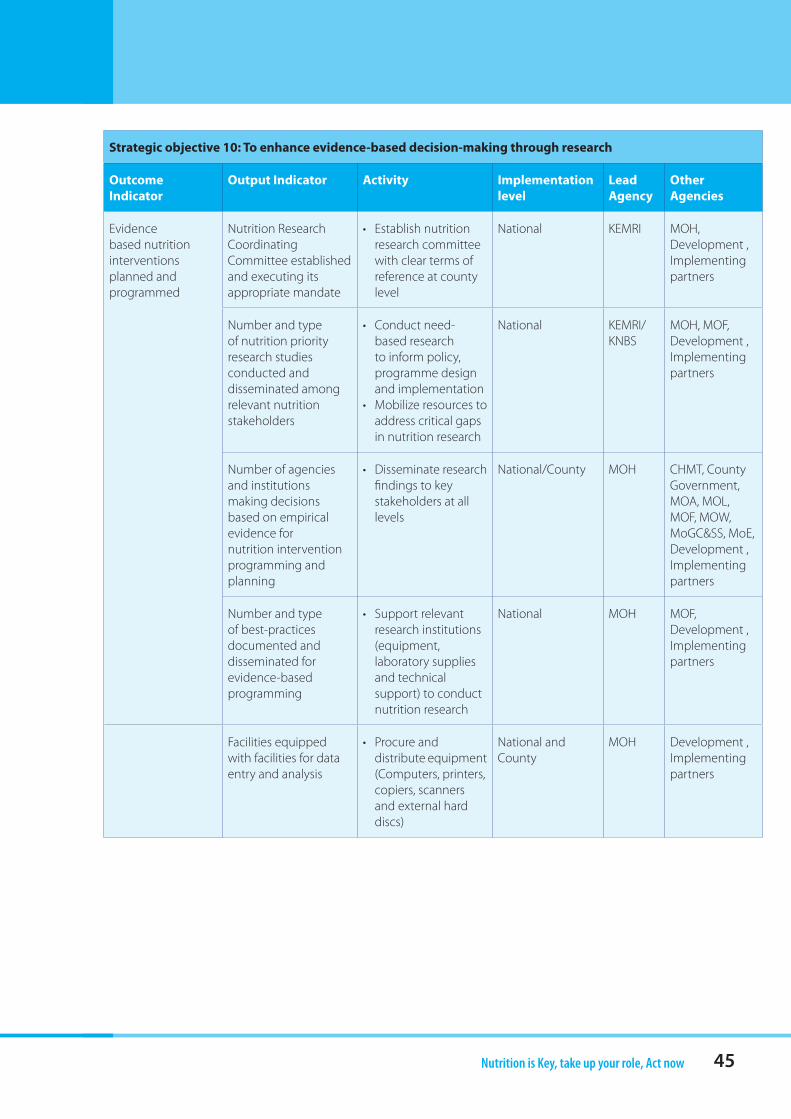
45Nutrition is Key, take up your role, Act now
Strategic objective 10: To enhance evidence-based decision-making through research
Outcome Indicator
Output Indicator Activity Implementation level
Lead Agency
Other Agencies
Evidence based nutrition interventions planned and programmed
Nutrition Research Coordinating Committee established and executing its appropriate mandate
• Establishnutritionresearch committee with clear terms of reference at county level
National KEMRI MOH, Development , Implementing partners
Number and type of nutrition priority research studies conducted and disseminated among relevant nutrition stakeholders
• Conductneed-based research to inform policy, programme design and implementation
• Mobilizeresourcestoaddress critical gaps in nutrition research
National KEMRI/KNBS
MOH, MOF, Development , Implementing partners
Number of agencies and institutions making decisions based on empirical evidence for nutrition intervention programming and planning
• Disseminateresearchfindings to key stakeholders at all levels
National/County MOH CHMT, County Government, MOA, MOL, MOF, MOW, MoGC&SS, MoE, Development , Implementing partners
Number and type of best-practices documented and disseminated for evidence-based programming
• Supportrelevantresearch institutions (equipment, laboratory supplies and technical support) to conduct nutrition research
National MOH MOF, Development , Implementing partners
Facilities equipped with facilities for data entry and analysis
• Procureanddistribute equipment (Computers, printers, copiers, scanners and external hard discs)
National and County
MOH Development , Implementing partners
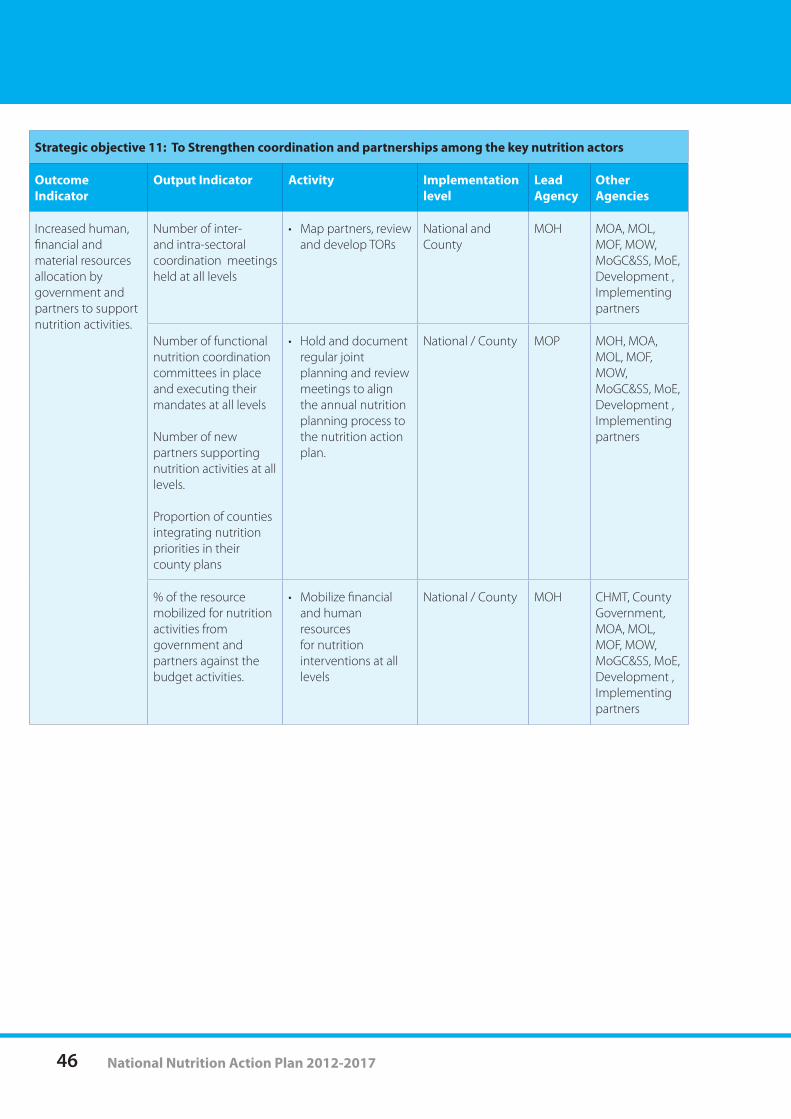
46 National Nutrition Action Plan 2012-2017
Strategic objective 11: To Strengthen coordination and partnerships among the key nutrition actors
Outcome Indicator
Output Indicator Activity Implementation level
Lead Agency
Other Agencies
Increased human, financial and material resources allocation by government and partners to support nutrition activities.
Number of inter- and intra-sectoral coordination meetings held at all levels
• Mappartners,reviewand develop TORs
National and County
MOH MOA, MOL, MOF, MOW, MoGC&SS, MoE, Development , Implementing partners
Number of functional nutrition coordination committees in place and executing their mandates at all levels
Number of new partners supporting nutrition activities at all levels.
Proportion of counties integrating nutrition priorities in their county plans
• Holdanddocumentregular joint planning and review meetings to align the annual nutrition planning process to the nutrition action plan.
National / County MOP MOH, MOA, MOL, MOF, MOW, MoGC&SS, MoE, Development , Implementing partners
% of the resource mobilized for nutrition activities from government and partners against the budget activities.
• Mobilizefinancialand human resources for nutrition interventions at all levels
National / County MOH CHMT, County Government, MOA, MOL, MOF, MOW, MoGC&SS, MoE, Development , Implementing partners
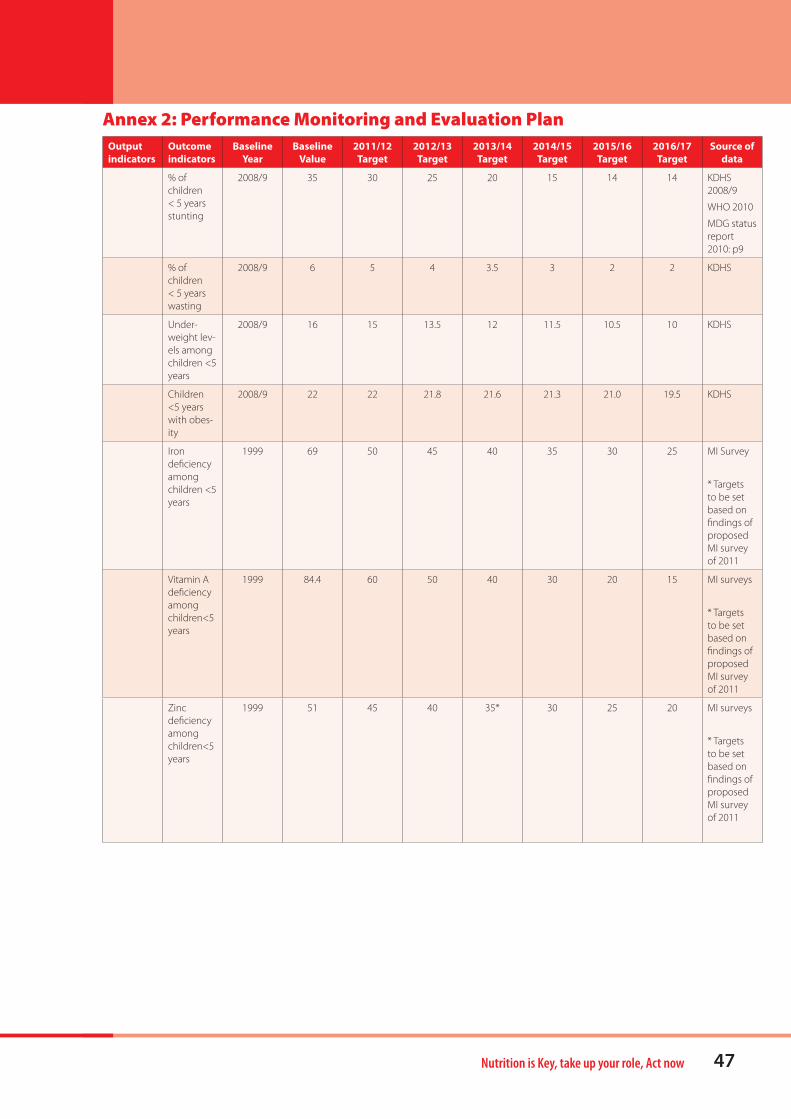
Nutrition is Key, take up your role, Act now 47
Annex 2: Performance Monitoring and Evaluation PlanOutput indicators
Outcome indicators
Baseline Year
Baseline Value
2011/12 Target
2012/13 Target
2013/14 Target
2014/15 Target
2015/16 Target
2016/17 Target
Source of data
% of children < 5 years stunting
2008/9 35 30 25 20 15 14 14 KDHS 2008/9
WHO 2010
MDG status report 2010: p9
% of children < 5 years wasting
2008/9 6 5 4 3.5 3 2 2 KDHS
Under-weight lev-els among children <5 years
2008/9 16 15 13.5 12 11.5 10.5 10 KDHS
Children <5 years with obes-ity
2008/9 22 22 21.8 21.6 21.3 21.0 19.5 KDHS
Iron deficiency among children <5 years
1999 69 50 45 40 35 30 25 MI Survey
* Targets to be set based on findings of proposed MI survey of 2011
Vitamin A deficiency among children<5 years
1999 84.4 60 50 40 30 20 15 MI surveys
* Targets to be set based on findings of proposed MI survey of 2011
Zinc deficiency among children<5 years
1999 51 45 40 35* 30 25 20 MI surveys
* Targets to be set based on findings of proposed MI survey of 2011
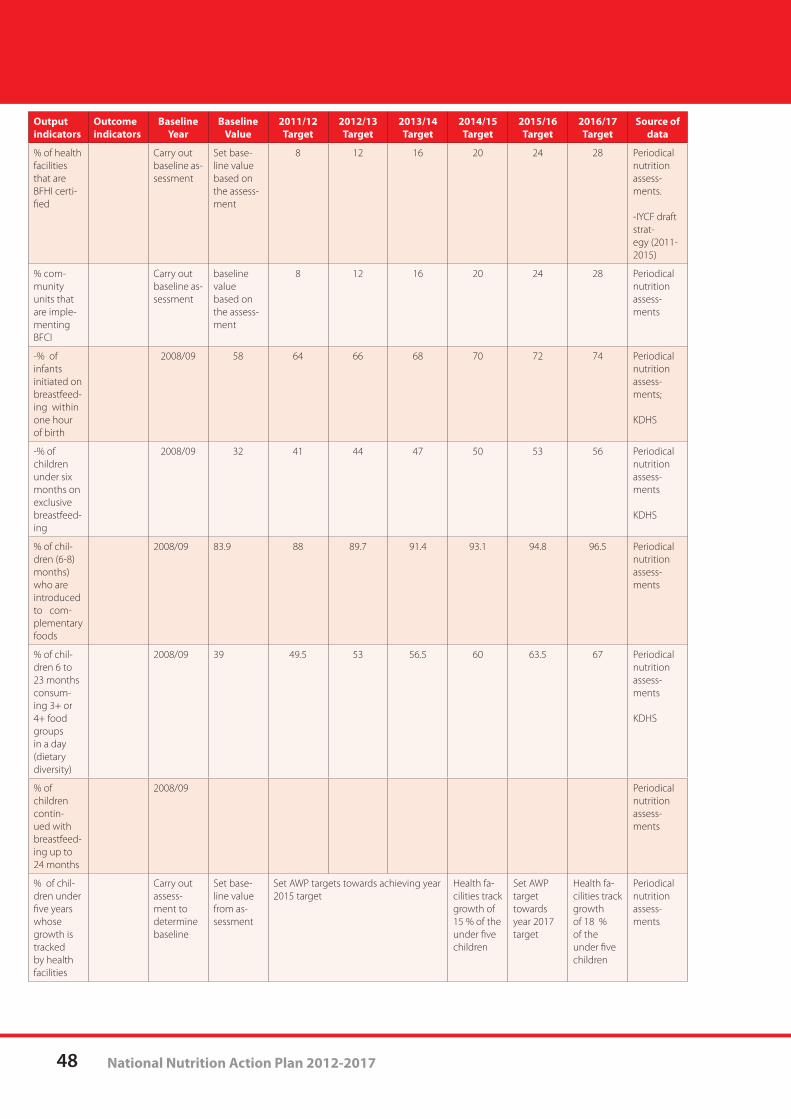
48 National Nutrition Action Plan 2012-2017
Output indicators
Outcome indicators
Baseline Year
Baseline Value
2011/12 Target
2012/13 Target
2013/14 Target
2014/15 Target
2015/16 Target
2016/17 Target
Source of data
% of health facilities that are BFHI certi-fied
Carry out baseline as-sessment
Set base-line value based on the assess-ment
8 12 16 20 24 28 Periodical nutrition assess-ments.
-IYCF draft strat-egy (2011-2015)
% com-munity units that are imple-menting BFCI
Carry out baseline as-sessment
baseline value based on the assess-ment
8 12 16 20 24 28 Periodical nutrition assess-ments
-% of infants initiated on breastfeed-ing within one hour of birth
2008/09 58 64 66 68 70 72 74 Periodical nutrition assess-ments;
KDHS
-% of children under six months on exclusive breastfeed-ing
2008/09 32 41 44 47 50 53 56 Periodical nutrition assess-ments
KDHS
% of chil-dren (6-8) months) who are introduced to com-plementary foods
2008/09 83.9 88 89.7 91.4 93.1 94.8 96.5 Periodical nutrition assess-ments
% of chil-dren 6 to 23 months consum-ing 3+ or 4+ food groups in a day (dietary diversity)
2008/09 39 49.5 53 56.5 60 63.5 67 Periodical nutrition assess-ments
KDHS
% of children contin-ued with breastfeed-ing up to 24 months
2008/09 Periodical nutrition assess-ments
% of chil-dren under five years whose growth is tracked by health facilities
Carry out assess-ment to determine baseline
Set base-line value from as-sessment
Set AWP targets towards achieving year 2015 target
Health fa-cilities track growth of 15 % of the under five children
Set AWP target towards year 2017 target
Health fa-cilities track growth of 18 % of the under five children
Periodical nutrition assess-ments
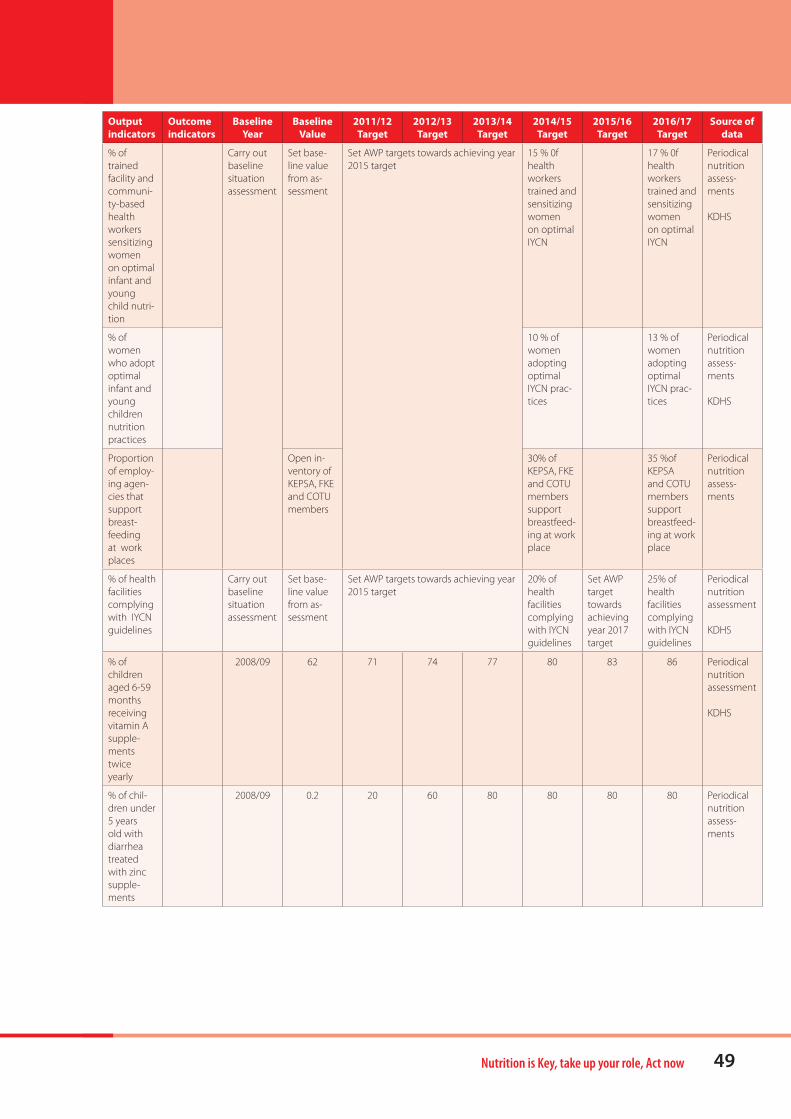
Nutrition is Key, take up your role, Act now 49
% of children aged 6-59 months receiving vitamin A supple-ments twice yearly
2008/09 62 71 74 77 80 83 86 Periodical nutrition assessment
KDHS
% of chil-dren under 5 years old with diarrhea treated with zinc supple-ments
2008/09 0.2 20 60 80 80 80 80 Periodical nutrition assess-ments
Output indicators
Outcome indicators
Baseline Year
Baseline Value
2011/12 Target
2012/13 Target
2013/14 Target
2014/15 Target
2015/16 Target
2016/17 Target
Source of data
% of trained facility and communi-ty-based health workers sensitizing women on optimal infant and young child nutri-tion
Carry out baseline situation assessment
Set base-line value from as-sessment
Set AWP targets towards achieving year 2015 target
15 % 0f health workers trained and sensitizing women on optimal IYCN
17 % 0f health workers trained and sensitizing women on optimal IYCN
Periodical nutrition assess-ments
KDHS
% of women who adopt optimal infant and young children nutrition practices
10 % of women adopting optimal IYCN prac-tices
13 % of women adopting optimal IYCN prac-tices
Periodical nutrition assess-ments
KDHS
Proportion of employ-ing agen-cies that support breast-feeding at work places
Open in-ventory of KEPSA, FKE and COTU members
30% of KEPSA, FKE and COTU members support breastfeed-ing at work place
35 %of KEPSA and COTU members support breastfeed-ing at work place
Periodical nutrition assess-ments
% of health facilities complying with IYCN guidelines
Carry out baseline situation assessment
Set base-line value from as-sessment
Set AWP targets towards achieving year 2015 target
20% of health facilities complying with IYCN guidelines
Set AWP target towards achieving year 2017 target
25% of health facilities complying with IYCN guidelines
Periodical nutrition assessment
KDHS
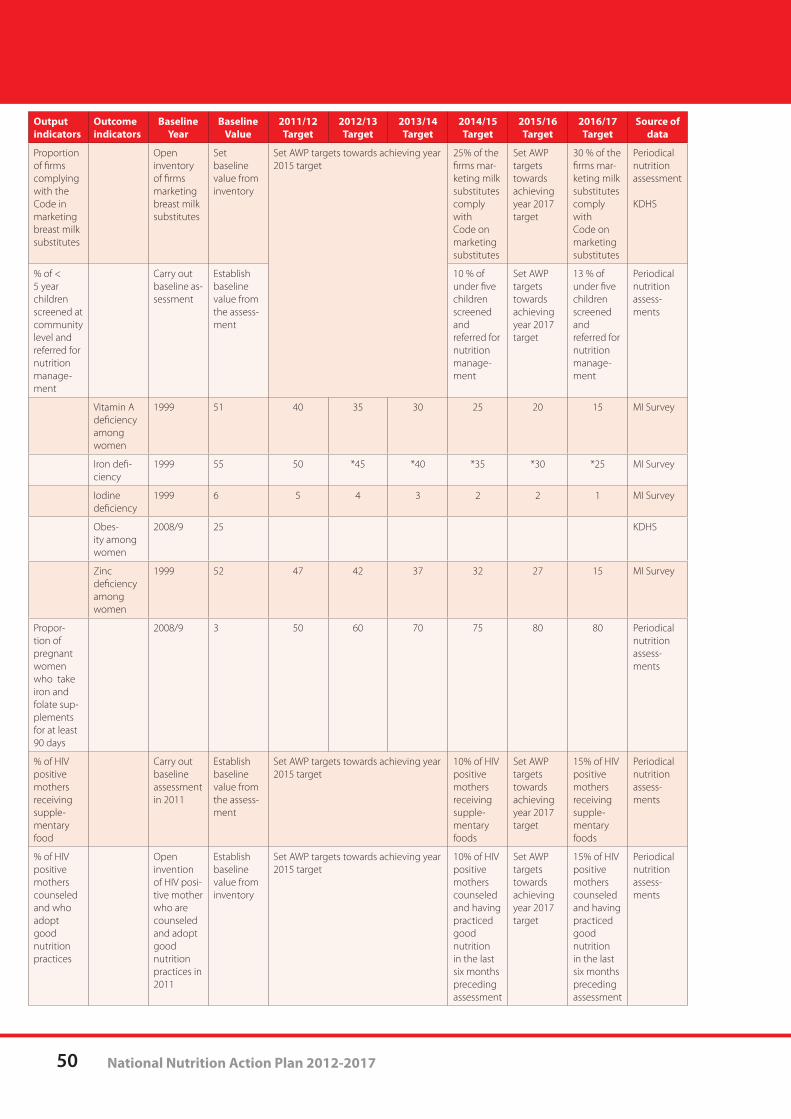
50 National Nutrition Action Plan 2012-2017
Output indicators
Outcome indicators
Baseline Year
Baseline Value
2011/12 Target
2012/13 Target
2013/14 Target
2014/15 Target
2015/16 Target
2016/17 Target
Source of data
Proportion of firms complying with the Code in marketing breast milk substitutes
Open inventory of firms marketing breast milk substitutes
Set baseline value from inventory
Set AWP targets towards achieving year 2015 target
25% of the firms mar-keting milk substitutes comply with Code on marketing substitutes
Set AWP targets towards achieving year 2017 target
30 % of the firms mar-keting milk substitutes comply with Code on marketing substitutes
Periodical nutrition assessment
KDHS
% of < 5 year children screened at community level and referred for nutrition manage-ment
Carry out baseline as-sessment
Establish baseline value from the assess-ment
10 % of under five children screened and referred for nutrition manage-ment
Set AWP targets towards achieving year 2017 target
13 % of under five children screened and referred for nutrition manage-ment
Periodical nutrition assess-ments
Vitamin A deficiency among women
1999 51 40 35 30 25 20 15 MI Survey
Iron defi-ciency
1999 55 50 *45 *40 *35 *30 *25 MI Survey
Iodine deficiency
1999 6 5 4 3 2 2 1 MI Survey
Obes-ity among women
2008/9 25 KDHS
Zinc deficiency among women
1999 52 47 42 37 32 27 15 MI Survey
Propor-tion of pregnant women who take iron and folate sup-plements for at least 90 days
2008/9 3 50 60 70 75 80 80 Periodical nutrition assess-ments
% of HIV positive mothers receiving supple-mentary food
Carry out baseline assessment in 2011
Establish baseline value from the assess-ment
Set AWP targets towards achieving year 2015 target
10% of HIV positive mothers receiving supple-mentary foods
Set AWP targets towards achieving year 2017 target
15% of HIV positive mothers receiving supple-mentary foods
Periodical nutrition assess-ments
% of HIV positive mothers counseled and who adopt good nutrition practices
Open invention of HIV posi-tive mother who are counseled and adopt good nutrition practices in 2011
Establish baseline value from inventory
Set AWP targets towards achieving year 2015 target
10% of HIV positive mothers counseled and having practiced good nutrition in the last six months preceding assessment
Set AWP targets towards achieving year 2017 target
15% of HIV positive mothers counseled and having practiced good nutrition in the last six months preceding assessment
Periodical nutrition assess-ments
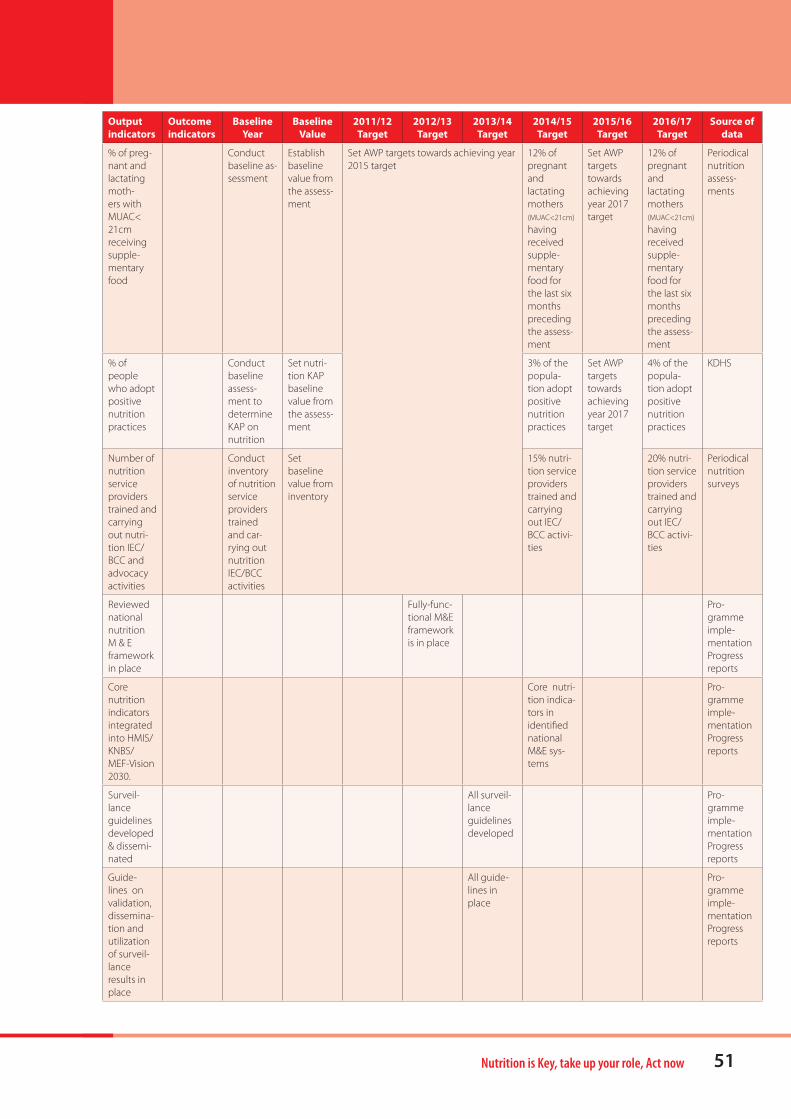
Nutrition is Key, take up your role, Act now 51
Output indicators
Outcome indicators
Baseline Year
Baseline Value
2011/12 Target
2012/13 Target
2013/14 Target
2014/15 Target
2015/16 Target
2016/17 Target
Source of data
% of preg-nant and lactating moth-ers with MUAC< 21cm receiving supple-mentary food
Conduct baseline as-sessment
Establish baseline value from the assess-ment
Set AWP targets towards achieving year 2015 target
12% of pregnant and lactating mothers (MUAC<21cm)
having received supple-mentary food for the last six months preceding the assess-ment
Set AWP targets towards achieving year 2017 target
12% of pregnant and lactating mothers (MUAC<21cm)
having received supple-mentary food for the last six months preceding the assess-ment
Periodical nutrition assess-ments
% of people who adopt positive nutrition practices
Conduct baseline assess-ment to determine KAP on nutrition
Set nutri-tion KAP baseline value from the assess-ment
3% of the popula-tion adopt positive nutrition practices
Set AWP targets towards achieving year 2017 target
4% of the popula-tion adopt positive nutrition practices
KDHS
Number of nutrition service providers trained and carrying out nutri-tion IEC/BCC and advocacy activities
Conduct inventory of nutrition service providers trained and car-rying out nutrition IEC/BCC activities
Set baseline value from inventory
15% nutri-tion service providers trained and carrying out IEC/BCC activi-ties
20% nutri-tion service providers trained and carrying out IEC/BCC activi-ties
Periodical nutrition surveys
Reviewed national nutrition M & E framework in place
Fully-func-tional M&E framework is in place
Pro-gramme imple-mentation Progress reports
Core nutrition indicators integrated into HMIS/KNBS/MEF-Vision 2030.
Core nutri-tion indica-tors in identified national M&E sys-tems
Pro-gramme imple-mentation Progress reports
Surveil-lance guidelines developed & dissemi-nated
All surveil-lance guidelines developed
Pro-gramme imple-mentation Progress reports
Guide-lines on validation, dissemina-tion and utilization of surveil-lance results in place
All guide-lines in place
Pro-gramme imple-mentation Progress reports
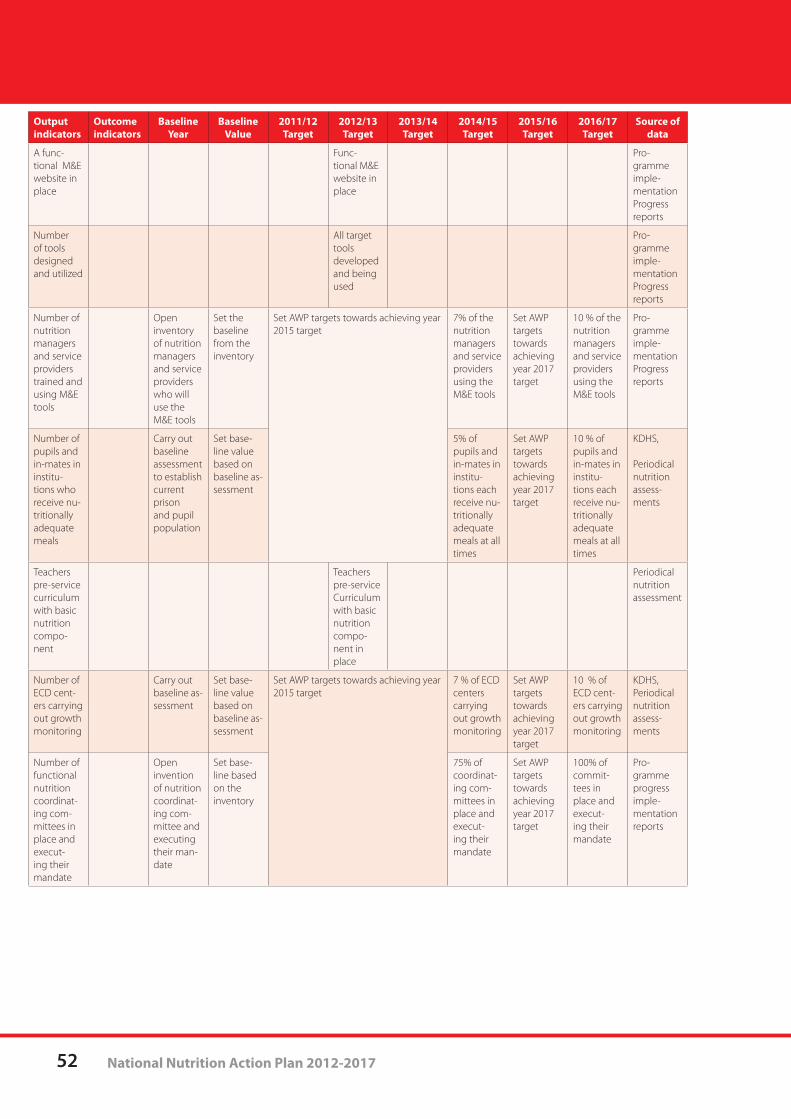
52 National Nutrition Action Plan 2012-2017
Output indicators
Outcome indicators
Baseline Year
Baseline Value
2011/12 Target
2012/13 Target
2013/14 Target
2014/15 Target
2015/16 Target
2016/17 Target
Source of data
A func-tional M&E website in place
Func-tional M&E website in place
Pro-gramme imple-mentation Progress reports
Number of tools designed and utilized
All target tools developed and being used
Pro-gramme imple-mentation Progress reports
Number of nutrition managers and service providers trained and using M&E tools
Open inventory of nutrition managers and service providers who will use the M&E tools
Set the baseline from the inventory
Set AWP targets towards achieving year 2015 target
7% of the nutrition managers and service providers using the M&E tools
Set AWP targets towards achieving year 2017 target
10 % of the nutrition managers and service providers using the M&E tools
Pro-gramme imple-mentation Progress reports
Number of pupils and in-mates in institu-tions who receive nu-tritionally adequate meals
Carry out baseline assessment to establish current prison and pupil population
Set base-line value based on baseline as-sessment
5% of pupils and in-mates in institu-tions each receive nu-tritionally adequate meals at all times
Set AWP targets towards achieving year 2017 target
10 % of pupils and in-mates in institu-tions each receive nu-tritionally adequate meals at all times
KDHS,
Periodical nutrition assess-ments
Teachers pre-service curriculum with basic nutrition compo-nent
Teachers pre-service Curriculum with basic nutrition compo-nent in place
Periodical nutrition assessment
Number of ECD cent-ers carrying out growth monitoring
Carry out baseline as-sessment
Set base-line value based on baseline as-sessment
Set AWP targets towards achieving year 2015 target
7 % of ECD centers carrying out growth monitoring
Set AWP targets towards achieving year 2017 target
10 % of ECD cent-ers carrying out growth monitoring
KDHS,Periodical nutrition assess-ments
Number of functional nutrition coordinat-ing com-mittees in place and execut-ing their mandate
Open invention of nutrition coordinat-ing com-mittee and executing their man-date
Set base-line based on the inventory
75% of coordinat-ing com-mittees in place and execut-ing their mandate
Set AWP targets towards achieving year 2017 target
100% of commit-tees in place and execut-ing their mandate
Pro-gramme progress imple-mentation reports
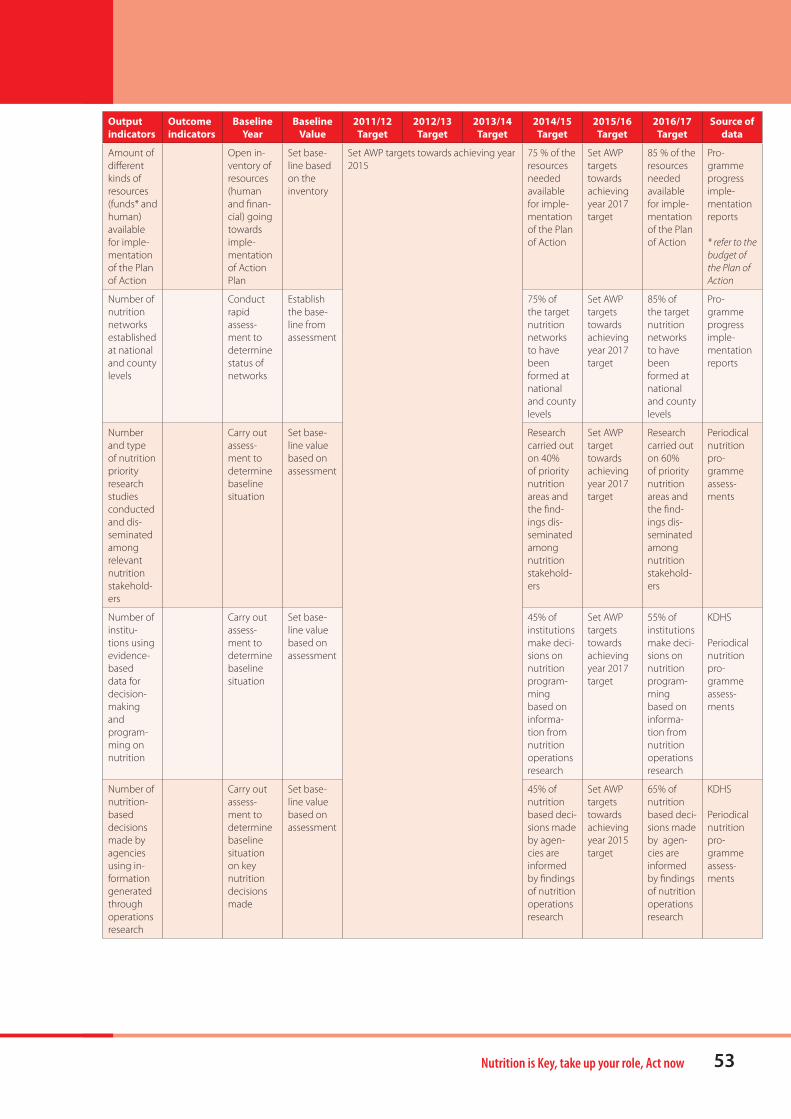
Nutrition is Key, take up your role, Act now 53
Output indicators
Outcome indicators
Baseline Year
Baseline Value
2011/12 Target
2012/13 Target
2013/14 Target
2014/15 Target
2015/16 Target
2016/17 Target
Source of data
Amount of different kinds of resources (funds* and human) available for imple-mentation of the Plan of Action
Open in-ventory of resources (human and finan-cial) going towards imple-mentation of Action Plan
Set base-line based on the inventory
Set AWP targets towards achieving year 2015
75 % of the resources needed available for imple-mentation of the Plan of Action
Set AWP targets towards achieving year 2017 target
85 % of the resources needed available for imple-mentation of the Plan of Action
Pro-gramme progress imple-mentation reports
* refer to the budget of the Plan of Action
Number of nutrition networks established at national and county levels
Conduct rapid assess-ment to determine status of networks
Establish the base-line from assessment
75% of the target nutrition networks to have been formed at national and county levels
Set AWP targets towards achieving year 2017 target
85% of the target nutrition networks to have been formed at national and county levels
Pro-gramme progress imple-mentation reports
Number and type of nutrition priority research studies conducted and dis-seminated among relevant nutrition stakehold-ers
Carry out assess-ment to determine baseline situation
Set base-line value based on assessment
Research carried out on 40% of priority nutrition areas and the find-ings dis-seminated among nutrition stakehold-ers
Set AWP target towards achieving year 2017 target
Research carried out on 60% of priority nutrition areas and the find-ings dis-seminated among nutrition stakehold-ers
Periodical nutrition pro-gramme assess-ments
Number of institu-tions using evidence-based data for decision-making and program-ming on nutrition
Carry out assess-ment to determine baseline situation
Set base-line value based on assessment
45% of institutions make deci-sions on nutrition program-ming based on informa-tion from nutrition operations research
Set AWP targets towards achieving year 2017 target
55% of institutions make deci-sions on nutrition program-ming based on informa-tion from nutrition operations research
KDHS
Periodical nutrition pro-gramme assess-ments
Number of nutrition-based decisions made by agencies using in-formation generated through operations research
Carry out assess-ment to determine baseline situation on key nutrition decisions made
Set base-line value based on assessment
45% of nutrition based deci-sions made by agen-cies are informed by findings of nutrition operations research
Set AWP targets towards achieving year 2015 target
65% of nutrition based deci-sions made by agen-cies are informed by findings of nutrition operations research
KDHS
Periodical nutrition pro-gramme assess-ments
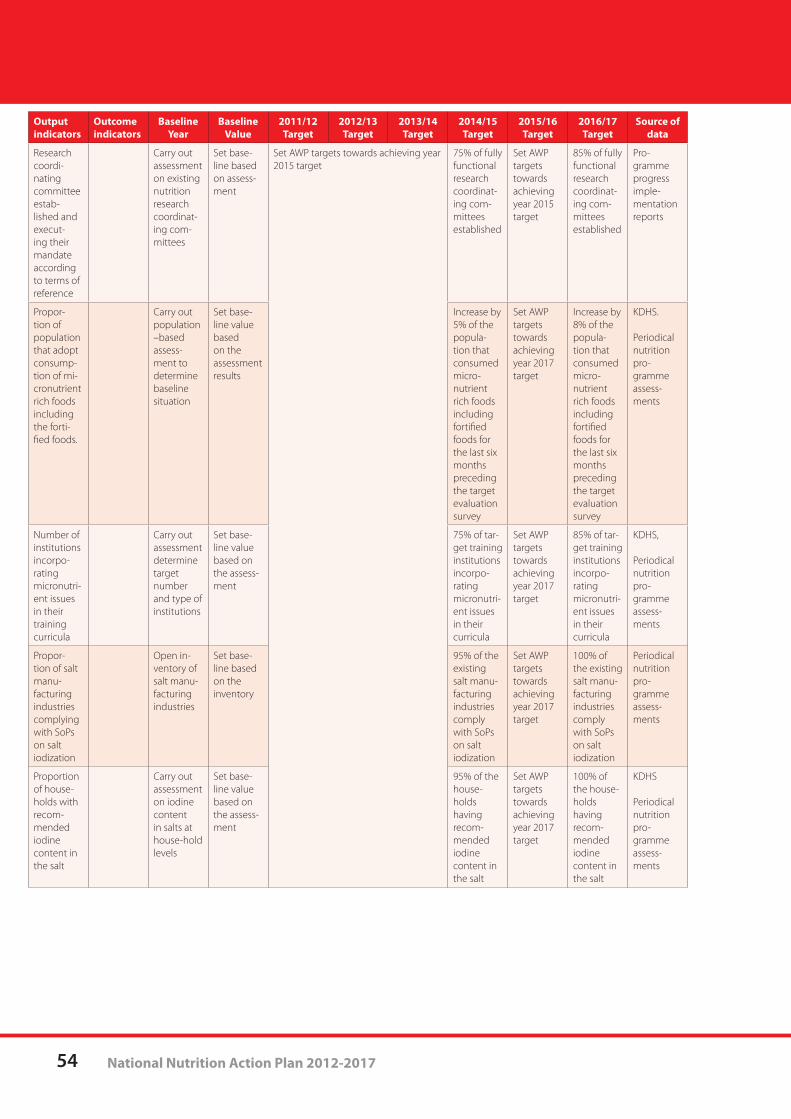
54 National Nutrition Action Plan 2012-2017
Output indicators
Outcome indicators
Baseline Year
Baseline Value
2011/12 Target
2012/13 Target
2013/14 Target
2014/15 Target
2015/16 Target
2016/17 Target
Source of data
Research coordi-nating committee estab-lished and execut-ing their mandate according to terms of reference
Carry out assessment on existing nutrition research coordinat-ing com-mittees
Set base-line based on assess-ment
Set AWP targets towards achieving year 2015 target
75% of fully functional research coordinat-ing com-mittees established
Set AWP targets towards achieving year 2015 target
85% of fully functional research coordinat-ing com-mittees established
Pro-gramme progress imple-mentation reports
Propor-tion of population that adopt consump-tion of mi-cronutrient rich foods including the forti-fied foods.
Carry out population –based assess-ment to determine baseline situation
Set base-line value based on the assessment results
Increase by 5% of the popula-tion that consumed micro-nutrient rich foods including fortified foods for the last six months preceding the target evaluation survey
Set AWP targets towards achieving year 2017 target
Increase by 8% of the popula-tion that consumed micro-nutrient rich foods including fortified foods for the last six months preceding the target evaluation survey
KDHS.
Periodical nutrition pro-gramme assess-ments
Number of institutions incorpo-rating micronutri-ent issues in their training curricula
Carry out assessment determine target number and type of institutions
Set base-line value based on the assess-ment
75% of tar-get training institutions incorpo-rating micronutri-ent issues in their curricula
Set AWP targets towards achieving year 2017 target
85% of tar-get training institutions incorpo-rating micronutri-ent issues in their curricula
KDHS,
Periodical nutrition pro-gramme assess-ments
Propor-tion of salt manu-facturing industries complying with SoPs on salt iodization
Open in-ventory of salt manu-facturing industries
Set base-line based on the inventory
95% of the existing salt manu-facturing industries comply with SoPs on salt iodization
Set AWP targets towards achieving year 2017 target
100% of the existing salt manu-facturing industries comply with SoPs on salt iodization
Periodical nutrition pro-gramme assess-ments
Proportion of house-holds with recom-mended iodine content in the salt
Carry out assessment on iodine content in salts at house-hold levels
Set base-line value based on the assess-ment
95% of the house-holds having recom-mended iodine content in the salt
Set AWP targets towards achieving year 2017 target
100% of the house-holds having recom-mended iodine content in the salt
KDHS
Periodical nutrition pro-gramme assess-ments
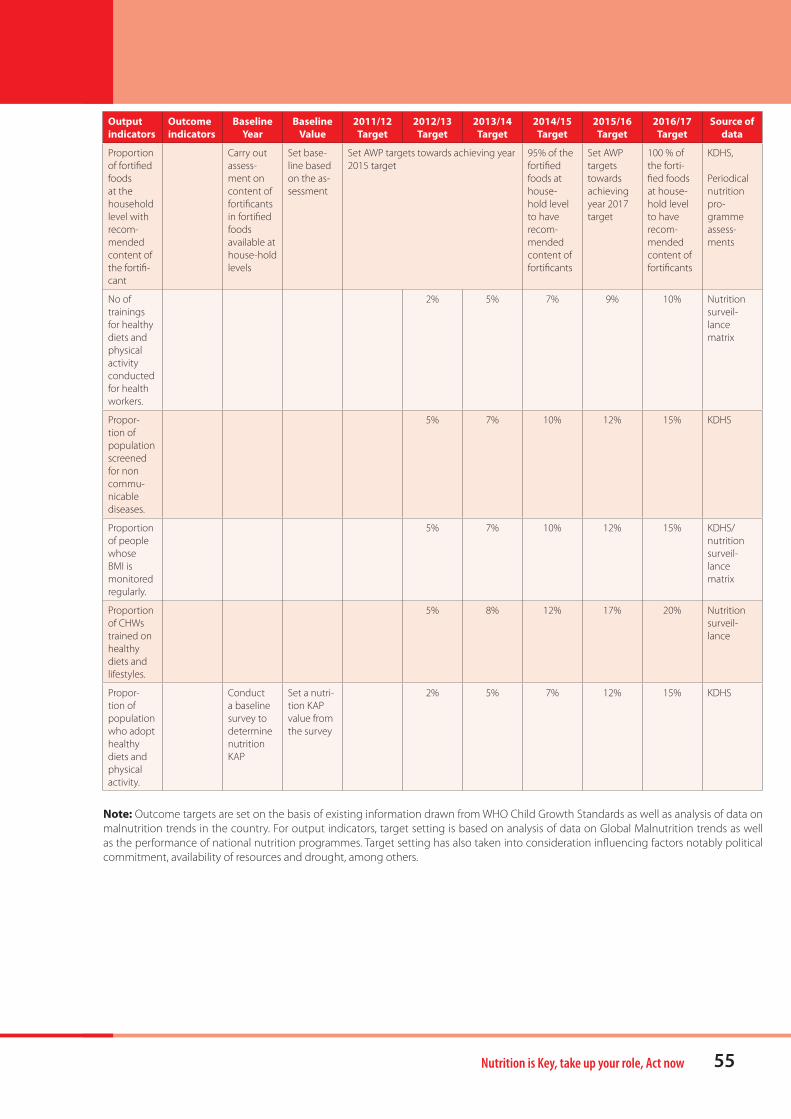
Nutrition is Key, take up your role, Act now 55
Output indicators
Outcome indicators
Baseline Year
Baseline Value
2011/12 Target
2012/13 Target
2013/14 Target
2014/15 Target
2015/16 Target
2016/17 Target
Source of data
Proportion of fortified foods at the household level with recom-mended content of the fortifi-cant
Carry out assess-ment on content of fortificants in fortified foods available at house-hold levels
Set base-line based on the as-sessment
Set AWP targets towards achieving year 2015 target
95% of the fortified foods at house-hold level to have recom-mended content of fortificants
Set AWP targets towards achieving year 2017 target
100 % of the forti-fied foods at house-hold level to have recom-mended content of fortificants
KDHS,
Periodical nutrition pro-gramme assess-ments
No of trainings for healthy diets and physical activity conducted for health workers.
2% 5% 7% 9% 10% Nutrition surveil-lance matrix
Propor-tion of population screened for non commu-nicable diseases.
5% 7% 10% 12% 15% KDHS
Proportion of people whose BMI is monitored regularly.
5% 7% 10% 12% 15% KDHS/ nutrition surveil-lance matrix
Proportion of CHWs trained on healthy diets and lifestyles.
5% 8% 12% 17% 20% Nutrition surveil-lance
Propor-tion of population who adopt healthy diets and physical activity.
Conduct a baseline survey to determine nutrition KAP
Set a nutri-tion KAP value from the survey
2% 5% 7% 12% 15% KDHS
Note: Outcome targets are set on the basis of existing information drawn from WHO Child Growth Standards as well as analysis of data on malnutrition trends in the country. For output indicators, target setting is based on analysis of data on Global Malnutrition trends as well as the performance of national nutrition programmes. Target setting has also taken into consideration influencing factors notably political commitment, availability of resources and drought, among others.
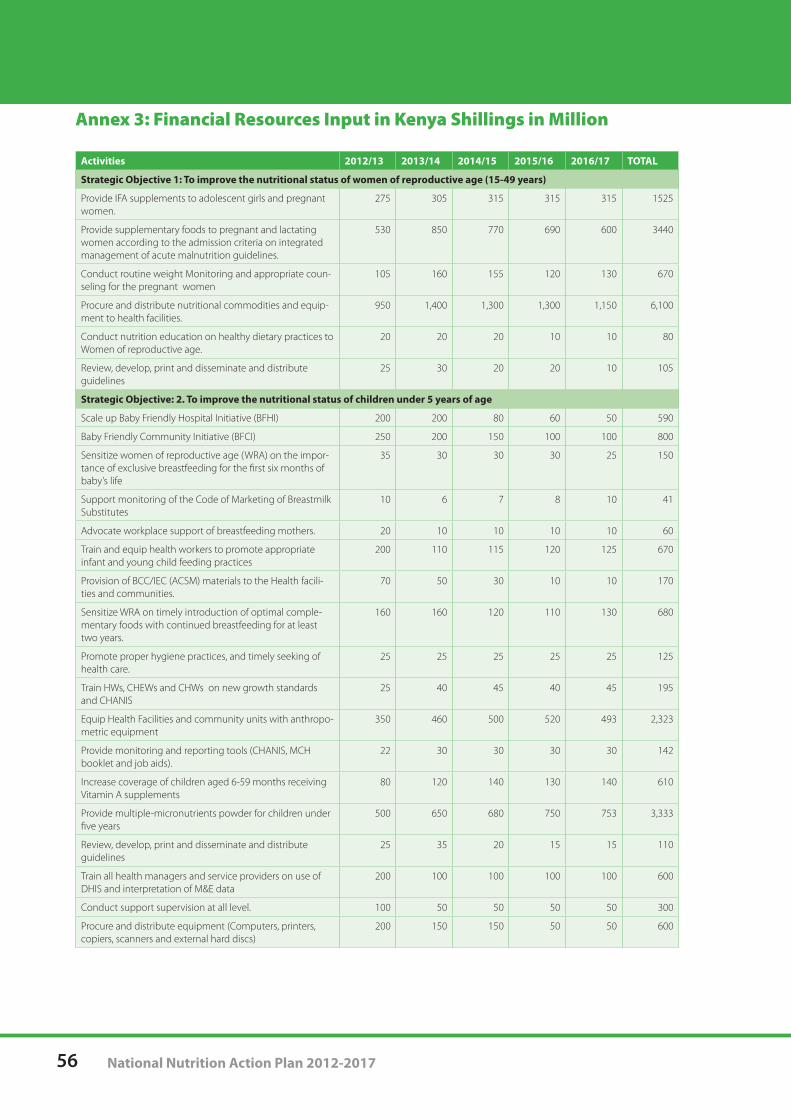
56 National Nutrition Action Plan 2012-2017
Annex 3: Financial Resources Input in Kenya Shillings in Million
Activities 2012/13 2013/14 2014/15 2015/16 2016/17 TOTAL
Strategic Objective 1: To improve the nutritional status of women of reproductive age (15-49 years)
Provide IFA supplements to adolescent girls and pregnant women.
275 305 315 315 315 1525
Provide supplementary foods to pregnant and lactating women according to the admission criteria on integrated management of acute malnutrition guidelines.
530 850 770 690 600 3440
Conduct routine weight Monitoring and appropriate coun-seling for the pregnant women
105 160 155 120 130 670
Procure and distribute nutritional commodities and equip-ment to health facilities.
950 1,400 1,300 1,300 1,150 6,100
Conduct nutrition education on healthy dietary practices to Women of reproductive age.
20 20 20 10 10 80
Review, develop, print and disseminate and distribute guidelines
25 30 20 20 10 105
Strategic Objective: 2. To improve the nutritional status of children under 5 years of age
Scale up Baby Friendly Hospital Initiative (BFHI) 200 200 80 60 50 590
Baby Friendly Community Initiative (BFCI) 250 200 150 100 100 800
Sensitize women of reproductive age (WRA) on the impor-tance of exclusive breastfeeding for the first six months of baby’s life
35 30 30 30 25 150
Support monitoring of the Code of Marketing of Breastmilk Substitutes
10 6 7 8 10 41
Advocate workplace support of breastfeeding mothers. 20 10 10 10 10 60
Train and equip health workers to promote appropriate infant and young child feeding practices
200 110 115 120 125 670
Provision of BCC/IEC (ACSM) materials to the Health facili-ties and communities.
70 50 30 10 10 170
Sensitize WRA on timely introduction of optimal comple-mentary foods with continued breastfeeding for at least two years.
160 160 120 110 130 680
Promote proper hygiene practices, and timely seeking of health care.
25 25 25 25 25 125
Train HWs, CHEWs and CHWs on new growth standards and CHANIS
25 40 45 40 45 195
Equip Health Facilities and community units with anthropo-metric equipment
350 460 500 520 493 2,323
Provide monitoring and reporting tools (CHANIS, MCH booklet and job aids).
22 30 30 30 30 142
Increase coverage of children aged 6-59 months receiving Vitamin A supplements
80 120 140 130 140 610
Provide multiple-micronutrients powder for children under five years
500 650 680 750 753 3,333
Review, develop, print and disseminate and distribute guidelines
25 35 20 15 15 110
Train all health managers and service providers on use of DHIS and interpretation of M&E data
200 100 100 100 100 600
Conduct support supervision at all level. 100 50 50 50 50 300
Procure and distribute equipment (Computers, printers, copiers, scanners and external hard discs)
200 150 150 50 50 600
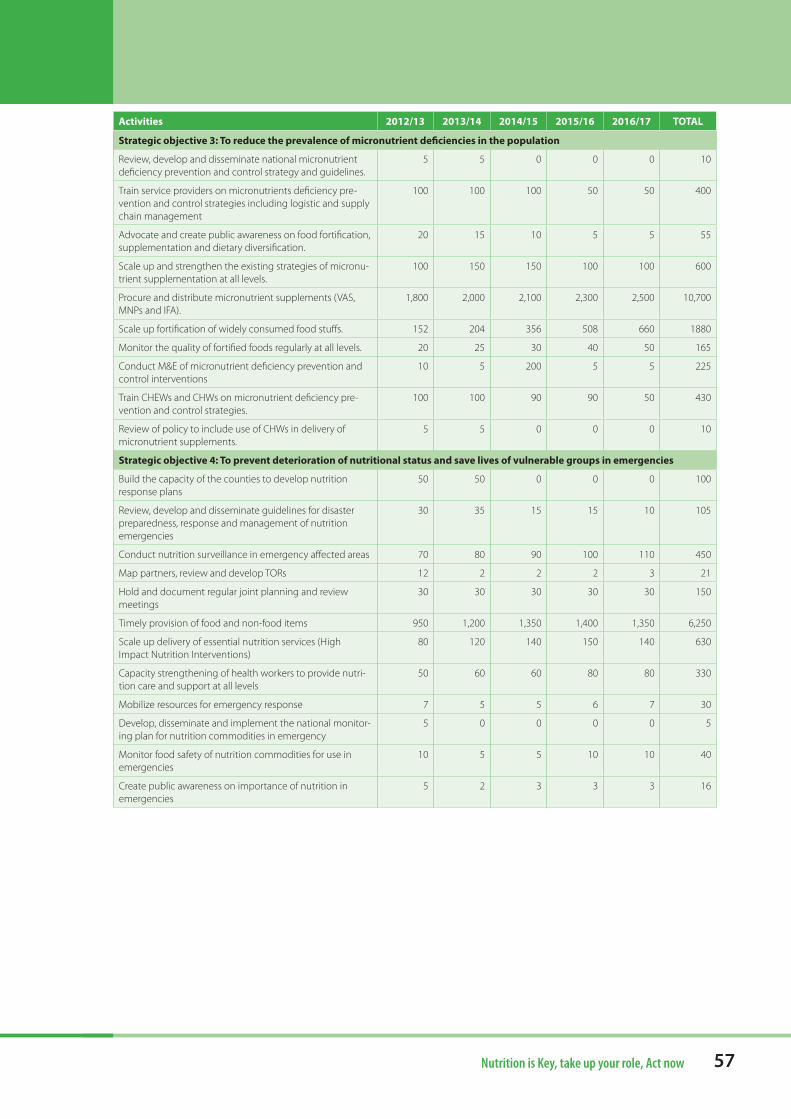
57Nutrition is Key, take up your role, Act now
Strategic objective 3: To reduce the prevalence of micronutrient deficiencies in the population
Review, develop and disseminate national micronutrient deficiency prevention and control strategy and guidelines.
5 5 0 0 0 10
Train service providers on micronutrients deficiency pre-vention and control strategies including logistic and supply chain management
100 100 100 50 50 400
Advocate and create public awareness on food fortification, supplementation and dietary diversification.
20 15 10 5 5 55
Scale up and strengthen the existing strategies of micronu-trient supplementation at all levels.
100 150 150 100 100 600
Procure and distribute micronutrient supplements (VAS, MNPs and IFA).
1,800 2,000 2,100 2,300 2,500 10,700
Scale up fortification of widely consumed food stuffs. 152 204 356 508 660 1880
Monitor the quality of fortified foods regularly at all levels. 20 25 30 40 50 165
Conduct M&E of micronutrient deficiency prevention and control interventions
10 5 200 5 5 225
Train CHEWs and CHWs on micronutrient deficiency pre-vention and control strategies.
100 100 90 90 50 430
Review of policy to include use of CHWs in delivery of micronutrient supplements.
5 5 0 0 0 10
Strategic objective 4: To prevent deterioration of nutritional status and save lives of vulnerable groups in emergencies
Build the capacity of the counties to develop nutrition response plans
50 50 0 0 0 100
Review, develop and disseminate guidelines for disaster preparedness, response and management of nutrition emergencies
30 35 15 15 10 105
Conduct nutrition surveillance in emergency affected areas 70 80 90 100 110 450
Map partners, review and develop TORs 12 2 2 2 3 21
Hold and document regular joint planning and review meetings
30 30 30 30 30 150
Timely provision of food and non-food items 950 1,200 1,350 1,400 1,350 6,250
Scale up delivery of essential nutrition services (High Impact Nutrition Interventions)
80 120 140 150 140 630
Capacity strengthening of health workers to provide nutri-tion care and support at all levels
50 60 60 80 80 330
Mobilize resources for emergency response 7 5 5 6 7 30
Develop, disseminate and implement the national monitor-ing plan for nutrition commodities in emergency
5 0 0 0 0 5
Monitor food safety of nutrition commodities for use in emergencies
10 5 5 10 10 40
Create public awareness on importance of nutrition in emergencies
5 2 3 3 3 16
Activities 2012/13 2013/14 2014/15 2015/16 2016/17 TOTAL
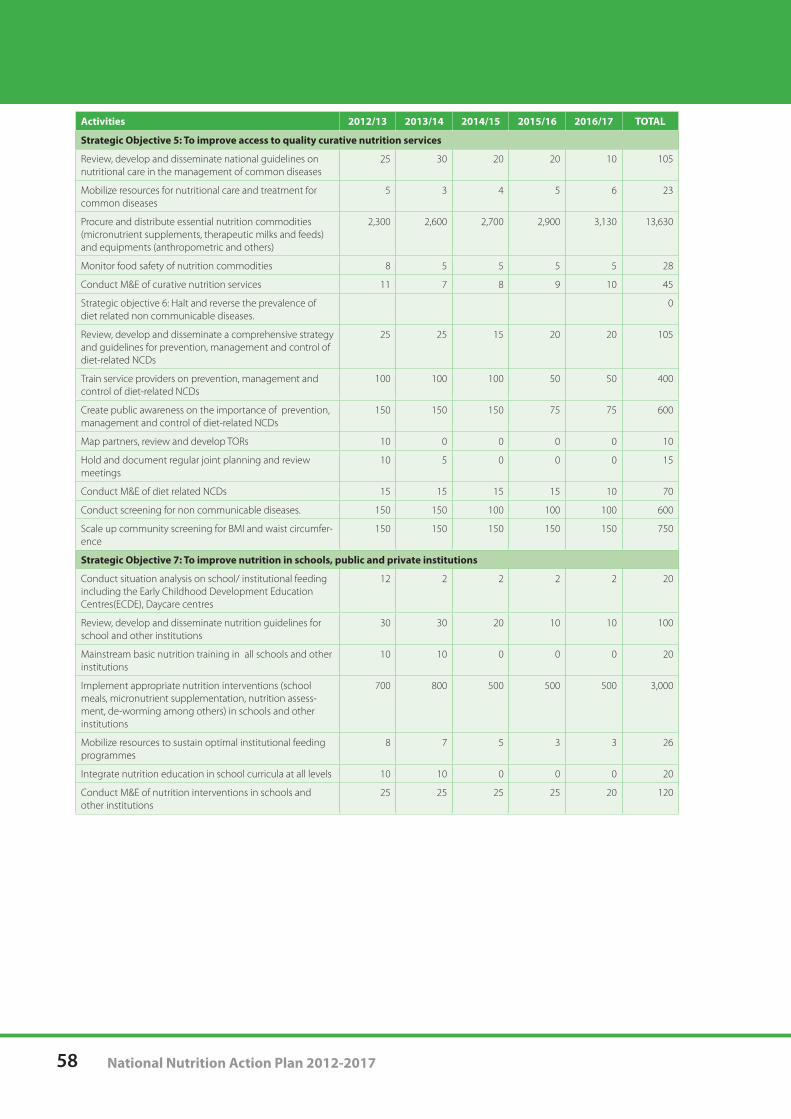
58 National Nutrition Action Plan 2012-2017
Strategic Objective 5: To improve access to quality curative nutrition services
Review, develop and disseminate national guidelines on nutritional care in the management of common diseases
25 30 20 20 10 105
Mobilize resources for nutritional care and treatment for common diseases
5 3 4 5 6 23
Procure and distribute essential nutrition commodities (micronutrient supplements, therapeutic milks and feeds) and equipments (anthropometric and others)
2,300 2,600 2,700 2,900 3,130 13,630
Monitor food safety of nutrition commodities 8 5 5 5 5 28
Conduct M&E of curative nutrition services 11 7 8 9 10 45
Strategic objective 6: Halt and reverse the prevalence of diet related non communicable diseases.
0
Review, develop and disseminate a comprehensive strategy and guidelines for prevention, management and control of diet-related NCDs
25 25 15 20 20 105
Train service providers on prevention, management and control of diet-related NCDs
100 100 100 50 50 400
Create public awareness on the importance of prevention, management and control of diet-related NCDs
150 150 150 75 75 600
Map partners, review and develop TORs 10 0 0 0 0 10
Hold and document regular joint planning and review meetings
10 5 0 0 0 15
Conduct M&E of diet related NCDs 15 15 15 15 10 70
Conduct screening for non communicable diseases. 150 150 100 100 100 600
Scale up community screening for BMI and waist circumfer-ence
150 150 150 150 150 750
Strategic Objective 7: To improve nutrition in schools, public and private institutions
Conduct situation analysis on school/ institutional feeding including the Early Childhood Development Education Centres(ECDE), Daycare centres
12 2 2 2 2 20
Review, develop and disseminate nutrition guidelines for school and other institutions
30 30 20 10 10 100
Mainstream basic nutrition training in all schools and other institutions
10 10 0 0 0 20
Implement appropriate nutrition interventions (school meals, micronutrient supplementation, nutrition assess-ment, de-worming among others) in schools and other institutions
700 800 500 500 500 3,000
Mobilize resources to sustain optimal institutional feeding programmes
8 7 5 3 3 26
Integrate nutrition education in school curricula at all levels 10 10 0 0 0 20
Conduct M&E of nutrition interventions in schools and other institutions
25 25 25 25 20 120
Activities 2012/13 2013/14 2014/15 2015/16 2016/17 TOTAL
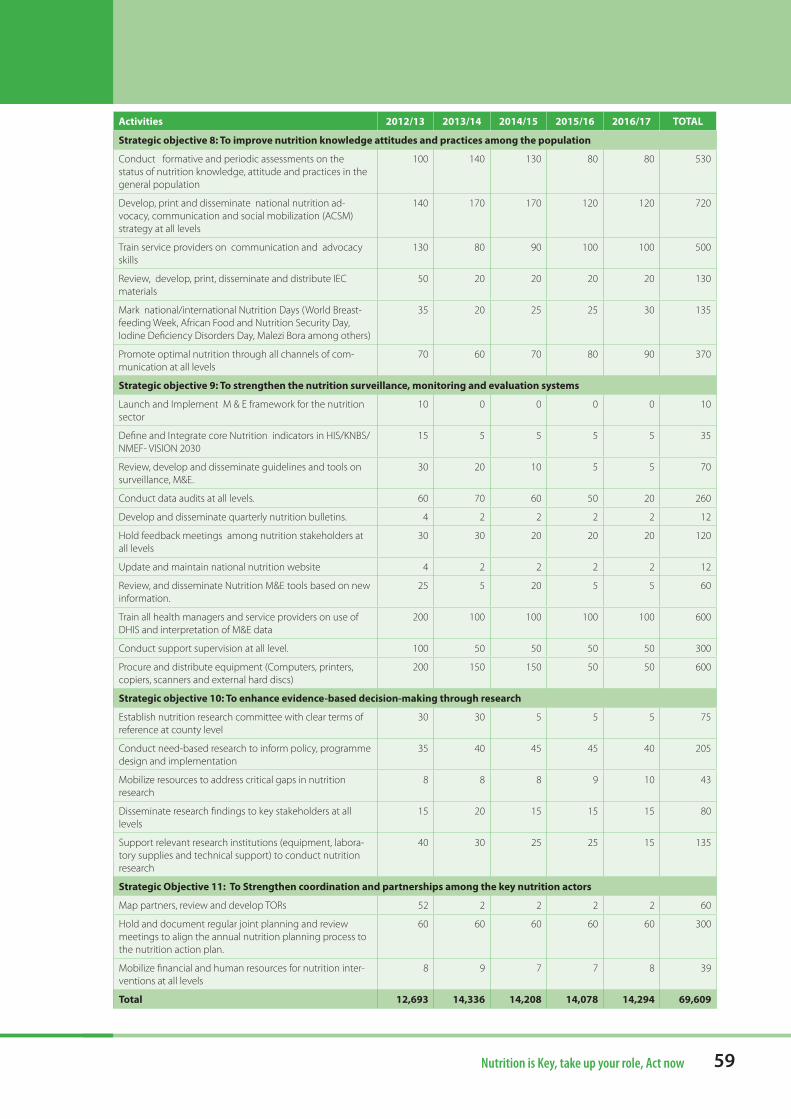
59Nutrition is Key, take up your role, Act now
Strategic objective 8: To improve nutrition knowledge attitudes and practices among the population
Conduct formative and periodic assessments on the status of nutrition knowledge, attitude and practices in the general population
100 140 130 80 80 530
Develop, print and disseminate national nutrition ad-vocacy, communication and social mobilization (ACSM) strategy at all levels
140 170 170 120 120 720
Train service providers on communication and advocacy skills
130 80 90 100 100 500
Review, develop, print, disseminate and distribute IEC materials
50 20 20 20 20 130
Mark national/international Nutrition Days (World Breast-feeding Week, African Food and Nutrition Security Day, Iodine Deficiency Disorders Day, Malezi Bora among others)
35 20 25 25 30 135
Promote optimal nutrition through all channels of com-munication at all levels
70 60 70 80 90 370
Strategic objective 9: To strengthen the nutrition surveillance, monitoring and evaluation systems
Launch and Implement M & E framework for the nutrition sector
10 0 0 0 0 10
Define and Integrate core Nutrition indicators in HIS/KNBS/NMEF- VISION 2030
15 5 5 5 5 35
Review, develop and disseminate guidelines and tools on surveillance, M&E.
30 20 10 5 5 70
Conduct data audits at all levels. 60 70 60 50 20 260
Develop and disseminate quarterly nutrition bulletins. 4 2 2 2 2 12
Hold feedback meetings among nutrition stakeholders at all levels
30 30 20 20 20 120
Update and maintain national nutrition website 4 2 2 2 2 12
Review, and disseminate Nutrition M&E tools based on new information.
25 5 20 5 5 60
Train all health managers and service providers on use of DHIS and interpretation of M&E data
200 100 100 100 100 600
Conduct support supervision at all level. 100 50 50 50 50 300
Procure and distribute equipment (Computers, printers, copiers, scanners and external hard discs)
200 150 150 50 50 600
Strategic objective 10: To enhance evidence-based decision-making through research
Establish nutrition research committee with clear terms of reference at county level
30 30 5 5 5 75
Conduct need-based research to inform policy, programme design and implementation
35 40 45 45 40 205
Mobilize resources to address critical gaps in nutrition research
8 8 8 9 10 43
Disseminate research findings to key stakeholders at all levels
15 20 15 15 15 80
Support relevant research institutions (equipment, labora-tory supplies and technical support) to conduct nutrition research
40 30 25 25 15 135
Strategic Objective 11: To Strengthen coordination and partnerships among the key nutrition actors
Map partners, review and develop TORs 52 2 2 2 2 60
Hold and document regular joint planning and review meetings to align the annual nutrition planning process to the nutrition action plan.
60 60 60 60 60 300
Mobilize financial and human resources for nutrition inter-ventions at all levels
8 9 7 7 8 39
Total 12,693 14,336 14,208 14,078 14,294 69,609
Activities 2012/13 2013/14 2014/15 2015/16 2016/17 TOTAL

60 National Nutrition Action Plan 2012-201760 National Nutrition Action Plan 2012-2017

Nutrition is Key, take up your role, Act now 6161Nutrition is Key, take up your role, Act now
62 National Nutrition Action Plan 2012-2017
References
1. Butta Z.A et al., Maternal and child under nutrition study group. What works? Interventions for Mater-nal and Child Under-nutrition and Survival. Lancet 2008:37:417-40
2. Central Bureau of Statistics (CBS) (Kenya), Ministry of Health (MOH) (Kenya), and ORC Macro. 2004. Kenya Demographic and Health Survey 2003. Calverton, Maryland: CBS, MOH and ORC Macro.
3. Kenya national Bureau of statistics (KNBS) and ICF Macro.2010. Kenya Demographic and Health Sur-vey 2008-09. Calverton, Maryland: KNBS and ICF Macro.
4. National Council for Population and Development (NCPD), Central Bureau of Statistics (CBS) (Office of the Vice President and Ministry of Planning and National Development) [Kenya], and Macro In-ternational Inc, (MI). (1999). Kenya Demographic and Health Survey 1998. Calverton, Maryland: NCPD, CBS, and MI.
5. Nutrition Situation Analysis Report ( 2011), Save the Children, UK
6. Republic of Kenya (2008). Kenya Vision 2030. A globally competitive and prosperous Kenya. Nairobi: Min-istry of Planning and National Development and the National Economic and Social Council (NESC).
7. Republic of Kenya: Adolescent Reproductive Health and Development Plan of Action (2005-2015)
8. Republic of Kenya: Draft Food Security and Nutrition Policy, 2007
9. Republic of Kenya: Draft Food Security and Nutrition Strategy 2008
10. Republic of Kenya: Kenya Nutrition Plan of Action; 1994-1997
11. Republic of Mozambique: Multi-sectoral Plan for Chronic Malnutrition Reduction in Mozambique (2011-2014)
12. World Bank (2006). Repositioning nutrition and central to development. A strategy for large-scale action. World Bank: Washington.


MINISTRY OF PUBLIC HEALTH AND SANITATION
REPUBLIC OF KENYA