REPUBLIC OF KENYA COUNTY GOVERNMENT OF LAIKIPIA
131
Laikipia County Integrated Development Plan 2018-2022 Page i REPUBLIC OF KENYA COUNTY GOVERNMENT OF LAIKIPIA SECOND COUNTY INTEGRATED DEVELOPMENT PLAN 2018-2022 KENYA Towards a Globally Competitive and Prosperous Nation
Transcript of REPUBLIC OF KENYA COUNTY GOVERNMENT OF LAIKIPIA

Laikipia County Integrated Development Plan 2018-2022 Page i
REPUBLIC OF KENYA
COUNTY GOVERNMENT OF LAIKIPIA
SECOND COUNTY INTEGRATED DEVELOPMENT PLAN
2018-2022
KENYA
Towards a Globally Competitive and Prosperous Nation

Laikipia County Integrated Development Plan 2018-2022 Page ii
COUNTY INTEGRATED DEVELOPMENT PLAN FOR
LAIKIPIA
COUNTY VISION, MISSION AND CORE VALUES
Vision Statement
The greatest county with the best quality of life
Mission Statement
To enable every household in Laikipia county lead a prosperous life
Core Values
People-centeredness
Equity
Accountability
Efficiency
Professionalism
Integrity
Innovativeness
Passion
Laikipia County Integrated Development Plan 2018-2022 Page iii
Table of Contents
REPUBLIC OF KENYA ....................................................................................................... i
COUNTY VISION, MISSION AND CORE VALUES ....................................................................... ii
Table of Contents ................................................................................................................. iii
FOREWORD .......................................................................................................................... ix
ACKNOWLEDGEMENTS .......................................................................................................... x
ABBREVIATIONS AND ACRONYMS ........................................................................................ xi
EXECUTIVE SUMMARY ..........................................................................................................xii
CHAPTER ONE ..................................................................................................................... 12
COUNTY GENERAL INFORMATION ....................................................................................... 12
1.0 County Overview ....................................................................................................... 13
1.1 Position and Size ............................................................................................................ 13
Map 1: Geographical Pposition of Laikipia County in Kenya .................................................. 13
1.2 Physiographic and Natural Conditions ......................................................................... 13
1.2.1 Physical and Topographic Features .............................................................................. 13
1.2.2 Ecological Conditions .................................................................................................. 14
1.2.3 Climatic Conditions ............................................................. Error! Bookmark not defined.
Table 1: Mean Annual Rainfall in Millimetres (mm) 2013-2017 ..... Error! Bookmark not defined.
1.3 Administrative Units and Political Units ......................................................................... 14
1.3.1 Administrative Subdivision .......................................................................................... 16
Map 2: Administrative Units XXX ................................................. Error! Bookmark not defined.
1.4 Political Units................................................................................................................. 17
Table 2: County Electoral Wards by Constituency ................................................................. 17
1.5 Demographic Features ................................................................................................... 18
1.5.1 Population size and composition ................................................................................. 18
Table 4: Population Projections for Special Groups 2018-2022 ............................................. 18
1.5.3 Population Density and Distribution ............................................................................ 20
Table 5: County Population Density by Constituency 2009-2022 ........................................... 20

Laikipia County Integrated Development Plan 2018-2022 Page iv
1.5.4 Urban Population ........................................................................................................ 20
Table 6: Population Projections by Urban Centres ................................................................ 21
Table 8: Demographic Dividend Potential ............................................................................ 22
1.6 Human Development Indicators ..................................................................................... 22
1.6.1 Human Development Index (HDI) ................................................................................ 22
1.6.2 Youth Development Index (YDI) .................................................................................. 22
1.6.3 Gender Development Index (GDI) and Gender Empowerment Measure (GEM) ............ 22
1.6.4 Human Poverty Index (HPI) ......................................................................................... 23
1.7 Infrastructure and Access ............................................................................................... 23
1.7.1 Road and Transport Network ...................................................................................... 23
1.7.2 Information Communication Technology ..................................................................... 23
1.7.3 Energy Access ............................................................................................................. 23
1.7.4 Housing Types ............................................................................................................. 23
1.8 Land and Land Use ......................................................................................................... 25
1.8.1 Land Ownership Categories/Classification ................................................................... 25
1.8.2 Mean Holding Size ...................................................................................................... 25
1.8.3 Percentage of Land with Title Deeds ............................................................................ 25
1.8.4 Incidence of Landlessness ..................................................................................... 26
1.8.5 Settlement Patterns .................................................................................................... 26
1.8.6 Type and Size of Land .................................................................................................. 26
1.9 Employment and Other Sources of Income ..................................................................... 27
1.9.1 Wage Earners ........................................................................................................ 27
1.9.2 Self employed ........................................................................................................ 27
1.9.3 Labour force by Sector ........................................................................................... 27
1.9.4 Unemployment levels ............................................................................................ 27
1.10 Irrigation Infrastructure and Schemes .......................................................................... 27
1.11 Crop, Livestock Production and Value Addition ............................................................ 27
1.11.1Main Crops Produced ................................................................................................. 27

Laikipia County Integrated Development Plan 2018-2022 Page v
1.11.2 Acreage under Food Crops and Cash Crops ................................................................ 27
1.11.3 Average Farm Sizes ................................................................................................... 28
1.11.4 Main Storage Facilities .............................................................................................. 28
1.11.5 Agricultural Extension Services .................................................................................. 28
1.11.6 Main Livestock Breeds and Facilities .......................................................................... 29
1.11.7 Ranching ................................................................................................................... 29
1.11.8 Apiculture ................................................................................................................. 29
1.12. Oil and Other Mineral ................................................................................................. 29
1.12.2 Ongoing Mining and Extraction Activities .................................................................. 29
1.13. Tourism and Wildlife ................................................................................................... 30
1.13.1 Main Tourist Attractions and Activities ...................................................................... 30
1.13.2 Classified/Major Hotels ............................................................................................. 30
1.13.3 Main Wildlife ............................................................................................................ 30
1.13.4 Wildlife Conservation Areas ...................................................................................... 30
1.14 Industry and Trade ....................................................................................................... 30
1.16 Forestry, Agro Forestry and Value Addition .................................................................. 31
1.16.1 Main Forest Types and Sizes ...................................................................................... 31
1.16.2 Main Forest Products ......................................................................................... 31
1.16.3 Agro-Forestry ......................................................................................................... 31
1.17 Financial Services ......................................................................................................... 32
1.19 Water and Sanitation ................................................................................................... 33
1.19.1 Water Resources ....................................................................................................... 33
1.19.2 Water Supply Schemes ....................................................................................... 33
1.19.4 Sanitation ............................................................................................................. 34
1.20 Health Access and Nutrition ......................................................................................... 34
1.20.1 Health Access ..................................................................................................... 34
1.20.2 Morbidity ............................................................................................................. 34
1.20.3 Nutritional Status ....................................................... Error! Bookmark not defined.

Laikipia County Integrated Development Plan 2018-2022 Page vi
1.20.4 Immunization Coverage ............................................................................................ 35
1.20.5 Maternal Health Care ......................................................................................... 35
1.20.6 Access to Family Planning Services ...................................................................... 35
1.21.1 Pre-school Education .......................................................................................... 35
1.21.2 Primary School Education ...................................................................................... 36
1.21.3 Non Formal Education............................................................................................ 36
1.21.4 Youth Polytechnics ........................................................ Error! Bookmark not defined.
1.21.4 Secondary Education .......................................................................................... 36
1.23 Community Organizations/ Non State Actors ............................................................... 37
1.23.1Co-operative Societies ............................................................................................... 37
1.23.2 Public Benefits Organizations .................................................................................... 37
1.23.3 Development Partners .............................................................................................. 37
1.24 Security, Law and Order ............................................................................................... 38
1.24.1 Number of Police Stations and Posts ......................................................................... 38
1.24.2 Types, Trends and Crime Prone Areas ........................................................................ 38
1.24.3 Types and Number of Courts ..................................................................................... 38
1.24.4 Prisons and Probation Services .................................................................................. 38
1.24.5 Number of Public Prosecution Offices ........................................................................ 38
1.24.6 Number of Prosecution over the Years ...................................................................... 38
1.24.6 Community Policing Activities ................................................................................... 38
1.25 Social Protection .......................................................................................................... 38
1.25.1 Number of Orphans and Vulnerable Children ............................................................ 38
1.25.2 Cases of Street Children ............................................................................................ 38
1.25.2 Child Care Institutions ............................................................................................... 38
1.25.2 Social Net Programmes ............................................................................................. 39
CHAPTER TWO..................................................................................................................... 40
LINKAGES WITH VISION 2030 AND OTHER NATIONAL PLANS................................................ 40
2.0 Overview ....................................................................................................................... 41
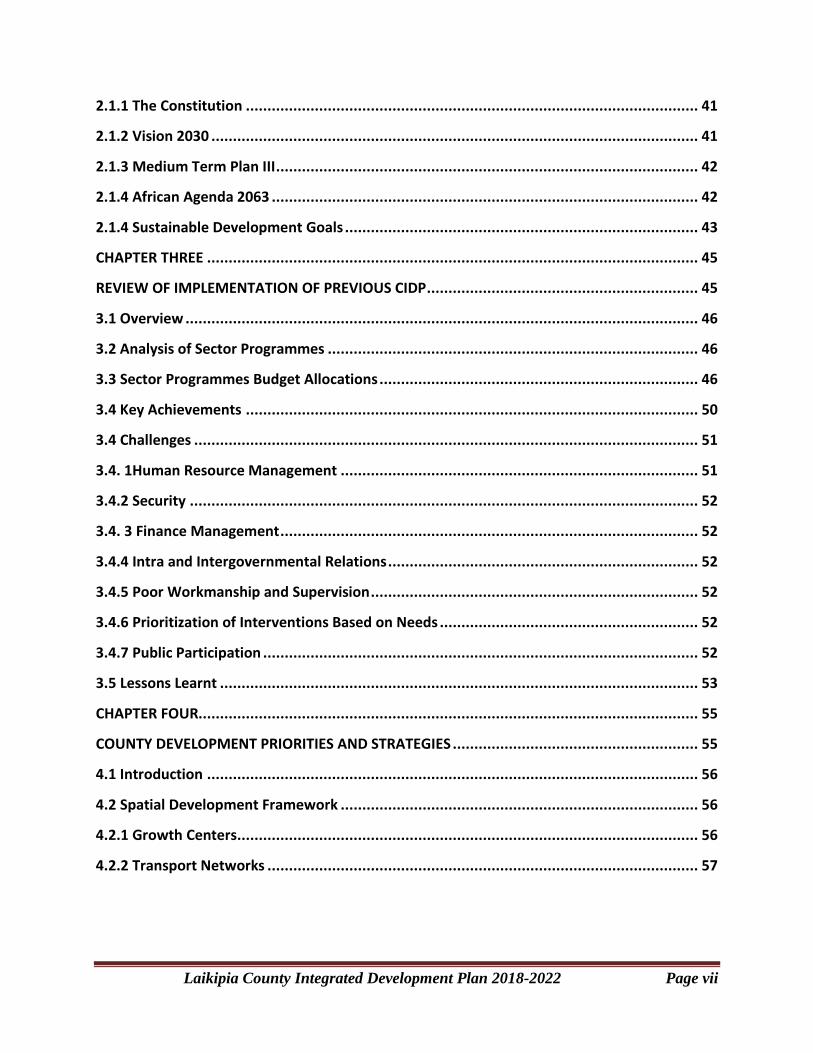
Laikipia County Integrated Development Plan 2018-2022 Page vii
2.1.1 The Constitution ......................................................................................................... 41
2.1.2 Vision 2030 ................................................................................................................. 41
2.1.3 Medium Term Plan III .................................................................................................. 42
2.1.4 African Agenda 2063 ................................................................................................... 42
2.1.4 Sustainable Development Goals .................................................................................. 43
CHAPTER THREE .................................................................................................................. 45
REVIEW OF IMPLEMENTATION OF PREVIOUS CIDP ............................................................... 45
3.1 Overview ....................................................................................................................... 46
3.2 Analysis of Sector Programmes ...................................................................................... 46
3.3 Sector Programmes Budget Allocations .......................................................................... 46
3.4 Key Achievements ......................................................................................................... 50
3.4 Challenges ..................................................................................................................... 51
3.4. 1Human Resource Management ................................................................................... 51
3.4.2 Security ...................................................................................................................... 52
3.4. 3 Finance Management ................................................................................................. 52
3.4.4 Intra and Intergovernmental Relations ........................................................................ 52
3.4.5 Poor Workmanship and Supervision ............................................................................ 52
3.4.6 Prioritization of Interventions Based on Needs ............................................................ 52
3.4.7 Public Participation ..................................................................................................... 52
3.5 Lessons Learnt ............................................................................................................... 53
CHAPTER FOUR.................................................................................................................... 55
COUNTY DEVELOPMENT PRIORITIES AND STRATEGIES ......................................................... 55
4.1 Introduction .................................................................................................................. 56
4.2 Spatial Development Framework ................................................................................... 56
4.2.1 Growth Centers ........................................................................................................... 56
4.2.2 Transport Networks .................................................................................................... 57

Laikipia County Integrated Development Plan 2018-2022 Page viii

Laikipia County Integrated Development Plan 2018-2022 Page ix
FOREWORD
Hon. Ndiritu Muriithi,
H. E. The Governor,
County Government of Laikipia

Laikipia County Integrated Development Plan 2018-2022 Page x
ACKNOWLEDGEMENTS
Mr. Boniface Murungi Ndai,
County Executive Member, Finance, Planning and County Development.
County Government of Laikipia

Laikipia County Integrated Development Plan 2018-2022 Page xi
ABBREVIATIONS AND ACRONYMS

Laikipia County Integrated Development Plan 2018-2022 Page xii
EXECUTIVE SUMMARY
CHAPTER ONE
COUNTY GENERAL INFORMATION
`

Laikipia County Integrated Development Plan 2018-2022 Page 13
1.0 County Overview
Laikipia County is one of the 47 counties in the Republic of Kenya in the Central Rift Valley
region. It is listed as county number 31. The County Headquarter is Rumuruti Town but it is
temporarily hosted in Nanyuki since inception of devolution in 2013. Laikipia is a cosmopolitan
County and largely rural in settlement. There are over 23 main communities settled in the county
including Maasai, Samburu, Rendille, Somali, Pokots, Tugens, Asians, European, Meru, Kikuyu,
and Turkana among others. “Laikipia” is a Maasai word equivalent to trees plain reflecting the
large highland plateau. The main economic activities are crop farming, livestock rearing,
tourism, retail and wholesale trade. The County is a member of two proposed regional economic
blocs namely Mt. Kenya and Aberdares. Laikipia has strong relationships with Amaya Triangle
and Frontier Counties Development Council.
1.1 Position and Size
Laikipia borders Samburu County to the North, Isiolo County to the North East, Meru County to
the East, Nyeri County to the South East, Nyandarua County to the South, Nakuru County to the
South West and Baringo County to the West. The County lies between latitudes 0o 18” South
and 0 o 51” North and between longitude 36o 11” and 37o 24’ East. It covers an area of 9,462 km2
and ranks as the15th largest county in the country by land size. Map 1 shows the geographical
position of Laikipia County in Kenya.
Map 1: Geographical Position of Laikipia County in Kenya
Source: Economic Planning Department, Laikipia County Government, 2017
1.2 Physiographic and Natural Conditions
1.2.1 Physical and Topographic Features
The altitude of Laikipia County varies between 1,500 m above sea level at Ewaso Nyiro basin in
the North to a maximum of 2,611 m above sea level around Marmanet forest. The other areas of

Laikipia County Integrated Development Plan 2018-2022 Page 14
high altitude include Mukogodo and Ol Daiga Forests in the eastern part of the county at 2,200 m
above sea level. The County consists mainly of a plateau bordered by the Great Rift Valley to the
West, the Aberdares mountain ridge to the South and Mt. Kenya to the South East.
The main drainage feature is Ewaso Nyiro North basin with its tributaries having their sources in
the slopes of the Aberdares and Mt. Kenya. These tributaries include Nanyuki, Timau, Rongai,
Burguret, Segera, Naromoru, Engare, Moyok, Ewaso Narok, Pesi and Ngobit rivers. The flow of
these rivers matches the County’s topography, which slopes gently from the highlands in the
South to the lowlands in the North. The rivers determine to a large extent livelihood patterns in
the county. In addition, there are two major swamps in the county namely; Marura Swamp which
runs along the Moyot valley in Ol-Pajeta Ranch and the Ewaso Narok Swamp around Rumuruti
town.
The South-western part of the county has the highest potential for forestry and mixed farming
due to its favourable climatic conditions. The eastern and northern parts of the county are
suitable for grazing while the plateau lying in the central and the northern parts of the county is
suitable for ranching. The swamps have some agricultural potential if properly protected and
managed. However, they are currently under pressure due to encroachment for human settlement
and agricultural production.
1.2.2 Ecological Conditions
The county is endowed with pastureland, rangeland, forests, wildlife, undulating landscapes and
rivers among others. The high and medium potential land constitutes 20.5 per cent of the total
county’s land area making it suitable for crop farming. The remaining 79.5 per cent is low
potential and suitable for livestock and wildlife. The major soils in the county are mainly loam,
sand and clay. Black cotton soil which has inherent fertility spreads in most parts of the plateau.
The dark reddish brown to red friable soils and rocky soils are mainly found on the hillsides.
The county has gazetted forest area totalling to 580 Km2 comprising of both the indigenous and
plantation forests. The indigenous forests include Mukogodo and Rumuruti while plantation
forests include Marmanet and Shamaneik. Laikipia County is richly endowed with wildlife
widely distributed in most parts of the county extending to Aberdare, Samburu, Meru and Mt.
Kenya wildlife corridors. Most of the wildlife is found in the large scale private ranches, which
occupy over 50 per cent of the total area of the county. The rest is found in-group ranches
predominantly owned by the Maasai, in the gazetted forests of Mukogodo, Rumuruti and
Marmanet and other uninhabited tracts of land in the county.
1.2.3 Climatic Conditions
The county experiences a relief type of rainfall due to its altitude and location. The annual
average rainfall varies between 400mm and 750mm though higher annual rainfall totals are
observed on the areas bordering the slopes of Mt. Kenya and the Aberdare Ranges. North
Marmanet receives over 900mm of rainfall annually; while the drier parts of Mukogodo and
Rumuruti receive slightly over 400mm annually. The Laikipia plateau receives about 500mm of

Laikipia County Integrated Development Plan 2018-2022 Page 15
rain annually, while Mukogodo Forest receives an average rainfall of about 706mm annually.
Table 1 shows that the rainfall drastically reduced in 2009 and 2011 in Dol Dol. It further shows
that the northern parts of the county represented by Dol Dol receive lower rainfall compared to
the southern parts such as Nyahururu.
Table 1: Mean Annual Rainfall in Millimetres (mm) 2013-2017
Station 2013 2014 2015 2016 2017
Dol dol(Loll Daiga Stn) 376.9 457.8 358.4 311.8 571.3
Rumuruti 1,159.5 554.4 713.4 848.6 97.2
Nyahururu 1,560.5 810.2 690.0 931.5 1,316.5
Nanyuki(Laikipia airbase) 804.6 623.7 623.0 642.7 614.3
Lamuria 857.5 727.9 690.0 732.5 590.0
Source: Kenya Meteorological Department, Laikipia county office, 2018.
The long rains occur from March to May while the short rains are in October and November with
slight variations of two to three weeks in some seasons. The parts neighbouring Aberdare Ranges
and Mt. Kenya form an exception to this pattern as they receive conventional rainfall between
June and August because of the influence of the trade winds. The annual mean temperature of
the county ranges between 16o C and 26o C. This is as a result of relief and trade winds resulting
to cooler conditions in eastern side which is near Mt. Kenya and hotter in the low-lying areas in
the North. The western and southern parts of the county have cooler temperatures with the
coolest month being April and the hottest month being February. The average duration of
sunshine is between ten and twelve hours daily. The average wind velocity is in a general East to
West direction.

Laikipia County Integrated Development Plan 2018-2022 Page 16
1.3 Administrative Units and Political Units
1.3.1 Administrative Subdivision
Laikipia County comprises of five administrative sub counties namely Laikipia East, Laikipia
North, Nyahururu, Laikipia Central and Laikipia West. The sub county headquarters are at
Nanyuki, Doldol, Rumuruti, Lamuria and Nyahururu respectively. The county is further sub-
divided into 16 divisions, 55 locations and 110 sub-locations.
Table 2: National Government Administrative units
Sub-County Divisions Locations Sub-Locations
Laikipia East Central Nanyuki Majengo, Thingithu
Segera Ngarengiro, Segera,
Nturukuma Likii, Nturukuma
Impala Rugutu
Daiga Umande Umande, Kalalu, Nyariginu
Ethi Ngenia, Chumvi, Ethi
Muramati Naibor, Mukima, Kimugandura
Laikipia Central Lamuria Sirima Karugu, Muhonia, Mutaro
Lamuria Lamuria, Mwiremia
Mathingira Mathingira, Tetu, Baraka
Bahati Rehema, Bahati, Furaha
Sweetwaters Marura Marura
Tigithi Tigithi Matanya
Munyaka Wiyumiririe Wiyumirire
Ngobit Kariguini, Ruai
Mwituria Withare, Wamura
Nyambogishi Suguroi, Shalom, Nyambogishi
Laikipia North Mukogodo Mukogondo Mukogondo
Makurian Makuria, Arjijo
Mumonyot Seek, Mumonyot
Ilpolei Ilpolei
Sieku Sieku
Ilngwesi Sangaa , Ngarendare
Kirimon Ilmotiok Ilmotiok, Impala
Kimanjo Tula
Orbosoit Kirimon , Ewaso
Nyahururu Nyahururu Nyahururu Ndunyu, Manguo
Igwamiti Losongwa, Shemanei
Maina Maina, Ndururumo
Mutitu Ngoru, Uaso Narok
Mahianyu Mahianyu, Kiandege
Marmanet Marmanet Oljabet, Bondeni
Salama Pesi, Salama, Muruku
Gatero Munanda, Kaiti
Siron Siron, Kwa Wanjiku
Gituamba Gituamba Kiambogo, Karandi
Muthengera Kundarila, Muthengera
Kiambogo Thingio, Siria
Ngarua Kinamba Ndndika, Kinamba
Mithiga Mithiga, Njorua
Matwiku Mwenje, Mutitu
Laikipia West Rumuruti Sosian Sosian, Maundu ni Meri
Rumuruti Rumuruti Township, Mutamaiyu
Ndurumo Ndurumo, Kagaa
Thome Thome, Mathira
Lorieni Lorieni

Laikipia County Integrated Development Plan 2018-2022 Page 17
Mutara Mutara, Kiamariga
Muhotetu Melwa Murichu, Melwa
Karaba Karaba, Kabage
Muhotetu Muhotetu, Chunguti
Sipili Wangwachi Kabati, Kiriko
Sipili Dimcom, Kaharati
Ol-moran Ol-moran Olmoran, Kahuho
Lonyiek Lonyiek, Magadi, Kariwo
Kirima Ndonyoloip, Githima
Source: Laikipia County Commissioner office, 2018
1.4 Political Units
The county has three constituencies namely; Laikipia East, Laikipia West and Laikipia North.
There are 15 electoral wards, 5 in Laikipia East, 6 in Laikipia West and 4 in Laikipia North
constituencies. Map 3 shows the political units.
Table 3: County Electoral Wards by Constituency
Name of
Constituency
Number of Wards Name of Wards
Laikipia North 4 Mukogodo East, Mukogodo West, Segera, Sosian
Laikipia East 5 Ngobit, Tigithi, Thingithu, Nanyuki, Umande
Laikipia West 6 Olmoran, Rumuruti Township, Githiga, Marmanet, Igwamiti,
Salama
Source: Independent Electoral and Boundaries Commission, (IEBC) 2017
The County administrative structures are aligned to the 3 constituencies and 15 Wards.
Map 3: Laikipia County Political Units
Source: Laikipia wildlife forum 2017

Laikipia County Integrated Development Plan 2018-2022 Page 18
1.5 Demographic Features
1.5.1 Population size and composition
According to the 2009 KNBS Housing and Population Census, the total population for the
county stood at 399,227 people of which 198,625 were males and 200,602 were females. This
population is projected to be 491, 927 persons in 2018. It is also expected to rise to 515,290 and
539,763 in 2020 and 2022 respectively as shown in Table 4.
Table 4: Population Projection by Age Cohorts Age
Cohorts
2009 Census 2018 Projections 2020Projections 2022 Projections
Male Female Total Male Female Total Male Female Total Male Female Total
0-4 29,599 28,945 58,544 36,472 35,666 72,138 38,204 37,360 75,564 40,018 39,134 79,153
5—9 29,068 28,220 57,288 35,818 34,773 70,590 37,519 36,424 73,943 39,301 38,154 77,455
10—14 26,606 25,696 52,302 32,784 31,663 64,446 34,341 33,166 67,507 35,972 34,742 70,713
15-19 20,576 19,321 39,897 25,354 23,807 49,161 26,558 24,938 51,496 27,819 26,122 53,942
20-24 16,590 18,415 35,005 20,442 22,691 43,133 21,413 23,769 45,182 22,430 24,897 47,327
25-29 15,269 16,985 32,254 18,814 20,929 39,743 19,708 21,923 41,631 20,644 22,964 43,608
30-34 13,158 13,406 26,564 16,213 16,519 32,732 16,983 17,303 34,287 17,790 18,125 35,915
35-39 11,013 11,375 22,388 13,570 14,016 27,586 14,215 14,682 28,897 14,890 15,379 30,269
40-44 8,697 8,797 17,494 10,716 10,840 21,556 11,225 11,354 22,580 11,759 11,894 23,652
45-49 7,637 7,776 15,413 9,410 9,582 18,992 9,857 10,037 19,894 10,325 10,513 20,839
50-54 5,113 5,304 10,417 6,300 6,536 12,836 6,599 6,846 13,445 6,913 7,171 14,084
55-59 4,002 4,172 8,174 4,931 5,141 10,072 5,165 5,385 10,550 5,411 5,641 11,051
60-64 3,679 3,696 7,375 4,533 4,554 9,087 4,749 4,771 9,519 4,974 4,997 9,971
65-69 2,503 2,662 5,165 3,084 3,280 6,364 3,231 3,436 6,667 3,384 3,599 6,983
70-74 1,985 1,985 3,970 2,446 2,446 4,892 2,562 2,562 5,124 2,684 2,684 5,368
75-79 1,196 1,226 2,422 1,474 1,511 2,984 1,544 1,582 3,126 1,617 1,658 3,275
80+ 1,934 2,621 4,555 2,383 3,230 5,613 2,496 3,383 5,879 2,615 3,544 6,158
198,625 200,602 399,227 296,462 299,413 491,927 256,369 258,921 515,290 268,545 271,218 539,763
Source: County Statistics Office, Laikipia, 2018
The ratio of men to women stands at almost one to one with need for efforts towards gender
parity in provision of socioeconomic opportunities. The possible explanation for lower male
population across the age cohorts across the age of 19yrs are factors related to lower life
expectancy amongst males.
1.5.2 Population Projection for Special Age Groups
Information on population of selected age groups is vital in any development process. This
section discusses the population structure and projections of selected groups namely the Under 1
year, the Under 5 years, primary school going (6-13), secondary school going (14-17), youth
population (15-29), female of reproductive age (15-49), labour force (15-64) and the aged (65+)
as they are key points of reference in policy formulation.
Table 5: Population Projections for Special Groups 2018-2022 Age Groups 2009 Census 2018(Projections) 2020(Projections) 2022(Projections)
Male Female Total Male Female Total Male Female Total Male Female Total
Under 1 6,177 5,989 12,166 7,611 7,380 14,991 7,973 7,730 15,703 8,351 8,097 16,449
Under 5 29,599 28,945 58,544 36,472 35,666 72,138 38,204 37,360 75,564 40,018 39,134 79,153
Primary school age
(6-13) 44,727 43,296 88,023 55,113 53,349 108,462 57,730 55,883 113,613 60,472 58,537 119,009
Secondary school 14-17
17,781
16,788
34,569 21,910 20,686 42,596 22,950 21,669 44,619 24,040 22,698 46,738
Youth population )
(15-29)
52,435
54,721
107,156 64,610 67,427 132,037 67,679 70,629 138,308 70,893 73,984 144,877
Reproductive age (15-49) 0
96,075
96,075 0 118,383 118,383 0 124,006 124,006 0 129,895 129,895
Labour force
(15-64)
105,734
109,247
214,981 130,285 134,614 264,899 136,473 141,007 277,480 142,955 147,704 290,659
Aged 65+ 7,618 8,494 16,112 9,387 10,466 19,853 9,833 10,963 20,796 10,300 11,484 21,784
Source: Kenya National Bureau of Statistics –Laikipia Statistics Office, 2018

Laikipia County Integrated Development Plan 2018-2022 Page 19
Under 1 year:
The County had 12,166 persons (comprising of 6,177 males and 5,989 females) children less
than 1 year as at 2009 representing 3% of the total population. The numbers are projected to
increase to; 14,991, 15,703 and 16,449 by 2018, 2020 and 2022 respectively. This population
increase calls for increased investments in maternal and child care health services.
Under 5 years:
The County had 58,544 persons (comprising of 29,599 males and 28,945 females) children under
5 years as at 2009 representing 15% of the total population. The numbers are projected to
increase to; 72,138, 75,564 and 79,153 by 2018, 2020 and 2022 respectively. This population
increase calls for increased investments in child care health services, child care centres and pre-
primary education centres.
Primary School Age (6-13): The County had 88,023 persons (comprising of 44,727 males and
43,296 females) of primary school going age as at 2009 representing 22% of the total population.
However, enrolment in the same year recorded 93%. The numbers are projected to increase to
108,462; 113,613 and 119,009 by 2018, 2020 and 2022 respectively. Expansion of learning
infrastructure will be crucial for successful management of the steady increase in both the
number of school going age children and the enrolment particularly under the guiding policy of
Universal Primary Education.
Secondary School Age (14-17): The County had 34,569 persons (comprising of 17,781 males
and 16,788 females) of secondary school going age in 2009 representing 9% of the total
population. Enrolment rate in the same year was recorded at 34%. This population is projected to
increase to 42,596; 44,619 and 46,738 in 2018, 2020 and 2022 respectively. Expansion of
learning infrastructure will be crucial for successful management of the steady increase in both
the number of secondary school going age persons and the enrolment particularly under the
guiding policy of and Subsidized Day Secondary Education.
Youth Population (15-29)-The total number in this age category was 107,156 persons
(comprising of 52,435 males and 54,721 females) representing 27 percent of the county
population. This population is projected to increase to 132,037; 138,308 and 144,877 in 2018,
2020 and 2022 respectively. This calls for investment in programmes focussed on wealth
creation, entrepreneurial training, sports and arts and tertiary education.
Female Reproductive Age (15-49): This is the child-bearing age group which stood at 96,075
representing 24 per cent of the entire county population in 2009. The population is projected to
increase to 118,383;124,006;and 129,895 in 2018, 2020 and 2022 respectively. This population
group is important in projecting the county’s population growth and planning for reproductive
health services.
Labour Force (15-64): The total number in this age category was 214,981 persons (comprising
of 105,734 males and 109,247 females) representing 53.8 percent of the county population. The

Laikipia County Integrated Development Plan 2018-2022 Page 20
county labour force recorded 41,450 households being active economically in 2009. This
population is projected to increase to 264,899, 277,480 and 290,659 in 2018, 2020 and 2022
respectively. This calls for programmes that will create employment and other income generating
opportunities for this ever increasing population to reduce levels of unemployment and its
associated adverse effects in the county.
Aged Population (65+): The total number in this age category was 16,112 persons (comprising
of 7,618 males and 8,494 females) representing 4 percent of the county population. This
population is projected to increase to 19,853; 20,796 and 21,784 in 2018, 2020 and 2022
respectively. This calls for programmes that will provide safety nets among the elderly in
housing, health and food security.
1.5.3 Population Density and Distribution
The settlement patterns in the county are uneven as they are influenced by varying land potential,
livelihood zones, infrastructure access, land use system and availability of social amenities.
Laikipia North constituency is arid and semi-arid in nature and therefore the least populated
arising from wild life ranches and pastoral livelihood patterns. Laikipia West and Laikipia East
have the highest population densities attributed to medium towns namely Nyahururu and
Nanyuki. These towns are the commercial, administrative and transportation hubs of the county.
Table 5 provides a summary of the projected population density by constituency to the year
2022.
Table 6: County Population Density by Constituency 2009-2022 Constituency 2009 2018 Projections 2020 Projections 2022 Projections
Area (Km2) Population Density
(Persons/Km)
Population Density
(Persons/ Km2)
Population Density
(Persons/Km2)
Population Density
(Persons /Km2)
Laikipia East 1,448.20 118,222 82 145,673 101 152,591 105 159,839 110
Laikipia West 2,579.50 208,725 81 257,191 100 269,405 104 282,200 109
Laikipia North 5,434.30 72,280 13 89,063 16 93,293 17 97,724 18
Total 9,462 399,227 42 491,927 52 515,290 54 539,763 57
Source: County Statistics Office, Laikipia, 2018
The average population density in 2009 stood at 42 persons per square kilometre. This is
projected to increase to 52 persons per Km2 in 2018. The same is projected to be 54 persons per
Km2 and 56 persons per Km2 in the year 2020 and 2022 respectively as a result of in-migration
and natural population growth. Laikipia West constituency enjoys the largest size of the
population comprising of 52.3 per cent of the total population. Laikipia East and Laikipia West
constituencies are the most densely populated of the three constituencies with population
densities of 82 and 81 persons per Km2 in 2009 and projected 110 and 109 persons per Km2 in
2022 respectively. Laikipia North is sparsely populated with a density of 13 persons per Km2 in
2009 and projected at 18 persons per Km2 in 2022.
1.5.4 Urban Population
There are four major urban centres in the county namely: Nanyuki, Nyahururu, Rumuruti and
Kinamba. The growth and expansion of Nyahururu and Nanyuki is attributed to their long time
role as the administrative headquarters for the former Laikipia and Nyandarua districts. They are
also major transport hubs for main routes namely: Nairobi-Isiolo-Marsabit, Nairobi-Meru,

Laikipia County Integrated Development Plan 2018-2022 Page 21
Nairobi-Mararal and Nakuru-Nyeri. They have the most vibrant commercial activities and formal
employment opportunities hence high population density. The population within the four towns
is expected to grow from 135,979 in 2009 to 167,252; 175,511; 183,846 persons in 2018, 2020
and 2022 respectively. Other centres in the county that continue expanding include Sipili, Ol-
jabet (Marmanet), Wiyumiririe, Lamuria, Dol Dol, Ol-Moran and Matanya.
Table 7: Population Projections by Urban Centres
Urban Centres 2009 Census 2018(Projections) 2020(Projections) 2022(Projections)
Male Female Total Male Female Total Male Female Total Male Female Total
Nyahururu 25,183 26,251 51,434 30,975 32,346 63,321 32,504 33,883 66,387 34,048 35,492 69,540
Nanyuki 25,046 24,187 49,233 30,806 29,803 60,609 32,327 31,219 63,546 33,863 32,701 66,564
Rumuruti 15,956 17,037 32,993 19,626 20,993 40,619 20,595 21,990 42,585 21,573 23,034 44,607
Kinamba 1,142 1,177 2,319 1,405 1,450 2,855 1,474 1,519 2,993 1,544 1,591 3,135
Total 67,327 68,652 135,979 82,811 84,441 167,252 86,900 88,610 175,511 91,027 92,819 183,846
Source: Laikipia Statistics Office, 2018
Nyahururu town had the highest population of 51,434 followed by Nanyuki, Rumuruti and
Kinamba with population of 49,233; 32,993 and 2,319 respectively in 2009. This was expected
to grow to 63,321 persons in Nyahururu while that of Nanyuki, Rumuruti and Kinamba was
projected at 60,609; 40,619 and 2,855 persons respectively by 2018. In 2020, the projections
were estimated at 66,387; 63,546; 42,585 and 2,993 persons for Nyahururu, Nanyuki, Rumuruti
and Kinamba respectively. The population is projected at 69,540 persons for Nyahururu while
that of Nanyuki, Rumuruti and Kinamba is estimated at 66,564; 44,607 and 3,135 respectively by
2022.
1.5.5 Population of Persons with Disabilities The numbers of persons with various types of disabilities were 2,947 in 2017. This is
summarized in table 8.
Table 8: People Living with Disabilities by Type, Sex and Age 2017
Type of Disability Laikipia West Laikipia East Laikipia North Total
Type M F Total M F Total M F Total
Down Syndrome 2 9 1 12
Hydrocephalus 2 1 1 4
Albinism 11 7 1 19
Deaf 89 18 21 128
Epilepsy 72 24 10 106
Blind 18 14 4 36
Speech 6 12 8 26
Visual 57 31 79 167
Hearing 85 27 18 130
Physical 749 352 368 1,469
Autism 4 8 1 13
Cerebral Palsy 84 47 14 145
Mental 359 207 126 692
Total 1,538 757 652 2,947
Source: National Council of Persons living with Disability, Laikipia County Office
1.5.6 Demographic Dividend

Laikipia County Integrated Development Plan 2018-2022 Page 22
The demographic divided refers to the accelerated economic development that a country can
attain by slowing down the pace of population growth while at the same time making strategic
investments in the health ,education ,economic and governance sectors.
Table 9: Demographic Dividend Potential
Category 2009* 2014 2017 2022 2030
Population Size 399,227 470,965 773,938
Population below 15 (%) 42.115 40.0567 33.9439
Population 15-64 (%) 53.849 56.2205 61.8752
Population above 65 (%) 3.977 3.7228 4.1808
1.6 Human Development Indicators
These indicators measure human development based on the basic factors of a long and healthy
life, the acquisition of knowledge and a reasonable standard of living. These factors are
measured by considering factors such as education and literacy, healthy living and access to
social amenities, the position and condition of women and the gross domestic product.
1.6.1 Human Development Index (HDI)
The HDI measures human development based on the basic factors of a long and healthy life, the
acquisition of knowledge, and a reasonable standard of living. These factors are measured using
the following indicators: Life expectancy at birth; Adult literacy rate and the combined
enrolment ratio at primary, secondary and tertiary levels; GDP per capita measured in Purchasing
Power Parity (PPP) in US dollars. The county has an overall Human Development Index of
0.574 compared to the national level of 0.520 as of 2015.
1.6.2 Youth Development Index (YDI)
The YDI is a composite measure of youth development. The index is a tool developed to raise
visibility of youth issues by monitoring the changes that occur in the youth over time. The Youth
Development Index at the county is 0.5952 which is above the national index which is 0.5817.
1.6.3 Gender Development Index (GDI) and Gender Empowerment Measure (GEM)
The GDI is a measure of human development that adjusts the HDI for disparities between men
and women. It is therefore not a measure of gender inequality. It is basic measure of how gender
inequalities in knowledge acquisition, longevity and health, and standard of living affect human
development.
The GEM measures gender equity in political and economic power by assessing the level of
female representation. It considers gender gaps in political representation, professional and
management positions and earned incomes. It captures gender inequality in political
participation, as measured by the percentage of seats held by women in national parliaments;
economic participation and decision-making power measured by the percentage of women
among legislators, senior officials, and managers in professional and technical fields; and power
of economic resources, measured by the estimated earned income of women and men.Statitics
from National Human Development Reports 2015.

Laikipia County Integrated Development Plan 2018-2022 Page 23
1.6.4 Human Poverty Index (HPI)
The HPI is a measure of poverty that was introduced in the UN's 1997 Global Human
Development Report. The aim was to create a composite index that brings together the different
areas of deprivation that affect the quality of life. The HPI is premised on the understanding that
if human development is about enlarging choices, then poverty means the denial of the most
basic opportunities and choices. The index incorporates four facets of human characteristics; life
longevity, knowledge acquisition, economic status and social inclusion. This index measures
deprivation in the three areas of human development; a long and healthy life, knowledge and a
decent standard of living. The county HPI stands at 57.3 which is high compared to the national
HPI of 29.1.
1.7 Infrastructure and Access
1.7.1 Road and Transport Network
The total classified road network in the county is 1,038.1 Km out of which over 80 per cent are
feeder roads. The bitumen, gravel, and earth surface stand at 207.3, 328.9 and 501.9 kilometres,
respectively. The major transport routes serving the county are Nairobi-Isiolo-Marsabit (A102),
Gilgil-Rumuruti (C55), Rumuruti-Mararal (A2) and Nakuru-Nyeri (B65). There exists an old
railway network in covering 23 kilometres serving Nanyuki Town and a small stretch of about 2
Kilometres in Nyahururu Town. The county is served by 1 airstrip near Nanyuki Town. There
are several landing grounds across the county majority of which are within main private ranches.
1.7.2 Information Communication Technology
The county is served by four main post offices located at Dol Dol, Rumuruti, Nanyuki and
Nyahururu and one substation at Kinamba. The percentage of households owning mobile as of
projections in 2014 was 69.9 per cent. Households with access to internet based on 2009
population and housing census was 4.8 per cent. The length of the National Fibre Optic Back
bone infrastructure in the county is estimated at 80 km serving Nanyuki, Nyahururu and
Rumuruti Towns. The courier services are mainly provided by G4S, EMS, Securicor, Wells
Fargo and PSVs. Based on the 2009 population and housing census, radio ownership is estimated
at over 78.7 per cent whereas television sets ownership is estimated at 31.7 per cent of total
households. There is one Huduma Center based at Nanyuki.
1.7.3 Energy Access
The national power grid serves 156 trading centres and is yet to reach 24 centres. The households
using electricity for lighting constitute 17.7 per cent of the total households. The Last Mile
Connectivity Programme has helped upscale access for the rural households. The county has
several learning institutions, health facilities and boreholes supported by solar energy .Being a
semi-arid county, reliable sunshine throughout the year provides high potential for harnessing of
solar energy. There are also opportunities of upscaling biogas and wind energy.
1.7.4 Housing Types
It is estimated that 66.5 per cent of the households own the homes they live in. Most of the
population is sheltered in semi-permanent structures that consist of timber walls, earthen floors

Laikipia County Integrated Development Plan 2018-2022 Page 24
and corrugated iron-sheets roofs. Over 80 per cent of the shelters have corrugated iron sheets for
roofs. Similarly, the largest percentage of walling material is wood recording 46 per cent of total
households. Majority of the households have earthen floors as represented by the 65.7 per cent of
the total households.

Laikipia County Integrated Development Plan 2018-2022 Page 25
1.8 Land and Land Use
1.8.1 Land Ownership Categories/Classification
The three main types of land categories in Laikipia are private, community and public as
depicted in Map 4.
Map 4: Laikipia County Land Tenure
Source: Laikipia Wildlife Forum
1.8.2 Mean Holding Size
The average private farm size for small-scale holders is 2 acres while for large-scale holders is
20 acres. Laikipia is dominantly a pastureland with 48 ranches that are greater than 2000 acres in
size. The ranches occupy over 50per cent of the total land area in the county. There are 30
ranches owned by companies and individuals and 13 owned by the community as group ranches.
The group ranches are mainly in the northern part occupying about 67,720.2 hectares. Average
land holding in the community/group ranches per household is 10.06 hectares. The private
ranches practice wildlife conservancy and beef cattle rearing. The average size of the ranches is
4,046.9 hectares.
1.8.3 Percentage of Land with Title Deeds
The percentage of landowners with title deeds is 65.3. This low percentage is partially attributed
to the absentee landlords, long land adjudication, and transfer processes.

Laikipia County Integrated Development Plan 2018-2022 Page 26
1.8.4 Incidence of Landlessness
Laikipia has witnessed the emergence of squatters and new settlement schemes such as Solio and
Wiyumiririe. The squatters’ problem hinders the realization of improved lives for all. There are
about 4,712 squatters in the county with 1,021; 1,090; 400 and 2,201 squatters distributed in
Kwa Mbuzi, Kahurura, Kandutura and Ontulili villages respectively.
1.8.5 Settlement Patterns
Laikipia is predominantly rural with urban areas constituting 243.3 square kilometres. There are
pockets of semi-formal settlements such African Location, Likii, Majengo, Manguo and Maina.
1.8.6 Type and Size of Land
Of the total land mass, arable land constitutes of 1,984 square kilometres. Non-arable land
constitutes of 7,456 square kilometres. Water mass is at 22 square kilometres and urban areas at
243.3 square kilometres. There are 7 distinct land use patterns heavily influenced by the climatic
conditions and the ecological zones. These include among others; pastoralism, mixed farming,
irrigated cultivation, rivers, forest, ranching, ranching and wildlife, wildlife only, timber,
charcoal and informal grazing and urban as depicted in Map 5.
Map 5: Laikipia County Land Use Map
Source: Laikipia Wildlife Forum

Laikipia County Integrated Development Plan 2018-2022 Page 27
1.9 Employment and Other Sources of Income
1.9.1 Wage Earners
Based on 2009 national population census, there was 24.4 per cent of the labour force employed
in the formal sector whereas 42.8 per cent was employed in the informal sector.
1.9.2 Self employed
Most of the labour force under this category runs micro and small enterprises in both the formal
and informal sector. However, the majority in this category are engaged in the small scale
agricultural as pastoralists and crop farmers at 32 percent.
1.9.3 Labour force by Sector
1.9.4 Unemployment levels
The percentage of economic inactive labour force was 22.70 whereas the unemployed inactive
labour force was 10.80. The youth forms the bulk of the unemployed labour force. This is
attributed to low industrial base, inadequate technical skills and poor motivation towards self-
employment.
1.10 Irrigation Infrastructure and Schemes
1.10.1 Irrigation Potential
The county is dependent on rain fed agriculture. However, there is potential of 203,965 hectares
for irrigation in the medium potential areas. The actual acreage of agricultural land is 1,984 Km2.
(representing 21% of total land mass)
1.10.2 Irrigation Schemes/Clusters
There are 20 small irrigation clusters mainly in the southern and western parts of the County at
Jikaze, Mutaro, Gatitu Muthaiga and Mutara, South Imenti, Thome, Mwiyogo, Nkando,
Nturukuma, Nyambogichi, Mukima, Marura, Gakeu, Mia Moja, Melwa, Pesi, Ngarengiro,
Ngarachi/Thigio and Wangwaci.
1.11 Crop, Livestock Production and Value Addition
1.11.1Main Crops Produced
The main crops grown include maize, beans, wheat, potatoes and vegetables. Maize takes about
51 per cent of the total planted area. Crop farming is mainly undertaken in the southwestern parts
of the county due to favourable weather conditions. Upscaling efforts are in place to promote
other crops such as millet, sorghum, sunflower and black beans (dolichos). There is an emerging
trend of increased horticulture and floriculture production both at large-scale and small-scale
levels. This constitutes production of cut flowers, tomatoes, French beans, chillies and
watermelons. There are efforts of up scaling fruit production such as avocado, orange, mango,
bananas, pineapples and coffee. There are four small millings plants in Nanyuki and Nyahururu
supporting value chain on maize and wheat.
1.11.2 Acreage under Food Crops and Cash Crops
The agriculture sector employs up to 60 per cent of the labour force in the county, holds
significant value, and in this regard should get more funding. Expansion of acreage is
constrained by high cost of farm inputs such as fertilizer, certified seed, weeding labour and

Laikipia County Integrated Development Plan 2018-2022 Page 28
demand for mechanization. There are county and national programmes that are aimed at reducing
the burden on farmers through provision of fertilizer, certified seed and occasionally pesticides
for the control of Armyworms , Quelea birds ,Locust and MLND.
The agricultural potential in the county is prospective as characterized by high potential farming
lands particularly in the southwestern parts of the county. Over 20 per cent of the county’s total
land is arable. The total area under crops is about 1,984 Km2 of which 80 per cent is under food
crops. Total hectares under crops in 2017 were 79,285.
1.11.3 Average Farm Sizes
Majority of the farming households are small-scale holders whose average farmland size is two
acres mainly for food production. The farm size for large-scale holder on average is 20 acres
mainly for wheat and maize production.
1.11.4 Main Storage Facilities
Granaries are a common storage facility at household levels. The government through the
National Cereals and Produce Board run stores at Doldol, Nyahururu and Nanyuki. At
institutional levels, food stores are common particularly in schools on the school feeding
programmes. At the household level, especially in the rural areas about 20% of harvested cereals
are lost through pests.
1.11.5 Agricultural Extension Services
Extension System
Agricultural extension services are mainly under the public extension system where over 90% of
extension services are offered by the county government and its agencies. A number of NGOs
are also involved in extension service delivery in thematic areas of interest. Cooperative
extension service model is exercised by a few farmer cooperatives especially in the dairy sector.
Agro-chemical companies, horticultural marketing companies, flower buying companies, agro-
stockists and private veterinary practitioners also offer private extension services.
Extension approaches
Value chain development approach has been employed by most of the service providers with
variants to its basic concept. Commodity based approach, contract farming, farming systems
approach, shifting focal area approach, enterprise development approach and farmers’ field
school approaches are some of the preferred extension delivery vehicles.
Extension methods
Several methods are used including mass methods (radio, road shows, posters, field days, shows,
trade fairs and newspaper adverts). Group methods (stakeholder forums, focus group discussions,
farmers’ tours, CIGs, on farm trials and demonstrations, produce marketing organizations and
group visits) are used. Individual methods (office visits, farm visits, telephone calls, letters,
emails and social media use) are commonly employed.
There are two Agricultural Mechanization stations in Nyahururu and Narumoru administered
from Nyandarua and Nyeri Counties respectively. There is need for establishment of an
Agriculture Training Centre (ATC) in the county.

Laikipia County Integrated Development Plan 2018-2022 Page 29
1.11.6 Main Livestock Types and Facilities
Livestock production is dominant in most parts of the county with the percentage of households
owning livestock at 45.8. The main livestock types are cattle, goats, sheep, poultry, camels,
donkeys, pigs and rabbits. The estimated livestock population is 55,000 dairy cattle, 211,200
beef cattle 344,200 sheep, 322,000 goats 372,000 poultry, 750 pigs, 9800 camels, 207,000
rabbits and 3867 beehives(457Log hives, 788 Top bar hives, 2622 Langtroth hives the average
production per year is9630kgs translating to Ksh5,778,000).
Livestock infrastructure comprises 50 holding grounds, stock routes, out spans, two public and
two private slaughterhouses, 7 auction yards and 35 slaughter slabs. Milk processing is done at
Nyahururu KCC and Countryside processing plant. There are seven milk-cooling plants run by
dairy co-operative and individual groups.
1.11.7 Ranching
Ranches in the County produce high quality beef stock, embryo transfer for Boran breed
nationally and regionally. There are 32 private ranches, one government ranch and 9 group
ranches. The ranchers and the neighbourhood cluster-grazing committees have a functional
model allowing vulnerable households to graze in the ranch during drought on agreed monthly
fees.
1.11.8 Apiculture
Bee keeping is done as part of the enterprise by pastoralists and farmers practicing mixed
farming. This is practised in farm woodlots, perimeter fences and in forests. Most of the honey is
produced using traditional log hives and only a few farmers use the modern hives like Langstroth
and Kenya Top Bar Hive (KTBH). In harvesting, most use traditional gears (fire for smoking)
which are destructive to the bees occasionally killing the queen. Towards value addition, there
are 5 co-operative societies that are at basic levels of packaging honey and related by-products.
1.11.9: Aquaculture (Fish farming) and Blue Economy
Fish farming is practiced mainly in Laikipia West and Laikipia East sub-counties. The
predominant species is tilapia with a small aspect of clarias (catfish) culture. Production
infrastructure comprises of approximately 900 fish pods with an average of 1,000 fish stock
capacity. There are 125 water reservoirs viable for capture aquaculture. Rumuruti fish farm is a
prospective aquaculture training, demonstration and fish seed bulking facility.
1.12. Oil and Other Mineral
1.12.2 Ongoing Mining and Extraction Activities
The common extractive activity in the county consists of red sand harvesting along riverbeds in
Laikipia North. Excavation of gravel and murram for road construction is also common.
Crushing of ballast is also an important activity within the county. There lays great potential of
ballast and sand harvesting for construction industry and use of concrete blocks. There exists one
under-utilized crushing plant at Nanyuki. There is need to explore on other potential minerals in
the county.

Laikipia County Integrated Development Plan 2018-2022 Page 30
1.13. Tourism and Wildlife
1.13.1 Main Tourist Attractions and Activities
Major tourist attractions are wildlife, landscapes, unique local cultural practices, and the
Thomson Falls. The proximity to Mt. Kenya, Meru, Aberdares and Samburu game parks have
greatly boosted tourism within the county through provision of hospitality services to the
tourists. The annual sports events also contribute to tourism in Laikipia.
1.13.2 Classified/Major Hotels
There are 90 registered hotels and lodges with a total bed capacity of 1,800. Of these only are 7
are classified in the range of 1-5 stars.
1.13.3 Main Wildlife
Laikipia County has the greatest number of wildlife outside the gazetted protected areas in the
country. The predominant species include: elephants, giraffes, burchelles zebras, rhinoceros,
Thompson gazelles, impalas, buffaloes, lions, elands and grevy zebras and other smaller species
also in abundance particularly the African wild dog and gazelles.
1.13.4 Wildlife Conservation Areas
Wildlife is mainly found in the private conservancies, private ranches, group ranches of Laikipia
North, main forests and pockets of small-scale holdings. In-group ranches, eco-tourism is a
dominant activity through conservation of natural habitats for wildlife under the umbrella
organization named Naibunga. There are indigenous forests including Mukogodo and Rumuruti
while plantation forests include Marmanet and Shamaneik, which also serve as wildlife
conservation areas. Though this is an important natural resource, it has been a source of conflict
between the farming and pastoralist communities.
1.13.5 Tourists Arrivals
In 2017, domestic visits in high-end facilities in conservancies, Thompson Falls and main hotels
were 50,000 whereas foreign visits were 36,000.
1.14 Industry and Trade
1.14.1 Markets
The main commodity markets in the county are in Nanyuki and Nyahururu whereas main
livestock markets are at Rumuruti, Doldol and Kimanjo. Other market centers include Olmoran,
Sipili, Wiyumiririe, Lamuria and Debatas.
1.14.2 Industrial Parks
Industrial zones are established with Nanyuki and Nyahururu towns. Rumuruti town has also
planned industrial zone with no activities. There are seven jua kali associations with 344 artisans
who are involved in welding, fabrication, carpentry among other activities.

Laikipia County Integrated Development Plan 2018-2022 Page 31
1.14.3 Major Industries
Industrial processing is minimal with milk plants and grain milling being the major firms.
Storage and distribution of petroleum products is also undertaken at a low scale. Alcoholic
drinks processing is also an activity in Nanyuki.
1.14.4 Types and Numbers of Businesses
The major type businesses are wholesale and retail enterprises totalling to 119 and 96
respectively mainly in trading centers across the County.
1.14.5 Micro, Small and Medium Enterprises
Laikipia County has estimated 13,600-licensed MSMEs and 52,400 unlicensed MSMEs totaling
to 66,000. These are in agriculture and forestry, whole sale trade, retail trade, repair of motor
vehicles, repair of motor cycles, accommodation and food services, construction, information
and communication, arts and music, professional and technical services.
1.15 Blue Economy and Fisheries
Fishing activities are carried out in ponds, rivers and water reservoirs. The main activities are in
900 ponds, 125 water reservoirs and one fingerling multiplication farm. The main species
produced are Catfish and Tilapia.
1.16 Forestry, Agro Forestry and Value Addition
1.16.1 Main Forest Types and Sizes
There are six gazetted and one non-gazetted forest in Laikipia covering a total area of 580 square
kilometres. Mukogodo is the main natural forest within the county. Artificial forests include
Lariak, Marmanet, Ng’arua, Rumuruti and Shamaneik with sections of natural vegetation.
1.16.2 Main Forest Products
The main forest products are timber, poles, wood fuel, pastures and natural herbs. Forests have
also contributed significantly in supporting bee keeping, research on flora and fauna and eco-
tourism.
1.16.3 Agro-Forestry
Farm woodlots are a common feature in the southern parts of the county. The farmers use the
woodlots for timber, poles, fuel and bee keeping. Farmers also practice fruit trees farming in
main fruits are citrus (oranges and lemons), avocadoes, mangoes, coffee and nuts (macadamia).
1.16.4 Value Chain Development of Forestry Products
The main value chain processes include furniture, wood carvings, honey packaging and herbal
medicines. Other value chain includes; cosmetics products from aloe vera and sandalwood,
several bamboo products and processing of cattle feeds.

Laikipia County Integrated Development Plan 2018-2022 Page 32
1.17 Financial Services
1.17.1 Number of Institutions
Laikipia is served by 16 banks, 2 microfinance institutions and 15 insurance companies operating
within Nanyuki and Nyahururu townships. There are 117 SACCOs with 3 FOSAs in Laikipia
and 3 main mobile money service providers. Agricultural Finance Corporation runs two branches
in Nanyuki and Nyahururu. The county established two funds namely Laikipia enterprise fund
and Laikipia cooperative revolving fund that issued loans to 83 groups and 35 cooperative
societies.
1.17.2 Distribution of Financial Services
Laikipia East is served by 16 banks whereas Laikipia West is served by 10 banks. Most of the
mainstream banks have established agency banking within the major urban centres. The major
mobile phone companies are offering mobile banking services up to the village level within the
county.
1.18 Environment and Climate Change
1.18.1 Major Degraded Areas
Land degradation is severe in Makurian in Mukogodo East as well as Kimugandura in Segera.
This is mainly caused by overstocking, charcoal production, water surface run-off and sand
harvesting.
Map 6 Laikipia County Land Cover
Source: CETRAD

Laikipia County Integrated Development Plan 2018-2022 Page 33
1.18.2: Environmental Threats
Ewaso Narok swamp is a riparian area under intense threat following encroachment by farmers
over the last three decades. Rumuruti, Lariak and Marmanet forests have also faced pressure on
extraction of forestry products from nearby communities leading to loss of biodiversity and
wildlife habitats. Droughts, floods and invasive species are also threats associated with
degradation of environment and climate change effects. In addition, farming in water catchment
areas, sand harvesting and other quarrying activities have exacerbated the process of land
degradation.
1.18.3: High Spatial and Variability of Rainfall
Laikipia North Constituency faces the highest spatial and variability of rainfall with an average
of 415.24mm in the last five years. In Laikipia west constituency, Nyahururu is wetter compared
to Rumuruti with an average rainfall of 1061.74 mm and 674.62 mm respectively. Laikipia East
constituency faces an average rainfall of 661.66 mm in the last five years.
1.18.4: Solid Waste Management Facilities
The mass of waste generated in Nanyuki and Nyahururu per person per day lies between 250g-
1000g with an average of 0.45 kg/person/day and its density varies from 100kg/cubic metres to
600kg/cubic meters. Nanyuki, Nyahururu and Rumuruti towns have established solid waste
management system with designated dumpsites, refuse collection trucks and staff. On waste
disposal 11,321 and 3,052 of the households and commercial entities respectively in the county,
have their waste collected by the county government, about 59 per cent use waste pits whereas
only about 15 per cent use crude damping. Only about 0.01 percent of the households use private
waste collectors.
1.19 Water and Sanitation
1.19.1 Water Resources
Laikipia is drained by the Ewaso Ng’iro River and its tributaries, which originate from Mt.
Kenya and the Aberdares. The main tributaries are Ewaso Narok (Ngare Naro), Narumoru, Likii,
Sirimon, Ontulili, Ngare ndare, Melwa, Ngare Nything, Ngobit, Rongai, Timau, Moyak, Pesi,
Suguroi, Mutara, Nanyuki, and Burguret rivers. Boreholes, pans, dams, shallow wells, springs
and sub surface dams are also a common feature in the county for domestic and irrigation
purposes. Rock catchment in the northern parts of Laikipia is increasingly being exploited.
1.19.2 Water Supply Schemes
There are 507 small water clusters that provide services in market centres, institutions and
settlement schemes.
1.19.3 Water Sources and Access
The distribution of water sources is uneven across the county with the northern parts
experiencing serious water shortages. There are 14 per cent of households accessing water from
within their dwelling while 10 per cent of the households take an average of 1-4 minutes to reach
the nearest water point mainly the population that lives in the urban centers. Similarly, 25.3 per

Laikipia County Integrated Development Plan 2018-2022 Page 34
cent of households take an average of 5-14 minutes and 44.7 per cent of the households take an
average of 15-29 minutes. The remaining 6 per cent of the households take over an hour to reach
the nearest water point. Water demand in the county is projected to be 27,981m3/day by the year
2030.
1.19.4 Water Management
The urban centres have established Water Services and Sanitation/Sewerage Companies in
Nanyuki and Nyahururu. There are 29 WRUAs that run water resources across the county in
collaboration with Water Resource Authority (WRA). CETRAD is the main research institution
hosted in the county on environment, water and natural resources. Ewaso Nyiro North
Development Authority serves Laikipia amongst other 9 counties in northern Kenya region.
Water Resource Authority has a regional county office as well in Laikipia East and Laikipia
West sub regions.
1.19.5 Sanitation
There are 79,295 households with latrines in the county. The distribution of main toilet facility
reflects that 11.8 per cent use flash toilets, 60.2 per cent use pit latrines, and 16.4 per cent use
uncovered latrines or buckets whereas 11.3 per cent use other methods of disposal such as
natural bushes. Nanyuki and Nyahururu towns have established sewer and treatment services.
Human waste disposal –pit latrines 72.8% , Laikipia East Subcounty 97%,Laikipia west
Subcounty 84.9% and Laikipia North Subcounty 41.9%.hand washing four critical times 1.9%,
those washing with soap 49.7%
1.20 Health Access and Nutrition
1.20.1 Health Access
The health infrastructure consists of five sub county hospitals at Kimanjo, Ndindika, Lamuria,
Doldol, Rumuruti and two County referral hospitals; Nanyuki and Nyahururu. The county has
six public health centres and four FBO managed health centres. There are 64 public dispensaries,
12 FBO managed dispensaries, 10 NGO managed dispensaries and 36 private run clinics. In
addition, there are four private hospitals, one nursing home; one private health centre, six private
dispensaries and 35 private clinics. The County government has 425 nurses, 71 public health
officers, 76 clinical officers, 13 nutritionists 111 Doctors and 51 laboratory technologists. The
doctor-population ratio stands at 1:4432 while the nurse-population ratio is 1:1157
1.20.2 Morbidity
The five most prevalent diseases for under 5s in the county include; respiratory tract infections
(RTI), diarrhoea, clinical malaria, eye infections and pneumonia. The leading diseases for the
population of over 5s include; respiratory tract infections (RTI), diseases of the skin, rheumatism
and joint pains, diarrhoea and hypertension. The HIV prevalence rate stands at 3.2 per cent.
1.20.3 Nutritional Status
The total population of the children under five years old was estimated at 86,009 in 2017.
Nutrition remains a challenge especially Laikipia North Sub County and some pockets of

Laikipia County Integrated Development Plan 2018-2022 Page 35
Laikipia West. The estimated prevalence of children underweight is 20.1% out of which 5.3%
being severely underweight. The prevalence of stunted growth is 25.1 out of 5.9 are classified
as severely stunted whereas prevalence of wasted was 4.4 percent. According to the Nutritional
Survey (Laikipia Smart Survey 2017) conducted in the county by the Department Health in July
2017, Global Acute Malnutrition (GAM) rate was 11.4 per cent while the Severe Acute
Malnutrition (SAM) rate was 2.2 per cent and Moderate Acute Malnutrition (MAM) was 9.2%.
The overall prevalence of GAM denotes serious malnutrition that is below the emergency
threshold according to the WHO benchmarks. The Middle Upper Arm Circumference (MUAC)
findings showed that 2.7 per cent of the under-fives were at the risk of malnutrition. The causes
of malnutrition are poor dietary diversity, Suboptimal infant and young child feeding practices,
poor hygiene and sanitation and low access to essential nutrition services.
1.20.4 Immunization Coverage
The total population of under-five’s was estimated at 70,253 in 2017. Immunization rate for this
population stood at 66.4 per cent on average. Laikipia East stands at 78.5 per cent, Laikipia
North 48.4 per cent and Laikipia West 67.9 per cent. Vaccination against BCG and measles
coverage stands at 76.9 per cent and 64.3 per cent respectively. Vitamin A supplementation for 6
to 11 months stands at 66.1 per cent, 12 to 59 months at 16.9 per cent and an average of 50.9 per
cent. (Smart Survey July 2017)
1.20.5 Maternal Health Care
Maternal mortality rates in 2017 were estimated at 124.3 per 100,000 live births. The percentage
of expectant mothers delivering in health facilities was 49.5 per cent. The percentage of
expectant mothers visiting health facilities at least twice is estimated at 93.7 per cent while those
attending post-natal care recorded 80 per cent. 39.9 per cent first visit; revisit 32.3 per cent.
Pregnant women supplemented with iron Folic Acid between 90-180 days stands at 30.2 per
cent.
1.20.6 Access to Family Planning Services
The contraceptives acceptance uptake is 50.5% and fertility rates stand at 3.2 children
respectively. Despite the high acceptance rate, just over one third of the married women use
modern methods of family planning. The most popular methods are the use of pills, injectables,
implants and sterilization.
1.20.7 HIV and AIDS Prevalence Rates
The HIV prevalence rate stands at 3.2 per cent. The adherence rate on uptake ARTs is estimated
at 98%. Elimination of mother to child transmission in Laikipia stood at 99%.
1.21. Education, Skills, Literacy and Infrastructure
1.21.1 Pre-school Education
In 2017, the county had 428 public ECD centres and 148 private run ECD centres with a total
enrolment of 23,172 and 6,613 pupils respectively. The number of trained teachers was 760 in
public ECD centres and 265 in private ECDE Centres with a teacher pupil ratio of 1:30 in public

Laikipia County Integrated Development Plan 2018-2022 Page 36
and 1:24 in Private ECDE centres. The gross enrolment rate stands at 80 per cent while the net
enrolment rate is 79 per cent with a completion rate of 95 per cent.
1.21.2 Primary School Education
There are 286 public and 87 private primary schools with a total enrolment of 74,965 and 16,813
pupils respectively in 2017. The number of primary school teachers is 1,562 giving a teacher
pupil ratio of 1:52. The net enrolment rate is 93.4 per cent. Primary education is readily
accessible as reflected by the fact that 90 per cent of the population is located between 0 and 4.9
kilometres from the nearest primary school with only 10 per cent located over five kilometres
mainly in Laikipia North.
1.21.3 Non Formal Education
Organized learning for children in Laikipia is mainly through madrassa in urban centres…
1.21.4 Vocational Training Centers
There were 10 public vocational training centers in 2017 with trainee enrolment of 617 and 59
instructors. There are also 3 private vocational training centers run by faith based organizations.
1.21.5 Secondary Education
In 2017, there were 83 public secondary schools with a total enrolment of 23,118 students. There
were 16 private secondary schools with a total enrolment of 1,593. The number of teachers in
public schools was 881 giving a teacher student ratio of 1:26. The net enrolment rate was 61.5
per cent.
1.21.6 Tertiary Education
The county has limited facilities for tertiary education. There is one University, one university
campus, one branch of management institute, one KMTC branch, and a host of middle private
level colleges. According to the 2009, KNBS Housing and Population Census only 3.4 per cent
of the county’s population had attained tertiary level education.
1.21.7 Adult and Continuing Education
There were 94 centres offering adult and continuing education at primary and secondary level in
2017. The enrolment was 4,193 students. The population of 25 years and above consists of 79.1
per cent persons who can read and write.
1.21.8 Technical, Training Institutes
There are three technical training institutes hosted by the three constituencies at initial levels of
operations and nil enrolment.
1.22 Sports, Culture and Creative Arts
1.22.1 Museums, Heritage and Cultural Sites
Yaaku is the main cultural site in Laikipia North whereas Twala is the main cultural campsite in
the county.

Laikipia County Integrated Development Plan 2018-2022 Page 37
1.22.2 Talent Academies
1.22.3 Sports Facilities
Nanyuki and Nyahururu are the main stadia in the county. Institutional and community play
fields also support sports events across the county. There is an athlete’s camp at Nyahururu KFS
station.
Nanyuki and Nyahururu are the main stadia in the county. There are four community Sports
grounds in Rumuruti, Solio, Matanya and Doldol. Institution play fields also support sports
events across the county. There is an athlete’s camp at Nyahururu KFS station.
1.22.4. Libraries/Information Documentation Centers/Citizen Service Centers
There are two public community libraries at Rumuruti and Nanyuki, one documentation
information centre and one Huduma Centre both located in Nanyuki.
1.22.5 Registered Herbalists
There are 11 licensed practioners on traditional herbal medicines.
1.23 Community Organizations/ Non State Actors
1.23.1Co-operative Societies
In 2017, there were a total of 270 registered co-operatives societies of which 156 were active and
114 were dormant. The total membership of both the dormant and the active societies was
51,704 comprising of 28,116 males and 23,588 females. The member’s contribution in all
societies was Kshs. 3,113,560,268, loan outstanding of Ksh 3,015,587,447 and total assets worth
3,730,115,591. The cooperatives mainly engage in urban SACCOs/FOSAs, transport, primary
produce marketing of milk, cereals and livestock as well as housing.
1.23.2 Public Benefits Organizations
There are 12 dominant non-governmental organizations that are operating in the county. These
are Mpala Health Trust, Caritas Nyeri, Uraia, SNV, Impact, St. Martin, NRT, Laikipia Forum,
Red Cross, AMREF, Groots Kenya, Kenya Water for Health Organization. Their main areas of
focus include promoting access to health, rangeland rehabilitation, civic education support,
capacity building, and infrastructural support in water, education and health among other
activities.
1.23.3 Development Partners
The main development partners in the county include World Bank in health and devolution
services; UNDP on capacity building; DANIDA on health services and value chain initiatives;
FAO on community lands governance and conservation agriculture; USAID on health policy and
governance; EU on cereal storage; Global Fund on health services.
1.23. 4 Youth Empowerment Centres
There is one non-equipped empowerment centre at Nyahururu.

Laikipia County Integrated Development Plan 2018-2022 Page 38
1.24 Security, Law and Order
1.24.1 Number of Police Stations and Posts
Policing and promotion of law and order in County is supported by 5 police divisions with a total
of 7 police stations, 67 police posts and 2 ASTU units. Most of these police stations are located
in high-density population areas such as Urban and Peri-Urban areas whereas the ASTUs are
located in areas prone to cattle theft.
1.24.2 Types, Trends and Crime Prone Areas
Common crimes are mainly on break-ins, stock theft, stealing, and offences against morality,
criminal damage and robbery. Offences against morality include defilement of children. Highest
numbers of cases are in urban and market centres. Stock theft routes are mainly along ranches
and forest corridors.
1.24.3 Types and Number of Courts
There are two high courts and 2 magistrate courts situated in Nyahururu and Nanyuki.
1.24.4 Prisons and Probation Services
There are three prisons in the county at Rumuruti, Nanyuki and Nyahururu with a capacity of
(250 in Nanyuki, 250 in Nyahururu and 250 in Rumuruti) persons. There are two probation
offices in the county providing probation and after care services to petty offenders.
1.24.5 Number of Public Prosecution Offices
There are two offices situated in Nyahururu and Nanyuki with a total staffing of 10 officers.
1.24.6 Number of Prosecution over the Years
In 2015, the numbers of prosecutions were #, increased in 2016 to #, and recorded a decline in
2017 at #.
1.24.7 Community Policing Activities
Community policing committees under the Nyumba Kumi initiative are 2,207 across the county.
There are 929 police reservists in the county.
1.25 Social Protection
1.25.1 Number of Orphans and Vulnerable Children
The number of households headed by children under 15 years was estimated at # in 2017. The
number of orphans was 1,600 in 2017. The number of registered children living with disabilities
was estimated at # in 2017.
1.25.2 Cases of Street Children
In 2017, street children in urban centres were estimated at #.
1.25.3 Child Care Institutions
Children care services are established in the four sub counties. There are five child rehabilitation
and rescue centres with one run by the county government, one managed by the Child Welfare
Society of Kenya and the rest by FBOs.

Laikipia County Integrated Development Plan 2018-2022 Page 39
1.25.4 Social Net Programmes
The main programmes on social safety are cash transfers to the elderly, persons living with
disabilities, orphans and vulnerable children. In 2017, elderly persons above 70 years were
estimated at 13,136. The number of registered adults living with disabilities was estimated at # in
2017.

Laikipia County Integrated Development Plan 2018-2022 Page 40
CHAPTER TWO
LINKAGES WITH VISION 2030 AND OTHER NATIONAL PLANS

Laikipia County Integrated Development Plan 2018-2022 Page 41
2.1 Overview-
The CIDP is guided by the Constitution of Kenya 2010. It is also linked to the Medium Term
Three 2018-2022 of the Kenya Vision 2030 under the theme “transforming Kenya; path way to
devolution and national unity”. It also seeks to meet the aspirations of Agenda 2063 with focus
on “Africa socio economic transformation”. The plan has also embedded the Sustainable
Development Goals under the clarion call on “a framework for intersectoral development”.
National strategies such as the Spatial Plan, Climate Change Action Plan and Sectoral Plans have
also been integrated.
2.1.1 The Constitution
The Constitution of Kenya 2010 created the counties governed by the county governments to
undertake prescribed functions in the fourth schedule. The functions include: crop and animal
husbandry; health services; control of air and noise pollution and outdoor advertising; cultural
activities; transport; animal control; trade development and regulation; planning and
development; pre-primary education; natural resources and environmental conservation; public
works and services; firefighting services and disaster management; control of drugs and
pornography; coordination of the participation of communities. The functions are supported by
key legislations such as: The County Government Act, 2012; The Urban Areas and Cities Act,
2015; Public Finance Management Act, 2012; The Inter-Governmental Relations Act, 2012;
National Government Coordination Act among others. These legislations capture the need for
planning at the county by guiding the process of integrated, spatial, sectoral plans, urban area
plans. The strategies and programmes in this plan are informed by the prescribed functions at the
two levels of government.
2.1.2 Vision 2030
The Kenya Vision 2030 is the country’s national policy that entrenches the long-term
development strategy. The vision was launched in June 2008 and was legislated as Sessional
Paper Number 10 of 2012. It aims at transforming Kenya into “a newly industrialized, middle-
income country providing a high quality of life and a secure environment to all its citizens by the
year 2030’’. The Vision has three pillars namely the economic, social and political pillars and
also the macro-economic foundations/enablers.
The economic pillar aims to achieve an annual economic growth rate of over 10% over the
period. The social pillar seeks to build a just and cohesive society with social equity in a clean
and secure environment. The political pillar aims to realize a democratic political system
founded on issue-based governance that respects the rule of law, protects the rights and freedoms
of every individual in Kenyan society.
The economic, social and political pillars of Kenya Vision 2030 are anchored on foundations of
macroeconomic stability, continuity in governance reforms, enhanced equity and wealth creation
opportunities for the poor, infrastructure, energy, science, technology and innovation (STI), land
reforms, human resources development, security as well as public sector reforms.

Laikipia County Integrated Development Plan 2018-2022 Page 42
The Second Laikipia County Integrated Development Plan (2018-2022) has been prepared to
capture sectoral priorities as outlined in the Vision 2030 pillars. The programmes and projects
proposed in the plan address key issues such as wealth creation, food security, access to health,
water, security, value addition in agriculture, tourism promotion, infrastructural development and
human capital development.
2.1.3 Medium Term Plan III
The Vision 2030 is being implemented in successive five-year Medium Term Plans. The first
MTP covered the period 2008-2012 while the second MTP is covered the period 2013-2017. The
third MTP covers the period 2018-2022. There are 25 key sectors prioritized in the period 2018-
2022 under the three pillars and three thematic areas detailed in Table 7.
Table 10: Medium Term Plan III Pillars, Enablers and Thematic areas
Economic Pillar Social Pillar Political Pillar Enablers Thematic Areas
Tourism
Agriculture and
Livestock
Trade
Business Process
Outsourcing &ITES
Financial Services
Oil and Other
Mineral Resources
Manufacturing
Blue Economy
Education and
Training
Health
Environment Water
and Sanitation
Population
Urbanization and
Housing
Gender, Youth and
Vulnerable Groups
Sports, Arts and
Culture
Devolution
Governance,
Judiciary and
Rule of law
Infrastructure
Information Communication
Technology
Science Technology and
Innovation
Land Reforms
Public Sector Reforms
Labour and Employment
National Values and Ethics
Ending Drought Emergencies
Security, Peace Building, and
Conflict Resolution
Macro Working
Group
HIV/AIDS TWG
Climate Change
The economic and social pillars will also focus on integrating the political pillar and enablers in
the realization of affordable housing, food security, employment creation and universal health
care. The CIDP has focus on 12 MTP sectors namely: health; education and training; ending
drought emergencies; sports, culture and arts; gender, youth and vulnerable persons; security and
peace building; trade, tourism and manufacturing; agriculture, livestock and fisheries; public
sector reforms national values; water, environment and natural resources; infrastructure; land
reforms;
Annual Development Plans will be formulated to realize the strategies and programmes of this
plan in line with Medium Term Expenditure Framework (MTEF) and therefore provide the link
between policy, planning and budgeting.
2.1.4 African Agenda 2063
The socio-economic transformation aspirations of African Union in 2013 focus on 7 priorities
namely;
i. A prosperous Africa based on inclusive growth and sustainable development
ii. An integrated continent politically united and based on the ideals of pan Africanism and
the vision of Africa Renaissance

Laikipia County Integrated Development Plan 2018-2022 Page 43
iii. An Africa of good governance, democracy, respect for human rights, justice and the rule
of law
iv. A peaceful and secure Africa
v. An Africa with a strong natural identity, common heritage, values and ethics
vi. An Africa where development is people driven unleashing the potential of its women and
youth
vii. Africa as a strong united and an influential global player and partner
The CIDP mirrors these aspirations across the sectors on strategies such as inclusive growth,
good governance, values and ethics and intergovernmental relations.
2.1.4 Sustainable Development Goals
Kenya is a signatory of the global agenda 2030 adopted in September 2015 by the United
Nations General Assembly. The agenda is a plan of action for people, planet and prosperity and
is made up of 17 goals designed to assist the international community free the human race from
hunger, poverty and oppression. The goals are:
Goal 1: End poverty in all its forms and everywhere
Goal 2: End hunger, achieve food security and improved nutrition and promote sustainable
agriculture
Goal 3: Ensure healthy lives and promote wellbeing for all ages
Goal 4: Ensure inclusive and equitable quality education and promote lifelong learning
opportunities for all
Goal 5: Achieve gender equality and empower all women and girls
Goal 6: Ensure availability and sustainable management of water and sanitation for all
Goal 7: Ensure access to affordable, reliable, sustainable and modern energy for all
Goal 8: Promote sustainable economic growth, full and productive employment and decent work
for all
Goal 9: Build resilient infrastructure, promote inclusive and sustainable industrialization and
foster innovation
Goal 10: Reduce inequality within and among countries
Goal 11: Make cities and human settlements inclusive, safe, resilient and sustainable
Goal 12: Ensure sustainable consumption and production patterns
Goal 13: Take urgent action to combat climate change and its impacts

Laikipia County Integrated Development Plan 2018-2022 Page 44
Goal 14: Conserve and sustainably use the oceans, seas and marine resources for sustainable
development
Goal 15: Protect, restore and promote sustainable use of terrestrial ecosystems, sustainably
manage forests, combat desertification and halt and reserve land degradation and halt biodersity
loss
Goal 16: Promote peaceful and inclusive societies for sustainable development, provide access
to justice for all and build effective, accountable and inclusive institutions at all levels
Goal 17: Strengthen the means of implementation and revitalize the global partnership for
sustainable development
The CIDP customizes the goals through adoption of localized targets and indicators at county
and national levels. This will supported by lead sectors spearheading realization of customized
targets as detailed in Table 11.
Table 11: County Lead Sector for the Implementation of Sustainable Development Goals
Sustainable Development Goal Lead County Sector(s)
End poverty in all its forms and everywhere Agriculture Livestock and Fisheries ,Gender
Youth and Vulnerable Groups
End hunger, achieve food security and improved nutrition and
promote sustainable agriculture
Agriculture Livestock , Fisheries and Health
Ensure healthy lives and promote wellbeing for all ages Health, HIV/AIDS TWG and Nutrition
Ensure inclusive and equitable quality education and promote
lifelong learning opportunities for all
Education and Training
Achieve gender equality and empower all women and girls Gender Youth and Vulnerable Groups
Ensure availability and sustainable management of water and
sanitation for all
Water, Irrigation , Environment ,Natural
Resources and Public health
Ensure access to affordable, reliable, sustainable and modern
energy for all
Population, Urbanization and Housing
,Infrastructure
Promote sustainable economic growth , full and productive
employment and decent work for all
Trade Tourism and Manufacturing
Build resilient infrastructure, promote inclusive and
sustainable industrialization and foster innovation
Infrastructure ,Trade Tourism and Manufacturing
Reduce inequality within and among countries Macro Working Group(Finance and planning)
Make cities and human settlements inclusive, safe, resilient
and sustainable
Lands, Population ,Urbanization ,Housing and
Public health
Ensure sustainable consumption and production patterns Agriculture Livestock and Fisheries, Trade
Tourism and Manufacturing, Water, Irrigation,
Environment and Natural Resources
Take urgent action to combat climate change and its impacts Water, Irrigation, Environment and Natural
Resources
Conserve and sustainably use the oceans, seas and marine
resources for sustainable development
Water, Irrigation, Environment and Natural
Resources
Protect, restore and promote sustainable use of terrestrial
ecosystems, sustainably manage forests, combat
desertification and halt and reserve land degradation and halt
biodersity loss
Lands,Water, Irrigation, Environment and
Natural Resources
Promote peaceful and inclusive societies for sustainable
development, provide access to justice for all and build
effective, accountable and inclusive institutions at all levels
Security, Peace Building and Conflict Resolution
Strengthen the means of implementation and revitalize the
global partnership for sustainable development
Macro Working Group(Finance and planning)

Laikipia County Integrated Development Plan 2018-2022 Page 45
CHAPTER THREE
REVIEW OF IMPLEMENTATION OF PREVIOUS CIDP

Laikipia County Integrated Development Plan 2018-2022 Page 46
3.1 Overview
The First Laikipia CIDP 2013-2017 was prepared in the period May-December 2013. The
implementation was linked to the county annual budget processes where programmes to be
funded were drawn from the CIDP programmes and projects. This was actualized through
Annual Development Plans as key budget output papers aimed at guiding the CIDP
implementation. The chapter covers analysis of sector programmes, budget allocations and
expenditures, key achievements, challenges and lessons learnt.
3.2 Analysis of Sector Programmes
There were 8 sectors of focus in the previous CIDP undertaking programmes as detailed in Table
12.
Table 12: Analysis of Sector Programmes
Sector Programmes Public Service and County Administration County Administration; Human Resource Management and
Development; Security and Policing Support Services; Public
Safety Enforcement and Disaster Management; County Executive
Committee Support Services; office of the Governor, General
Administrative and planning Services; Finance, Economic Planning and County
Development
Economic Planning Services; Financial Services; General
Administrative and planning Services;
Education, Gender, Culture, Sports, and ICT Vocational Training Development; ECDE Development;
Education Empowerment Programme; ICT Infrastructure
Development; Sports Development and promotion; Social
development and promotion ,Child care services; General
Administrative and planning Services;
Infrastructure, Lands, Housing, Roads and Public
Works
Physical Planning Services and Land Survey Services; Housing
Development; Public works service delivery improvement; Road
Network Improvement and Urban Development; General
Administrative and planning Services; Agriculture, Livestock and Fisheries Administration, Planning and Support Services; Crop
Development and Management; Fisheries Development and
Management; Livestock Resources Development and
Management; Health Curative and Preventive Health; Preventive and Promotive
Health; General Administrative and planning Services; Trade, Tourism and Enterprise Development Trade development and promotion; Tourism development and
promotion; Cooperative development; General Administrative
and planning Services; Water, Irrigation, Environment and Natural
Resources
Water supply management; Sanitation Enhancement services;
Human animal conflict mitigation -infrastructure program;
General Administrative and planning Services;
3.3 Sector Programmes Budget Allocations
The three key sources of county funding are equitable share from the National Government,
locally generated revenues and conditional grants. The three sources increased steadily over the
five years as shown in table 13. The programmes were funded in five financial years as detailed
table 14.

Laikipia County Integrated Development Plan 2018-2022 Page 47
Table 13: County Sources of Funding
Revenue
Source
FY 2012/13 FY 2013/14 FY 2014/15 FY 2015/16 FY 2016/17 FY 2017/18
(Actual) (Actual) (Actual) (Actual) (Actual) (Projected as
per CARA)
Equitable
share
129,910,803 2,523,013,037 3,009,697,543 3,449,548,893 3,722,107,269 4,499,800,000
Own source 0 333,370,063 483,498,889 454,500,922 456,448,684.10 500,000,000
Sub Totals 129,910,803 2,856,383,100 3,493,196,432 3,904,049,815 4,178,555,953 4,999,800,000
Conditional
grants
61,592,200 243,821,897 155,224,518 448,856,886 290,031,716 498,219,972
Grand
Totals
191,503,003 3,100,204,997 3,648,420,950 4,352,906,701 4,468,587,669 5,498,019,972
Table 14: County Programmes Budget allocations 2013/14 – 2017/18
Sector Programme Budget Allocation in KES ’000’
2013/14 2014/15 2015/16 2016/17 2017/18
Public Service
and County
Administration
Human Resource Management
and Development
1,867,380 1,867,380 1,956,889 2,192,000 2,490,192
Security and Policing Support
Services
12,780 12,780 50,461 44,717 41,400
Public Safety Enforcement
and Disaster Management
24,000 24,000 100,000 73,528 30,296
County Executive Committee
Support Services
45,000 45,000 107,000 128,800 44,212
General Administrative and
planning Services
23,426 23,426 18,875 90,000 94,169
County Administration 63,828 63,828 16,777 37,589 62,066
Subtotal 2,036,414 2,036,414 2,250,002 2,566,634 2,762,335
Finance,
Economic
Planning and
County
Development
Financial Services 34,000 51,724 104,820 92,605 218,000
Economic Planning Services 38,000 125,881 142,681 48,000 59,798
General Administrative and
planning Services
47,000 29,291 29,000 24,900 27,438
Subtotal 119,000 206,896 276,501 165,505 305,236
Education,
Gender, Culture,
Sports, and ICT
Education Empowerment
Programme
30,000 50,000 50,000 50,000 50,000
ECDE Development 15,000 25,283 15,000 23,700 31,000
Vocational Training
Development
5,000 15,750 5,000 6,300 8,500
ICT Infrastructure
Development
3,000 11,000 5000 5,000 4,000
Sports Development and
promotion
0 0 7,098 12,000 15,527
Social development and
promotion
0 0 12,500 12,000 8,631
Child care services 0 0 3,000 9,343 7500
General Administrative and
planning Services
4,000 11,000 27,000 16,700 25,000
Subtotal 57,000 105034.4 124,598 142,643 154,658
Infrastructure,
Lands, Housing,
Roads and
Public Works
Physical Planning Services
and Land Survey Services
Housing Development
Public works service delivery
improvement
Road Network Improvement

Laikipia County Integrated Development Plan 2018-2022 Page 48
Sector Programme Budget Allocation in KES ’000’
2013/14 2014/15 2015/16 2016/17 2017/18
and Urban Development
General Administrative and
planning Services
Sub total
Agriculture,
Livestock and
Fisheries
Administration, Planning and
Support Services
8,000 12,000 22,170 21,907 25,000
Crop Development and
Management
20,300 9,126 15,596 28,046 56,800
Fisheries Development and
Management
2,000 65,000 47,460 16,650 19,700
Livestock Resources
Development and
Management
1,000 7,500 3,000 5,300 6,240
Sub total 29,000 25,017 32,000 17,350 17,200
Health Curative and Preventive
Health
271,000 60,000 163,100 247,000 299,630
Preventive and Promotive
Health
37,000 78,633.3 - 10,181 12,319
General Administrative and
planning Services
5,000 42,079 43,000 18,600 22,506
Sub total 313,000 180,712 206,100 275,781 334,455
Trade, Tourism
and Enterprise
Development
Trade development and
promotion
42,000 33,814 61,200 61,000 101,314
Tourism development and
promotion
1, 500 4,500 7,500 8,000 6,373
Cooperative development 4,000 12,000 2,000 25,571 26,260
General Administrative and
planning Services
4,000 19,980 19,000 17,253 13,124
Sub total 51, 500 70,294 89,700 111,824 147,071
Water,
Irrigation,
Environment
and Natural
Resources
Water supply management 29,500 251,725 94,000 217,142 151,000
Sanitation Enhancement
services
0 10,200 15,000 9,000 11,000
Human animal conflict
mitigation -infrastructure
program
0 43,000 28,675 11,000
General Administrative and
planning Services
5,000 12,000 15,240 23,222 24,644
Sub total 34,500 273,925 167,240 278,039 197,644
Total
Funding by national government ministries, departments and agencies for various programmes
Table 14: County Funding by National Government Ministries/Entities 2013/14-2017/18 Ministry/Department/
Agency
Programmes Budget Allocation in KES ’000’
2013/14 2014/15 2015/16 2016/17 2017/18
Ministry of Interior and
Coordination of National
Government
National Administration -
Chiefs Motorbike Programme
(78 motorbikes )
Ministry of Public
Service, Youth & Gender
Affairs
Youth Enterprise
Development fund for three
constituency
National Government
Affirmative Action Fund
NYS Youth Empowerment
Projects

Laikipia County Integrated Development Plan 2018-2022 Page 49
Inua Jamii: National Safety
Net Programme (Cash
Transfers)
Uwezo Fund
Women Enterprise Fund
Ministry of transport and
infrastructure
Surface dressing of 49 Km
Nyahururu-maili kumi (B)
road
0 0 0 195,400 0
Ministry of Energy and
Petroleum
Public Street Lighting in
Nyahururu, Nanyuki
wiyumiririe and Rurumuti
0 0 0 213,800 0
Last Mile Connectivity to new
Households and Schools
Ministry of Education Free Primary Education
Capitation
Free Day Secondary School
Capitation
Revitalising Technical
Institute
School Meal Programme
National Schools Upgrade
Programme-Njonjo and
Nanyuki high schools
50,000
Digital Literacy Programme-
Teacher training and
Infrastructure readiness
Laikipia University- Tuition
Block, Library and
Administration Building,
Gate, Sewerage System,
Science Laboratories
Ministry of Devolution
and Planning
Constituency Development
Fund for three Constituencies
National Drought-
Management Authority
Animal health, Drought
mitigation
4,500 37,040
Huduma Centre
Ministry of Water and
Irrigation
Water Service Trust Fund
Water Supply Management
0 0 0 82,000 0
World bank -Water Supply
Management (Rumuruti water
Supply)
0 0 45,000 8,000 0
African development bank -
Water Supply Management
(Nyahururu water Project)
1,200,00
0
0 0 0 0
Northern Water Services
Board -Water Supply
Management (Supply of
plastic water Tanks each 3,000
Ltrs)
0 0 0 11,000 0
Ministry of Health World bank – RBF 20,000 60,000 20,900
Managed equipment services
for Nanyuki and Nyahururu
hospitals
0 0 0 810,000 0
Free Maternity Services
Programme
161,500

Laikipia County Integrated Development Plan 2018-2022 Page 50
Free Primary Health Care
Services Program
4,900
Immunisation programme
Leased Medical Equipment
Ambulances
Beyond Zero
DANIDA
JICA
Ministry of Agriculture,
Livestock and Fisheries-
ASDSP
Value chain development in
Maize, Dairy, Sheep and Goat
4,649.53 14,700.37 8,732.13 10,039.9 18,749.03
UNDP/FAO -Conservation
Agriculture
15,000 15,500 14,000
World Bank /GOK -Regional
Pastoral Livestock Resilience
Programme
EU-IDEAS -Laikipia Grain
Storage Project
WB/GOK KCSAP
See presidents delivery unit
3.4 Key Achievements
The major milestones in 2013-2017 by the national government ministries, departments and
agencies included; operationalization of Huduma Centre; pavement of 60 kilometers of road to
bitumen standards; electricity connectivity to 36,395 households; electricity connectivity to 249
schools; national grid reaching Dol Dol Town; urban street lighting in 4 towns; # schools with
digital contents; national fibre optic backbone infrastructure to Rumuruti Town; medical
equipment management in two county hospitals; security transport management; increase
mobility of chiefs; Rumuruti-Nanyuki power transmission lines; cash transfers to OVCs, elderly
and PwDs; social support on HIV and AIDS management; Uwezo, youth and women enterprise
funds; CDF in 3 constituencies; presidential bursary scheme; pupils capitation at primary and
secondary worth KES 325 Million and KES 956 Million respectively ;issuance of 50,677 title
deeds; construction of high courts in Nanyuki; integration of displaced persons; These are
detailed in Annex I.
The main achievements by county government department over the same period included;
drilling of 17 boreholes; extension of 170 Km of water pipeline; rehabilitation of 18 water pans;
enhanced rain water harvesting in 5,000 households/institutions; construction of 10 masonry
storage tanks, 73 Km of electric fence to mitigate Human Wildlife Conflict and expansion of
existing sewerage system in Nyahururu and greening the county through planting 350,000 trees,
5 group ranches with a management of 13 people per group ranch were trained by NEMA on
sustainable sand harvesting, grading, gravelling of #kilometers of roads; acquisition of road
equipment; construction of Ewaso Bridge; additional 200 health personnel; additional 23
dispensaries outpatient blocks; building and operationalization of renal unit, new laboratory
,pediatric ward and county health management offices at Nanyuki hospital, supply of essential
medical supplies;purchase of 4 ambulances and 4 utility vehicles, establishment of KMTC at
Nyahururu hospital, 5 milk cooling premises; rehabilitation of 4 slaughter houses; logistical
support on distribution 5,600 bags of fertilizers; subsidized boma rhode grass seeds estimated at
17.2 tonnes; vaccination of 238,000 heads of cattle; soil fertility testing of 1,500 samples;
construction of 32, 72 ECDE classrooms; construction of 18 and 6 classrooms in primary and
day secondary schools; bursary awards to 13,000 needy students annually; infrastructural

Laikipia County Integrated Development Plan 2018-2022 Page 51
development and equipping 8 VTCs; rehabilitation of Thompson Falls view deck; construction
of 17 market sheds; establishment of revolving enterprise and cooperative funds; acquisition of
fire engine for Nyahururu Town; rehabilitation and construction of 11 administrative police
posts; disaster response on 18 temporary classrooms at primary and secondary level; installation
16 high mast flood lights in market centers; operlization of Laikipia County Development
Authority, up scaling of indigenous poultry farming and fruit tree farming; steady improvement
on local levies collections. In cooperatives, active cooperatives societies increased by 83,
memberships by 27,106, member’s contribution by 2.1 billion, loan outstanding by 1.5 billion,
total assets by 2.3 billion and employee’s by 103 in the last five years.
The formulated # policy frameworks on water, strategic plan, disaster risk management, County
HIV and AIDS strategic plan ,Laikipia County Nutrition Action Plan ,County EMTCT Business
Plan
The number of approved bills as Acts of the County Assembly was # and # were at various levels
of reading whereas 5 were amended. The enacted Acts includes
Laikipia County Cooperatives Society Act 2014,
Laikipia County Enterprise Development Fund Act 2014
Laikipia Alcoholic Drinks Control Act, 2014
Laikipia County Public Participation Act
Laikipia County Disaster Risk Management Bill,
Laikipia County Alcoholic Drinks Control Amendments Act
Health Service Act
These results were realized through strategic partnership and support by national programmes
and development partners including; NDMA(drought risk management); CETRAD(research and
training); Regional Pastoral Livelihood Resilience Project( disease control); SNV(enterprise
development); UNDP(public participation); World Bank (health), DANIDA (health); EU (grain
storage); Northern Water Services Board(water infrastructure); Water Service Trust Fund(water
infrastructure); FAO (conservation agriculture); Caritas Nyeri (community empowerment);
ASDSP( value chain); KEFRI(research and agroforestry); HIVOS(youth enterprises);
3.4 Challenges
The main challenges were on human resource management; security; finance management;
intergovernmental relations; structural designs, prioritization of interventions based on needs and
public participation.
3.4. 1 Human Resource Management
Weak career progression framework, slow pace of promotions and poor capacity enhancement
led to gaps in succession management. Inadequate staffing led to constraints in service delivery
in health facilities, infrastructure department, water and environment trade department and
agricultural extension officers. Crises of change management in devolution led to numerous
strikes in the health sector affecting delivery of services. Disparities in salaries between staff
from defunct local authorities and those recruited by County Public Service Board and devolved
staff from national government affecting staff motivation.

Laikipia County Integrated Development Plan 2018-2022 Page 52
3.4.2 Security
The main security concerns that decelerated livestock development interventions were
competition for scarce pastures and water following prolonged dry spells. This led to loss of
produce, animals and property by small-scale farmers, pastoralists and ranching community.
Stock thefts caused disruptions in trade patterns, loss of human life and household livelihoods.
Inadequate grazing frameworks in communal ranches also led to invasions into private farms and
ranches. There were delayed compensation processes on human wildlife related cases.
3.4. 3 Finance Management
The annual wage bills were at high percentages above the recommended level of 35%. Spending
on development votes were not timely leading to accumulation of pending bills attributed to
administrative weaknesses, competing political interests and revisions of budgets. Allocation in
budgets to priority programmes was not guided by a clear and cohesive transformative agenda.
There were also gaps in strict adherence to procurement plans, budget implementation reporting
and programmes monitoring and evaluation. Annual finance acts were also inadequate in areas
such enforcement, development applications fees, alcoholic drinks regulations, unrealistic targets
and leakage of collections. The county experienced delays in disbursement from the National
Treasury. Previous CIDP was weak in its annual implementation and faced a major gap in
funding.
3.4.4 Intra and Intergovernmental Relations
Occasional misunderstanding between the County Executive and the Assembly slowed the pace
of passage and approval of key policies, budgets, bills and programme reports. Legal suits on
recruitment of ECDE teachers also stopped ECDE development and staffing.
3.4.5 Poor Workmanship and Supervision
Poor designs on water pans and markets resulted to non-operational facilities across the county.
The lifespan of graveled roads were compromised due to poor designs and poor supervision.
3.4.6 Prioritization of Interventions Based on Needs
Priority concerns were not supported by proper analysis of needs assessment, environmental
impact assessment, socio-economic cost and benefits, risks mitigation plans and staff capacities.
3.4.7 Public Participation
Timelines and schedules on public participation were inadequate as they were at low levels of
public participation ladder on information sharing and basic consultations. The Public
Participation Act, 2014 was not fully implemented. Feedback to citizens through proper access to
information also faced gaps. Collaboration with actors in civic education and public participation
was poor attributed to disharmony of events and information sharing.
3.4.8 Litigations
There were many cases involving the County Government as respondent or defendant. This was
exacerbated following a lean staffing establishment on legal services. Major areas affected were
revenue collections for instance on alcoholic drinks and operationalization of markets in
Nanyuki.

Laikipia County Integrated Development Plan 2018-2022 Page 53
3.4.9 Slow Pace of Approval of Policies and Enactment of Laws
A significant number of sectoral policies remained as basic drafts due to slow speed at the
County Executive Committee. In addition, a significant number of bills approved by the County
Executive Committee remained unapproved by the County Assembly.
3.4.10 Natural disasters-prolonged drought ,flash floods
3.5 Lessons Learnt
The following lessons were learnt and require integration in the sector programmes and
priorities.
i. Need for analysis and review of programmes costings for ease of linkages with annual
development planning, budgeting and resource mobilization processes
ii. Need for development of a comprehensive HR strategy to guide the management of the
county public service (Review of organization structures; staffing levels, harmonization
of staff compensation and comprehensive performance management system)
iii. Staff rationalization, review of organization structures; harmonization of staff
compensation
iv. Operationalization of town boards and village councils through redeployment of existing
staff
v. Privatization and contractual management of services in refuse management, revenue
management;
vi. Formulation of policy frameworks in pasture management to mitigate insecurity
incidences
vii. Enhance local revenue collections through supportive regulations like alcoholic drinks;
development control, county enforcement law and valuation law among others.
viii. Improved administrative capacity of officers for efficiency in projects and programmes
implementation, monitoring and evaluation.
ix. Need for strengthened results based monitoring and evaluation of the plan and
subsequent annual development plans
x. Enhance local collections through supportive regulations like alcoholic drinks;
development control,
xi. Improved administrative capacity of officers for efficiency in projects and programmes
implementation
xii. Participatory planning, supervision, monitoring and implementation of programmes and
projects
xiii. Information sharing on civic education and public participation amongst various actors
xiv. Review public participation framework and entrench participation up to the sub
locational levels

Laikipia County Integrated Development Plan 2018-2022 Page 54
xv. Increased allocations on research, training and feasibility studies at departmental/ sector
levels
xvi. Narrow gaps of standards of designs by collaboration with national agencies and
consulting agencies
xvii. Narrow gaps of standards of designs by collaboration with national agencies and
consulting agencies
xviii. Need to carry out strategic environmental assessments and environmental impacts
assessment before implementation of plans and projects respectively
xix. Uphold national values and principles of governance in public service
xx. Timely implementation of projects (Timely rehabilitation of dams i.e. before onset of
rains)
xxi. Formulation and implementation of spatial plans, urban plans and sector plans
xxii. Need to map the tourist destinations/sites and industrial parks
xxiii. Need to increase Enterprise and Cooperative Revolving funds to promote the MSMEs
and job opportunities for the youth and women in the county.

Laikipia County Integrated Development Plan 2018-2022 Page 55
CHAPTER FOUR
COUNTY DEVELOPMENT PRIORITIES AND STRATEGIES
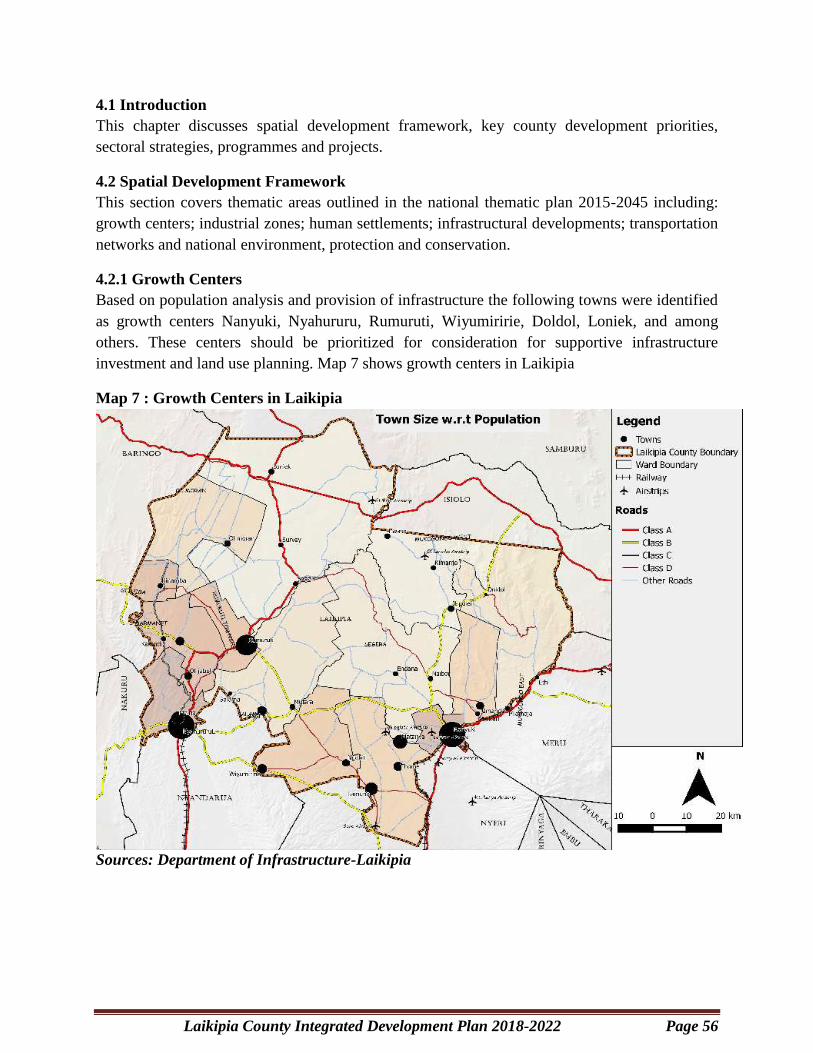
Laikipia County Integrated Development Plan 2018-2022 Page 56
4.1 Introduction
This chapter discusses spatial development framework, key county development priorities,
sectoral strategies, programmes and projects.
4.2 Spatial Development Framework
This section covers thematic areas outlined in the national thematic plan 2015-2045 including:
growth centers; industrial zones; human settlements; infrastructural developments; transportation
networks and national environment, protection and conservation.
4.2.1 Growth Centers
Based on population analysis and provision of infrastructure the following towns were identified
as growth centers Nanyuki, Nyahururu, Rumuruti, Wiyumiririe, Doldol, Loniek, and among
others. These centers should be prioritized for consideration for supportive infrastructure
investment and land use planning. Map 7 shows growth centers in Laikipia
Map 7 : Growth Centers in Laikipia
Sources: Department of Infrastructure-Laikipia

Laikipia County Integrated Development Plan 2018-2022 Page 57
Map 8 : Population Densities Across Wards
Sources: Department of Infrastructure-Laikipia
4.2.2 Transport Networks
The main transport trunks across the county include:
A104, A2 Nairobi-Moyale, Gilgil–Maralal, B Nyeri-Nakuru, B Marigat- Rumuruti detailed in
Map 8. The county road network consists of class D, E and un-classified roads (U) that are
detailed in Map 8.

Laikipia County Integrated Development Plan 2018-2022 Page 58
Map 8: County Road Network
Sources: Department of Infrastructure-Laikipia
Air Travel
Isiolo International Airport is the nearest major port in the region. The county is strategically
placed for the airport services on agricultural produce, domestic travel, tourism and hospitality
industry. Proposed airstrips are at Makurian in Laikipia North and Rumuruti in Laikipia West.
Railway Transport
There is proposed rehabilitation of existing line of 25kms in the county and extensions to link
with the LAPSSET corridor in Isiolo.
Natural Resource Management
The main natural resources are forests, water bodies (rivers and swamps) and conservancies.

Laikipia County Integrated Development Plan 2018-2022 Page 59
Map 9: Natural Resources
Sources; Laikipia Wildlife Forum
Tourism Attractions and Facilities
The main tourist attractions are wildlife habitats, scenic views, forest reserves, cultural and
centres, wildlife sanctuaries, art galleries and sports centres.
Map 10: Tourist Attractions and Facilities in Laikipia County
Social Amenities (water, health and education)
Map 11: Water Facilities in Laikipia County

Laikipia County Integrated Development Plan 2018-2022 Page 60
Map 12: Health Facilities in Laikipia County
Sources:Cetrad

Laikipia County Integrated Development Plan 2018-2022 Page 61
Map 13: Education Facilities in Laikipia County
Sources:Cetrad
Table 9: County Spatial Development Strategies by Thematic Areas
Thematic Area Overview/Current status Policy Strategy Potential
Geographical
Areas
Lead Agencies/
Departments
Growth centers
Transport
networks
Tourism Partially mapped tourism
establishments/products/sites
in Laikipia county
Mapping all the
tourism establishments
/products /sites in
Laikipia county
Wildlife habitats,
cultural and
community
centres, animal
orphanages and
sanctuaries,
sports tourism
sites ,Art
galleries, hotels
and restraunts,
waterfalls, birds
sites and forest
reserves
-Department of
tourism, land and
Physical planning
,KWS, CETRAD
and private sector
Trade No mapping of Industrial
parks
Mapping of industrial
parks
Major towns ;
-Nanyuki
-Nyahururu
-Rumuruti
-Dol dol
-Kinamba
-Directorate of
Trade
-Physical Planning
-Environment
-Cetrad

Laikipia County Integrated Development Plan 2018-2022 Page 62
Energy
Health
Education
Water and
sanitation
Table 10: Natural Resource Assessment
Name of Natural
Resource
Dependent
sectors
Status, Level of
utilization &
Scenarios for
future
Opportunities
for optimal
utilization
Constraints to
optimal
utilization
Sustainable
management
strategies
Forests:Mukogodo
Rumuruti, Lariak,
North Marmanet
Kuki Gallman
Water,
Environment,
Wildlife,
Energy, Social
Services,
Education and
Research,
Tourism
3% of gazetted
forests and 7%
of all trees in the
county, level of
utilization is
under threat and
the future
scenario is to
make it 10% tree
cover
Agro forestry
,Greening of
schools, Urban
forestry and
PELIS (Shamba
System)
Erratic weather
conditions,
Climate change
and Financial
Resources
In schools a pupil
adopts a tree.
CFA and WRUAS
adopt a tree for 3
years.
Rivers:Nanyuki
Likii, Pesi,Ngare
Ng’iro, Burguret
Ol Arabel, Ewaso
Narok (Ngare
Naro), Naromoru,
Sirimon, Ontulili,
Ngare ndare,
Melwa, Ngare
Nything, Ngobit,
Rongai, Timau,
Moyak, Suguroi,
Mutara,
Tourism, Water,
Environment,
Forest, Wildlife,
Agriculture and
Irrigation,
Livestock,
Fisheries, Social
Services,
Research
10% perennial
rivers and the
rest are seasonal,
Level of
utilization are
over abstracted
upstream for
irrigation and
domestic use
Future scenario
is drying of
rivers and target
of underground
water and water
conflicts
Water harvesting
and storage
Reduce, Reuse
and Recycle of
water, Water use
efficiency (Drip
irrigation),
Innovative
technologies on
efficient use of
water
Climate Change,
Population
Increase,
Inadequate
governance,
Deforestation
Overstocking
and overgrazing
Absentee
landlords
Improved
governance
WRUAS & CFAs
capacity building
Range management
Land-use Planning
Afforestation
Swamps:
Pesi
Moyok
Ewaso Narok
Mutara
Marura
Tourism, Water,
Environment,
Forest, Wildlife,
Agriculture and
Irrigation,
Livestock,
Fisheries, Social
Services,
Research
30% remaining
due to
encroachment
and over
utilization,
Future scenario
there is need for
rehabilitation.
Non-use to
allow
regeneration
Sink for heavy
metals
Protection
restoration of
catchment areas
Population
increase of
human, wildlife
and livestock
Policy
enforcement
Gazettement and
management plans.
County spatial plans
Conservancies:
Ol jogi
Ol Pajeta
Ilngwesi
Laikipia Nature
Conservancy
Ngorare ranch
Naibung’a
Oreteti
Borana
Olentille
Lekurruki
Tourism,
Wildlife, Water,
Forest, Trade,
Environment
-Operational,
income
generation,
alternative
source of
livelihood,
registered under
KWS and as
companies,
-Provide
revenue ton the
county
government,
Exploitation of
full tourism
potential(lodges
and recreation
areas)
Future research
areas
Source of
employment for
the locals
Future gene
banks for flora
and fauna
Change in
landuse
Competing
interests in
terms of
land(Invasion of
livestock and
invasive plant
species)
Expiry of leases
Population
increase.
Climate change
Conservancy
Management plans
and spatial plans
County-based
conservancy policy
Inclusive
governance in
resource
management

Laikipia County Integrated Development Plan 2018-2022 Page 63
some are under-
utilized but most
have
management
plans
-Future scenario:
Some have
freehold while
others leasehold.
They act as
future Natural
Resource
Management
areas.

Laikipia County Integrated Development Plan 2018-2022 Page 64
DEVELOPMENT PRIORITIES AND STRATEGIES
PUBLIC SERVICE AND COUNTY ADMINISTRATION
Sector Composition:
Office of the Governor
Public Service Management
County Administration
Public Safety, Disaster Management and Enforcement
County Administration and Planning
Office of the County Secretary
Legal Unit/Office of County Attorney
Sector Vision:
A County with efficient service delivery
Sector Mission:
To provide leadership in policy formulation, public service management and accountability for
quality service delivery.
Sector Goal:
The sector aims at effective and efficient delivery of public services and goods through highly
skilled manpower and coordination of decentralized services.
Sector Development Needs, Priorities and Strategies
Development Need Priorities Strategies
Human resource
management
Policy development
and implementation
-Customization of Public Service Commission policies
-Implementation of performance management system.
-An inclusive county government
-Review and implement the county organizational structure
-Implement and report on Article 10 and 232 of the Constitution
of Kenya.
-Develop and implement the county Human Resource Strategy
- Establish county archive and automate county records
Security improvement Resolve inter and intra-
county resource based
conflicts
-Support community policing strategies in the county
-Establish the county security service.
-Implement Amaya triangle initiative
Reduce human wildlife
conflict
-Coordinate timely compensation of community human wildlife
conflict
Public participation Involvement of stakeholders
in policy implementation
-Hold Governors annual public forums
-Strengthening public participation as per Public Participation
policies and legislations and decentralized civic awareness
County Administration Provide efficient and
effective service delivery
Support executive support services
Decentralize service units
and administrative support
Construction, equipping and operationalisation of decentralized
units upto ward level
Establishment of town boards and wards development
committees
Establishment of Citizens Service centers ,e-government
,Huduma centers modeling
Strengthened legal support Establishment of county legal unit and office of ombudsman.

Laikipia County Integrated Development Plan 2018-2022 Page 65
in the county Implementation of the legal aid Act 2016
Intra and inter government
relations
Supporting intra and intergovernmental relations engagements
Public safety and disaster
risk management
Disaster Risk Management Fast tracking the enactment and implementation of disaster risk
management bill
Modernization of Nanyuki Fire Station
Control of drug and
substance abuse
Implementation of Laikipia County Alcoholic Drink Control
Act,2014
End Drought Emergencies Coordinate the implementation of End Drought Emergencies
initiatives across sectors in the county
Sector Programmes Programme Name: County Administration
Objective: Efficient and effective implementation of legislative, intergovernmental relation, manage and coordinate
functions of the administration and its units.
Outcome: Efficient and effective county administration and its units
Sub
Programme
Key outcome Baseline Key
Performance
indicator
Planned Targets Total
budget
(000) Yea
r
1
Yea
r
2
Yea
r
3
Year
4
Year
5
Decentralized
Services
Improved
access to
government
services
50% (3,15
Subcounties
and wards)
Levels of
operationalizati
on of sub
county
decentralized
service units
60% 70% 80% 90% 100% 179,103
County
Services
Delivery and
Results
Reporting
Improved
service delivery
and decision
making
processes
40%
(2017/18
status report
on county
service
delivery)
Levels of
satisfaction by
members of
public
50% 60% 70% 80% 90% 356,366
Executive
Support
Services
Improved legal
services support
and informed
decision
making
10% of
suits
attended
50% of draft
policies and
bills
reviewed
Percentage of
suits/disputes
attended
Percentage of
draft
policies/bills
reviewed
40%
100
%
60%
100
%
80%
100
%
90%
100%
100%
100%
140,422
Well
coordinated
service delivery
systems
2017
Cabinet
resolutions
Implementation
levels on
executive
orders
/resolutions
100
%
100
%
100
%
100% 100% 169,986
Well
coordinated
Intra and Inter
Government
relations
2017
IGTRC
resolutions
Implementation
levels of Intra
and Inter
Government
relations
resolutions
100
%
100
%
100
%
100% 100% 661,143
Improved
Amaya Triangle
intergovernmen
tal initiatives
AMAYA
initiative
resolutions
Implementation
levels on
Amaya triangle
initiatives
100
%
100
%
100
%
100% 100% 50,000

Laikipia County Integrated Development Plan 2018-2022 Page 66
Programme name: Human Capital Management and Development
Objective: Effectively and efficiently manage human capital
Outcome: Improved service delivery and job satisfaction and
Sub
Programme
Key outcome baseline Key
Performance
indicator
Planned targets Total
budget
(000) Year
1
Year
2
Year
3
Year
4
Year
5
Human
Capital
Strategy
Efficient and
effective
management of
the county
public service
12 PSC
policies and
related
circulars
3 Draft
organization
structures
-Implementation
level of County
HC Strategy
50% 60% 70% 80% 90% 20,000
Motivated and
competent
work force
HR payroll Levels of annual
salary and
insurance
payments
100% 100% 100% 100% 100% 17,152,2
73
Skilled labour
force
10% in 16/17 -Percentage of
employees
trained annually
20% 30% 40% 50% 60% 75,041
Strengthened
welfare to
employees
0.5 percent of
of staff on car
and mortgage
arrangement
1
law/regulation
s on car
mortgage
Percentage of
staff car and
mortgage
1% 1.5% 2% 2.5 % 3% 250,00
0
Public
Service Board
Services
Improved staff
performance,
job satisfaction
and adherence
to the
principles of
the public
service
50% of CPSB
resolutions/de
cisions
implemented
Implementation
levels of boards
decisions/
resolutions
100% 100% 100% 100% 100% 56,166
Efficient and
effective
management of
staff
performance
98% of staff
adhering to
performance
management
appraisal
system in
2017/18
-Percentage of
staff on
performance
management
system
100% 100% 100% 100% 100% 10,000
Information
and Records
Management
Effective
management of
administrative
records
1record
management
policy in
place
1 HR registry
in operation
-Percentage
level of
automated
records
10% 20% 30% 40% 50% 7,000
Timely
retrieval of
archives
Record
management
policy in
No. of records
archived
10% 20% 30% 40% 50% 3,000

Laikipia County Integrated Development Plan 2018-2022 Page 67
place
Programme Name: Security and Policing Support Services
Objective: To reduce incidences of insecurity
Outcome: Enhanced security of life and property
Sub
Programme
Key outcome Baseline Key
Performance
indicator
Planned Targets Total
budget
(000) Year
1
Year
2
Year
3
Year
4
Year
5
Urban
Amenities
and
Developmen
t
Improved
security
15 kilometers
of street lights
27 market
centers flood
lights
Operational and
maintenance
levels of streets
and flood lights
100% 100% 100% 100% 100% 172,946
Security
Services
Enhanced
security
100% level of
implementatio
n of County
security
oversight
committee
resolutions
Level of
implementation
of County
security
oversight
committee
resolutions
100% 100% 100% 100% 100% 116,716
Reduced
human wildlife
conflicts
100% level of
implementatio
n of
compensation
committee
resolutions
Level of
implementation
of compensation
committee
resolutions
100% 100% 100% 100% 100% 10,000
Programme Name: Public Safety, Enforcement and Disaster Management
Objective: Ensure public safety, effective law enforcement and response to emergencies
Outcome: Enhanced public safety and disaster risk reduction
Sub
Programme
Key outcome Baseline Key
Performance
indicator
Planned Targets Total
budget
(000) Year
1
Year
2
Year
3
Year
4
Year
5
Enforcement
and Disaster
Risk
Management
Well
coordinated
disaster
response
5%
implementation
level of 1
Disaster Risk
Management
Act,2014
provisions
Implementation
levels on disaster
risk reduction
interventions
10% 20% 30% 40% 50% 154,010
Fire
Response
Services
Timely
responses to
fire incidences
2 fire engines
10 fire fighting
operators
Implementation
levels on
proposed fire
response
interventions
10% 20% 30% 40% 50% 48,469
Alcohol
Control
programme
Regulated
Alcoholic
drinks industry
20%
implementation
level of
Laikipia
County
Alcoholic
drink control
Act, 2014
provisions
Implementation
levels on
Alcohol control
programmes and
activities
30% 40% 50% 60% 70% 40,210

Laikipia County Integrated Development Plan 2018-2022 Page 68
End Drought
Emergencies
Services
Well
coordinated
End Drought
Emergencies
Services
20%
implementation
level County
Sectoral EDE
action plan
2012-2022
Implementation
levels of EDE
action plan
2012-2022
30% 40% 50% 60% 70% 250,000
Programme Name: Public Participation and Civic Education
Objective: To actively involve members of the public in decision making and ownership of county programs
implementation
Outcome :Improved service delivery
Sub
Programme
Key outcome Baseline Key
Performance
indicator
Planned targets Total
budget
(000) Year
1
Year
2
Year
3
Year
4
Year
5
Public
Participation
and
Stakeholders
Fora
Increased public
participation in
county
development
processes
30%
implementat
aion level of
public
participation
policies and
legislations
Percentage
implementation
status of
planned public
participation
and civic
education
programmes
40% 50% 60% 70% 80% 135,306
Civic
Education
Informed
citizenry on
county
governance
Nil trainers
of trainees 5
modules on
public
participation
Number of
trainers of
trainees trained
Number of
members of
public trained
on county
governance
150
4,500
150
4,500
150
4,500
150
4,500
150
4,500
300,000
4.4.2 Cross-Sectoral Implementation Considerations
Table 12: Cross-Sectoral Impacts
Programme
Name
Sector
Cross-sector Impact Measures to Harness or
Mitigate the Impact Synergies Adverse impact
Security and
Policing Support
Services
Agriculture,
livestock and
fisheries
Livestock identification
and traceability system
(LITS)
Poor coordination
of livestock
movement
Work with security and
administrative agencies in
LITS
Strengthen cross movement
of animals
Water,
environment and
natural resources
Compensation for loss of
produce, livestock and
human injuries
High incidences
and levels of
compensation
Collaboration with
compensation committees on
human wild life conflicts
Increased investments in
wildlife fences
Infrastructure
land and housing
Construction and
maintenance of security
roads and street lighting
Poorly manned
stock and trade
routes
Establish police posts,
patrols and community
policing along the stock and
trade routes
Education , ICT
and Social
Services
Trade and
Tourism
Community policing and
information sharing on
security issues
Information leaks Strengthened information
sharing
Embrace secured coding
system
Public safety,
enforcement and
Health Establishment of
rehabilitation centers
High number of
addicts
Resource mobilization
through budgetary allocation

Laikipia County Integrated Development Plan 2018-2022 Page 69
Programme
Name
Sector
Cross-sector Impact Measures to Harness or
Mitigate the Impact Synergies Adverse impact
disaster
management
and development partners
funding
National Drought
Management
Authority
Technical and financial
support in disaster risk
reduction strategies
Resource mobilization
through budgetary allocation
and development partners
funding
Water,
environment and
natural resources
Assurance of safe water
and a secure environment
Global climate
changes
Sustainable water provision
and environment protection
Finance and
economic
planning
Financial management Litigations on
financial acts
Strengthening local revenue
collection and enforcement
County
Administration
All sectors Coordination and service
delivery
Decentralization of services,
e government services and
implementation
development programmes
Human Capital
Strategy
All sectors Human capital
development and
performance management
systems
Sector wide consultations
and collaborations
Public
Participation and
Civic Education
All sectors Implementation of public
participation policies and
legislations
Sector wide consultations
and collaborations
4.5 Flagship /County Transformative Projects

Laikipia County Integrated Development Plan 2018-2022 Page 70
FINANCE ECONOMIC PLANNING AND COUNTY DEVELOPMENT
Sector Composition:
There are eight sub-departments each entrusted with specific mandates in provision of financial
services and county development planning. They are:
Revenue Board
Treasury Accounts
Internal Audit
Supply Chain Management
Economic Planning
County Development Authority
Budget Management
Youth Development Authority
Sector Vision To be a leading sector in public policy formulation, coordination of development and prudent
resource management.
Sector Mission Provide exemplary leadership in resource mobilisation, development planning and financial
management.
Sector Goal To ensure efficiency and effectiveness in public service delivery.
Sector Development needs, Priorities and Strategies Table #
Development Need Priority Strategies
Transparency,
accountability and value for
money
Prudent financial
management
-Improve county asset management system
-Improve county debt management system
-Enforcement of public procurement and disposal standards
and procedures
-Adhere to Accountings Standards and Procedures
Funding of county
development programmes
Increase revenue
collections
-Improvement of revenue collection infrastructure
-Implementation and enforcement of the annual Finance Acts
and related laws
-Full automation of the revenue collection services
Coordinated development
initiative
Participatory planning -Inclusive policy formulation and implementation in county
development and service delivery
-Implement development planning frameworks
Technical capacity and
creation of cooperation
Partnership and
collaborations
-Coordinate joint development initiatives e.g. Amaya
Triangle, Mount Kenya Aberdares Economic blocs
-Initiate and implement Public Private Partnerships
-Enhance Intergovernmental Relations
Bridge gap in financing
requirements
Resource mobilization -Mapping of potential partners
-Operationalize our county Civil Society
Organizations(CSO)forums/Public Benefit
Organization(PBO)
-Strategic programmes with development partners

Laikipia County Integrated Development Plan 2018-2022 Page 71
High unemployment levels Skills development in
entrepreneurial services
- Formulation of Laikipia youth development policy
- Identify relevant stakeholders
- Formulation of market oriented programmes and projects
-Participatory implementation of youth oriented programmes
Table 11: Sector Programmes
Programme Name : Administration and Personnel Services
Objective: To ensure efficiency delivery of financial and planning services
Outcome: Steady county economic growth
Sub
Programme
Key Outcome Baseline Key
performance
Indicators
Planned Targets Total
Budget
(000) Year
1
Year
2
Year
3
Year
4
Year
5
Personnel
Services
Improved staff
performance
(60%)
2017/2018
Performance
Levels of
performance
rating
80% 85% 90% 95% 100% 50,000
Percentage of
staff
compliant on
SPAS
100% 100% 100% 100% 100%
Administrative
Services
Timely office
supplies and
service
delivery
support
Nil service
charter
Timely office
supplies and
service
delivery
support
100% 100% 100% 100% 100% 40,000
Infrastructural
facilities
Improved
working space
and
specialised
office
equipment and
installations
(70%)
2017/2018
Status
Percentage of
staff with
designated
working space
and
specialised
office
equipment and
installations
80% 85% 90% 95% 100% 15,000
Programme Name :Financial services
Objective: To ensure efficient and effective delivery of financial services
Outcome: Steady county economic growth
Sub
Programme
Key Outcome Baseline Key
performance
Indicators
Planned Targets Total
Budget
(000) Year
1
Year
2
Year
3
Year
4
Year
5
Supply Chain
Management
Services
Increased
percentage of
functional
works, goods
and services
(50%)
Monitoring
reports
2016/17
Percentage of
functional
works, goods
and services
60% 70% 80% 90% 95% 60,000
County
Treasury,
Accounting and
Reporting
Services
Improved
compliance of
procedures,
operations and
reports
(90%)
Level of
compliance
Percentage
level of
compliance
100% 100% 100% 100% 100% 300,000
Internal Audit
Services
Reduced risk
areas/incidenc
es
Medium
(numbers)
Reduced risk
incidences in
financial
procedures
and processes
Low Low Low Low Low 60,000

Laikipia County Integrated Development Plan 2018-2022 Page 72
Budget
management
Increased
percentage
allocation of
development
votes
(35.3 %)
CFSP 2018
Percentage
allocation of
development
fund votes
36% 37% 38% 39% 40%
30,000
Increased
percentage of
absorption of
development
votes
17%
CFSP 2018
Percentage of
absorption of
development
votes
22% 27% 32% 35% 42%
Programme Name: Revenue management services
Programme Name: Development planning services
Objective: Ensure participatory planning and coordination of development initiatives
Outcome: Well-coordinated development approach
Sub
Programme
Key
Outcome
Baseline Key
performance
Indicators
Planned Targets Total
Budget
(000) Year
1
Year
2
Year
3
Year
4
Year
5
Integrated
Planning
Services
Enhance
sustainable
socio-
economic
development
17%
CFSP 2018
Levels of
implementation
of development
programmes
22% 27% 32% 35% 42% 60,000
Research
Statistics and
Documentati
on Services
Informed
decision
making tools
Nil feasibility
studies
1 County
Statistical
Abstract
The No.
feasibility
reports
2 2 2 2 2
25,000 The No. of
County
Statistical
Abstracts
1 1 1 1 1
Programme
Monitoring
and
Evaluation
Informed
decision
making tools
Nil Monitoring
and Evaluation
report
Levels of
implementation
of
recommendatio
ns in progress
reports
50% 40% 60% 70% 80% 35,000
Participatory
Budgeting
Support
Services
Increased
inclusivity in
development
processes
Non-existing
CBEF
Functional
CBEF
1 1 1 1 1 35,000
Strategic
Partnership
and
Collaboration
Increase
resources
base from
partners
110Millions
(EU-IDEAS)
Amount of
resources
mobilised
120M 132M 158M 190M 228
M
75,000
Youth
Development
Empowermen
t Services
Enhanced
youth
participation
in county
development
20 Millions Number of
youth trained on
entrepreneurial
skillsets
750
1,000 1,250 1,500 1,750 125 ,000
Number of start-
ups arising from
the skills
transferred
500 750 1000 1250 1500

Laikipia County Integrated Development Plan 2018-2022 Page 73
Objective: Enhance locally generated revenue
Outcome: Increased locally generated revenue
Sub
Programme
Key
Outcome
Baseline Key
performanc
e Indicators
Planned Targets Total
Budget
(000) Year
1
Year 2 Year 3 Year
4
Year
5
Collection
services
Increased
revenue
collections
Ksh.500
Million
Amount
collected
600m 720m 864m 936m 1.244
B
250,000
Percentage
annual
increase
20% 20% 20% 20% 20%
Revenue
management
infrastructure
systems
Improved
revenue
infrastructur
e systems
2017
22
Functional
markets,
10 auction
yards, 15
cess points
and 10
barrier
points
No. of
functional
revenue
systems
22
Functional
markets,
10 auction
yards, 15
cess
points and
10 barrier
points
22
Functio
nal
markets,
10
auction
yards,
15 cess
points
and 10
barrier
points
22
Functio
nal
markets
, 10
auction
yards,
15 cess
points
and 10
barrier
points
22
Functi
onal
marke
ts, 10
auctio
n
yards,
15
cess
points
and 10
barrier
points
22
Functi
onal
market
s, 10
auctio
n
yards,
15 cess
points
and 10
barrier
points
75,000
4.4.2 Cross-Sectoral Implementation Considerations
Table *: Cross-Sectoral impacts
Programme
Name
Sector Cross-sector Impact Measures to Harness or Mitigate the
Impact Synergies Adverse Impact
Administration
and personnel
services
County
Administratio
n and public
service
Human Resource
Management
Establishment of
semi-autonomous
bodies
-Career development and training to
enhance synergies
-Gradual and consultative transition to
mitigate likely challenges arising from
management of board operations
Performance
management
-Coordination of performance
management plans across departments
Financial
services
All sectors Functional sector
working groups
Abandoned stalled
and non-functional
projects
Overpriced projects
-Timely supervision of projects
-Participatory implementation of
projects
-Standardization in project costing
-Timely project prefeasibility and
feasibility reports
Revenue
Management
Services
Trade Registration, issue
of permits and
inspection of
enterprises and
institutions
Litigations arising
from revenue related
existing laws
-Participatory formulation and
implementation of annual finance acts
and other related laws
-Arbitration for settlement of disputes
related to revenue
Development
Planning
Services
All sectors Operationalizatio
n of CBEF
-Participatory processes on financial
and economic matters in the county
Formulate and
implement sector
plans and
strategies
Slow or non-
implementation of
development
frameworks
-Alignment with medium term and
long-term development plans. (Vision
2030, MTP III)
-Coherence in development planning
and implementation of programmes
Timely project implementation
Table*: Flagship/ Transformative Projects

Laikipia County Integrated Development Plan 2018-2022 Page 74
Project
Name
Location Objective Output
/Outcome
Performance
Indicators
Timeframe
(Start-End)
Implementing
Agencies
Cost Ksh
(000)
Youth
Empowerme
nt Project
County
wide
Skills
development
for enhanced
employment
opportunities
Improved
livelihoods
amongst the
youth
Percentage
completion
levels in
entrepreneuria
l skills
July 2018-
June 2023
County
Enterprise
Fund ,MESPT
Ministry of
Trade, SNV
USAID
Ministry of
Labour and
Social Affairs
125,000
Reduced
dependenci
es amongst
the youthful
population
Number of
business
incubation
services and
startups

Laikipia County Integrated Development Plan 2018-2022 Page 75
EDUCATION, ICT AND SOCIAL DEVELOPMENT
Sector Name
Department Education, ICT and Social Development
Subsectors Names
Education and ICT
Sports talent development, culture and social service
Sector Vision
To be a leading facilitator in Hands on skills, early childhood education, ICT services, social
services, sports, culture and children care.
Sector Mission
To offer transformative quality education and training, promote social-cultural services for
improved welfare of the citizens in Laikipia.
Sector Goals
To promote social, cultural, sports and recreational activities in the county and manage stand-
alone programmes for youth, children, women and persons living with disabilities.
To promote enabling environment for access, retention, completion and transition rates for
trainees in hands on skills, entrepreneurship and life- skills, early childhood Education and
enhance efficiency in service delivery.
Table 10: Development needs, priorities and strategies
Development Needs Priorities Strategies
Infrastructure
development
ECDEs ,VTCs, Stadiums , Social Halls
, Cultural centre, Child care facilities,
Primary and Secondary Schools and
ICT
-Conduct feasibility study to determine needs.
-Resource mobilization to secure funding through
budgets, Grants ,Land acquisition, Utilisation of
Technical expertise
-Constructions/Renovations, provision of furniture
and equipments and installations
Review of courses Vocational Training -Conduct market scan to establish marketable
courses to be offered in the Vocational training
centres
Teaching learning and
training materials
Early Childhood Development
Education ,Vocational Training
Centres and in sports
-Provision of instructional materials, models
,teaching aids, training materials , sports materials
Additional staff and Skills
upgrading
ECDE Teachers , VTC Trainers and
Sports Officers
-Recruitment of ECDE teachers, VTC Trainers
and Sports officers
Skill upgrading for in ECDE VTCs
sports staff , community development
Assistants ,child caregivers and ICT
practitioners
-Provide refresher course to VTC trainers on
hands on skills for , ECDE Teachers on
pedagogical skills , Sports staff on event and field
practical skills and stadium management,
Community development assistants and Childcare
givers on public relations and speaking skills,
bookkeeping , managerial skills , leadership skills
group dynamics and paramedic skills
Social protection PWDs, Orphans, Street children
women and Elderly persons
-Collaboration in registration and data collection
for PWDs orphans, elderly persons and street

Laikipia County Integrated Development Plan 2018-2022 Page 76
children with relevant organisations
-Allocate budgets for programmes and
interventions for PWDS, orphans , street children
and elderly persons
Education empowerment Orphans, special needs pupils/students
and most needy pupils/students in
-Provision of full scholarships to orphans and
bursaries to most needy in special schools,
secondary schools ,VTCs, colleges and universities
Talent identification
nurturing and
development
Sports, performing arts , and cultural
practices
Organising sports tournaments, cultural events
,exhibitions and talents shows
Collaborations and
Partnerships
National /County Government
Departments , public benefit
organisations , private sector, Research
centres and learning institutions
.
-Collaborators and partners mapping and profiling
-Collaboration and partnership on information
sharing and data management
-Placement of VTC trainees in industries for hands
on Skills
- Collaboration and partnership in resource
mobilization
-Collaboration on ICT coverage and development
Table 11: Sector Programmes
Programme ; Administration, Planning and Support Services
Objective ;Streamline management of resources and services
Outcome; Uninterrupted service delivery Budget
Ksh
(000) Sub
Programme
Key Outcome Baseline Key indicator Year
1
Year
2
Year
3
Year
4
Year
5
Administration
Services
Uninterrupted
service
delivery
current
programmes
%. of service
delivery
interruptions
0% 0% 0% 0% 0% 85,000
Programme; Vocational Education and Training
Objective; Increase the number of Trainees with Hands on skills, entrepreneurship and life skills.
Outcome; Increase number of artisans with basic employability skills for reliable and sustainable livelihoods Budget
Ksh
(000) Sub
Programme
Key Outcome Baseline Key indicator Year
1
Year
2
Year
3
Year
4
Year
5
Infrastructure
Development
and
improvement
Increased
number of the
vocational
training center
from 8 to 15
2017 VCT
Status
Number of VTC
infrastructure
developed and
operational
1 1 1 2 2 70,000
Accreditation
,Quality
assurance and
standards
Increase number
of trainees
graduating with
hands on
marketable
skills from 627
to 5000
2017
graduation
rate
Number of
trainees
graduating
hands on
marketable
skills
1000 1000 1000 1000 1000 60,000
Collaboration
and
Partnerships
Increase number
of partnerships
from 2 to 20
2017 Status Number of
partnerships
and
collaborations
achieved
4 4 4 4 4 10,000,

Laikipia County Integrated Development Plan 2018-2022 Page 77
Programme; Information Communication and Technology infrastructure improvement
Objective; Improved Connectivity and ICT platforms and coverage
Outcome : E-governance, Innovation, Connectivity, Skills development Budget
Ksh
(000) Sub
Programme
Key Outcome Baseline Key
indicator
Year
1
Year
2
Year
3
Year
4
Year
5
ICT
Infrastructure
and
Connectivity
Increased ICT
connectivity
and Coverage
County ICT
roadmap
2015 -2020
Level of
roadmap implementation
20% 30% 40% 50% 60% 15,000,
ICT for public
service delivery
Efficient and
effective public
service delivery
County ICT
roadmap
2015 -2020
Level of
roadmap implementation
30% 50% 70% 90% 100% 15,000,
ICT Capacity
Training
Improved
service delivery CARPS Number of
Persons
trained on ICT
200 350 600 800 1000 10,000,
Programme ;Early Childhood Education Development
Objective; Increase access, Retention, completion and transition rates of pupils with basic Knowledge
Outcome : Increased number of pupils with quality basic knowledge Budget
Ksh
(000) Sub
Programme
Key Outcome Baseline Key
indicator
Year
1
Year
2
Year
3
Year
4
Year
5
ECDE
Infrastructure
Development
Increase number
of ECDE
centers from 75
to 150
2017 ECDE
Status
Number
ECDE centers
constructed
and functional
15 15 15 15 15 375,000,
Quality
assurance and
standards
Increase ECDE
enrollment from
23,172 to
28,000
2017ECDE
enrollment
Number of
pupils
transiting to
standard one
1000 1000 1000 1000 1000 10,000,
Teachers
services
Increase number
of teachers
from 760 to 950
teachers
2017
payroll
Teachers with
pedagogical
skills engaged
by the county
Government
40 40 40 40 40 60,000
Programme Education Empowerment
Objective; Increase access, Retention, completion and transition rates for special needs and most needy students
Outcome : increased retention and transition rates Budget
Ksh
(000) Sub
Programme
Key Outcome Baseline Key
indicator
Year
1
Year
2
Year
3
Year
4
Year
5
Education
empowerment -
bursary Fund
Increase number
of beneficiaries
7844 to 12,000
2017
bursary and
scholarships
wards
Number of
beneficiaries
supported
1000 1000 1000 1000 1000 340,000
School
infrastructure
support
Enhanced
learning
facilities
2017 support
status
No of
projected
implemented
Programme; Talent identification nurturing and development
Objective; Increase access to safe environment for sports and recreation participation
Outcome : Healthy physically and economic empowerment for citizens Budget
Ksh
(000) Sub
Programme
Key Outcome Baseline Key
indicator
Year
1
Year
2
Year
3
Year
4
Year
5

Laikipia County Integrated Development Plan 2018-2022 Page 78
Sports facilities
development
and Sports
promotion
services
Increase number
of sporting
Facilities and
utilities
2017 status Number of
facilities
developed
1 1 1 1 1 50,000
Increase sports
promotion
activities
2017 status Number of
sports events
organized
3 3 3 3 3
Talent
identification,
nurturing and
development
services
Increase number
of talent
identification
,and nurturing
activities
2017
calendar of
events
Number of
talent
identification
and nurturing
e vents held.
6 6 6 6 6 60,000
Programme ;Social and cultural development and promotion
Objective; To promote and mainstream social-cultural issues within the county
Outcome :Empowered Vulnerable groups Budget
Ksh
(000) Sub
Programme
Key Outcome Baseline Key
indicator
Year
1
Year
2
Year
3
Year
4
Year
5
PWDs, orphans
and elderly
Increase number
of PWDs, orphans
and elderly under
social protection
services
2017
Status
Number of
persons
benefited
50 50 50 50 50 40,000
Social and
cultural
facilities
development
Increase number
of social and
cultural facilities
2017
Status
Number of
Social and
cultural
facilities
developed
1 1 1 1 1 20,000
Programme; Child Care and rehabilitation
Objective ;To rescue ,rehabilitate and re-integrate children in need of care and protection
Outcome :Reformed street children to lead normal and acceptable life in society Budget
Ksh
(000) Sub
Programme
Key Outcome Baseline Key
indicator
Year
1
Year
2
Year
3
Year
4
Year
5
Child care and
rehabilitation
Increase the
number of
children under
rehabilitation
2017
Status
No. of street
children
rehabilitated
50 50 50 50 50 30,000
Infrastructure
Development
Provide
conducive facility
for children
rehabilitation
Current
infrastruct
ure
No. of
infrastructure
constructed
1 1 1 1 1 20,000,
Table 12 Cross-Sectorial Impact Programme
Name
Sector Cross-Sector Impacts Measures to Harness or
Mitigate the Impact Synergies Adverse impact
Vocational
Education and
Training
Infrastructure Formulation of infrastructural
plans ,bills of quantities
,supervision of works and
technical support
Delays in timely
submission of
documents and lack
of close supervision
Timely planning and
requests for technical
supports
Health Provision of medical services to
staff in VTCs and Trainees
Resistance by staff
and trainees due to
negative attitudes
Sensitization of
stakeholders
Finance and
Planning
Processing of funds,
procurement processes and
development planning process
Delays in funds
processing and
exchequers
Timely request of funds
and adherence to set
procedures and regulations

Laikipia County Integrated Development Plan 2018-2022 Page 79
Water Formulation of water
infrastructural plans ,bills of
quantities ,supervision of works
and technical support
Delays in timely
submission of
documents and lack
of close supervision
Timely planning and
requests for technical
supports
Agriculture Technical advice and Integration
of Agribusiness course in VTCs
Curriculum Integration of
Agricultural programmes
with VTCs
CPSB Recruitment of trainers Delays in
advertisement and
interviews
Fas tracking progress from
time to time
TVETA
Certification Licensing and
Accreditation
Delays in assessment
for licensing and
registration
Fas tracking progress from
time to time
Survey of
Kenya
Issuing of title deeds Overlaps over
surveyed land
Fas tracking progress from
time to time
Early
Childhood
Education
Development
Health Provision of medical services to
ECDE Staff and Pupils
Resistance by staff
and trainees Due to
negative attitudes
Sensitization of
stakeholders
Infrastructure Formulation of infrastructural
plans ,bills of quantities
,supervision of works and
technical support
Delays in timely
submission of
documents and lack
of close supervision
Timely planning and
requests for technical
supports
Finance and
Planning
Processing of funds,
procurement processes and
development planning process
Delays in funds
processing and
exchequers
Timely request of funds
and adherence to set
procedures and regulations
Water Formulation of water
infrastructural plans ,bills of
quantities ,supervision of works
and technical support
Delays in timely
submission of
documents and lack
of close supervision
Timely planning and
requests for technical
supports
Administration Feeding programme Lack of budgetary
allocations for
feeding programme
A stand-alone programme
for emergency to be
created with its budget
KICD Development and
implementation of curriculum
Implementation
challenges due to
lack of curriculum
support materials
Distribution of curriculum
materials
CPSB Recruitment of teachers Delays in
advertisement and
interviews
Fas tracking progress from
time to time
Sports Finance and
Planning
Processing of funds,
procurement processes and
development planning process
Delays in funds
processing and
exchequers
Timely request of funds
and adherence to set
procedures and regulations
Infrastructure Survey planning quantifying and
supervision of Infrastructural
projects
Delays in timely
submission of
documents and lack
of close supervision
Request and facilitation of
the supervision
Social and
Culture
Health Routine checks and medical
services to staff and PWDs
Resistance by staff
and trainees Due to
negative attitudes
Sensitization of
stakeholders
Infrastructure Formulation of infrastructural
plans ,bills of quantities
,supervision of works and
technical support
Delays in timely
submission of
documents and lack
of close supervision
Timely planning and
requests for technical
supports
Finance and
Planning
Processing of funds,
procurement processes and
development planning process
Delays in funds
processing and
exchequers
Timely request of funds
and adherence to set
procedures and regulations
Water Formulation of water
infrastructural plans ,bills of
Delays in timely
submission of
Timely planning and
requests for technical

Laikipia County Integrated Development Plan 2018-2022 Page 80
quantities ,supervision of works
and technical support
documents and lack
of close supervision
supports
Education
empowerment
Finance and
Planning
Processing of funds,
procurement processes and
development planning process
Delays in funds
processing and
exchequers
Timely request of funds
and adherence to set
procedures and regulations
Administration Identification of beneficiaries Lack of adhering to
timelines
Early planning and
facilitation
Child care
services
Health Routine checks and medical
services to children on
rehabilitation
Resistance by staff
and trainees Due to
negative attitudes
Sensitization of
stakeholders
Infrastructure Formulation of infrastructural
plans ,bills of quantities
,supervision of works and
technical support
Delays in timely
submission of
documents and lack
of close supervision
Timely planning and
requests for technical
supports
Finance and
Planning
Processing of funds,
procurement processes and
development planning process
Delays in funds
processing and
exchequers
Timely request of funds
and adherence to set
procedures and regulations
Water Formulation of water
infrastructural plans ,bills of
quantities ,supervision of works
and technical support
Delays in timely
submission of
documents and lack
of close supervision
Timely planning and
requests for technical
supports
Flagship/Transformative Projects Project
Name
Location Objective Output/
Outcome
Performance
Indicators
Time
frame
(Start-End)
Implementing
Agencies
Cost
(Kshs.)
(000)
Establishme
nt of 8 VTCs
to grow hand
on skills
Nanyuki,
Nyahururu,
Wiyumiririe,
Salama,
Marmanet
Tigithi
Rumuruti
and Sipili
Increase the
number of
artisans with
Hands on
and
entrepreneur
ship skills.
Increase
number of
artisans with
basic
employability
skills
Number of
artisan self-
employed and
formally
employed
2018-2022 County
department of
Education,
ICT and
Social
Development
50,000
Establishme
nt of 15
Model
ECED
centers
One in every
ward
To increase
access,
retention,
completion
and
transition
rates
Increased
number of
pupils
transiting to
primary level
Number of
pupils
registered in
standard one
2018-2022 75,000

Laikipia County Integrated Development Plan 2018-2022 Page 81
LANDS, HOUSING AND URBAN DEVELOPMENT
Sector Name
Lands, Housing and Urban Development
Sub sectors names
Infrastructure,
Land reforms
Housing
Urban development.
Vision ‘To be the leading sector in the realization of safe and quality road network in a well-
planned, affordable and sustainable human settlement for socio-economic development’
Mission ‘To construct, manage and maintain good road network; plan land resource and to
provide infrastructural facilities within which environmental and socio-economic developmental
activities co-exist’
Goal: Improved livelihoods through well-planned urban centres and state of the art infrastructure
development.
Table 10 Development needs, priorities and strategies
Development Needs Priorities Strategies
Urban and regional
(county wide) planning
(Land resource
management)
Formulation of the County Spatial
Plan, Spatial Framework, Land
Suitability and Capability Map
Implementation of the County Spatial Plan, Spatial
Framework, Land Suitability and Capability Map
Establishment of an effective county spatial planning
unit/department
Establishment of a functional Geographic
Information System laboratory with relevant human
resource and funding
Formulation of Urban Areas Plans
(local area plans) and delineation of
urban areas
Implementation of Urban Areas Plans (local area
plans)
Registration of all types of land Commitment to and prioritization in allocation of
resources
Formulation of development control
guidelines and regulations
Implementation of development control guidelines
and regulations
Land governance and
reforms
Capacity development To enhance inclusive land management and
administration through individual and institutional
capacity building and awareness creation
Policy and Legal framework To support participatory land planning processes for
formulation of land use plans, development plans and
a spatial plan in the county
To support establishment of land policy and legal
frameworks for improved land governance in line
with the voluntary guidelines for responsible
governance of tenure
Knowledge management and
research
Strengthen knowledge management and capacity of
research on land and natural resources management
issues
Housing Development
and Management
Formulation of County Housing
Policy
Implementation of the County Housing Policy
Formulation of a Medium Term
Marshal Plan to improve existing
Promote sustainable partnerships in housing
development and management

Laikipia County Integrated Development Plan 2018-2022 Page 82
housing assets and ensure targeted
supply of new housing units
Provide a dedicated budget for development and
maintenance of housing
Roads prioritization,
design, construction,
supervision and
Maintenance
Formulation of county road
connectivity map and prioritization
register;
Commitment to prioritization register
Formulation of a County Roads
Design Manual aligned with national
and international standards
Implementation of a county roads design manual
aligned with national and international standards
Formulation of county roads
supervision instruments and
maintenance framework
Implementation of the county roads supervision
instruments and maintenance framework
Sector Programmes
Programme Name: Administration, Planning and Support Services
Objective: To improve coordination, administration and operations
Outcome: Improved working environment
Sub
Programme
Name
Key Outcome Base
line
Key
Performance
Indicators
Planned Targets Cost
Ksh
(000) Year
1
Year
2
Year
3
Year
4
Year
5
Administration
Services
Improved work
environment
75% % of staff with
adequate office
space and
equipment
75%
85%
90%
95%
100%
35,000
2017
Status
% level of
completion of the
GIS Lab
20% 40%
70%
80% 100%
20,000
Fleet
Management
Well managed
county
transport
system
60% % of functional
county vehicles
and plants
70% 80% 90% 100% 100% 35,000
Personnel
services
Improved
service delivery
2017
Status
% of staff meeting
their performance
appraisal targets
100%
100%
100%
100%
100%
35,000
% of land
management staff
trained
50% 50% 0 0 0 6,500
Programme Name: Physical Planning and Land Survey Services
Objective: To have a well-planned and sustainable human settlement with security of tenure
Outcome: Well coordinated human settlement
Sub
Programme
Name
Key
Outcome
Baseline Key Performance
Indicators
Planned Targets Cost
Ksh
(000) Year
1
Year
2
Year
3
Year
4
Year
5
Land
Management
Services
Increased
percentage
of land with
title deeds
2017
Status
Percentage of land
with title deeds
50%
60%
70%
80%
90% 150,000
Establishment of a
Modern Land
Registry
20% 20% 100%
100%
100%
Survey and
Planning
Services
Increased
percentage
of centres
with upto
date
physical
development
2017
Status
Completion levels of
spatial planning for 4
primary towns
80%
100%
100% 100% 100% 100,000
Completion levels of
spatial planning for
secondary towns
50%
80%
100%
100% 100% 100,000
Level of completion
of the county spatial
plan and Legal
30% 50% 70% 90% 100% 50,000

Laikipia County Integrated Development Plan 2018-2022 Page 83
plans framework.
Programme Name: Roads Network Improvement
Objective: improved road network and interconnectivity within the county
Outcome: improved accessibility within the county
Sub
Programme
Name
Key
Outcome
Baseline Key
Performance
Indicators
Planned Targets Cost
Ksh
(000) Year 1 Year 2 Year
3
Year
4
Year
5
Roads
Network
Improvement
Improved
accessibility
within the
county
600 Km of county
roads upgraded
to all weather
roads
400
km
400
km
400
km
400
km
400
km
2 billion
Km of urban
roads tarmacked
4km 4km 4km 4km 4km 800,000
Bridges
Infrastructure
services
Improved
accessibility
within the
county
No. of
functional
bridges
1 long
span
3
medium
span
3
medium
span
1 long
span
3
mediu
m
span
3
mediu
m
span
3
mediu
m
span
400,000
Mechanizatio
n Services
Improved
accessibility
within the
county
No. Of
functional
machinery
leased to own
100 ,000
Programme Name: Housing and Urban development
Objective: Provide quality affordable housing and sustainable urban settlements
Outcome: Improved housing facilities
Sub
Programme
Name
Key
Outcome
Base
line
Key
Performance
Indicators
Planned Targets Cost
Ksh
(000) Year
1
Year
2
Year
3
Year
4
Year
5
Housing
Improvement
Improved
housing
facilities.
% of improved
housing facilities.
50%
60%
70%
80%
90%
250,000
% level of
completion of
new housing units
10% 40%
60%
80%
90%
500,000
% of adoption of
alternative
housing
technologies
10%
25% 35%
45%
60% 10,000
Urban
Development
and
Management
Well
developed
and managed
urban centres
0
Number of
operational
Management
boards for
primary towns
3
4
4
4
4
150,000
No. of towns with
approved urban
designs
6
9
12
15
20
250,000
Percentage level
of implementation
of the urban
designs
10%
15%
20%
50%
100%
5billion
No. of towns with
up-to-date
valuation roll
6
9 12 15 20 200,000

Laikipia County Integrated Development Plan 2018-2022 Page 84
Programme Name: Public Works Services Delivery Improvement
Objective: Provide all county building proect worksa services ; necessary public works services
Outcome: Improved infrastructural development
Sub Programme
Name
Key
Outcome
Base
line
Key Performance
Indicators
Planned Targets Cost
Ksh
(000 Year
1
Year
2
Year
3
Year
4
Year
5
County Building
Construction
Standards
Improved
building
services
100%
% of project
services offered
100%
100%
100%
100%
100%
21,000
0 Level of completion
of Legislations for
standards and
policies
100%
0
0 0 0
Public Buildings
and Bridges
Inspectorate
Services
Safe and
functioning
structures.
100% % of structures and
bridges
requisitioned
100% 100% 100% 100% 100% 15,000
Private Buildings
Inspectorate
Services
Safe and
functioning
structures
10% % of inspections for
structures requested
30% 40% 50% 60% 70% 15,000
Cross-Sectoral Implementation Considerations
Programme Name Sector Cross-sector impact Measures to harness or
mitigate the impacts Synergies Adverse Impact
Administration,
Planning and Support
Services
Public service and
County Administration
Staff recruitment
and training
Performance contracting
Physical Planning
and Land Survey
Services
FAO,NLC
Ministry of Lands
Land management Delay in resolving
local land issues
Creation of local land
management committees.
Roads Network
Improvement and
Development
KRB, KURA,KENHA,
KERRA, KWS,CDF
Funding of road
works in the county
Project duplication Share work plans before
allocation of funds
Housing and Urban
Development
N.C.A,KPLC
Environment and
Public Health
Inspection and
maintenance
Project delay Good consultations prior
to project
implementation
Public Works
Services Delivery
Improvement
All Inspection,
supervision and
implementation
Project delay Good feasiability studies
at conception level.
Flagship/County Transformative Projects
Project
Name
Location Objective Output/
Outcome
Performance
Indicators
Timeframe
(Start-
End)
Implementing
Agencies
Cost
(Ksh.)
Smart Towns
Initiative
Nanyuki
Nyahururu
Rumuruti
Kinamba
Wiyumiririe
Kinamba
Oljabet
Naibor
Dol Dol
Well
developed
and
managed
urban
centres
Implementation Stakeholder
meetings
held
January
2018-
December
2018
Department of
Lands
Upgrading of
2000km of
feeder roads
to all weather
status

Laikipia County Integrated Development Plan 2018-2022 Page 85
Development
of the County
Spatial plan
Digitization
of the Land
Registry
Registration
of 10000
Title deeds
Establishment
of a GIS Lab
Upgrading of
existing
Housing
units and
development
of new
Housing
units.

Laikipia County Integrated Development Plan 2018-2022 Page 86
AGRICULTURE, LIVESTOCK AND FISHERIES
Sector name:
Agriculture, livestock and fisheries
Subsectors names
Crops
Irrigation
Livestock production
Veterinary services
Fisheries development
Sector Vision
An innovative and commercially oriented agriculture
Sector Mission
To facilitate agricultural transformation in the county from subsistence production to viable
commercial enterprises
Sector Goal
To transform agriculture, livestock and fisheries into commercially oriented enterprises
that ensure sustainable food and nutrition security
To provide a framework to support and intensify cooperation and consultation between
the national and County Governments and among other stakeholders for enhanced
development of agriculture
Sector Development Needs, Priorities and Strategies Table #
Development Need Priorities Strategy
Food and nutrition
security
To attain household and
county food and nutrition
security through
innovative and sustainable
interventions linked to the
counties long-term
development targets.
-Improve access to affordable inputs in agriculture, livestock and
fisheries.
-Promote use of modern technologies to increase food and feed
production.
-Develop and promote production and utilization of diversified
food resources.
-Develop, manage and sustainably use of agriculture, livestock
and fisheries resources
-Ensure that there is a sufficient strategic food and feed reserve
Production and
productivity
To improve and intensify
agricultural production
-Disease and pest control
-Early warning system
-Promotion and development of private sector lead input supply
-Enhance extension services and technical advisory
-Enhance technology transfer and adoption
Agricultural Inputs To increase production and
productivity in agriculture,
livestock and fisheries
using appropriate, quality
and affordable inputs
- Make provision for access of quality and affordable inputs for
use along commodity value chains
- Strengthen input and equipment surveillance mechanisms to
ensure compliance with set standards
-Promote manufacturing of agricultural inputs locally and
provide appropriate incentives to attract investors.
Extension services
To facilitate promotion of
appropriate and cost-
-Support the development and packaging of transformative
agricultural technologies, information and business opportunities

Laikipia County Integrated Development Plan 2018-2022 Page 87
effective extension
services for different
ecological zones.
in the Agricultural Sector.
-Support Public-Private Partnerships for development of
extension services.
-Strengthen research - extension liaisons to accelerate
dissemination of research outputs.
-Support establishment of an Agricultural Training Centre
Post- harvest losses
To minimize post- harvest
losses in Agriculture,
livestock and fisheries
-Adopt appropriate technologies that reduce post-harvest losses
-Promote appropriate on farm and community storage
-Develop capacity for value chain prayers in post-harvest
management
- Promote public-private partnership for post-harvest management
Market access and
marketing
To promote and facilitate
marketing of high quality
agricultural products in the
domestic and external
markets at competitive
prices
-Develop, improve and maintain markets, rural access roads,
appropriate energy sources and water supply.
- Develop and expand sustainable market information systems
that are accessible to all stakeholders.
-Ensure compliance with product safety and quality standards.
-Support the formation of producer marketing organizations to
achieve sustainable market supplies and ease product
certification.
-Intensify product branding and traceability to assure consumers
and access regional and international markets
- Promote warehousing receipt system.
-Promote supplier development programmes such as contract
farming
Agribusiness and Value
Addition
To promote agribusiness
and value addition
- Support development of cottage industries for processing and
value addition to agricultural produce
- Develop capacity of producers and/or producer groups/
organizations to undertake agribusiness and value addition
- Promote Public Private Partnerships in agribusiness and value
addition.
-Support producers in bulking of agricultural produce
-Promote research and development in value addition of
agricultural produce
Information and Data
Management
To empower agricultural
value chain actors through
effective communication
and sharing of information
-Support and develop mechanisms to continuously gather
agricultural information for management of the sector
- Promote use of ICT in agricultural services to improve
communication and data management and sharing.
- Support provision of timely and reliable information on
agriculture, livestock and fisheries resources
Sustainable Land Use
for Agriculture,
Livestock and Fisheries
To provide for
economically viable,
socially equitable and
environmentally
sustainable use of land for
agriculture, livestock and
fisheries
- Identify, map and regulate zones for agricultural practices in
terms of type of resource, systems, climatic and ecological
diversities.
- Promote establishment and maintenance of a center for
demonstration of appropriate land use
- Promote soil and water management programs
Table 11: Sector Programmes
Programme Name: Administrative and Support Services
Objective:
Outcome:
Sub
Programme
Key Outcome Baseline Key
performance
indicators
Planned Targets Cost
Ksh
(000) Year
1
Year
2
Year
3
Year
4
Year
5
Administrativ
e services
Improved
service
delivery
17,600 19,360 21,000 22,500 25,000 105,460

Laikipia County Integrated Development Plan 2018-2022 Page 88
Agriculture
sector
extension
management
Improved
sector
coordination
9,900 10,890 12,000 13,000 15,000 60,790
Programme Name: Crop Development
Objective: To increase agricultural productivity and production
Outcome: Increased income from farming enterprises
Sub
Programme
Key Outcome Baseline Key
performance
indicators
Planned Targets Cost
Ksh
(000) Year
1
Year
2
Year
3
Year
4
Year
5
Land and crop
productivity
enhancement
and
management
Improved land
and crop
productivity
30% % adoption of
improved crop
production
technologies
35 40 50 65 75
253,314
Strategic food
security
services
Improved
access to
quality
farming inputs
40% % farmers
accessing quality
farm inputs
45 50 60 70 90 56,207
Agribusiness
and
information
management
Increased
income from
farming
activities
20% % adoption of
improved farming
and value addition
technologies
25 30 40 50
60 174,843
Programme Name: Livestock resource development and management
Objective: Improve livestock productivity and incomes from livestock based enterprises
Outcome: Improved livestock productivity and household incomes
Sub
Programme
Key
Outcome
Baseline Key
performance
indicators
Planned Targets Cost
Ksh
(000) Year
1
Year
2
Year
3
Year
4
Year
5
Livestock
resource
development
and
management
Increased
productivity
of the
livestock
enterprises
20% %adoption of
improved
livestock
production
technology
25% 30% 40% 50% 70%
400,000
Promotion of
value addition
and marketing
Increased
incomes
10% %adoption of
value addition
15% 20% 30% 40% 60% 400,000
Programme Name: Veterinary services management
Objective: Improve and maintain livestock health for livestock market access
Outcome: Reduced incidences of livestock diseases
Sub
Programme
Key Outcome Baseline Key
performance
indicators
Planned Targets Cost
Ksh
(000) Year
1
Year
2
Year
3
Year
4
Year
5
Animal
Health and
Disease
Managemen
t Control
Livestock
products,
value
addition and
marketing
Reduced
incidences of
livestock
disease
outbreaks
30% % vaccination
coverage
40%
54M
55%
74.25M
65%
87.4M
80%
107M
80%
107M
429,700
Increased
compliance with
livestock
movement
control
50% % of livestock
keepers /traders
acquiring
livestock
movement
permits
60%
1,000
70%
1,000
80%
1,000
90%
1,000
100%
1,000
5,000

Laikipia County Integrated Development Plan 2018-2022 Page 89
Reduced
incidences of
tick-borne
diseases
10% % of functional
community dips
15%
2,000
20%
2,000
25%
2,000
30%
2,500
35%
3,000
11,500
Disease free
compartments
established
No of surveys
done;
No. of livestock
traders trained;
No of
stakeholders
trained
1
2
2
250,000
No of disease free
compartments
established
0 1 1 1 1
Operational
slaughter houses
and Leather
cottage
industries
established
2017
Status
No of operational
slaughterhouse
Tonnes of leathers
tanned
2,000 2,500 3,000 3,500 4,000 15,000
Easily
identifiable
livestock/
reduced
rustling/traceabi
lity/GAP
No. of livestock
fitted with
electronic and
mechanical
branding.
2,000 2,000 2,000 2,000 2,000 10,000
Quality
assurance
and
regulatory
services
Increased
compliance with
set standards
60% % compliance
70%
1,000
75%
1,000
80%
1,000
90%
1,000
100%
1,000
5,000
Programme Name: Aquaculture Development and Management
Objective: To Increase Fisheries Production and Productivity
Outcome: Improved Livelihood and Nutrition (Alternative Protein Source)
Sub
Programme
Key Outcome Base
line
Key
performance
indicator(s)
Planned Targets Cost
Ksh
(000) Year
1
Year
2
Year
3
Year
4
Year
5
Aquaculture
development
and
management
Improved
livelihood&
nutrition(Altern
ative protein )
20T -Quantity
harvested
(TONNES)-
Incomes
generated (KES.)i
9 13 18 24 32
40,154
Fish market
development
and regulatory
services
Formalized and
regulated
marketing
system
30% Percentage (%)
level of
compliance by
actors
60 70 80 90 100
Programme Name: Irrigation Development and Management
Objective: To increase crops production for food security and income generation
Outcome: increased land productivity, income and employment opportunities
Sub
Programme
Key Outcome Base
line
Key performance
indicators
Planned Targets Cost
Ksh
(000) Year
1
Year
2
Year
3
Year
4
Year
5
Water
Harvesting
Increased no
of H/H
accessing
water for
1% % H/H accessing
irrigation water from
water harvesting
technologies like
2% 3% 4% 5% 6% 150,000

Laikipia County Integrated Development Plan 2018-2022 Page 90
irrigation
through water
harvesting
technologies
farm ponds, shallow
wells, water pans,
Earth dams etc
Promotion of
water efficient
irrigation
technologies
Increased H/H
benefiting
using Efficient
water
irrigation
technologies
1% % of H/H using
efficient water
application
technologies for
crops production eg
drip irrigation, solar
pumping
2% 3% 4% 5% 6% 100,000
Development
of irrigation
infrastructures
and Systems
Increased H/H
benefiting
from irrigation
schemes
0.5% % of H/H benefiting
from irrigation
schemes Developed/
rehabilitated
1.5% 2% 2.5% 3% 3.5% 75,000
Cross -Sectoral Impacts
Programme Name Sector Cross -Sector Impact Measures to
Harness or
Mitigate Impact Synergies Adverse impact
Livestock resource
development
Water Provision of water for livestock
use
Crop development Water Provision of water for irrigation
Aquaculture development Water Provision of water for fish
farming
Promotion of value addition
and marketing
Trade Development and improvement of
marketing infrastructures
Promotion of value addition
and marketing
Cooperative Mobilization of farmers into
cooperatives, capacity building
and regulations
Veterinary services
management
Health Control of zoonotics
Food safety (meat inspection)
Crop, Livestock resource and
Aquaculture development
Health Promotion of health and nutrition
Livestock resource
development
Tourism Sport fishing
Camel derby
Crop, Livestock resource and
Aquaculture development
Education Nutrition for learners in education
institutions
Raising school fees
Training on agribusiness in
polytechnics
Flagship/Transformative Projects
Project Name Location Objective Output
/Outcome
Performance
indicators
Time frame
(start -End)
Implementing
Agencies
Cost
Ksh
(000)
Contract
farming
County
wide
Farming
becomes a
profitable
business
-Farmers
database
-marketing
organization
s formed
-on farm
value
addition
-Laikipia
beef brand
attained
-Farmers
monthly
incomes
>Ksh20,000
- More than
10,000 farmers
registered for
contract farming
2018/19-
2022/23
DALF 107,000

Laikipia County Integrated Development Plan 2018-2022 Page 91
Feed lots Rumuruti,
Salama,
Sosian,
Mukogodo
Increase
livestock
productivity
5,000 cattle
fattened and
sold
annually
Number of
livestock
fattened
2018/19-
2022/23
DALF 250,000
Disease free
compartments
Private and
Governme
nt ranches
Olpajeta,
Olmaisor,
Kifuko
ADC
Mutara
To maintain
livestock
health for
market access
Access to
regional and
international
market
Number of
disease free
compartments
created
2018/19-
2022/23
DALF 40,000
Add
200,000
(ADC
240,000
)
Pasture and
Fodder
establishment
Hay
commercializa
tion
2,000 acres
put under
hay per year
Hay acreage
planted
2018/19-
2022/23
DALF 600,000
Agri-tourism One model
farm per
ward
Extra income
from model
farms
15 model
farms
Number of
operational
model farms.
Number of
visitors to the
model farms per
year
2018-2022 DALF 30,000
Cage fish
farming
Ndindika
dam etc.
Increased fish
production3
Fish yield
per cage in
Kgs
Number of fish
cage farms
2018-2022 DALF 25,000
Ending
Drought
Emergencies
(EDE)
Range
reseeding
200 acres
per year
Acreage under
reseeding
2018-2022 DALF 25,000
Livestock
identification
60 % of the
total cattle
identifiable
Number of
livestock
registered
2018-2022 DALF 50,000
Slaughter
houses
construction/i
mprovement
2 Modern
slaughter
houses
constructed
No constructed 2018-2022 DALF 100,000
Drought
escaping crops
Drought
escaping
crops
introduced
% number of
crop farmers
that have
adopted DECs
2018-2022 DALF 25,000
Promote
conservation
agriculture
Increased
adoption of
CA
Number of
farmers
practicing CA
2018-2022 DALF 100,000

Laikipia County Integrated Development Plan 2018-2022 Page 92
HEALTH
Sector Name:
Medical services and public health
Sector Composition:
Curative health services
Preventive and promotion health services
Sector Vision
A healthy and productive county
Sector Mission
To build a responsive client centered and evidence based health system for accelerated
attainment of highest standard of health to all in Laikipia County
Sector Goal
To provide efficient, cost effective and accessible health and sanitation services and
accountability for quality public service delivery
Sectors Objectives;
Reduction of burden of communicable conditions
Reversing the rising burden of non communicable conditions
Reduce the burden of violence and injuries
Provision of universal healthcare (UHC)
Minimize exposure to health risk factors
Strengthen collaboration with other sectors
Sector Development Needs, Priorities and Strategies Table #
Development Need Key priority areas Policy Strategy/activity
Access to Universal
Health Care
Improve access to Quality
and Affordable Healthcare
-Increase county wide enrolment to NHIF
-Upgrade range of services in health centres(Oljabet ) to include
maternity and laboratory
-Upgrade 2(Nyahururu and Nanyuki hospitals) facilities to level 5
hospital
-Upgrade 4(Doldol, Ndindika, Lamuria and Rumuruti) sub-
county facilities to level 4 hospitals
Expand the role of
Primary Health Care
Strengthen preventive/
promotive health services
across the county
-Upscale the role of CHVs
-Improve Primary and preventive healthcare, enforce proper
collection and disposal of solid and liquid waste
-Improve maternal and Child Nutrition
-Improve the Nutrition of the general population

Laikipia County Integrated Development Plan 2018-2022 Page 93
Table 11: Sector Programmes
Program Name - General Administrative and Planning Services
Objectives - Strengthen leadership and management
Outcome: Responsive health leadership and governance
Sub-Programme Key
Outcomes
Base
line
Key
Performance
Indicators
Planned Target Cost
Ksh
(000) Year
1
Year
2
Year
3
Year
4
Year
5
Human Resources
development
Adequate,
efficient,
responsive
and
accountable
health
workforce
300 No of health
workforce
trained
50 50 50 50 50 50,000
1100 Additional
staff recruited
40 40 40 40 40 -
Health, policy,
Governance,
planning and
financing
Efficient and
effective
utilization of
financial
resources
60% % of resources
mobilized and
utilized
5% 5% 5% 5% 10% 270,000
Expanded
scope of
healthcare
delivery
across
facilities
4
facilities
No of
facilities
accredited by
NHIF
2 2 2 2 2 10,000
Health
information,
standards and
quality assurance
Quality
Standardized
care
provided by
all health
facilities
50% No of SOPs
and
regulations
developed and
disseminated
10% 10% 10% 10% 10% 50,000
Research
translated
into policy
0 No of research
projects
completed
2 2 2 2 2 10,000
Improved
and reliable
health
information
system
40% Improved data
collection,
storage,
retrieval and
analysis
50% 60% 70% 80% 90% 50,000
Programme Name - Curative and Rehabilitative Health Program
Objectives -Provide essential health services addressing control of communicable diseases and managing the rising
burden of non-communicable conditions
Outcome-Effective and efficient curative and rehabilitative health services
Sub-Programme Key Outcomes Base
line
Key
Performance
Indicators
Planned Target Cost
Ksh
(000) Year
1
Year
2
Year
3
Year
4
Year
5
Health products
and technologies
support services
Adequate
essential
medicines and
medical supplies Improved
diagnostic
capacity in
health facilities
70% No commodity
stock-outs in
our health
facilities
5% 5% 5% 5% 5% 1Bn
50% No. of facilities
adequately
equipped
5% 10% 10% 10% 5% 1Bn
Health training
centre
Functional
training
10% Number of
students
10% 10% 10% 10% 10% 250,000

Laikipia County Integrated Development Plan 2018-2022 Page 94
infrastructural
development Health
infrastructure
development &
improvement
institutions at
Nyahururu and
Nanyuki
(KMTCs)
enrolled.
Improve the
range and
quality of health
services offered
across the
county
50% No of additional
operational
facility units
constructed/ren
ovated
5% 5% 10% 10% 5% 600,000
Emergency
referral and
rehabilitative
services
Efficient and
coordinated
emergency/amb
ulatory and
referral services
in the county
40% No of
functional
ambulances and
emergency
units
10% 10% 10% 10% 10% 100,000
Programme Name - Preventive Health Services
Objectives - Provide essential health services addressing elimination of communicable diseases, halting the rising burden
of non-communicable conditions and reducing the burden of violence and injuries
Outcome- A healthy population free of communicable and non-communicable conditions
Sub-Programme
Key
Outcomes
Base
line
Key
Performance
Indicators
Planned Target() Cost
Ksh
(000) Year
1
Year
2
Year
3
Year
4
Year
5
Family planning,
Maternal and
child health
services
Improved
maternal/
child health
status
21% % reduction in
maternal/child
morbidity and
mortality
18% 15% 12% 10% 8% 100,000
Non-
Communicable
diseases control
and prevention
Reduced
burden of
NCDs
30% % reduction in
prevalence of
NCDs in the
county
25% 21% 17% 15% 14% 25,000
Health
promotion: Public
health services,
Nutrition
services,
Community
health strategy,
advocacy and
surveillance
Improved
nutrition
status
11% % reduction in
prevalence of
malnutrition
cases
10% 9% 8% 7% 6% 25,000
Improved
community
health
linkages
18
units
No of
community
units established
, No of
community
health
volunteers
employed
30
Units
20
Units
10
Units
10
Units
10
Units
250,000
Population
with
minimal
preventable
risk factors
and illnesses
50% % reduction in
prevalence of
preventable
conditions in the
county
40% 30% 25% 20% 15% 25,000
Improved
healthy
lifestyle
50% No of health
promotion
activities
undertaken
10% 5% 5% 5% 5% 25,000
TB/HIV/AIDS
prevention and
control
Reduce
burden of
TB/HIV
diseases
59% treatment
success rates
TB/HIV
diseases
65% 75% 80% 85% 90% 500,000

Laikipia County Integrated Development Plan 2018-2022 Page 95
Social health
insurance
scheme:
Universal health
coverage
Reduced
catastrophic
out of
payment for
health
services
35% No of
households
enrolled to
social health
insurance
(NHIF)
50% 60% 70% 80% 90% 500,000
Cross-Sectoral Impacts Programme
Name
Sector Cross -Sector Impact Measures to
Harness or Mitigate
Impact Synergies Adverse impact
Preventive Health
Services
Agriculture,
livestock and
fisheries
Diversification & increase
production of nutrient dense crop
and small scale livestock
production
High
malnutrition
rates
Joint campaigns and
sensitizations
Improve processing storage &
preservation to retain nutritional
value and food safety to reduce
seasonality and post-harvest
losses and to make healthy foods
convenient to prepare
Enhance enrolment to national
social health insurance (NHIF)
Catastrophic out
of pocket
payment of
health services
Mass enrollment
campaigns and
subsidized payment
for vulnerable
households
Control of Zoonotics High prevalence
of Zoonotics
Joint campaigns and
vaccinations
Preventive Health
Services
Water, environment
and natural
resources
Collaboration with health
department on water safety
High prevalence
of diarrheal
diseases
Water quality
assessment and
treatment
Advocate for strengthening of
early warning systems with
environment department
Malnutrition
and missed
opportunity for
immunization
Mobile clinics to
ensure pastoral
communities are
reached
Enhance enrolment to national
social health insurance (NHIF)
Catastrophic out
of pocket
payment of
health services
Mass enrollment
campaigns and
subsidized payment
for vulnerable
households
Preventive Health
Services
Education, Gender,
Culture, Sports and
ICT.
Strengthening good feeding
practices in school
High
malnutrition
rates
Joint campaigns,
sensitizations and
School feeding
program
Enhance school health program High
malnutrition
rates
Joint campaigns,
sensitizations and
School feeding
program
Enhance enrolment to national
social health insurance (NHIF)
Catastrophic out
of pocket
payment of
health services
Mass enrollment
campaigns and
subsidized payment
for vulnerable
households
Preventive Health
Services,
Curative and
Rehabilitative
Infrastructure,
lands, housing, road
and public works
Improve accessibility to health
facilities
Delayed referral
of patients
Engage infrastructure
department to make
all health facilities
accessible

Laikipia County Integrated Development Plan 2018-2022 Page 96
Health Program Increase electricity supply to
facilities
Poor cold chain
management of
vaccines
Engage the
infrastructure
department to
connect all health
facilities to electricity
Enhance enrolment to national
social health insurance (NHIF)
Catastrophic out
of pocket
payment of
health services
Mass enrollment
campaigns and
subsidized payment
for vulnerable
households
Trade and Social
services
Enhance enrolment to national
social health insurance (NHIF)
Catastrophic out
of pocket
payment of
health services
Mass enrollment
campaigns and
subsidized payment
for vulnerable
households
Preventive Health
Services,
Curative and
Rehabilitative
Health Program
Finance and
Economic planning
Enhance enrolment to national
social health insurance (NHIF)
Catastrophic out
of pocket
payment of
health services
Mass enrollment
campaigns and
subsidized payment
for vulnerable
households
Curative and
Rehabilitative
Health
Public Service and
County
administration
Rehabilitative care for drug and
substance abuse
Low levels of
productivity
Advocacy and
treatment
Preventive Health
Services,
All the sectors Mainstreaming HIV/AIDS and
health wellness program
High incidence
rate
Advocacy, testing
and enrollment for
treatment
General
Administrative
and Planning
Services
Finance and
Economic planning
Resource mobilization Poor service
delivery
Proposal writing and
accountability
County public
service board
Recruitment, promotions
deployment and disciplinary of
health workers
Shortage and
de-motivated
workforce
Indent preparation
and need assessment
Flagship/transformative projects Project name Location Objective Outcome/
output
Performance
indicators
Time
frame
(start-end)
Implementing
agencies
Cost
Ksh
(000)
Social health
insurance
County
wide
To reduce
theburden
of out of
payment
for health
services
Enhance
enrolment to
national
social health
insurance
(NHIF)
No of persons
enrolled
2018-2022 Health department,
Office of the
Governor, Social
services
department,
AMREF, NHIF,
Finance department
250,000
Upgrading of
four facilities
to level 4
status
Lamuria,
DolDol,
Ndindika
and
Rumuruti
To expand
range and
quality of
services
Functional
level four
status
hospitals
No of
hospitals
upgraded
2018-2022 Health,
infrastructure and
Finance
departments
200,000
Establishment
of 2 medical
training
institutions
Nanyuki
and
Nyahururu
To
increase
number of
health
personnel
Functional
training
institutions
at
Nyahururu
and Nanyuki
(KMTCs)
No of training
institutions
established
2018-2022 KMTC, Health,
infrastructure and
Finance
departments
200,000,

Laikipia County Integrated Development Plan 2018-2022 Page 97
TRADE, TOURISM, ENTERPRISE and CO-OPERATIVES
Sector Name
Trade, Tourism, Enterprise and Co-Operatives
Subsector Name
Trade and Investment Development
Tourism and Film
Co-operative Development
County Enterprise Development Fund and County Co-operative Revolving Fund
Sectors Vision
To be a model, robust, diversified and competitive sector for trade, tourism, cooperative, and
investment for wealth and employment creation in the county.
Sector Mission
To create an enabling environment that ensures enhanced and sustainable industrial, trade, co-
operative and tourism growth through capacity development, innovativeness and marketing.
Sector Goal:
The Sector intends to focus on job and wealth creation, making Laikipia a leading tourism
destination, strengthening capital base of co-operatives and enacting favorable business
regulations and policies
Sector Development Needs, Priorities and Strategies Development Needs Priorities Strategies
Job and Wealth Creation -Creation of 30,000 jobs targeting
youth
-Promote local manufacturing
-Capacity building on entrepreneurial
skills
-Agri-business, agro-tourism and
MSMEs
-Up scaling of enterprise and cooperative revolving
funds
-Setting up of cottage industries
-Enacting favorable business regulations and
policies
-Training and marketing partnerships with large
businesses
-Start up business incubation and innovation centers
-Contract farming
Destination Laikipia -Make Laikipia a leading wildlife
tourism destination
-Make Laikipia a preferred choice for
establishing holiday homes, weekend
rest and relaxation destination, and
conferencing destination
-Achieve 10% growth in Tourism
numbers
-Grow domestic tourism by 15%
-Tourism information
-Legal frameworks
-Establish credible tourism data
-Mapping all tourist establishments by GPS
-Infrastructural support of tourist establishments
-Extensive marketing and promotion of destination
Laikipia
-Branding destination Laikipia
-Enhance sports, cultural, entertainment,
conference, research and adventure tourism
-Setting up tourism information center
-Enact favorable tourism laws and regulations
Cooperative growth and
development
-Membership, capital and asset base
-Value addition
-Marketing channels and systems
-Compliance, audit and zero collapse
rate
-Strengthen cooperative capital asset and
membership
-Enhance auditing and compliance
-Enhance value chain development
-Promote marketing linkages and partnerships

Laikipia County Integrated Development Plan 2018-2022 Page 98
-Savings mobilization
-Innovation and research
-Cooperative policy
-Education, training, and information
-Up-scaling cooperative revolving funds
-Intensify education, training and information
-Savings mobilization
-Enhance research and industrial development
-Setting up of cottage industries
-Develop comprehensive cooperative policy
Trade Development -Market infrastructural development
-Legal frameworks
-Capacity building on entrepreneurial
skills
-Fair trade and consumer protection
-Business information centers
-Value addition
-Innovation and product development
-Investment and trade promotion
-Construction of new markets and market kiosks
-Mapping of all industrial parks
-Rehabilitation of the existing market structures
-Operationalization of all existing green produce
and cereal markets
-Enact conducive business laws and regulations
-Extensive trade promotion and marketing
-Intensify trainings on entrepreneurial skills and
management
- Source and facilitate markets linkages for
livestock & livestock products, as well as agro-
products
-Standardization and calibration of weighing and
measuring equipment
- Profiling of all business and investment
opportunities for industrial development
-Set up business information centers
-Setting up of cottage industries and agro-
processing plants for value addition
-Business consultative fora
Sector Programs
Sector Program; Administration ,Planning and Support services
Core Objective: Ensure efficient and effective delivery of services
Outcome: Efficient and effective service delivery
Sub Programme Key
Outcome
Baseline Key
performance
Indicators
Planned Targets Cost
Ksh
(000) Year
1
Year
2
Year
3
Year
4
Year
5
Administration
services
Efficient and
effective
delivery of
services
80% Services
rendered
85% 90% 95% 100% 100% 50,000
Finance services Efficient and
effective
delivery of
services
80% Services
rendered
85% 90% 95% 100% 100% 50,000
Departmental law
and policy
development
Improved
legal and
business
environment
4 No. of laws
and
regulations
enacted
2 2 1 1 1 25,000
Sector Program; Trade Development and Promotion
Core Objective; Improve business environment and promote enterprise and entrepreneurship development
Outcome: Improved and conducive business environment
Sub
Programme
Key Outcome Baseline Key
performance
Indicators
Planned Targets Cost
Ksh
(000) Year
1
Year
2
Year
3
Year
4
Year
5
Market
Infrastructural
development
Improved
business
infrastructures
17 No. of markets
developed
5 5 5 5 5 300,000

Laikipia County Integrated Development Plan 2018-2022 Page 99
Enterprise
Development
Fund
Increased
enterprise
opportunities
1200 No. of
enterprises
funded/
individuals
4000 6000 6500 7000 7500 1,000,000
Metrological
lab-weight and
measure
Strengthened fair
trade and
consumer
protection
1200 No. of
businesses
standardized
1900 2100 2300 2700 3000 100,000
Industrial
development
and Investment
Promotion
Enhanced Job and
wealth created
- No. of cottage
industries
established
2 3 3 4 5 200,000
Informal sector
development
Enhanced Job and
wealth created
344 No. of artisans 300 400 420 450 500 150,000
Sector programme; Tourism Development and Promotion
Core Objective; Promote tourism development for the county’s economic growth
Outcome: Increased tourism arrivals and revenue generation
Sub
Programme
Key Outcome Base
line
Key
performance
Indicators
Planned Targets Cost
Ksh
(000) Year
1
Year
2
Year
3
Year
4
Year
5
Tourism
Promotion and
Marketing
Increased
tourism
arrivals and
revenue
generation
86,000 No. of tourists 90,00
0
95,000 105,000 110,000 120,000 300,000
Tourism
Infrastructure
Development
Improved
tourism
infrastructures
2
No. of tourist
sites
developed
4 5 5 5 6 300,000
Sector Program; Co-operative Development and Marketing
Core Objective; Ensure a robust and competitive co-operative movement to drive the county’s economy
Outcome: Competitive and robust co-operative movement in the county
Sub
Programme
Key Outcome Base
line
Key
performance
Indicators
Planned Targets Cost
Ksh
(000) Year
1
Year
2
Year
3
Year
4
Year
5
Cooperative
development
and promotion
Improved
cooperative
asset base
2016/
17 data
No. of
societies
registered,
trained and
revived
20 25 30 30 35 100,000
Cooperative
revolving fund
Increased Job
and wealth
created
2016/
17 data
No. of
cooperatives
funded
60 72 75 80 85 500,000
Cooperative
auditing and
compliance
Enhanced
compliance and
accountability
2016/
17 data
No. of audited
accounts and
inspections
70 75 80 90 95 50,000
Cooperative
research and
industrial
development
Increased and
diversified
economic
ventures
2016/
17 data
No. of
ventures and
innovations
3 3 3 3 4 100,000
Savings
Mobilization
Increased
cooperative
working capital
and asset base
2016/
17 data
Amount of
savings
mobilized
150M 200M 260M 280M 300M 50,000

Laikipia County Integrated Development Plan 2018-2022 Page 100
Cross-Sectoral impacts
Programme
Name
Sector Cross-Sector Impacts Measures to Harness Or Mitigate the
Impact Synergies Adverse Impacts
Trade
Development
and promotion
-Trade
-Administration
-Health
-Finance
-Agriculture
-Sanitation
-Disaster
-Enforcements
-Licensing
-Insecurity -Drainage improvement
-Improve emergency responses/ security
-Enhance legal frameworks and
enforcement for business
-Department of trade and finance should
work closely in formulating licensing
charges
Tourism
Development
and Promotion
-Administration
-Environment
-Tourism
-Livestock
-Insecurity -Enhance protection of conservancies
and private ranches
Cooperative
Development
and marketing
-Agriculture and
Livestock
-Finance
-Value addition
-Licensing
-Collaboration in establishing value
addition chains
Flagship/ Transformative Projects
Project
Name
Location Objective Output/
Outcome
Performance
Indicators
Timeframe
(Start-End)
Implementing
Agencies
Cost
Ksh (000)
Enterprise
Fund
County
wide
job and wealth
creation
increased
enterprises
opportunities
No. of
Enterprises
Funded
5 years Directorate of
Trade and
Enterprise
Fund
650,000
Cooperative
Revolving
Fund
County
wide
job and wealth
creation
increased
enterprises
opportunities
No. of
cooperatives
funded
5 years Directorate of
cooperatives
and
Cooperative
Revolving
Fund
300,000
Destination
Laikipia
County
wide
Achieve 10%
growth each
year in
tourism
numbers and
grow domestic
tourism by
15%
Increased
tourist
arrivals and
revue
generated
No. of tourists 5 years -Directorate of
Tourism
-LWF
-KWS
-KTB
-CETRAD
Developmen
t of
Industrial
and
manufacturi
ng
Zones
Nanyuki,
Nyahururu,
Rumuruti
town and
other
To Harness
the
resources
available
for
production
Job creation No of agro-
processing and
cottage
industries
established
5 years -Department
of Trade,
Tourism and
Cooperatives
-Department
of Agriculture
and Livestock
-Private-
Public
Partnerships
150,000

Laikipia County Integrated Development Plan 2018-2022 Page 101
WATER, ENVIRONMENT AND NATURAL RESOURCES
Sector Name
Water, Environment and Natural Resources
Subsector Names
Water and Sanitation Subsector ( County Government department of water, NAWASCO,
NYAWASCO and other water service providers), Water Development, Operation and
Maintenance and Catchment Protection sections.
Environment and Natural Resources Sub-sector
Forests, Wildlife, Solid waste management, Soil conservation sections.
Sector Vision
‘A water secure county in a clean, safe and sustainable environment’’.
Sector Mission
To provide clean and safe water in adequate quantities and sanitation services in a sustainable
natural environment through partnerships and collaborations.
Sector Goal
Clean, secure and sustainably managed environment and water resources
Sector Development needs, Priorities and Strategies Issues Priorities Strategies
Inadequate water
supply
-Increase water access from the current 30% to
50% by 2021
-Reduce the distance to water points from 5km to
3 km by 2021
-Improve water and sanitation in informal
settlements (Manguo, Likii, Majengo and
location) by 2021
-Drilling and equipping of Boreholes,
-Enhance rain water harvesting and storage
technologies(roof harvesting),
-Construction of mega dams and 4 large dams
each with 1,000,000m3 capacity per
constituency,
-Formulate Laikipia Water Management
Master plan,
-Rehabilitation of existing boreholes and
desilting of dams and water pans,
-Expansion/rehabilitation of water supply and
sewerage systems in urban and rural areas
Degraded water
catchment areas
-Protect catchment areas to enhance water and
environmental resources
-Rehabilitate degraded catchment areas via
afforestation and reclaim riparian areas
-Rehabilitation of springs
-Water catchment policy formulation and
enactment of a bill
-Capacity build the WRUAS and CFAs
Human Wildlife
Conflict
-Reduce/minimize Human Wildlife Conflict -Erection and maintenance of electric fence
Rangeland
Degradation
-Eradication of invasive species
-Reseeding degraded lands
-Integrated approach via mechanical, manual
and biological methods
-Grazing plans and deferment
Low County Tree
Cover
-Achieving the constitutional 10% tree cover
requirement
-Greening schools and other institutions
-Urban forestry, agro forestry and
afforestation
Inadequate solid
waste management
system
-Clean and secure environment
-Smart, clean towns
-Incentivizing waste management
-Litter bins for waste segregation.
-Recycling, Re-use and reduction of waste

Laikipia County Integrated Development Plan 2018-2022 Page 102
paper
-Create awareness on need to live in clean
environments
-Re-use, recycle and reduce e-waste.
Climate change
vagaries
-Climate change adaptation and mitigation -Capacity building and advocacy
-Reduce green-house gases emission
-County-based climate change policy
Sector Programmes Programme Name: General Administration, Planning and Support Services
Objective: To promote good governance in the management of water resources and environment components
Outcome: Improved service delivery
Sub
Programme
Key
Outcome
Base
line
Key
Performance
Indicators
Planned Targets Cost
Ksh
(000) Year
1
Year
2
Year
3
Year
4
Year
5
Administrative
services and
Planning
services(M&E)
Improved
service
delivery
30% No. of people
served
No. of operations
supported
5% 5% 5% 5% 5% 150,000
Strategic Project
Monitoring and
intervention(En
ding Drought
Emergencies-
EDE)
Reduce
drought
emergencies
10% No. of people
served
No. of operations
supported
10% 10% 10%
10% 10% 100,000
Programme Name: Water Development
Objective: To enhance accessibility of safe and reliable water and sanitation services
Outcome: Increased access to clean and safe water and sanitation in Laikipia county
Sub
Programme
Key
Outcome
Base
line
Key
Performance
Indicators
Planned Targets Cost
Ksh
(000) Year
1
Year
2
Year
3
Year
4
Year
5
Urban water,
sanitation
and
sewerage
Increased
access to
clean and
safe water
and
sanitation
in the
urban areas
40% Additional
Households
served with
clean water
2,000 2,000 2,000 2,000 2,000 60,000
30% Additional
Population
with access to
sewerage
5% 5% 5% 5% 5% 590,000
Rural water
supply and
sanitation
Increased
access to
clean and
safe water
and
sanitation
in the rural
areas
30% Additional
Households
served with
clean water
1500 1500 1500 1500 1500
950,000
60% Additional
Population
with access to
sewerage
services
500 500 500 500 500 60,000
Water
Conservatio
n, Protection
and
Governance
Enhanced
water
resources
manageme
nt
60%
degrade
d
Additional
catchment
area protected
2 km2
per
WRUA/
CFA
2 km2
per
WRUA/
CFA
2 km2 per
WRUA/C
FA
2 km2 per
WRUA/C
FA
2 km2
per
WRUA/
CFA
32,000
30% Increased
water storage
capacity Roof-
rainwater
harvesting
4% 4% 4% 4% 4% 10,000

Laikipia County Integrated Development Plan 2018-2022 Page 103
projects at
household and
institutional
levels
1
Policy
Formulate
Water
Masterplan
Water and
Sanitation
policy, water
allocation plan
and
Enforcement
regulations
4 65,000
0 Established
database to
maintain
quantity and
quality
assurance
1 1,000
Programme Name: Environment and Natural Resources
Objective: To ensure clean, safe and secure environment
Outcome: Ensure sustainably Managed and conserved Environment and Natural Resources
Sub
Programme
Key Outcome Base
line
Key
Performance
Indicators
Planned Targets Total
Budget Year
1
Year
2
Year
3
Year
4
Year
5
Solid Waste
Management
To promote
holistic
approach to
waste
management
0 Sound solid waste
management
system and plans
20% 30% 40% 50% 60% 350,000
Human-
Wildlife
Conflict
Prevention
Reduced
incidences of
Human Wildlife
Conflicts
10%
electric
fence
coverage
Incidences of
Human Wildlife
Conflict
10% 10% 10% 10% 10% 250,000
Natural
Resources
Management
Ensure
sustainably
Managed and
conserved
Environment
and Natural
Resources
National
Natural
Resources
Strategy
Natural Resources
Management
strategy
1 0 0 0 0 5,000
Climate
Change
Adaptation
& Mitigation
Reduced
emissions of
Green House
Gases
National
Climate
Change
Policy
County Climate
Change Policy
1 0 0 0 0 1,000
6.9% % of Tree cover 0.5% 0.5% 0.5% 0.5% 0.5% 1.2 B
Cross-Sectoral impacts Programme
Name
Sector Cross-Sector Impacts Measures to Harness or
Mitigate the Impact Synergies Adverse impact
Water
Development
Health
Agriculture
Infrastructure
Education
Finance & Planning
Certification and
Authorization
Technical Advice
and Accessibility
Incomplete, stalled
and Sub-standard
projects
Ghost Projects
Timely budget provisions
for projects
Regular Monitoring,
Supervision and

Laikipia County Integrated Development Plan 2018-2022 Page 104
Research Institutions
(Mpala, CETRAD,
Universities)
Civil
Societies(KWAHO,
GROOTS, LWF, Action
Aid, SNV, CARITAS)
National Government
Institutions(WRA,
WSTF, WSBs, NDMA,
Resilience Programme)
Development
Partners(World Bank,
AFDB, FAO,
SIDA,JICA)
Capacity Building
Financial
Resources
Survey, design,
Innovations and
data
Evaluation of the projects.
Proper consultations and
public
participation/Governance.
Environment and
Natural
Resources
Health
Agriculture
Infrastructure
Education
Finance & Planning
Research Institutions
(Mpala, CETRAD,
Universities,)
Civil
Societies(KWAHO,
GROOTS, LWF, Action
Aid, SNV, CARITAS)
National Government
Institutions( KWS,
NEMA, NDMA,
Resilience Programme,
KFS)
Development
Partners(World Bank,
AFDB, FAO,
SIDA,JICA)
Certification and
Authorization
Technical Advice
and Accessibility
Capacity Building
Financial
Resources
Survey, design,
Innovations and
data
Incomplete, stalled
and Sub-standard
projects
Ghost Projects
Timely budget provisions
for projects
Regular Monitoring,
Supervision and
Evaluation of the projects.
Proper consultations and
public
participation/Governance
General
Administration,
Planning and
Support Services
Finance & Planning
County and National
Financial
Resources
Capacity Building
None None
Flagship/Transformative Projects Project
Name
Location Objective Output/
Outcome
Performance
Indicators
Timeframe
(Start-End)
Implementing
Agencies
Cost
(Kshs.)
(000)
Amaya
Dam
Laikipia
North
Provision
of water
To promote
Inter-county
cohesion and
improve
security
Dam designs
and the dam
itself
2018-2021 Laikipia,
Samburu, Isiolo,
Baringo and West
Pokot counties.
800,000

Laikipia County Integrated Development Plan 2018-2022 Page 105
Nanyuki
dam
Mt.
Kenya
Forest
Provision
of water
Additional
water storage
and supply
% of
consumers
with access to
water
2018-2021 National
Government
2B
Ewaso
Narok dam
Rumuruti
forest
Provision
of water
Additional
water storage
and supply
% of
consumers
with access to
water
2018-2021 National
Government
1.5B
Water
Masterplan
Countyw
ide
Mapping
water
resource to
enhance
planning
and
utilization
Laikipia county
water
masterplan
Sustainable
water
management
1 year County
Government
10,000
Waste
Manageme
nt
Urban
Centers
and rural
markets
with
more
than
2,000
populatio
n
Smart,
clean
Towns
Clean, secure
and safe
environment
Sound solid
waste
management
system and
plans
2018-2021 County
Government &
Donor partners
350,000
Electric
Fence
Countyw
ide
Protection
of lives
and
property
Reduced
incidences of
Human
Wildlife
Conflicts
Incidences of
Human
Wildlife
Conflict
2018-2021 County
Government &
Donor partners
250,000

Laikipia County Integrated Development Plan 2018-2022 Page 106
CHAPTER FIVE
IMPLEMENTATION FRAMEWORK

Laikipia County Integrated Development Plan 2018-2022 Page 107
5.1 Introduction
This section gives an overview of implementation framework in terms of institutional
organogram, resource requirements and their mobilization.
5.2 Institutional Frameworks
The County Government departments in partnership with National Government, private sector,
civil societies and development partners, will implement this plan. Figure XXX outlines the
internal organization flow of the County Government departments and agencies.
Department Name Main Sections
County Administration and Public Service Office of the Governor, Office of the County Secretary, County
Public Service Board, County Administration, Records Management,
Human Capital Development, Public Participation, Public Safety and
Disaster Management, Legal Services
Finance Planning and County Development Treasury Accounting, Economic Planning, Supply Chain
Management, Revenue Board, Budget Management, Internal Audit
Health and Medical Services Preventive Health and Curative Services
Agriculture Livestock and Fisheries Crops Development and Irrigation, Livestock Production, Veterinary
Services, Fisheries Development, Agribusiness
Infrastructure Land and Urban Development Public Works, Housing and Urban Development
Education ICT and Social Services Sports, Youth and Social Services, Education
Trade Tourism and Cooperatives Tourism, Trade, Co-operatives and Enterprise Development
Water Irrigation and Natural Resources Environment and Natural Resources, Water and Sanitation
The role of partners is also outlined in the implementation of the plan.
5.3 Resource Requirements by Sector
This section provides a summary of sectoral budget requirements totaling to KES 44 Billion.
Table 14: Summary of Proposed Budget by Sector
Sector Name Amount (KES) As a percentage (%) of the total budget
County Administration and Public Service Management 20,333,217 ,000 45.82
Agricultural Development 3,002,570,000 4.51
Water, Environment and Natural Resources 7,000,534,000 15.78
Health 3,190,000,000 7.19
Education 1,515,000,000 3.41
Trade 3,275,000,000 7.38
Finance Planning and County Development 1,235,000,000 2.79
Infrastructure 10,860,000,000 8.70
Total 54,352,000,000 100
5.4. Resource Mobilization Framework
The county’s main source of revenue is national exchequer accounting for 81 % of the total
budget. This is complimented by local revenue at 9 %, conditional grants at 9% and the rest from
development partners. Infrastructural development in roads and water, human capital
development in learning institutions as social safety programmes are largely funded by the
national government departments and agencies. Table # shows the revenue projections from
various categories.

Laikipia County Integrated Development Plan 2018-2022 Page 108
Type of Revenue 2018 2019 2020 2021 2022 Total
Local revenue 600 M 720 M 864 M 1,036 M 1,244M 4,465 M
Equitable share 4,949 M 5,444M 5,989 M 6,588 M 7,247 M 34,718 M
Conditional grants 511 M 523 M 537 M 550 M 564 M 2,684 M
Development partners 110 M 121 M 133 M 146 M 161 M 672 M
National Government Departments/Agencies 275M 303 M 333 M 366 M 403 M 1,679 M
Others (Private sector, community initiatives) 22 M 24 M 27 M 29 M 32 M 134 M
Total 6,467 M 7,135 M 7,883 M 8,715 M 9,651 M 54,352 M
*M=Million KES
In view of this, resource mobilization strategies on revenue, asset management, capital financing,
debt management and financial management are outlined for effective implementation of this
plan.
5.4.5 ESTIMATED RESOURCE GAP AND MEASURES OF ADDRESSING IT
5.4.5.1 Financial Strategy
The county government will create elaborate financial strategies to ensure sustainable resourcing
for implementation of the development plan. These strategies will include the following:
5.4.4.2 Revenue Raising Strategies
The county government will aggressively enhance its internal and external revenue sources.
i) Internal Revenue Raising Strategies
With regard to internal revenue sources, the county government will pursue the following
strategies:
i. Increasing the revenue base by consolidating all classes of taxes collectable by the county
government under one revenue base
ii. Establishing institutional framework for county tax administration
iii. Increasing efficiency in tax collection through adoption of information technology and
systems
iv. Deploying sufficient financial and human resources for tax collection
v. Sealing tax administration loopholes that would open the collection process to corruption.
vi. Enacting appropriate laws related to land and other physical properties, business and
trade, extraction on natural resources in the county and transport services to increase the
tax bracket and ensure that all taxes, rates and fees are commensurate to the current fiscal
policies, structure and systems in the republic
5.5 External revenue raising strategies
On external revenue raising sources, the county government will pursue the following strategies-
i. Establish or initiate joint funding mechanisms with national government for capital
projects and other sector based programs
ii. Streamline financial management systems to enhance credit worthiness
iii. Mobilise funds through loans or other financing instruments for infrastructural
development.

Laikipia County Integrated Development Plan 2018-2022 Page 109
iv. Strengthen relationships and partnerships with development partners and other non-state
actors to support core programs. The county government will explore the system of
basket funding or pooling of resources in this respect.
v. Develop public private partnership models for providing core public services
b) Asset Management Strategies
County assets include land and buildings, motor vehicles, plant and machineries and equipment.
The county government will institute prudent asset management systems and processes which
will include:
i. Development of county asset register
ii. Valuation of all county assets
iii. Adoption of asset management accounting principles including depreciation
iv. Disposal of obsolete assets as prescribed under the Public Procurement and Asset
Disposal Act, 201 5
v. Timely and efficient repair and maintenance of movable assets to reduce wastage
and breakages
vi. Purchase and deployment of high quality assets that generate value for money to
the county
vii. Allocation and application of assets’ system based on need and value addition to the
realization of the CIDP
viii. Sharing of assets among various county government departments to reduce on
wastage
ix. Safeguarding and protecting assets to ensure maximum security and elimination of
cases of abuse
x. Development and adoption of county asset management policy and related laws
c) Financial Management Strategies
The success of this plan will largely depend on the adoption of appropriate financial management
systems and processes by the county government. The county government will therefore pursue
the following strategies:
i. Adoption of Integrated Financial Management Information System (IFMIS)
ii. Enhancing budget and expenditure control mechanisms
iii. Adopting prudent debt management policy
iv. Adopting accountability systems through continuous monitoring, reporting and
provision of timely financial information in accordance with accounting standards
v. Adopting modern public accounting systems
vi. Ensuring compliance with public procurement policies systems
vii. Adopting efficient cash management system
viii. Strengthening local internal controls, efficiency and integrity
ix. Ensuring adequate and qualified personnel in accounts and finance department
x. Enacting necessary county financial management laws

Laikipia County Integrated Development Plan 2018-2022 Page 110
d) Capital Financing Strategies
As indicated in the sector plans, infrastructure development will require adequate capital
financing. To this end, the county government will pursue the following strategies:
i. Identifying and pursuing long term capital financing instruments
ii. Prioritizing infrastructure financing to minimize stalling of projects
iii. Establishing and initiating public private partnership for infrastructure funding.
iv. Accessing affordable loans both locally and internationally.
e) Operational Financing Strategies
The county government will pursue the following operational financing strategies:
i. Utilization of internal revenue to finance operational costs
ii. Maintenance of cost sharing in financing operational costs
iii. Efficient cash flow management to support operational costs to ensure short term
borrowing for cash balance management is applied only when necessary
iv. Minimizing operational costs in service delivery
f) Strategies for Enhancing Cost Effectiveness
The county government will pursue the following measures to ensure cost effectiveness of public
service delivery:
i. Develop county policy to govern and manage service delivery costs
ii. Ensuring public services costs are directed to the intended purposes.
iii. Continuous monitoring of public expenditures vis-à-vis the intended benefits
iv. Instituting accountability mechanisms for all public expenditures
v. adopting appropriate criteria in the choice of model of providing public services

Laikipia County Integrated Development Plan 2018-2022 Page 111
CHAPTER SIX: MONITORING AND EVALUATION FRAMEWORK
6.1 This plan will adopt a participatory Monitoring and Evaluation (M&E) approach that is
recognized as a critical tool of supporting a coordinated approach to development in the county.
The approach is all-inclusive where the government, development partner, private sector, Non-
state actors and members of the public who are the beneficiaries of development programmes are
represented.
Main outputs will be the M&E quarterly reports and the progress reports. The outcome will be to
achieve a coordinated approach in development devoid of resource wastage for better results.
PM&E process will be coordinated at the county level and supported to undertake the M&E of
programmes and projects at the departmental levels.
6.2 Data Collection, Analysis and Reporting
Various mechanisms will be used for data collection, analysis, reporting, dissemination and
citizen engagement. Data collection will include the use of both quantitative and qualitative
methods and tools. Quantitative methods include community surveys; interviews; and
observations. Qualitative methods include various participatory learning methods using visual,
interviewing and group tools and exercises. Data analysis will actively involve various
categories of programme stakeholders in the critical analysis of successes, constraints, and the
formulation of strategies, conclusions and lessons learned.
The data is collected through fieldwork visits. Data collection is through observation, Survey and
interviews for primary data, secondary data is collected from literatures (books), and existing
reports. All this data is collected from across related departments. Data analysis methods are
mainly through tables, graphs, pie charts, histograms, percentages. Data dissemination and
citizen engagement is done through sharing of reports, organized meetings, barazzas, electronic
and print media, Public participation
6.3 M&E Outcome Indicators
This section should give the monitoring and evaluation of outcome Indicators by sector. The
CIDP Results Matrix will summarise the programme outcome indicators and targets. This will
allow implementers and decision-makers alike to assess progress towards the various county
development priorities. Table 16 will be used as the template for the CIDP Results Matrix

Laikipia County Integrated Development Plan 2018-2022 Page 112
Table 16: Summary of M&E Outcome indicators Sector Programme Sub
Programme
Outcome
indicators
baselin
e
Sources
of data
Reporting
responsibilit
y
Situatio
n in
2018
Mid-
term
target
(2020)
End
term
target
(2022)
County
administration
and public
service
County
administration
Decentralized
services
Improved
access to
governmen
t services.
2017
depart
mental
status
report
Periodic
reports
Sub county
administrator
3 sub
county
15 wards
80% 100%
County
service
delivery unit
Improved
service
delivery
and
decision
making
processes
2013-
2017
CIDP
status
report
Periodic
reports
Chief officer
County
Administrati
on
2013-
2017
CIDP
status
report
100% 100%
County legal
unit
Improved
legal
services
support
and
informed
decision
making
processes
Status
of
2016/1
7 legal
unit
report
Legal
Status
report
County legal
officer
40% 80% 100%
Executive
support
service
Implement
ation levels
on
executive
orders
/resolution
2017
Cabinet
Resolut
ions
Executive
meeting
minutes
County
secretary
100% 100% 100%
Intra and
intergovernme
ntal relations
Implement
ation levels
of intra
and inter
governmen
t relations
resolutions
2017
status
Periodic
reports
Director in
charge of
liaison
100% 100% 100%
Human
resource
management
and
development
Personnel
emoluments
Staffs job
satisfaction
HR pay
roll
HR
reports
Head of HR 100% 100% 100%
Performance
management
system
Percentage
of staff put
on PMS
2018
Status
PMS
reports
Head of HR 100% 100% 100%
Public service
board services
Implement
ation levels
of boards
decisions/r
esolutions
2017
CPSB
annual
report
CPSB
annual
reports
Secretary
CPSB
100% 100% 100%
Public service
management
No of staff
trained and
equipped
with
Trainin
g need
assess
Training
need
assessme
Head of HR 2018
training
assessme
100% 100%

Laikipia County Integrated Development Plan 2018-2022 Page 113
relevant
skills
ment
report
nt report nt
reports
Automation of
county records
No of
automated
records
and
Record
manage
ment
policy
Record
managem
ent policy
Head of
record
management
Open
shelf
record
manage
ment
100% 100%
County
archive
No of
records
archived
Record
manage
ment
policy
Record
managem
ent policy
Head of
Record
management
Open
shelf
record
registry
100% 100%
Review of
organization
structure
Approved
county
organizatio
n structure
Existin
g
organiz
ation
structur
e
Organizat
ion
structure
Head of HR Existing
organiza
tion
structure
100% 100%
Car and
mortgage.
No of
county
staff put
under car
and
mortgage
Existin
g
law/pol
icy on
car
mortga
ge
Policy on
car and
mortgage
Chief officer
county
administratio
n
Existing
law/poli
cy on car
mortgag
e
50% 100%
Security and
policing
services
Urban
facilities
services
Improved
security
Report
on
existing
flood
and
street
lights
Periodic
reports
Sub county
administrator
17 25 50
Human
wildlife
conflict
Improved
compensati
on
mechanism
Compe
nsation
commit
tee
report
Periodic
reports
Sub county
administrator
Quarterl
y reports
12
meeting
s
20
meetings
Amaya
initiative
Improved
intergover
nmental
relations
Amaya
meetin
gs
resoluti
ons
Periodic
reports
Amaya
initiative
coordinator
Amaya
resolutio
ns
30% 60%
County
security
services
Enhanced
security
County
security
oversig
ht
Periodic
reports
Director
liaison
County
security
oversigh
t
70% 100%

Laikipia County Integrated Development Plan 2018-2022 Page 114
commit
tee
report
committ
ee report
Public safety,
enforcement
and disaster
management
Enforcement
and disaster
risk
management.
-Law and
order
-Enhanced
resilience
Draft
bill on
enforce
ment
Policy
on
DRM
and bill
on
DRM
Draft bill
on
enforcem
ent
Policy on
DRM and
bill on
DRM
Director
public safety
and disaster
management
Draft bill
on
enforce
ment
Policy
on DRM
and bill
on DRM
1 DRM
and
enforce
ment
law
1 DRM
and
enforcem
ent law
Fire Response
Services
Timely
responses
to fire
incidences
Report
2017
Periodic
reports
Chief fire
officer
2 fire
engines
3 fire
engines
and a
fire
station
in
Nanyuk
i
3 modern
fire
engines
and 3
operation
al fire
stations
Laikipia
County
Alcoholic
drink control
Act, 2014
Regulation
of the
Alcoholic
drinks
industry
for a
healthy
working
citizenry.
Laikipi
a
county
alcohol
ic
drinks
control
act,201
4 and
regulati
ons
Periodic
reports
Director in
charge or
alcoholic act
Licenses
for 2016
100% 100%
EDE sectorial
services
Strengthen
ed
institution
capacity,
reduced
vulnerabili
ty and
increased
production
potential
County
sectoria
l EDE
action
plan
2012-
2022
Periodic
reports on
EDE
Chief officer
administratio
n
County
sectorial
EDE
action
plan
2012-
2022
70% 100%
Public
participation
Governor’s
forums
Informed
and
increased
citizen
awareness
on
governmen
t plans
CIDP
2013-
2017
status
report
Periodic
reports
Head of
delivery unit
in governor’s
office
70% 100% 100%

Laikipia County Integrated Development Plan 2018-2022 Page 115
Public
participation
unit
Ownership
of
governmen
t plans by
the citizen
No. of
public
particip
ations
conduct
ed
Reports
of public
participati
on
meetings
Head of
public
participation
63
meetings
100% 100%
Sector Programme Sub
programmes
Outcome
indicators
Baseline Source of
data
Reporting
responsibility
Situation
in 2018
Mid-term
target
2020
End-term
target
2022
Finance,
economic
planning and
county
development.
Administration
and personnel
services
Personnel
services
Levels of
performance
rating
Percentage of
staff compliant
on
performance
appraisal
system.
2017/18
performance
County
Public
Service
Board(CPSB)
and
County
Human
Resource
Advisory
Committee
CEO, CPSB
Deputy
County
Secretary
Head of
Human
Resource
90% 100% 100%
Administrative
services
Number of
interruptions
service
delivery
2017/18
survey
Rapid
assessment
report on
deliver of
service
CO, Finance
Results
delivery Unit
12 6 2
Infrastructural
service
Percentage of
staff with
designated
working space
and specialized
equipment and
installation.
2017/18
survey
Rapid
assessment
report on
designated
working
space and
specialized
office
equipment.
CO, Finance
Results
delivery Unit
100% 100% 100%
Financial
Services
Supply chain
management
services
percentage of
functional
goods, works
and services
2017/18
Inspection and
commissioning
reports ,
Audit reports
Periodic
supply chain
reports
Head supply
chain
management
Results
delivery Unit
60% 80% 95%

Laikipia County Integrated Development Plan 2018-2022 Page 116
County
treasury,
accounting
and reporting
services
Percentage
level of
compliance
2016/2017
Auditor
General
management
report.
Audit
committee
Internal
auditor
CEC Finance
CEC
Finance.
Clerk,
County
Assembly
100% 100% 100%
Internal Audit
Services
Reduced risk
rating and
incidences in
financial
procedures and
processed
2017/18 risk
management
plan.
Internal
auditor
Cooperative
Auditor
Director,
Internal
Audit
LOW LOW LOW
Budget
management
Percentage
absorption of
development
votes
Percentage
allocation of
development
votes
2016/2017
Office of
Controller of
Budget report
Annual
Controller of
budget report
Annual
budget
estimates,
Annual
budget output
papers
(CBROP and
CFSP)
CEC Finance
CO Finance
43% 45% 47%
Revenue
management
services
Collection
services
Amount
collected;
Percentage
annual increase
2017/18
Budget
estimates
Annual
Controller of
budget report
Annual
budget
estimates,
Annual
budget output
papers
(CBROP and
CFSP)
CEC
Finance,
Director
Revenue
600M
20%
864M
20%
1244M
20%
Revenue
management
infrastructure
Number of
Functional
revenue
2017
Status report
on revenue
centres.
Annual
report on
revenue
CEC
Finance, CO,
Finance
22
Functional
markets,
10 auction
22
Functional
markets,
10 auction
22
Functional
markets,
10 auction

Laikipia County Integrated Development Plan 2018-2022 Page 117
systems. systems centres yards, 15
cess
points and
10 barrier
points
yards, 15
cess
points and
10 barrier
points
yards, 15
cess
points and
10 barrier
points
Development
planning
services
Integrated
planning
services
Level of
implementation
of development
programmes
2016/17
Controller of
budget report.
Controller of
budget report
CEC Finance
,
CO Finance
33% 43% 53%
Research,
statistics and
documentation
services
Number of
feasibility
reports
Number of
county
Statistical
abstracts.
Number of
statistical
abstracts
Nil feasibility
reports
2015 statistical
abstracts
County
Annual
progress
reports
Annual
budget
estimates
supportive
documents
Director,
Economic
Planning
Nil
feasibility
reports
1
statistical
abstract
6
feasibility
studies
reports
3
statistical
abstracts
10
feasibility
reports
5
statistical
abstract
Programme
monitoring and
evaluation
Number of
annual
progress
reports
prepared and
adopted.
County
annual
progress
report.
Governor Nil
Annual
progress
reports
3 Annual
progress
reports
5 Annual
progress
reports
Participatory
budgeting
support
services
Functional
CBEF
2017 CBEF
status
CEC Finance 1
Functional
CBEF
1
Functional
CBEF
1
Functional
CBEF
Strategic
partnership and
collaboration
Amount of
resources
mobilized
Annual
LCDA report
CEC,
Finance
120 M 158M 228M
Youth
Development
Empowerment
Services
Number of
youth trained
on
entrepreneurial
skillsets
Annual VTC
reports
CEC Finance 750
Youths
1250
youths
1750
youths

Laikipia County Integrated Development Plan 2018-2022 Page 118
Number of
start-ups
arising from
the skills
transferred.
500 start
ups
1000 start
ups
1500 start
ups
Sector Programme Outcome
indicator
Baseline Source of
data
Reporting
responsibility
Situation in
2018
Midterm
target 2020
End
term
target
2022
Education
ICT and
Social
Development
Administration
Services
Administration
Services
Uninterrupted
service delivery
Current
Programmes
Annual report
2016/17
Department
Chief Officer
Nine(9) 9 9
Vocational
Education and
Training
Infrastructure
Development
Increased
number of the
vocational
training center
from 8 (2017)
to 15 (2022
Current
functional
centers
Department Chief Officer Eight (8) 11 15
Accreditation
,Quality
assurance and
standards
Increase
number of
trainees with
hands on skills
from 627
(2017 )to 5000
(2022)
Current
enrollment
data
Baseline
report
Department Chief Officer 869 3000 5000
Collaboration
and
Partnership
Increase
Current
partnership
Department Chief Officer 2 12 20

Laikipia County Integrated Development Plan 2018-2022 Page 119
number of
partnerships
from 2 to 20
Information
Communication
and
Technology
Development
ICT
Infrastructure
and
Connectivity
Fiber optic
cable
increased ICT
connectivity
and
Communication
ICT road map
2015-2020
Laikipia
County ICT
roadmap
2015 - 2020
Chief Officer 25% 50% 75%
Public service
delivery
systems
Automated
public service
delivery
systems
ICT road map
2015-2020
KNICTMP Chief Officer 20% 40% 60%
ICT Capacity
Training
Improved
service delivery
ICT road map
2015-2020
CARPS Chief Officer 100 400 1000
Early
Childhood
Education
Development
Infrastructure
Development
Increased
number of
centers from 75
to 150
Current 75
classrooms
Project
Reports 2017
Department Chief Officer 75 120 150
Accreditation
,Quality
assurance and
standards
Increased
enrollment in
428ECDE
centers from
23,172 to
28,000
ECDE
enrollment
2017 report
Department Chief Officer 23172 26,000 28,000
Teachers
Services
Increased
number of
Current
payroll 2017
Department Chief Officer 760 840 950

Laikipia County Integrated Development Plan 2018-2022 Page 120
teachers from
760 to 950
teachers
Education
Empowerment
Increase
number of
beneficiaries
from 7844 to
12,000
Current 2017
bursary
applications /
beneficiaries
reports
Department Chief Officer 7844 9000 12000
Talent
identification
nurturing and
development
Increase
number of
sporting
Facilities
infrastructure
2017
Department Chief Officer 1 3 5
Increase
number of
talent
identification
,and nurturing
activities
2017
calendar of
events
Department Chief Officer 1 18 30
Social and
cultural
Promotion and
Development
Increase
number of
persons under
social
protection
Current data
2017
Department Chief Officer 10 150 250
Increase
number of
social and
cultural
activities
Current
facilities
2017 report
Department Chief Officer 1 3 5
Child Care and
rehabilitation
Increase the
number of
children
rehabilitated
Current
number of
Rehabilitation
children
Current
infrastructure
Department Chief Officer 80 150 250
Increase the
utilization of
infrastructure
to reach 100%
Current
infrastructure
utilized
Department 25 75 100
Sector Programme Outcome
Indicators
Baseline Source of
Data
Reporting
Responsibility
Situation in
2018
Midterm
Targets
(2020)
End
Term
Targets
Infrastructure, Administration, % of staff with 75% Office Chief Officer 25% of the 100% 100%

Laikipia County Integrated Development Plan 2018-2022 Page 121
Sector Programme Outcome
Indicators
Baseline Source of
Data
Reporting
Responsibility
Situation in
2018
Midterm
Targets
(2020)
End
Term
Targets
Land,
Housing &
Urban
Development
Planning and
Support
Services
adequate office
space and
equipment
Administrator staff not
adequately
accomodated
% of functional
county vehicles
and plants
60% Mechanical
Department
Director Fleet
Management
40% of the
County
vehicles not
operational
100% 100%
% of staff
meeting their
performance
appraisal
targets
100% 100%
Physical
Planning and
Land Survey
Services
Level of
completion of
spatial for 4
major towns
0 Physical
planning unit
County
Physical
Planner
0 100% 100%
Level of
completion of
the county
spatial plan
0 Physical
planning unit
County
Physical
Planner
0 100% 100%
% of centres
with physical
development
plans
40% Physical
planning unit
County
Physical
Planner
60% of the
centres have
no physical
development
plan
70 % 100%
Roads Network
Improvement
and
Development
km of county
roads upgraded
to all weather
roads
600 km Roads unit Chief Officer 600 km have
been
upgraded to
all weather
roads.
1200 km 2000
km
Km of urban
roads
tarmacked
12 20
No. of
functional
bridges
Roads unit Chief Officer 2 long span
and
9 medium
span bridges
2 long
span and
15
medium
span
bridges
No. Of
functional
machinery
leased to own
Roads unit Chief Officer
Housing and
Urban
Development
% of improved
functional
housing
facilities.
0 Housing unit Director
Housing and
Urban
Development
County
Government
houses are
yet to be
improved
70% 90%
No. Of
operational
Management
boards
0 Urban
Development
unit
Director
Housing and
Urban
Development
Management
Boards not
yet in place
3 3
No. of towns developed (smart)
0 Urban
Development
unit
Director
Housing and
Urban
Development
0 13 20
Public Works
Services
Delivery
Improvement
% of project
services
requisitioned.
Public works
unit
County Public
works officer
50% 70%
Level of
completion of
0 Public works
unit
County Public
works officer
0 100% 100%

Laikipia County Integrated Development Plan 2018-2022 Page 122
Sector Programme Outcome
Indicators
Baseline Source of
Data
Reporting
Responsibility
Situation in
2018
Midterm
Targets
(2020)
End
Term
Targets
Legislations
for standards
and policies
% of structures
and bridges
requisitioned
100% Public works
unit
County Public
works officer
100% 100% 100%
% of inspections for Private structures requested
10% Public works
unit
County
Architect
10% 50% 70%
Sector Program
me
Sub
program
me
Outcome
indicators
Baseli
ne
Source of
data
Reporting
responsibi
lity
Situati
on in
2018
Midterm
target(20
20)
End term
target(20
22)
Agricultu
ral
Crop
Developm
ent
Land and
crop
productivit
y
enhancem
ent and
manageme
nt
% adoption
of
improved
crop
production
technologie
s
30% Annual
Reports
/Baseline
survey 2014
DALF 35 50 75
Strategic
food
security
services
% farmers
accessing
quality
farm inputs
40% Annual
Reports
DALF 45 60 90
Agribusine
ss and
informatio
n
manageme
nt
% adoption
of
improved
farming
and value
addition
technologie
s
20% Annual
Reports/Base
line survey
2014
DALF 25 50 60
Livestock
resource
developm
ent and
managem
ent
Livestock
resource
developme
nt and
manageme
nt
%adoption
of
improved
livestock
production
technology
20% Annual
Reports/Base
line survey
2014
DALF 25% 40% 70%
Promotion
of value
addition
and
marketing
%adoption
of value
addition
10% Annual
Reports
DALF 15% 30% 60%
Veterinar
y services
managem
Animal
Health and
Disease
Manageme
%
vaccination
coverage
30% Annual
Reports
DALF 40% 65% 80%

Laikipia County Integrated Development Plan 2018-2022 Page 123
ent nt Control
Increased
complianc
e with
livestock
movement
control
% of
livestock
keepers
/traders
acquiring
livestock
movement
permits
50% Annual
Reports
DALF 60% 80% 100%
Reduced
incidences
of tick-
borne
diseases
% of
functional
community
dips
10% Annual
Reports
DALF 15% 25% 35%
Disease
free
compartm
ents
established
No of
surveys
done;
No. of
livestock
traders
trained
No of
stakeholder
s trained
No of
disease free
compartme
nts
established
Annual
Reports
Livestock
products,
value
addition
and
marketing
No of
operational
slaughterho
use
Tones of
leather
tanned
No. of
livestock
fitted with
electronic
and
mechanical
branding.
Annual
Reports/Base
line survey
2014
Quality
assurance
and
regulatory
services
%
compliance
60% Annual
Reports
DALF 70% 80% 100%
Aquacultu
re
Developm
ent and
Managem
ent
Improved
Livelihood
and
Nutrition
(Alternativ
e Protein
Source)
Quantity
harvested
(Tones)
/Incomes
generated
(KES.)
20
Tones
Annual
Reports
DALF 9Tons 18Tons 32Tons
Fish
market
developme
nt and
regulatory
services
Percentage
(%) level
of
compliance
by actors
30% Annual
Reports
DALF 60% 80% 100%

Laikipia County Integrated Development Plan 2018-2022 Page 124
Irrigation
Developm
ent and
Managem
ent
Water
Harvesting
% H/H
accessing
irrigation
water from
water
harvesting
technologie
s like farm
ponds,
shallow
wells,
water pans,
Earth dams
etc
2%
Promotion
of water
efficient
irrigation
technologi
es
% of H/H
using
efficient
water
application
technologie
s for crops
production
eg drip
irrigation,
solar
pumping
-Number of
acres under
irrigation
SECT
OR
PROGR
AM
SUB-
PROGR
AM
OUTCOME
INDICATOR
S
BASEL
INE
SOURC
E OF
DATA
REPORTIN
G
RESPONSIB
ILITY
SITUAT
ION IN
2018
MID-
TER
M
TARG
ET
(2020)
END-
TER
M
TARG
ET
(2022)
MEDIC
AL
SERVI
CES
AND
PUBLI
C
HEALT
H
General
Administr
ative and
Planning
Services
Human
Resources
developm
ent
No of health
workforce
trained
300
Departm
ent of
Health
Training
reports
Director
Medical
Services
300 100 250
Additional
staff recruited 1100
Payroll Head of HR 1,100 80 200
Health,
policy,
Governan
ce,
planning
% of resources
mobilized and
utilized
60% Annual
health
departm
ent
budget
Chief Officer,
Health
Services
60% 10% 30%

Laikipia County Integrated Development Plan 2018-2022 Page 125
and
financing
No of facilities
accredited by
NHIF
4
Facilitie
s
accredit
ed
Annual
project
reports
Chief Officer,
Health
Services
4 4 10
Health
informatio
n,
standards
and
quality
assurance
No of SOPs
and regulations
developed and
disseminated
50%
Clinical
guidelin
e reports
Director
Medical
Services
50% 20% 50%
No of research
projects
completed
0
Researc
h reports
Director
Medical
Services
0 4 10
Improved data
collection,
storage,
retrieval and
analysis
40% HMIS Director
Medical
Services
40% 20% 50%
Curative
and
Rehabilita
tive
Health
Program
Health
products
and
technologi
es support
services
No commodity
stock-outs in
our health
facilities
70% Inventor
y of
commod
ities
County
Pharmacist
70% 10% 20%
No. of
facilities
adequately
equipped
50% Equipme
nt
catalogu
e
County Bio-
Medical
Engineer
50% 15% 40%
Health
training
centre
infrastruct
ural
developm
ent
Number of
students
enrolled
10% Students
enrollme
nt
registers
County
Director of
medical
services
10% 20% 50%

Laikipia County Integrated Development Plan 2018-2022 Page 126
Health
infrastruct
ure
developm
ent &
improvem
ent
No of
additional
operational
facility units
constructed/ren
ovated
50% Annual
project
reports
Chief officer
Health
50% 10% 35%
Emergenc
y referral
and
rehabilitat
ive
services
No of
functional
ambulances
and emergency
units
40% Inspecti
on
reports
Chief officer
Health
40% 20% 50%
Preventiv
e Health
Services
Family
planning,
Maternal
and child
health
services
% reduction in
maternal/child
morbidity and
mortality
21% DHIS County health
records and
information
officer
21% 6% 13%
Non-
Communi
cable
diseases
control
and
prevention
% reduction in
prevalence of
NCDs in the
county
30% DHIS County health
records and
information
officer
30% 9% 16%
Health
promotion
: Public
health
services,
Nutrition
services,
Communit
y health
strategy,
advocacy
and
surveillan
ce
% reduction in
prevalence of
malnutrition
cases
11% DHIS County health
records and
information
officer
11% 2% 5%
No. of
community
units
established ,
No of
community
health
volunteers
employed
18 DHIS County
community
health strategy
focal person
% reduction in
prevalence of
preventable
conditions in
the county
No of health
promotion
activities
undertaken

Laikipia County Integrated Development Plan 2018-2022 Page 127
sector programme Sub
programme
Outcome
indicator
baselin
e
Sources of
data
Reporting
responsibili
ty
Situatio
n in
2018
Mid-term
target(202
0)
End-
term
target
(2022
)
Trade
tourism
and co-
operati
ve
Administrati
on, planning
and support
services
Administrati
on services
Efficient
and
effective
delivery of
services
80% Periodic
reports
Chief
officer
TT&C
80% 100% 100%
Financial
services
Efficient
and
effective
delivery of
services
80% Periodic
reports
Chief
officer
TT&C
80% 100% 100%
Law and
policy
development
Improved
legal and
business
environment
4 Periodic
reports
Chief
officer
TT&C
4 5 7
Trade
development
and
promotion
Market
infrastructur
al
development
Improved
business
infrastructur
es
17 Periodic
reports
Director
trade
17 15 25
Enterprise
development
fund
Increased
enterprise
opportunitie
s
1200 Periodic
reports
Fund
manager
1200 16500 31000
Metrological
lab-weight
and measure
Strengthene
d fair trade
and
consumer
protection
1200 Periodic
reports
Director
trade
1200 6300 12000
Industrial
development
and
investment
promotion
Enhanced
Job and
wealth
created
- Director
trade
- 8 17
Informal
sector
Enhanced
Job and
wealth
created
255 Periodic
reports
Director
trade
255 1120 2070
Tourism
development
and
promotion
Tourism
promotion
and
marketing
Increased
tourism
arrivals and
revenue
generation
70000 Tourism
levy board
Director
tourism
70000 250000 52000
0
Tourism
infrastructur
Improved
tourism
infrastructur
3 Periodic
reports
Director
tourism
3 14 25

Laikipia County Integrated Development Plan 2018-2022 Page 128
e
development
es
Co-operative
development
and
marketing
Cooperative
development
and
promotion
Improved
cooperative
asset base
25 Cooperati
ve data
base
Director
cooperative
25 70 130
Cooperative
revolving
fund
Increased
Job and
wealth
creation
35 Handing
over
report
Fund
manager
35 205 370
Cooperative
auditing and
compliance
Enhanced
compliance
and
accountabili
ty
60 Periodic
reports
Director
cooperative
60 225 410
Cooperative
research and
industrial
development
Increased
and
diversified
economic
ventures
5
Periodic
reports
Director
cooperative
5
9 15
Savings
mobilization
Increased
cooperative
working
capital and
asset base
100M
Cooperati
ve data
base
Director
cooperative
100M
610M 1190
M
Sector Programm
e
Sub
Programme
Outcome
indicators
Baseline Source of
Data
Reporting
Responsibility
Situation
in 2018
Mid-
term
Target
(2020)
End-
term
Target
(2022)
Water,
Environm
ent and
Natural
Resources
General
Administrati
on, Planning
and Support
Services
Administrativ
e services and
Planning
services(M&E
)
No. of
people
served
No. of
operations
supported
30% Existing
Reports (Monthly,
quarterly and
Annual) from Department of
Water and
Environment
Chief Officer
Water and
Environment
35% 45% 55%
Strategic
Project
Monitoring
and
intervention(E
nding Drought
Emergencies-
EDE)
No. of
people
served
No. of
operations
supported
10% NDMA
KNBS
Drought
Resilience Program
Chief Officer
Water and
Environment
20% 40% 60%
Water
Developme
nt
Urban water,
sanitation and
sewerage
Additional
Households
served with
clean water
40% NAWASCO
NYAHUWAS
CO
Department of
Water and
Environment
CETRAD
Chief Officer
Water and
Environment
2,000 6,000 10,000
Additional
Population
with access
to sewerage
30% NAWASCO
NYAHUWAS
CO
Department of
Water and
Environment
Chief Officer
Water and
Environment
35% 45% 55%

Laikipia County Integrated Development Plan 2018-2022 Page 129
CETRAD
Rural water
supply and
sanitation
Additional
Households
served with
clean water
30% NAWASCO
NYAHUWAS
CO
Department of
Water and
Environment
CETRAD
WRA
Chief Officer
Water and
Environment
1,500 4,500 7,500
Additional
Population
with access
to sewerage
services
60% NAWASCO
NYAHUWAS
CO
Department of
Water and
Environment
CETRAD
WRA
Chief Officer
Water and
Environment
500 1,500 2,500
Water
Conservation,
Protection and
Governance
Additional
catchment
area
protected
60%
degraded
WRA
CETRAD
Water and
Environment
Department
NEMA
KFS
Chief Officer
Water and
Environment
2km2 per
WRUA/CF
A
6km2 per
WRUA/C
FA
10km2 per
WRUA/CF
A
Increased
water
storage
capacity
Roof-
rainwater
harvesting
projects at
household
and
institutional
levels
30% NAWASCO
NYAHUWAS
CO
Department of
Water and
Environment
CETRAD
Chief Officer
Water and
Environment
4% 12% 50%
Formulate
Water
Masterplan
Water and
Sanitation
policy,
water
allocation
plan and
Enforcemen
t regulations
1 Policy CETRAD
Water and
Environment
Department
Watershed
MKWEP
KWAHO
GROOTS
LWF
Chief Officer
Water and
Environment
4 - -
Established
database to
maintain
quantity and
quality
assurance
0 WRA
CETRAD
Chief Officer
Water and
Environment
1 - -
Environmen
t and
Natural
Resources
Solid Waste
Management
Sound solid
waste
managemen
t system and
0 Department of
Environment
Chief Officer-
Department of
Environment
20% 40% 60%

Laikipia County Integrated Development Plan 2018-2022 Page 130
plans
Human-
Wildlife
Conflict
Prevention
Incidences
of Human
Wildlife
Conflict
10%
electric
fence
coverage
KWS
KFS
LWF
Department of
Environment
County
Wildlife
Compensation
Committee(C
WCC)
Chief Officer-
Department of
Environment
20% 40% 60%
Natural
Resources
Management
Natural
Resources
Managemen
t strategy
National
Natural
Resources
Strategy
Department of
Environment
KWS
KFS
LWF
CETRAD
Chief Officer-
Department of
Environment
1 - -
Climate
Change
Adaptation &
Mitigation
County
Climate
Change
Policy
National
Climate
Change
Policy
Department of
Environment
GROOTS
Chief Officer-
Department of
Environment
1 - -
% of Tree
cover
6.9% Department of
Environment
KEFRI
KFS
ICRAF
CETRAD
Meteorologica
l Department
Chief Officer-
Department of
Environment
7.4% 8.4% 9.4%

Laikipia County Integrated Development Plan 2018-2022 Page 131
ANNEX 1: SECTOR PROJECTS DERIVED FROM PROGRAMMES
Sector Name…………………………………………...
Sub-sector Name………………………………………
Programme Name……………………………………..
Table 17: On-going projects
Project Objectives Targets Description Green Cost Source Timeframe Implementing
Name/ of Economy (Kshs.) of Agency
Location* Activities considerations funding
(Key
Outputs)
West Laikipia
Fence
Reduce
Human
Wildlife
Conflict
Construct
153km
Electric
Fence
Electric Fence
constructed
Improved
Environmental
Management
147m Space for
giants/Laik
ipia County
Governme
nt
2016-2019 County
Government/
Space for Giants
*Indicate where the project is being
implemented Table 18: New Project Proposals
Project Objectives Targets Description Cost Source Timeframe Implementing Remarks
Name/Location of (Kshs.) of Agency
Activities funding
Table 19: Stalled Projects
Project Name Location Description of activities Reasons for stalling