online-japanese-japanese · Title: online-japanese-japanese Created Date: 5/15/2017 5:19:54 PM

1
Republic of Costa Rica
Ex-Post Evaluation of Japanese ODA Loan
Pirris Hydroelectric Power Development Project
External Evaluator: Hiromi Suzuki S., IC Net Limited
0. Summary
The project aimed to improve the stability of electric supply capacity in Costa Rica by constructing
a hydroelectric power plant in the middle stretches of the Pirris River which runs through the central
plateau of the country.
The project was in line with Costa Rica’s national development plans, development needs and
Japan’s assistance policies, both at the time of the appraisal and at the time of the ex-post evaluation.
Therefore its relevance is high. The main indicators which reflect the effects of the Pirris Hydroelectric
Power Plant (PHPP) have either mostly achieved its targets or are improving. In addition, in a country
where hydroelectric power generation is the base load, the project has not only strengthened the
hydroelectric generation capacity, but it has also contributed to a more stable electric supply capacity
as well as to solving future electricity supply-demand gaps. These effects can be recognized as the
PHPP is connected to the National Electricity System (SEN), through the Parrita-Lindora transmission
line (230kV, 118km)1 which was constructed as a separate project of the Executing Agency. Based on
the above, the project effectiveness is evaluated to be satisfactory. In addition, other positive impacts
were observed such as afforestation activities and effects from the construction of access roads, among
others, thus the project’s level of achievement of its intended effects and impacts is high. The
efficiency of the project is evaluated to be low, because both project period and project cost
significantly exceeded the plan. With regard to the sustainability of the effects of the project, no major
problems have been observed in the institutional, technical and financial aspect of operation and
maintenance, therefore sustainability of the project effect is high.
In light of the above, this project is evaluated to be satisfactory.
1. Project Description
Project Location
Pirris Hydroelectric Power Plant RCC2 Dam
(provided by Costa Rican Institute of Electricity, ICE)
1 From the time of appraisal, the construction of the Parrita-Lindora transmission line was a precondition for the realization
of the effects of the project. 2 RCC (Rolled Compacted Concrete) is an extremely stiff consistency concrete with less amount of cement. Because it is
possible to place large amounts of concrete at once, it has the advantages of shorter construction periods and less construction
costs, characteristics that make it a reasonable construction method (Reference: Website of the Japan Concrete Institute and
the Japan Dam Foundation).
San Jose
Nicaragua
Panama
Costa Rica
Pirris Hydroelectric
Power Plant
Pacific Ocean
Caribbean

2
1.1 Background3
Costa Rica was one of the most politically stable countries in Central America, and it was
achieving a high economic growth especially under the “National Development Plan 1994-1998”,
which attracted high-tech industries and increased exports based on the establishment of tax-free
processing zones. On the other hand, in order to continue with the National Development Plan and to
maintain a sustainable economic growth, it was imperative to develop economic and social
infrastructure including power sources. Especially in regard to electricity demand, it was increasing
year by year as the economy grew, and it was estimated to continue increasing by an annual rate of
5.7% until 2020. Thus there was a pressing need to improve the reliability of a stable electric power
supply.
Electricity in Costa Rica was supplied mainly by the Costa Rican Institute of Electricity (ICE),
who was developing electric power sources by utilizing the country’s water and geothermal resources.
In particular, hydroelectric power generation accounted for three-quarters of the total electric power
supply and was considered to be the country’s base load. In 2001, the country did maintain the
necessary power generation infrastructure to cover the power demand, but it would soon become
difficult to fill the electricity demand-supply gap which was estimated to occur from 2006 onwards,
thus it was urgent to take specific actions.
1.2 Project Outline
The objective of this project is to improve the stability of electric supply capacity in Costa Rica by
constructing a hydroelectric power plant with a 128MW generation capacity in the middle stretches of
the Pirris River which runs through the central plateau, located 70km to the south of San Jose, the
capital of the country, thereby contributing to solving the future electricity demand-supply gap and to
improving the hydroelectric power generation capacity which is the base load of the country.
Source: ICE
Figure 1: Pirris Hydroelectric Power Development Project
3 Based on JICA’s appraisal documents and press releases.
Pirris River
Reservoir
RCC Dam
Headrace Tunnel
Powerhouse
Pirris Hydroelectric Power Development Project
Penstock
3
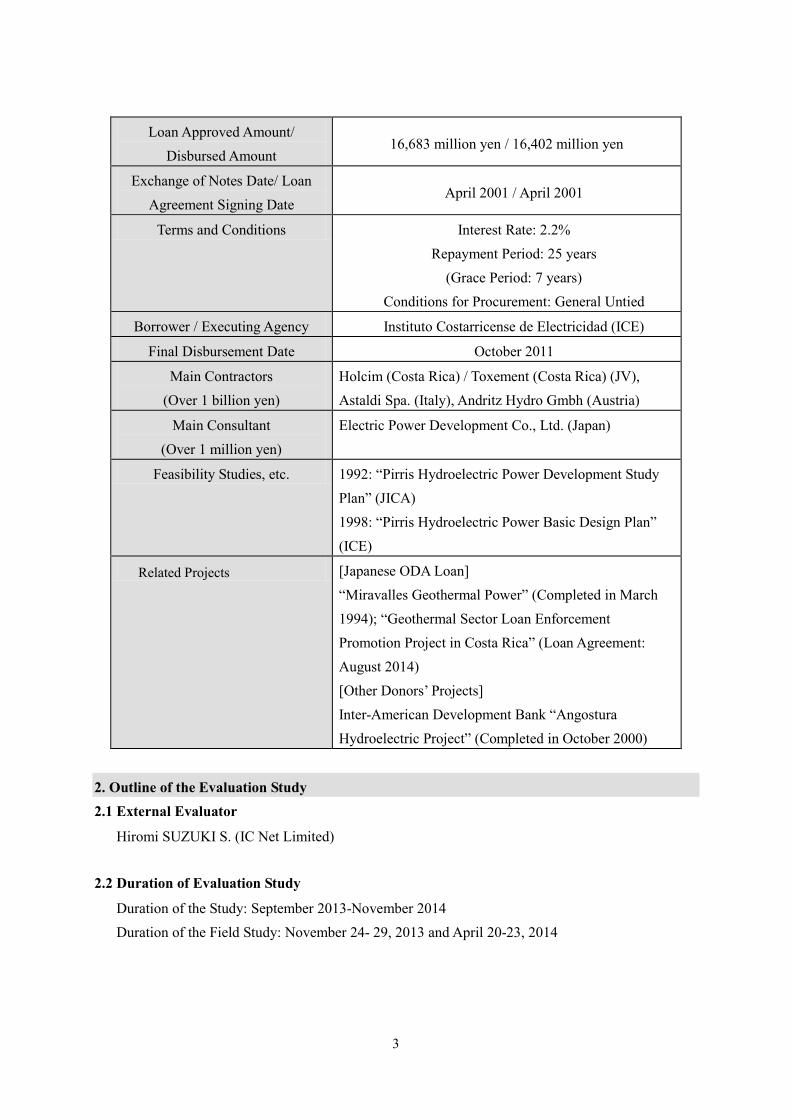
Loan Approved Amount/
Disbursed Amount 16,683 million yen / 16,402 million yen
Exchange of Notes Date/ Loan
Agreement Signing Date April 2001 / April 2001
Terms and Conditions Interest Rate: 2.2%
Repayment Period: 25 years
(Grace Period: 7 years)
Conditions for Procurement: General Untied
Borrower / Executing Agency Instituto Costarricense de Electricidad (ICE)
Final Disbursement Date October 2011
Main Contractors
(Over 1 billion yen)
Holcim (Costa Rica) / Toxement (Costa Rica) (JV),
Astaldi Spa. (Italy), Andritz Hydro Gmbh (Austria)
Main Consultant
(Over 1 million yen)
Electric Power Development Co., Ltd. (Japan)
Feasibility Studies, etc. 1992: “Pirris Hydroelectric Power Development Study
Plan” (JICA)
1998: “Pirris Hydroelectric Power Basic Design Plan”
(ICE)
Related Projects [Japanese ODA Loan]
“Miravalles Geothermal Power” (Completed in March
1994); “Geothermal Sector Loan Enforcement
Promotion Project in Costa Rica” (Loan Agreement:
August 2014)
[Other Donors’ Projects]
Inter-American Development Bank “Angostura
Hydroelectric Project” (Completed in October 2000)
2. Outline of the Evaluation Study
2.1 External Evaluator
Hiromi SUZUKI S. (IC Net Limited)
2.2 Duration of Evaluation Study
Duration of the Study: September 2013-November 2014
Duration of the Field Study: November 24- 29, 2013 and April 20-23, 2014
4
3. Results of the Evaluation (Overall Rating: B4)
3.1 Relevance (Rating: ③5)
3.1.1 Relevance to the Development Plan of Costa Rica
3.1.1.1 Relevance to the Development Plan at the Time of Appraisal
The development plan at the time of the appraisal was the “National Development Plan
(1998-2002)” formulated by the Ministry of National Panning and Economic Policy (MIDEPLAN).
Development of social infrastructure, including electric power, improvement of public services, and
sustainable utilization of natural resources were among the 15 development objectives of the said Plan.
With regard to the electric power sector, in order to respond to the growing electricity demand, which
was estimated to increase steadily, the Ministry of Energy (MINAE) formulated the “Third National
Energy Plan (2000-2020)”. The Plan required that ICE, which was the entity in charge for electric
power supply in Costa Rica6, formulate a concrete Electric Power Development Plan, so as to fill the
future demand-supply gap. Based on these Plans, ICE formulated the “Electric Power Development
Plan (2012-2024)” which planned to construct 29 electric power plants by 2020, in order to fill the
above-mentioned demand-supply gap. Specifically, this project (Pirris Hydroelectric Power Plant,
128MW) was the second largest project after the Angostura Hydropower Plant (Starting of operations:
2000, 177MW) and it was considered as one of the most important national projects.
3.1.1.2 Relevance to the Development Plan at the Time of Ex-Post Evaluation
The development plan at the time of the ex-post evaluation was the “National Development Plan
2010-2014”. In the energy sector, its purpose is to “protect the environment and achieve sustainable
development”, and seeks also to achieve “Carbon neutrality” which offsets greenhouse gas emissions
with absorptions by 2021 through the development of clean energy sources such as hydro and
geothermal power. Based on the said National Development Plan, MINAE formulated the “Sixth
National Energy Plan (2012-2030)” in which electricity demand is expected to continue growing as a
result of Costa Rica’s economic growth estimations and improvement in the living of standards of its
people. In order to cope with this growth, the said Plan targets the development of renewable, low-cost
energy sources; restrain negative effects to the environment as much as possible; and improve health
and living standards of the people of Costa Rica. ICE formulated the “Electric Power Development
Plan (2012-2024)” based on the above plans, in which aims to secure a stable electricity supply, reduce
dependence to fossil fuels and reduce greenhouse gas emissions. In addition, while hydroelectric
4 A: Highly satisfactory, B: Satisfactory, C: Partially satisfactory, D: Unsatisfactory
5 ③: High, ②: Fair, ①: Low
6 Costa Rica’s electricity sector is called “National Electric System (SEN)”. Companies engaged on power generation,
besides ICE, who accounts for 70% of the total power generation capacity, are CNFL -an ICE subsidiary-, Rural
Electrification Cooperatives (four), Public Electric Companies (two), and a private company. ICE is the only company
engaged in transmission, and companies engaged in distribution are ICE, CNFL, Rural Electrification Cooperatives (four)
and Public Electric Companies (two).

5
power generation continues to be the country’s base load, it also seeks to achieve the ideal balance
between hydro, wind, and geothermal energy7.
As stated above, both at the time of appraisal and the ex-post evaluation, Costa Rica’s National
Development Plans, National Energy Plans, and ICE’s Electric Power Development Plans consider
filling the electricity demand-supply gap and achieving a stable supply of electric power as their
development objectives. It also continues to put emphasis on renewable energies including
hydroelectricity -which utilizes the country’s own natural resources- to achieve these goals. In this
sense, the project is highly relevant to Costa Rica’s development policies both at the time of appraisal
and the ex-post evaluation.
3.1.2 Relevance to the Development Needs of Costa Rica
3.1.2.1. Development Needs at the Time of Appraisal
At the time of appraisal, electricity demand in Costa Rica was growing year by year. Actual
electricity demand grew by an annual average of 5.5% between 1985 and 1997, and by 6.5% between
1998 and 2000. Furthermore, electricity demand was expected to grow by 2020 at an annual average
rate of 5.7%, mostly due to the advance of high-tech industries into the country. On the other hand,
according to the construction plans of new power generation plants and renovation of existing obsolete
power plants that existed at the time, it was estimated that after 2006, it would not be possible to
secure a stable electric power supply. In addition, with ICE’s limited budget, it was deemed difficult to
construct the 29 power generation plants that were planned to be completed by 2020 according to the
Electric Power Development Plan, and to simultaneously conduct the necessary construction of
transmission facilities in a prompt manner. Thus it was necessary to take urgent measures to secure a
stable supply of electricity.
ICE’s power generation capacity by the end of 2000 was 1,470MW (hydro 1,098MW (75%),
thermal 234MW (16%), geothermal 137MW (9%)), and electric power generation capacity (MW) was
above electricity demand. However, Costa Rica has a tropical wet and dry climate in which there is a
serious lack of water during the months of December to April, which is the dry season. Because the
energy source for hydroelectric power generation drops dramatically during this period, there was a
risk of a serious demand-supply gap during the peak periods of the dry season (February to April),
which could cause a decrease in the reliability of a stable electric power supply. Although the lack of
capacity in electric power supply was served by thermal power generation, Costa Rica does not have
fuel for thermal power generation, making it necessary to rely on imports. However, an
over-dependence on thermal power generation was not in line with the country’s development plans.
Therefore, if measures were not taken, there was a risk of an increased dependence on fuel imports
from 2007, which was a major concern for ICE. Under these circumstances, the need to develop a
hydroelectric power plant with a dam that utilizes national water resources was extremely high in
7 At the time of the ex post evaluation, among the power generation plants that ICE was putting emphasis on, were included
the hydroelectric power plants of Reventazón (292 MW), Diquis (623 MW), Tacares (7MW), and Savegre (160MW).

6
order to both increase the county’s electric power supply capacity and improve the stability of such
capacity8.
3.1.2.2. Development Needs at the Time of Evaluation
Costa Rica’s electricity demand grew at an annual average rate of 2.9% from 2009 to 2012, which
was not as high as it was expected at the time of appraisal, mainly due to the global financial crisis
which was caused by the 2008 Lehman Shock, but is on a stable upward trend. According to the most
recent electricity demand estimations announced in 2011 by the National Energy Planning Center
(CENPE), the entity that makes such estimations, the annual average electricity demand growth rate
by 2024 will be 4% and the estimated demand is 18,148GWh. As can be seen, the development need
of securing a stable power supply for the future continues to exist. ICE’s power generation capacity in
2011 was 2,590MW, which was more than the electricity demand of 1,598MW. However, the marginal
supply capability9 was 7%, failing to achieve the criteria of 8%-10% that secures a stable electric
power supply, making it necessary to continue strengthening such capacity. Based on CENPE’s
demand estimates, in its “Electric Power Generation Plan (2012-2024), ICE is planning to increase the
participation of hydropower generation capacity from 65% to 72% as shown in the table below,
thereby increasing the total power generation capacity to 4,304MW by 2024, corresponding to an
estimated demand of 2,962MW.
Table 1: Electricity power demand, supply and power generation capacity in Costa Rica
2011
Actual
2024
Estimation / Plan
Electricity demand 1,598MW 2,962MW
Total Power Generation Capacity 2,590MW 100% 4,304MW 100%
Hydro 1,691 MW 65% 3,099MW 72%
Wind 129 MW 5% 301MW 7%
Geothermal/Biomass 234 MW 9% 344MW 8%
Thermal 537 MW 21% 560MW 13%
Source: CENPE (2011) “Electricity Demand 2011-2033” and ICE “Electric Power Development
Plan (2012-2024)”
As stated above, electricity demand continues to grow in Costa Rica and the development need to
strengthen power generation by using water, which is one of its natural resources in order to secure a
stable electric supply capacity can be recognized at the moment of the ex-post evaluation as well.
3.1.3 Relevance to Japan’s ODA Policy
Japan’s assistance policy towards Costa Rica was not formulated at the time of appraisal.
8 Besides this project, ICE has conducted the “Miravalles Geothermal Power Plant Development Project” (Japanese ODA
loan project, completed in March 1994, 55MW) and the Inter-American Development Band funded “Angostura
Hydroelectric Project” (starting operations in October 2000, 177MW), actively promoting the development of renewable
power sources that would not depend on imported resources. 9 The marginal supply capability is an indicator that shows the excess supply capacity against electricity demand. [(Peak
supply capacity – estimated maximum demand) / estimated maximum demand] x 100. Ordinary, it is considered to be from
8% to 10% (Reference: Website of the Ministry of Economy).
7
Therefore, for the ex-post evaluation, the consistency of the project was checked with JICA’s
“Medium-Term Strategy for Overseas Economic Cooperation Operations (1999-2002)”, which was
formulated based on the basic strategies and policies of Japan’s Official Development Assistance
(ODA). The said Strategy’s main objective is to reduce poverty in developing countries. It also aims to
achieve a sustainable economic growth through the development of economic and social infrastructure
and creation of industries; and to support a fair distribution of the fruits of economic development
through poverty alleviation and social development measures. Based on these objectives, it established
six focus areas that included strengthening of infrastructure for production and environmental
protection measures. With regards to assistance strategies towards Central and South America, it
focused on the development of infrastructure for the alleviation of income disparities as well as
regional disparities. It also planned to actively assist projects that would contribute to the preservation
of regional environment, as well as projects that were aiming to solve global environmental problems.
In light of the above, the project is consistent with the Japanese Government assistance sectorial
strategy as well as with the assistance strategy towards Central and South America10.
This project has been highly relevant with the development plans and development needs of Costa
Rica, as well as Japan’s ODA policy. Therefore its relevance is high.
3.2 Effectiveness11
(Rating: ③)
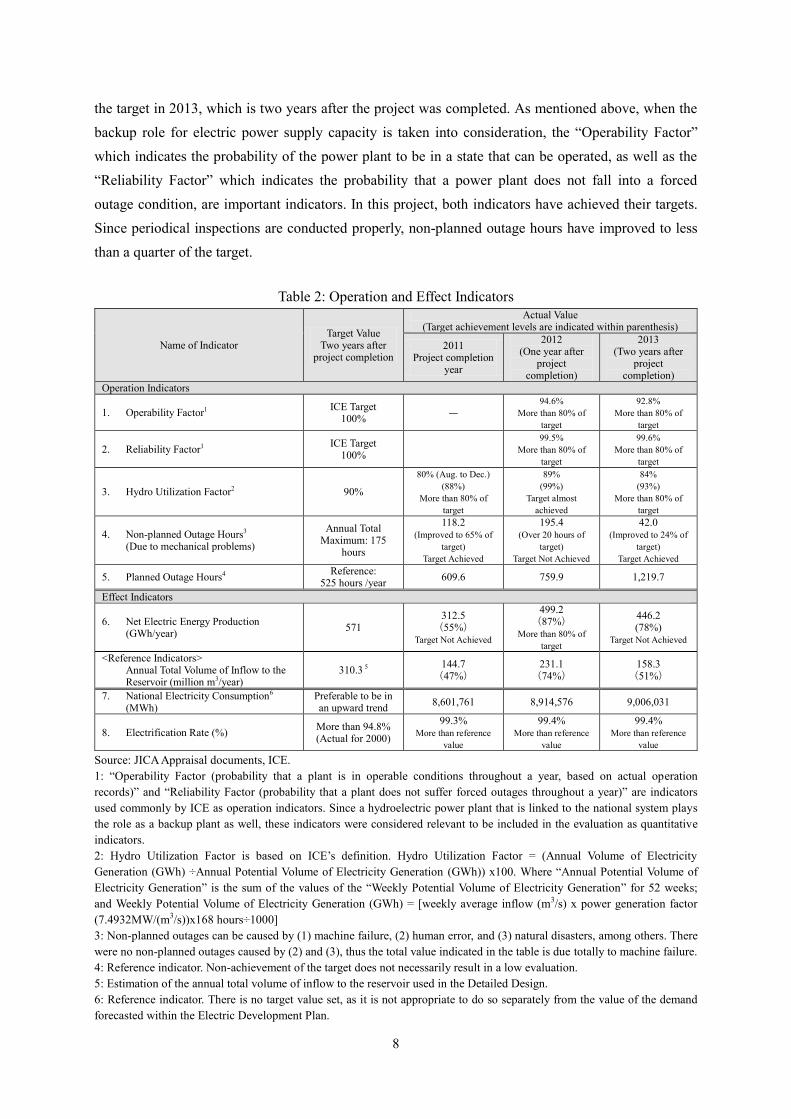
3.2.1 Quantitative Effects (Operation and Effect Indicators)
With respect to the project’s operation indicators, evaluation was conducted based on the indicators
for which targets were set at the time of appraisal, as well as indicators that are used as main indicators
by ICE that have internally set targets. The target year is 2013 which is two years after the project was
concluded. In the table below, actual data and their target achievement levels for 2011 and 2012 are
also indicated for reference. In order to conduct the evaluation of the project’s operation and effect
indicators, it is necessary to consider the role that the PHPP plays in Costa Rica’s SEN. Hydroelectric
power plants have some advantages over other plants such as the ability to operate not only during dry
season, and to quickly respond when sudden increases in electricity demand occur. In addition, time
necessary to restart the plant after stopping operations is only a few minutes compared to thermal
power plants12
, which enables hydroelectric power plants to immediately supply electricity in case of
an emergency13
.
All four operation indicators have either achieved more than 80% of the target, or have achieved
10 With the objective of contributing to Costa Rica’s sustainable growth by increasing electric supply capacity, as well as by
easing climate change effects through the promotion of renewable energy, the Loan Agreement of the “Guanacaste
Geothermal Development Sector Loan” (ODA loan amount 16,810 million yen) was signed on August 18, 2014 between the
Government of Japan and the Government of Costa Rica. 11 Sub-rating for Effectiveness is to be put with consideration to impact. 12 Thermal generation plants require from more than 15 minutes to few hours to restart operations. 13 According to ICE, when PHPP is compared with other hydroelectric plants in Costa Rica, PHPP has the following two
characteristics that strengthen its backup role: (1) Pelton turbines that make it especially easy to start and stop operations and
can automatically adjust to changes in voltage, and (2) emergency power generators that enable it to restart operations in case
of emergency, without having to depend on other power plants.
8
the target in 2013, which is two years after the project was completed. As mentioned above, when the
backup role for electric power supply capacity is taken into consideration, the “Operability Factor”
which indicates the probability of the power plant to be in a state that can be operated, as well as the
“Reliability Factor” which indicates the probability that a power plant does not fall into a forced
outage condition, are important indicators. In this project, both indicators have achieved their targets.
Since periodical inspections are conducted properly, non-planned outage hours have improved to less
than a quarter of the target.
Table 2: Operation and Effect Indicators
Name of Indicator Target Value
Two years after project completion
Actual Value (Target achievement levels are indicated within parenthesis)
2011 Project completion
year
2012 (One year after
project completion)
2013 (Two years after
project completion)
Operation Indicators
1. Operability Factor1 ICE Target
100% ―
94.6%
More than 80% of
target
92.8%
More than 80% of
target
2. Reliability Factor1 ICE Target
100%
99.5%
More than 80% of
target
99.6%
More than 80% of
target
3. Hydro Utilization Factor2 90%
80% (Aug. to Dec.)
(88%)
More than 80% of
target
89%
(99%)
Target almost
achieved
84%
(93%)
More than 80% of
target
4. Non-planned Outage Hours3 (Due to mechanical problems)
Annual Total Maximum: 175
hours
118.2 (Improved to 65% of
target)
Target Achieved
195.4 (Over 20 hours of
target)
Target Not Achieved
42.0 (Improved to 24% of
target)
Target Achieved
5. Planned Outage Hours4 Reference:
525 hours /year 609.6 759.9 1,219.7
Effect Indicators
6. Net Electric Energy Production (GWh/year)
571 312.5
(55%) Target Not Achieved
499.2 (87%)
More than 80% of
target
446.2 (78%)
Target Not Achieved
<Reference Indicators> Annual Total Volume of Inflow to the Reservoir (million m3/year)
310.3 5 144.7
(47%) 231.1
(74%) 158.3
(51%)
7. National Electricity Consumption6 (MWh)
Preferable to be in an upward trend
8,601,761 8,914,576 9,006,031
8. Electrification Rate (%) More than 94.8% (Actual for 2000)
99.3% More than reference
value
99.4% More than reference
value
99.4% More than reference
value
Source: JICA Appraisal documents, ICE.
1: “Operability Factor (probability that a plant is in operable conditions throughout a year, based on actual operation
records)” and “Reliability Factor (probability that a plant does not suffer forced outages throughout a year)” are indicators
used commonly by ICE as operation indicators. Since a hydroelectric power plant that is linked to the national system plays
the role as a backup plant as well, these indicators were considered relevant to be included in the evaluation as quantitative
indicators.
2: Hydro Utilization Factor is based on ICE’s definition. Hydro Utilization Factor = (Annual Volume of Electricity
Generation (GWh) ÷Annual Potential Volume of Electricity Generation (GWh)) x100. Where “Annual Potential Volume of
Electricity Generation” is the sum of the values of the “Weekly Potential Volume of Electricity Generation” for 52 weeks;
and Weekly Potential Volume of Electricity Generation (GWh) = [weekly average inflow (m3/s) x power generation factor
(7.4932MW/(m3/s))x168 hours÷1000]
3: Non-planned outages can be caused by (1) machine failure, (2) human error, and (3) natural disasters, among others. There
were no non-planned outages caused by (2) and (3), thus the total value indicated in the table is due totally to machine failure.
4: Reference indicator. Non-achievement of the target does not necessarily result in a low evaluation.
5: Estimation of the annual total volume of inflow to the reservoir used in the Detailed Design.
6: Reference indicator. There is no target value set, as it is not appropriate to do so separately from the value of the demand
forecasted within the Electric Development Plan.

9
Annual planned outage hours were verified as an
indicator that reflects the improvement in the stability
of electric supply capacity. While in 2001 the value
was 20.7 hours, in 2013 it decreased considerably to
8.76 hours. Compared to the time of appraisal, it can
be seen that stability of electric supply in the national
system has absolutely improved (Figure 2).
With respect to the effect indicators, the only one
for which a target was set at the time of appraisal was
the Net Electric Energy Production, which has failed
to meet the target from 2011 to 2013. The main reason is that due to the reduction in rainfall seen in
recent years, the Annual Total Volume of Inflow to the Reservoir has significantly decreased
respectively to 47%, 74% and 51% of the Annual Total Volume of Inflow to the Reservoir estimated in
the Detailed Design (310.3 million m3/year). National amount of electricity consumption is on an
upward trend, and Electrification Rate has considerably increased from 94.8%, which was the
reference value for the year 2000, to 99.4% in 2013.
From the above, among the six indicators for which either target values or reference values were
set, the only indicator that did not achieve its target in 2013 was the Net Electric Energy Production.
The rest of the indicators have either achieved more than 80% of the target or have achieved the target,
thus quantitative effects of the project can clearly be recognized.
3.2.2 Qualitative Effects
The qualitative effects of the project expected at the time of appraisal can be considered as effects
at the project impact level, and thus these were analyzed under “Section 3.3 Impact”.
3.3 Impact
3.3.1 Intended Impacts
The expected impacts of the project were: improving hydroelectric power generation capacity,
filling the future demand-supply gap, improving investment environment as well as increasing the
potential for economic development, through the construction of the power plant.
3.3.1.1 Improving Costa Rica’s hydropower generation capacity and filling the future
demand-supply gap
As mentioned above, according to CENPE’s most recent demand estimation, electricity demand
will grow at an annual average rate of 4% by 2024, and estimated amount of electricity demand will
be 18,148 GWh, indicating that a stable supply of electricity will continue to be necessary (for details
see “3.1.2.2 Development Needs at the Time of the Evaluation”) . Improving ICE’s capacity of
hydroelectric power generation, which accounts for 70% of the total power generation capacity as well
Source: ICE
Figure 2: Annual planned outage hours

10
as the total volume of electricity generated for Costa Rica’s SEN, means a stable supply of electricity
for the country. The PHPP, which was completed in 2011, is connected to the national system through
the Parrita-Lindora transmission line, and in 2012, it accounted for 5% of SEN’s electric generation
capacity as well as volume of electricity generated respectively, indicating that the project is clearly
contributing to the improvement of hydropower generation capacity, as well as filling the future
demand-supply gap.
Table 3: Project’s contribution to the National Electricity System
2010 2012
Power Generation Capacity
KW
Participation in the
SEN (%) KW
Participation in the
SEN (%)
Total SEN 2,605,295 2,723,181
Total ICE 1,902,939 73% 2,080,190 76%
Hydro 1,119,709 43% 1,258,869 46%
Pirris HPP - - 140,272 5%
Thermal 627,270 24% 612,601 22%
Geothermal 136,160 5% 187,910 7%
Wind 19,800 1% 19,800 1%
Solar Power - 1,010 0.04%
Electric Power Generated
MWh
Participation in the
SEN (%) MWh
Participation in the
SEN (%)
Total SEN 9,503,002 10,076,344
Total ICE 6,655,309 70% 7,459, 250 74%
Hydro 5,291,523 56% 5,349,469 53%
Pirris HPP - 503,653 5%
Thermal 335,637 4% 830,284 8%
Geothermal 963,837 10% 1,190,398 12%
Wind 64,312 1% 79,804 1%
Solar Power - - 295 0.003%
Source: ICE.
The project’s impact is not limited to improving the hydroelectric power generation capacity as
mentioned above; it also plays the role of a backup power source during dry season, and during sudden
changes in electricity demand. It also contributes to the improvement of the Central Pacific Ocean
region’s electricity service, as well as the Central American Electrical Interconnection System14
(SIEPAC), to which it is connected through the Parrita Substation, playing a strategic role in the
Central American electricity market. Through the above-mentioned roles, the project is contributing
greatly both to the improvement of hydropower generation, which is the base load of Costa Rica, and
to the strengthening of the SEN.
3.3.1.2 Improvement in the investment environment and economic development potential of
Costa Rica, by improving the stability of electric supply capacity
14 The Central American Electrical Interconnection System (SIEPAC) is a system that interconnects six Central American
countries (Guatemala, El Salvador, Honduras, Nicaragua, Costa Rica and Panama) with a 1,793km long transmission line,
which enables selling and buying electricity within the region. It is operated by the Network Owner Company (EPR) which
was established by the electric utility companies of the six countries.

11
In order to grasp the project’s impact, a survey was conducted to large consumers15
. Opinions in
reference to the stable power supply, importance of electricity as a determinant for investment, and the
positive and negative changes brought about by the project were gathered.
1) Stable power supply
All companies have a power contract for medium voltage (34.5KV) or high voltage (230KV,
138KV), thus their power supply is stable, and “power quality (changes in voltage)” is high. With
regard to “Stable power supply, 9 out of 10 companies answered that they are “very satisfied or
satisfied”. The reason one company was not satisfied, was related to electricity rates which will be
discussed below, and ICE’s response during non-planned outages. With respect to ICE’s response
during non-planned outages (especially when transmission lines and electric poles are damaged due to
hurricanes and/or accidents), nine other companies also mentioned that “even if the outage is short,
there are significant damages to the machinery, thus a quick response by ICE is expected”. As
mentioned above, although the non-planned outage hours have significantly improved, it became clear
that a better response when non-planned outages occur is required. On the other hand, with respect to
planned outages, all 10 companies responded that “it has improved compared to how it was three years
ago” and although it is necessary to coordinate dates and time with ICE, seven out of 10 companies
said that these coordination opportunities are a good way to communicate with ICE and build a good
relationship with them. At the moment of the ex-post evaluation, companies were using the planned
outages as an opportunity to conduct machinery maintenance, and no specific effects or problems such
as damages were observed.
2) Importance of electricity and its rates as determinants of investment
Improvement of electricity rates was what all the companies were most hoping for. Nine out of 10
companies do business not only in the domestic market, but use Costa Rica as a production base to
export their products to markets in North America, South America and Asia. The companies responded
that electricity rates are a major concern, as electricity cost can even reduce their competitiveness. A
common opinion was that “in Costa Rica’s case, a major determinant for direct investment is its
political and economic stability, which is the reason why there are no big fluctuations in direct
15 Details of the large customers survey is as follows. (1) Survey period: end of November 2013 to mid-January 2014; (2)
Number of companies surveyed: ten (six foreign-owned companies); Industry: Food processing (three), dairy (one),
aquaculture (one), auto parts (one), electric parts (two), metal processing (one), services (one); (4) number of years operating
in Costa Rica: less than 10 years (two), 10 to less than 15 years (one), 15 to less than 20 years (six), 20 years or more (four);
(5) percentage of electricity cost in the product’s cost price: 10% (one), 15% (one) 17% (two), No response (six); (6)
geographical distribution by province: San Jose (three), Alajuela (three); Puntarenas (three) Cartago (one); (7) method of
selection: selected from the large consumer list taking into consideration the geographical distribution and industry
classification. Originally request to participate in the survey was made to 15 companies, but no cooperation could be obtained
from five companies.

12
investment. But if electricity rates continue to increase, competitiveness will decrease, and foreign
companies will be forced to withdraw from the country16
”.
3) Positive and negative changes brought about by the project
With respect to the project, three companies said to “know it very well” and seven said “to have
heard of it”. From the former three companies, one actually had visited the project. A common opinion
among these three companies was that “the project cost was very high; however, it was important and
necessary in order to secure a stable power supply and to reduce dependence on fossil fuels in Costa
Rica”. With respect to social effects, environmental changes and problems related to resettlement and
land acquisition brought about by the project, they said “not to have heard of anything in particular”.
From the above, among the expected impacts, it was possible to recognize the improvement of
Costa Rica’s hydroelectric power generation capacity, and filling the future demand-supply gap by
improving the stability of power supply as the project’s impacts. On the other hand, with respect to the
relationship between the project and the investment environment, as well as the improvement of
economic development potential, it is difficult to probe a direct causal effect between those and the
project to begin with, because the electricity generated by the project is transmitted to the whole
country through the SEN. However, large consumers said that “in a before-after comparison, Costa
Rica’s power supply is more stable and quality of electricity has improved from a general point of
view”. From this statement it can be said that the project has contributed to strengthen the SEN. In
addition, when economic growth rates and Foreign Direct Investment to Costa Rica before and after
the project were compared, the former increased from 2.7% in 2008 to 3.6% in 2013, and the latter
increased from 2,078 million U.S. dollars in 2008 to 2,682 million U.S. dollars in 201317. These data
support the fact that, together with other economic and social infrastructure, this project has
contributed to some extent as a determinant to attract investment and improve the potential for
economic development.
3.3.2 Other Impacts
3.3.2.1 Impacts on the Natural Environment
In Costa Rica, all projects that can cause a change in the natural and living environment are
obliged to conduct an Environmental Impact Assessment (EIA) and obtain an approval from the
16 According to a survey conducted by the Costa Rica Chamber of Industries, electricity tariffs in the country have increased
from an annual average of 0.069 U.S. dollars/kWh in 2003, to 0.196 U.S. dollars/kWh in 2013, resulting in a 284% increase,
which is an obstacle in terms of competitiveness and further attraction or foreign direct investment. However, according to
the foreign direct investment statistics of the Ministry of Trade (COMEX), although foreign direct investment to Costa Rica,
which was 2,078 million U.S. dollars in 2008, fell to 1,346 million U.S. dollars in 2009 due to the global financial crisis, it
recovered to 2,682 million U.S. dollars in 2013. Therefore, the direct causal effect of electricity tariffs is not as clear as the
industrialists say. In addition, according to announcements by the Economic Commission for Latin America and the
Caribbean (ECLAC, 2012), Costa Rica’s main foreign direct investment attraction factors are high level of education and
skills of its people, and socioeconomic stability, and it points out that electricity tariffs are the lowest in the Central American
region. The discussions on electricity tariffs in Costa Rica have been going for a long time, and due to its political factor, it
needs to be handled with care. Therefore, large consumers’ opinions on electricity tariffs obtained in this ex-post evaluation
were considered only as reference information. 17 Economic growth rates are from the Central Bank of Costa Rica, and foreign direct investment amounts are from COMEX
(See footnote 16 for details).

13
National Environmental Technical Secretariat (SETENA). ICE conducted the project’s EIA from 1997
to 1998, and obtained the approval from SETENA in June 199918
.
In regard to the environmental impact during the execution of the project, three activities were
assumed to be conducted, namely, environmental monitoring and measures during construction period,
afforestation activities and water quality monitoring.
As mentioned below under “3.5.1 Institutional Aspects of Operation and Maintenance”, an
Environmental Management Department was established inside the Pirris Hydroelectric Powerhouse
Construction Administration Office (PHP), which was the entity in charge of the management of the
project. The said Department conducted the environmental monitoring and implemented necessary
measures, afforestation activities and water quality monitoring.
1) Environmental monitoring and measures during the construction period
As indicated in the table below, construction works were conducted strictly observing national
standards, and efforts to minimize negative impacts to the environment were taken as much as possible.
However, especially with respect to vibration, it affected the neighborhood residents’ houses (please
refer to “3.3.2.2 Land Acquisition and Resettlement” for details).
Table 4: Environmental impact measures and monitoring status during project execution
Monitoring contents and measures during construction works
Gas
Emission
Periodical inspections of vehicles (including contractor vehicles) were conducted at
ICE’s repair plant. By making car inspection necessary, vehicle’s gas emission rules
were strictly followed.
Waste
Disposal
Treatment
A “Waste disposal management program” was implemented. Solid wastes were recycled
or reused as much as possible within the project or in other ICE projects (approximately
59 tons of waste were recycled between 2009 and 2011). Liquid wastes were treated by
using filters. Scrap was partially sold to scrap processors (2,780 tons of scrap was sold
between 2009 and 2011).
Dust
In highly populated sections, roads were paved with concrete. In other sections and in
the construction sites, water was sprinkled frequently, and measures such as cleaning
plants covered with dust were also taken.
Muddy
water
Especially in concrete plants and sites with a lot of drilling (RCC dam, headrace
tunnel), sedimentation devices were introduced. Water quality (suspended solids) were
monitored at some points of the river and ensured that national standards would be
strictly met.
Noise
Noise was monitored in neighborhood communities; measures such as coordinating
hours to operate machinery were taken, and national standards were strictly followed.
Workers were required to use earplugs.
Vibration
Vibrations occurred mostly during the drilling works for the headrace tunnel. Status of
infrastructure in neighborhood communities was monitored, and effects of vibrations on
other infrastructure were reduced by adjusting drilling works.
2) Afforestation activities
There were some coffee fields in the area of the reservoir which was submerged (about 141ha), but
there were neither natural parks nor designated protected forests. Vegetation around the reservoir was
18 Approved EIA reports were distributed to provincial authorities, and are also available to the public at ICE’s reference
room.

14
also poor and almost no wild animals were found. Thus negative effects of the project to the natural
environment were assessed to be minimal at the time of project appraisal. However, in large-scale
public projects such as this, there are cases where opposition activities by neighborhood residents and
NGOs occur. This project was no exception, and especially at the beginning, there were some
opposition movements by neighbor residents of the dam site. However, in order to minimize the
negative impact of the project to the natural environment, ICE created a plant nursery where young
trees were grown for afforestation. Efforts were made in conducting afforestation activities and
environmental education in the project area, gaining the understanding of the neighbor residents19
.
3) Water quality monitoring
At the time of appraisal, there was a concern that the waste water from the coffee refineries located
upstream of the Pirris River would flow and accumulate in the reservoir, worsening water quality. The
EIA especially pointed out the necessity to monitor the concentration of Biochemical Oxygen Demand
(BOD)20
. The reason why BOD concentration is high both at the time of appraisal and the ex-post
evaluation is that coffee plantations use a considerable amount of water in their bean refinery process,
and the waste water that contains pulp (skin) is discharged without sufficient treatment into the Pirris
River. ICE’s role in the water quality issue was to monitor water quality since even before starting the
project, and to inform SETENA if it did not meet the national standards21
. Monitoring of water quality
during project execution was done by ICE’s Environment Management Department, mainly at 14
monitoring points that included the Pirris River and the powerhouse. An average of six to seven points
were selected and monitoring was conducted twice a month for 11 water quality indicators22
. BOD
concentration was especially high in January registering levels between 111mg/L to 118 mg/L, when
the volume of waste water from the coffee refineries located upstream reached the highest levels; thus
not meeting the national standards sometimes. With respect to other water quality indicators, these
differed by period, but there were no major issues.
Environmental impact at the moment of the ex-post evaluation was possible to assess through the
water quality monitored mainly at the Pirris River, reservoir, and power house. The entity in charge of
monitoring water quality is ICE’s Department of Hydrology of the Projects and Related Services, who
monitors a total of 20 water quality indicators at seven points in reservoir, five at the power house, and
four at the Pirris River. Similar to the project execution period, BOD and Chemical Oxygen Demand
19 With ICE’s afforestation activities, approximately a total of 300,000 trees were planted around the dam site, the power
house, and neighboring communities from 2002 to 2011. 20 BOD is the amount of oxygen that is consumed when organic matters in the water go through a biochemical oxidation and
decomposition. The bigger the value, the more polluted is the water (Source: Website of the Japan Ministry of the
Environment) 21 In order to conduct water quality monitoring, ICE signed a water quality management agreement with the Ministry of
Agriculture and Livestock, which is the relevant authority in matters related to coffee production, the Ministry of Health, and
the Ministry of Environment. Water quality monitoring was conducted based on such agreement. 22 Items that were monitored were temperature, pH, turbidity, dissolved oxygen, BOD, SS (Suspended Solids), COD
(Chemical Oxygen Demand), phosphate ion, ammonium nitrogen, nitrate and dissolved solids.

15
(COD) were high in January23
, however, with the exception of January, water quality meets the
national water quality standard classification III to V24
required for hydro power generation.
Table 5: Water quality after project completion: Reservoir of Pirris Hydroelectric Power Plant (2013)
BOD COD SS pH
Minimum
value
1.3 mg/L
(September)
30mg/L
(July)
1 mg/L
(April)
6.24
(July)
Maximum
value
31 mg/L
(January)
1,044mg/L
(January)
6 mg/L
(January)
7.12
(April)
Water Quality
Standard III-IV*
25 to <50 mg/L <10 mg/L 6.0 to 9.0
III~V I III
Source: ICE.
Note: BOD, Ammonium Nitrogen and Dissolved Oxygen are given a score from 1 to 5
according to the range. Water quality is then classified into five levels that go from I (not
contaminated) to V (seriously contaminated) based on the total points.
In regard to the issue of high BOD levels, just as during the project execution period, the basic role
of the Department of Hydrology of the Projects and Related Services is to monitor water quality, and
inform SETENA if quality does not meet the levels required for hydroelectricity generation. However,
it is worth mentioning that ICE is doing efforts working together with the government (mainly the
Ministry of Agriculture and Livestock and MINAE) as well as research institutions, conducting joint
research on environmentally friendly coffee production procedures. In addition, PHPP itself conducts
maintenance of the reservoir to keep a stable water quality as much as possible. Especially, water
intake management is conducted in order to avoid low water levels at the reservoir, and to keep BOD
levels within the acceptable range.
3.3.2.2 Land Acquisition and Resettlement
The process of resettlement and land acquisition was conducted based on “Law No. 6313 on
Acquisitions, Expropriations and Easements by ICE”. The Law establishes that an appraisal of the
land and/or construction must be conducted by a third party, and the amount resulting from the
appraisal shall be paid in case of land acquisition, while in the case of resettlement, a relocation site of
an equal value must be provided to the residents.
The area of land that was planned to be acquired at time of appraisal was 364ha, but the actual area
was 398.5ha, 109% compared to the plan. This was because it was necessary to add another camp site
for ICE construction workers at the dam site. The land that was subjected to acquisition was mainly
those for the powerhouse, switchyard25
and the coffee plantations of at the reservoir that went under
water. A total of 509 people were affected directly and indirectly by the project at the powerhouse and
23 Although the coffee production period is from November to March, the peak production season is January. 24 National water quality standards in Costa Rica are stipulated under MINAE Decree No. 33903 MINAE-S. The basic
classification is as follows: I=drinking water, II=aquaculture, III=hydropower generation, IV=navigation (can also be used
for aquaculture and hydroelectricity generation subject to limitations), V=navigation (can also be used for hydroelectricity
generation subject to limitations). 25 A device that starts or stops (opens and closes) the flow of electricity generated at the power plant to the transmission line,
and it helps to stabilize electricity supply.

16
switchyard sites. As for the coffee plantation land that was submerged in the reservoir, 152 land
owners were affected, but besides these land owners, ICE did not know the number of people that
might have possibly been affected indirectly such as seasonal workers. With regard to land
acquisition26
, especially, negotiations on the compensation amount at the power house were prolonged,
causing a delay in the project. However, all procedures were conducted properly based on the
aforementioned Law.
In regard to resettlement, the planned number of households to be resettled at the time of appraisal
was a total of 18, that is, seven at the reservoir and its preservation area, and 11 at the access road
areas. In case of the latter, resettlement became unnecessary due to a change in route of the access road.
Thus, a total of eight households, the original seven plus an additional household, located at the
reservoir and its preservation area were resettled (73% compared to plan). From these eight
households, two had already been resettled at the time of appraisal. For five out of the remaining six
households, the risk of a landslide at the original residential area had already been recognized before
the beginning of construction works, but the risk increased with the vibrations of the civil works, thus
their resettlement was imperative. The household that was added was outside the landslide risk area at
the time of appraisal, but it was included after starting of civil works, as the landslide risk due to
vibrations was recognized. The six households that were resettled after the project started were done
so based on the aforementioned Law No. 6313, and a relocation place of the same value as the
appraisal value was secured at Santa Marta de Tarrazu, as requested by the residents, and their
relocation was completed without problems.
3.3.2.3 Other Impacts
Besides the above mentioned expected impacts, the following positive impacts can be recognized
in this project27
.
1) Access roads
145km of roads were constructed by the project (including roads for the transportation of materials
and equipment). These roads were not only paved with asphalt, but sidewalks, road guards, road signs,
bus stops, pedestrian bridges, side ditches and electric poles were installed as well. Some roads to the
powerhouse and the reservoir, were checked at the moment of the site inspection, and based on
hearings to local residents, socioeconomic effects (for example, transportation safety improvement due
to construction of roads, increase in land and real estate prices, increase in number of tourists etc.) to
neighboring villages could be recognized.
26 Average amount of compensation paid for the whole project was 387 colon/m2. 27 A beneficiary study for residents was not included in the scope of this ex-post evaluation; thus, socioeconomic effects on
the living standards of the residents were assessed based on interviews.

17
2) Effects on cultural assets
At the moment of appraisal, some
archeological remains were found at the planned
site of the reservoir. ICE conducted a survey
during the project, and a burial place of 224m2 was
discovered. However, it was concluded that the
density of the archeological remains per square
meter was low and a permission to continue with
the civil works was obtained from the National
Institute of Cultural Heritage. A total of 2,120
pieces of pottery were collected from the burial
site and all of them were handed to the National Museum. In addition, although on a small scale, an
exhibition room has been installed next to the reservoir where explanations on the historical
background of the burial site and replicas of the discovered pottery are on display. The excavation site
has also been replicated and it is open to the general public. As can be seen, ICE has conducted
activities to protect cultural properties as well as educational and public relation activities, based on
which it can be judged that negative impacts to cultural properties have been kept at the minimum.
3) Other socio-environmental activities
In order to reduce impacts to the neighboring communities’ living environment and to the natural
environment, ICE implemented the “Project for Community Infrastructure and Environmental
Protection” separately with its own funds. A total 131 projects (construction of parks, restoration of
churches, provision of equipment for the construction of health care centers, and repair of water tanks)
at 54 communities were conducted.
As can be seen, ICE separately implemented measures to minimize any negative impacts that
could arise from the construction of the project, and positive impacts that were not expected can be
recognized.
In light of the above, this project has largely achieved its objectives, therefore its effectiveness is
high.
3.4 Efficiency (Rating: ①)
3.4.1 Project Outputs
Changes in output occurred mainly with the civil works, but electric equipment and facilities were
conducted almost as planned (for details see annex “Comparison of the Original and Actual Scope of
the Project”).
With respect to civil works, there were changes in all items except quarries and tailrace. Because
the geological features of the site where the dam was planned to be constructed were not assessed
Figure 3: Replica of the burial site
next to the reservoir

18
accurately in ICE’s the geological surveys conducted during the 1998 Feasibility Study (F/S)28
and the
Detailed Design, problems with the soil were found after the civil works had started, thus making it
necessary to partially change the design of the dam and to do more excavation works as well as
foundation work than what was originally planned. The geological survey issue also happened in the
building of the power house. Once civil works had started, it was found that the foundation of the
ground of the planned construction site was weak. Thus, the design of the power house building was
changed from a ground level type to a semi-underground level type. Taking the results of the 1998 F/S,
JICA conducted a survey in 1999 previous to the appraisal, in which it advised29
ICE to improve the
accuracy of the geological survey of the dam site. Taking into consideration the 1992 F/S up to the
1998 F/S, at least three geological surveys were conducted related to this project’s dam site, and even
after construction started, more geological issues were found which caused considerable changes that
affected the project cost and project period (refer to “3.4.2 Project Inputs”).
Other major changes in civil work were the increase in the length of access roads for civil works
(207% compared to plan) and the number of camp sites (133% compared to plan). As for the former,
routes of these roads were changed in such a way that these were laid avoiding villages in order to
minimize project impacts to neighboring residents. As for the latter, an additional camp especially for
28 In this project, two F/S were conducted: one in 1992 and another one in1998. The 1992 F/S was carried out with JICA
funds while the 1998 F/S was carried out by ICE with its own funds. In the 1992 F/S, two candidate sites for the construction
of the dam were surveyed: one upstream and one downstream. The conclusion was that although both sites were appropriate,
the downstream site was more economical. However, it recommended that additional surveys were necessary for the
following: (1) topographical survey, (2) geological survey, (3) material testing, and (4) hydrological measurement. Thereafter,
from 1993 to 1996, ICE conducted the above mentioned surveys with its own funds and the results were summarized in 1997
in the document “Results of Additional Surveys”. In this Survey’s hydrogeological evaluation, it was found that the ground of
the downstream dam site -the main candidate- was too weak, so the dam was decided to be constructed in the upstream
candidate site, and so, in 1998, ICE carried out the F/S at the upstream site with its own funds. In 1999, JICA advised ICE to
improve some technical aspects, and in June 2000 it again advised ICE to improve the accuracy of the geological survey. ICE
then submitted the countermeasures (measures that it will take in the Detailed Design and the Construction Planning) to the
two aspects advised by JICA, who in turn sent an appraisal mission in August 2000 in order to confirm the technical
relevance of these countermeasures. When the mission was dispatched, an agreement was reached between JICA and ICE in
reference to the project design, construction, employment of a consultant, schedule, costs, urgency of the project and
measures to be taken from thereon, which then led to the signing of the loan agreement in 2001. 29 JICA internal documents.
Figure 4: Reservoir
Figure 5: Generator

19
ICE construction workers (approximately 200 workers) had to be constructed at the dam site, as
halfway of the RCC dam construction, ICE had to take over the work from the contractor Astaldi30
.
3.4.2 Project Inputs
3.4.2.1 Project Cost
The planned project cost was 29,443 million yen (foreign currency portion: 15,144 million yen,
domestic currency portion: 14,299 million yen), out of which 11,383 million yen from the foreign
currency portion and 5,300 million yen from the domestic currency portion were subject to the
Japanese ODA loan. The actual project cost was 79,056 million yen, out of which 16,402 million yen31
was subject to the Japanese ODA loan. The project cost was 269% of the planned cost, significantly
higher than planned.
Table 6: Details of the Project Cost
Item
Planned
(million yen)
Actual
(million yen) % change
against
plan ODA
loan Others Total
ODA
loan Others Total
Civil Works 5,333 4,039 9,372 10,124 34,675 44,799 478%
Electric machinery and Equipment 8,973 3,411 12,384 6,030 5,719 11,749 95%
Land Acquisition 0 611 611 0 491 491 80%
Administrative Cost 0 2,602 2,602 0 10,349 10,349 398%
Price Escalation 493 130 623 0 0 0 0
Physical Contingencies 1,092 977 2,069 0 0 0 0
Consulting Services 791 0 791 248 0 248 31%
Interest During Construction 0 990 990 0 11,419 11,419 1,153%
Total 16,683 12,760 29,443 16,402 62,654* 79,056 269%
Source: JICA appraisal documents, ICE.
*: ICE’s own resources accounted for 42,729 million yen of the 62,654 million yen of the “Other” financial resources, and
19,924 million yen were borrowed from the Central American Bank for Economic Integration.
<Planned values> Exchange rate 1 U.S. dollar=108.36 yen / 1Costa Rican colon=0.3506 yen / Price escalation rates: foreign
currency 0.8%, domestic currency: 0.7% / Physical contingency rates: above ground civil works 10%, underground civil
works: 15%, electrical machinery and equipment: 5% / Cost calculation reference period: November 2000.
<Actual Values> Exchange rate was calculated by the executing agency using annual exchange rates.
The major change in the total project cost was civil works (478% of the planned cost). Electric
machinery and equipment, as well as land acquisition were more than planned in terms of U.S. dollars,
30 Civil works of the dam were subcontracted to Astaldi; however, because the 2008 tropical storm Alma caused considerable
damages in the dam site, the company stopped working for 84 days. As the work interruption period was prolonged,
originally, ICE was planning to demand Astaldi to terminate the contract and conduct a new bidding. However, taking into
consideration the time required for a new bidding process, it decided to withdraw the demand and avoided further delays in
the construction period. Specifically, in 2009 a clause was added to the contract with Astaldi, which indicated that ICE would
take over the responsibility of the construction of the RCC dam, spillway and installation of electrical machinery and
equipment. As a result, out of the components of the civil works, ICE took charge of the preparatory works, river
improvement, headrace tunnel, power house and switchyard, grouting of the dam site, RCC dam, spillway, and installation of
electrical machinery and equipment. Grouting of the dam site was assisted by the consultant and a specialist in RCC dams. 31 According to ICE, the actual amounts are all recorded in U.S. dollars, and are not classified into “foreign and domestic
currency”. Planned amounts were calculated by the evaluator using the exchange rate indicated in Table 6.

20
but were within planned in terms of yen due to a strong yen. The reasons for the major change in civil
works were modifications in the Detailed Design of the dam after a problem in the ground at the
construction site was found once civil work had already started; subsequent changes in excavation and
ground work which exceeded the plan; and additional costs due to delay in the construction period.
The fact that ICE took over the RCC dam construction from Astaldi, and delays in the construction
period also significantly affected the project cost by increasing administrative costs by 398%
compared to planned. In addition, the project cost that was planned to be financed by the Japanese
ODA loan and ICE’s own funds at the time of appraisal, had to be financed also by borrowing from the
Central American Bank for Economic Integration (CABEI) and issuance of bonds, after changes in
output and delays in the project period were made. These in turn resulted in a significant increase in
interests during construction which was 1,153% compared to planned.
3.4.2.2 Project Period
The planned project period was 76 months from April 2001 to July 2007, but the actual project
period was 131 months from April 2001 to February 2012. The actual project period was 172% of the
planned period, which was significantly longer than planned.
Table 7: Project Period
Procedure Planned
(Appraisal documents) Actual
Actual
vs.
Planned
Delay in
starting
Signing of the L/A April 2001 April 2001 ―
Preparatory Works January 2001 to May 2005
53 months
January 2001 to September 2010
117 months 221% None
Main Works January 2001 to July 2007
79 months
June 2002 to October 2010
101 months 128% 10 months
1.RCC Dam
August 2001 to March
2007
68 months
June 2002 to November 2011
114 months 168% 10 months
2.Headrace
Tunnel
January 2001 to April 2007
76 months
July 2002 to May 2011
107 months 141% 18 months
3.Powerhouse January 2003 to July 2007
55 months
August 2005 to October 2010
55 months
As
planned 19 months
Electric
Machinery and
Equipment
July 2003 to March 2007
45 months
July 2003 to February 2012
104 months 231% None
Land Acquisition January 2001 to June 2004
42 months
January 2001 to December 2006
72 months 171% None
Consulting
Services
June 2001 to June 2007
73 months
July 2002 to May 2009
83 months 114% 13 months
Total Project
Period
April 2001 to July 2007
76 months
April 2001 to December 2012
131 months 172% ―
Source: Planned values are from JICA appraisal documents, actual values are from ICE.
The main reasons for the delay were as follows.
1) Delays due to changes in civil works: the aforementioned change in the design of the dam
resulted mainly in the delay of preparatory works (221% compared to plan). It also became necessary
21
to secure labor and add and/or change access roads in order to deal with such changes. In addition,
regarding all sorts of ground works including grouting32 of the planned construction site of the dam,
it took longer than expected to procure the necessary machinery due to lack of domestic funds.
Another reason for the delay was that the water inflow in the tunnel connecting the RCC dam and the
powerhouse was more than planned, which resulted in frequent flooding. However, the executing
agency introduced a shift-work system and took measures such as using part of the equipment used in
other projects. As for the construction of the power house, land acquisition was not completed until
2005 also causing a delay.
2) Delays due to the contract of Consulting Services: General competitive bidding is basically the
public procurement procedure applied in Costa Rica. However, the project’s consulting services were
directly appointed based on the “Guidelines for the Employment of Consultants under ODA Loans”.
ICE had to provide necessary explanations for that the said Guidelines are superior to Costa Rica’s
national procurement laws in implementing ODA loan projects and had to carry out necessary
coordination with Costa Rica’s government and related entities . This resulted in a 13 month delay in
signing the contract with the consultant, which in turn resulted in a delay in the items that were
included in the consultant’s Terms of Reference (TOR), such as Detailed Design and procurement
procedures of the civil works.
3) Delays due to the tropical storm Alma: Due to the 2008 tropical storm Alma, civil works at the
dam site had to be interrupted, and as mentioned earlier, contract with Astaldi had to be modified.
Negotiations and procedures took time, which resulted in delays in the construction period. In addition,
even after ICE took over the construction from Astaldi, it had to secure the necessary labor force by
itself, which required time. Furthermore, the closing of access roads due to landslides resulted in
delays in the delivery and installation of equipment33
.
3.4.3 Results of Calculations of Internal Rates of Return (IRR)
At the time of appraisal only the Economic Internal Rate or Return (EIRR) was calculated at
12.2%. Costs used for EIRR calculation were project costs and operation and maintenance costs, while
benefits used were the income from sales of electricity and benefits deriving from avoiding blackouts.
Project life was 40 years. At the time of the ex-post evaluation, although it was possible to obtain
information on costs, it was difficult to obtain accurate information on the project benefits; therefore
EIRR was not recalculated.
32 Filling voids with cement milk and/or mortar in other to improve the foundation ground of a dam site (Source: website of
the Japan Dam Foundation). 33 One reason for the difficulty to secure labor force was that during the same period, a private company was carrying out a
tourist developing project in Puntarenas and Guanacaste on the Pacific Ocean side, and they were offering higher wages, and
therefore labor force was drawn into that project. In an effort to minimize any effects on the project, ICE carried out several
“Job fairs” for Pirris neighboring residents. It also added a camp in the dam site where accommodation facilities, meals and
buses for transportation were offered.
22
Both project cost and project period significantly exceeded the plan, therefore efficiency of the
project is low.
3.5 Sustainability (Rating: ③)
3.5.1 Institutional Aspects of Operation and Maintenance
The project’s operation and maintenance during project execution was conducted as planned by the
PHP established under the Strategic Business Unit for Projects and Related Services (UEN-PySA) of
ICE Electricity (ICELEC). The Project Manager was the head of PHP, under whom there were a total
of 14 departments including Project Management, Operation Planning, Quality Control, Materials and
Equipment Procurement, Labor Safety Management, Environmental Management, IT Management,
Civil Works, and Engineering among others. From June 2009 to October 2010, which was the
project’s peak period, there were 2,884 persons engaged. In addition, during emergency periods such
as when tropical storm Alma hit the country, labor force was reinforced. From these, it can be said that
there were no major problems in general terms in ICE’s basic organization during project execution.
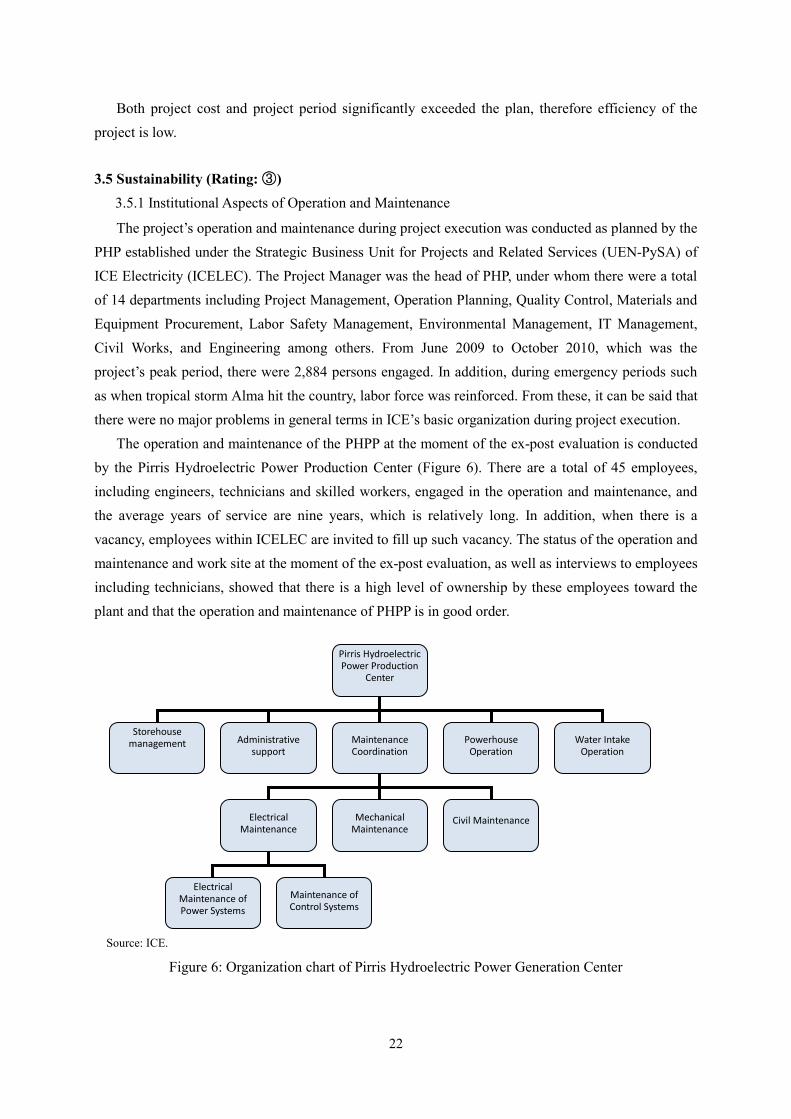
The operation and maintenance of the PHPP at the moment of the ex-post evaluation is conducted
by the Pirris Hydroelectric Power Production Center (Figure 6). There are a total of 45 employees,
including engineers, technicians and skilled workers, engaged in the operation and maintenance, and
the average years of service are nine years, which is relatively long. In addition, when there is a
vacancy, employees within ICELEC are invited to fill up such vacancy. The status of the operation and
maintenance and work site at the moment of the ex-post evaluation, as well as interviews to employees
including technicians, showed that there is a high level of ownership by these employees toward the
plant and that the operation and maintenance of PHPP is in good order.
Source: ICE.
Figure 6: Organization chart of Pirris Hydroelectric Power Generation Center
Pirris Hydroelectric Power Production
Center
Storehouse management Administrative
support Maintenance Coordination
Powerhouse Operation
Water Intake Operation
Electrical Maintenance
Mechanical Maintenance
Civil Maintenance
Electrical Maintenance of Power Systems
Maintenance of Control Systems

23
3.5.2 Technical Aspects of Operation and Maintenance
With respect to the technical level of the personnel in charge of PHPP is as follows: four out of the
45 are university graduates, 29 are technicians, six are administrative personnel, six are skilled
workers, and judging from the maintenance status, in general terms, technical level is sufficient.
However, ICE is aware that although the current technical level is enough, for the future, it is
necessary to improve employee’s skills through trainings related to power generation techniques and
maintenance. ICE has a “Training Program to Fill Skill Gaps” which is provided to all its employees.
These trainings have the objective of both filling the skill gap that exist between any employee and the
skills that his/her job requires, as well as further improving skills. Through this program, the skills of
the personnel in charge of the operation and maintenance of PHPP are also being improved. The
following table indicates some of the trainings that the maintenance personnel of PHPP took during
2013 and those that were planned for 2014.
Table 8: Examples of trainings of PHPP’s maintenance personnel
Examples of trainings conducted in 2013 Examples of trainings planned for 2014
Title of training course No. of
persons
Title of training course No. of
persons
No. of
hours
Mathematics for Technicians
How to read a Plan
Basic Electrical Engineering
IT (software including API-PRO)
Thermography Measurement I
Reliability-Centered
Maintenance(RCM)
Vibration Measurement and
Alignment
16
15
23
30
5
2
2
Metrology
Basic Knowledge on
Centrifugal Pumps
How to read a Plan
Civil Work Project Budget and
Management
Automation Theory
Human Relations in the
Workplace
Procedures for Sustainable
Improvement
3
3
6
6
18
45
45
16 hrs.
16 hrs.
16 hrs.
40 hrs.
48 hrs.
8 hrs.
8 hrs.
Source: ICE.
Some of the engineers and technicians that are in charge of the maintenance used to belong to the
PHP during project execution, and because of that experience, they have full knowledge of the PHPP,
which in turn results in a high technical level of the operation and maintenance of the plant.
Maintenance of PHPP is conducted based on detailed
maintenance manuals and plans of the respective
equipment provided by the manufacturers. The original
maintenance manuals are kept in the library of the PHPP,
and the detailed information (maintenance procedures of
each equipment, frequency, records, etc.) has been
digitalized and are managed using the maintenance
system “API-PRO”. Maintenance procedures of all
equipment strictly follow the standards of ISO9001,
14001 and 18001. Maintenance is conducted by
equipment, and there are daily inspections as well as
Figure 7: View of the Storehouse

24
preventive maintenance34
(every week, month, semester, year, and every other year). With respect to
corrective maintenance, the warranty period of almost all the equipment was until December 2013,
thus repairs were conducted free of charge by the manufacturers up to that date. After the expiration of
the warranty period, those repairs that can be done by ICE’s maintenance coordination department are
done in-house, and those repairs that cannot be conducted internally, are done by the manufacturers
with charge. All the information on maintenance procedures and measures taken are inputted by the
person in turn into the API-PRO. Thus, information including the person in charge of maintenance,
date when the maintenance was conducted and number of spare parts used, is always updated. In
addition, this system is also used for the management of spare parts, and the Storehouse Management
Department manages the spare parts based on this system. At the moment of the ex-post evaluation, it
was possible to see the whole maintenance procedure using the API-PRO, and also to confirm the
coordination that exists with the storehouse department, from which it can be said that the technical
level of maintenance that exists at the PHPP is high.
3.5.3 Financial Aspects of Operation and Maintenance
ICELEC has been in the black for the past five years with the exception of 2011 in which the
effects of the global financial crisis were still present, and so financial sustainability has no major
problems. Although capital-to-asset ratio in 2012 was 51%, which was lower than the 59% recorded in
2009, it is still high; operating profits is constantly increasing indicating that operation and
maintenance costs is being covered with the income from the electricity bills35
.
Table 9: ICELEC Profit and Loss Statement
(Unit: Million Colon)
2009 2010 2011 2012 2013
(up to November)
Operating Income (A) 521,995 539,889 553,255 575,862 652,004
Electricity business 516,697 532,234 546,273 569,118 645,451
Others 5,297 7,655 6,982 6,744 6,554
Operating Cost (B) 441,503 479,420 517,541 525,327 486,161
Maintenance cost 381,245 417,294 438,457 443,397 479,782
Operation cost 60,258 62,126 79,084 81,930 63,739
Operating profit (A) –(B) 80,492 60,470 35,714 50,535 165,843
Non-operating income 24,101 183,506 119,406 112,108 87,138
Non-operating cost 66,246 140,133 161,030 156,545 112,651
Income from dividends of
subsidiary companies
5,486 8,275 (699) 4,993 -
Current Net Profit 43,832 112,117 (6,609) 11,090 82,970
Source: Financial Statements provided by ICELEC.
Electricity tariffs in Costa Rica are fixed based on the Regulatory Authority for Public Services
34 Preventive maintenance is the maintenance conducted in a planned manner before facilities and equipment breakdown or
deteriorate. On the other hand, corrective maintenance is to repair facilities and equipment that are already damaged. 35 Moody’s, one of the major bond rating organizations, gave ICE a credit rating of Baa3 in September 2013, and changed
the future prospect to “Negative”. However, it gave a positive evaluation of “Stable” to ICELEC’s electricity business.

25
(ARESEP) Law No. 7593. This Law is based on the principle that “electricity tariffs shall be enough
to cover the necessary cost for the provision of electric services, create competitive benefits and secure
proper development”. Since January 2013, it was approved that fluctuation of fuel costs be reflected
on electricity tariffs on a quarterly basis. As can be seen, the electricity tariff system is established in
such a way that it secures the tariff income to cover the operation and maintenance costs. However, it
is also true that the industrial sector, who is arguing that increases in electricity tariffs are putting
pressure in the companies’ management, decreasing their competitiveness, is increasing movements
and lobbying activities to revise electricity tariffs.
Source: ICE
Figure 8: Fluctuation of Electricity tariffs (Colon/kWh)
With respect to the operation and maintenance of PHPP, budget for the ordinary maintenance costs
(daily inspection, preventive maintenance and corrective maintenance) is secured and is implemented
as planned36
.
Table 10: Operation and Maintenance Budget of the PHPP
(Unit: million colons)
2011 2012 2013
Operation 101.5 259.2 552.4
Maintenance 81.0 338.4 462.8
Total 182.5 597.6 1,015.2
Source: Pirris Power Generation Center
3.5.4 Current Status of Operation and Maintenance
Operation of the PHPP at the time of the ex-post evaluation was being conducted properly, and
facilities and equipment installed by the project were mostly operating normally. At the time of the
ex-post evaluation the problems indicated below were identified. With the exception of the concrete
36 According to the data of the 2013 operation and maintenance budget requested by the Pirris Power Generation Center to
ICE, which was made available by the said Center, it became clear that approximately 900 million colons were requested, out
of which only 462.8 million colons were approved. After confirming the details, it was confirmed that the difference was
mainly the budget for a backup transformer, and that the necessary budget to conduct a proper maintenance of the power
plant has been secured. The budget for the backup transformer is planned to be included in the 2015 budget request.

26
lining in some parts of the headrace tunnel, these problems were not because of deficiencies in the
design nor in the construction stage. Measures have already been taken and it was confirmed that these
are included in specific repair plans.
Table 11: Maintenance status at the time of project completion and ex-post evaluation
Problems Status as per April 2014
RCC Dam
Problems with the electrical system
Water leakages in the radial gate
Elevator out of order
Repaired
Repaired
Repaired
Powerhouse
Elevator out of order
Damages in the hydraulic governor of
the Second Turbine
Repaired
Repaired
Headrace
tunnel
Problems with the valve
Tunnel concrete lining is partially
incomplete
Wear of instruments exposed in the
valve area
Paint stripping at the high-pressure
pipe
Not repaired. It is necessary to clear the water
from the headrace tunnel to do the repair. Thus
during 2014, scale, scope and timing of the repair
will be assessed, and it will be included in the
repair plan after 2015
Concrete lining is planned to be conducted by
including it in the 2015 or 2016 maintenance plan
A shed to protect the exposed instruments is
planned to be constructed by the end of August
2014
Being painted by a contractor
Intake Unsuitable operation of the water
intake measurement system
Repaired and being monitored
Source: Based on interviews to ICE Pirris Power Generation Center and responses to the questionnaire.
With respect to spare parts, there is a storage house for materials and equipment inside the
premises of the power house, and because it is linked to the maintenance system as mentioned earlier,
inventory management is sufficient. In addition, during the ex-post evaluation survey it was possible
to confirm that ISO standards related to security management, cleanliness and tidiness are being
followed strictly both at the power house and at the RCC dam. From the above, it is clear that
operation and maintenance are conducted properly, and from a general point of view, it can be said that
the current status of the operation and maintenance is good.
The project’s operation and maintenance institutional structure was sufficient both during project
execution as well as after project completion and technical level of maintenance is high. Financial
status is also in the black with the exception of 2011, and from 2009 operating profits have always
been positive, which confirms that electricity tariffs are sufficient to cover operation and maintenance
costs. With respect to maintenance status, although there are some issues in some equipment, these
have already been included in the 2015 and 2016 maintenance programs in which specific repair and
replacements have been planned. From the above, the project’s institutional organization, technical
level and financial status have no major problems, therefore sustainability of the effect brought about
by project is judged to be high.

27
4. Conclusion, Recommendations and Lessons Learned
4.1 Conclusion
The project aimed to improve the stability of electric supply capacity in Costa Rica by constructing
a hydroelectric power plant in the middle stretches of the Pirris River which runs through the central
plateau of the country.
The project was in line with Costa Rica’s national development plans, development needs and
Japan’s assistance policies, both at the time of the appraisal and at the time of the ex-post evaluation.
Therefore its relevance is high. The main indicators which reflect the effects of the PHPP have either
mostly achieved its targets or are improving. In addition, in a country where hydroelectric power
generation is the base load, the project has not only strengthened the hydroelectric generation capacity,
but it has also contributed to a more stable electric supply capacity as well as to solving future
electricity supply-demand gaps. These effects can be recognized as the PHPP is connected to the
National Electricity System, through the Parrita-Lindora transmission line (230kV, 118km) which was
constructed as a separate project of the Executing Agency. Based on the above, the project
effectiveness is evaluated to be satisfactory. In addition, other positive impacts were observed such as
afforestation activities and effects from the construction of access roads, among others, thus the
project’s level of achievement of its intended effects and impacts is high. The efficiency of the project
is evaluated to be low, because both project period and project cost significantly exceeded the plan.
With regard to the sustainability of the effects of the project, no major problems have been observed in
the institutional, technical and financial aspect of operation and maintenance, therefore sustainability
of the project effect is high.
In light of the above, this project is evaluated to be satisfactory.
4.2 Recommendations
4.2.1 Recommendations to the Executing Agency
It is desirable that the problems indicated in the Status of Operation and Maintenance section are
solved by carrying out the maintenance program exactly as planned. According to the executing
agency, especially with respect to the valve of the conveyance works, it might become necessary to
empty the tunnel, thus it is imperative to have a clear idea of when to do the repair work. Since this
means that the operation of the PHPP would have to be stopped temporarily, the management team of
ICELEC is urged to assess possible measures, include them in the repair program and conduct the
repair as soon as possible.
4.2.2 Recommendations to JICA
None.

28
4.3 Lessons Learned
Improving the accuracy of the geological survey at the time of the Detailed Design
In this project, at least three geological surveys were conducted if the 1992 F/S is included. Due to
time constraints for the geological survey in the 1992 F/S, it was advised that a more detailed
geological survey should be conducted. Afterwards, ICE carried out additional surveys as well as
another F/S, until finally reaching the signing of the Loan Agreement. However, after starting of civil
works, it was found that there were problems in the soil of some of the construction sites, resulting in
design changes. These changes significantly affected the project output, costs and period. Just as ICE
itself has indicated as one lesson learned, a more detailed geological survey must have been done. That
is, at the time of the detailed design, it would have been possible to minimize changes in the design of
the dam by carrying out more accurate geological surveys in terms of boring survey area, frequency,
interval and depth. These measures would have led to a more efficient implementation of the project.
End

29
Comparison of the Original and Actual Scope of the Project
Item Original Actual
I. Project Outputs
[Civil Works]
1. Preparatory Works
a. Access roads for works
b. Camp sites
c. Queries
2. RCC Dam
3. Water Intake
4. Headrace tunnel from dam to
powerhouse
5. Penstock
6. Powerhouse
7. Tailrace
[Electromechanical Equipment and
Facilities]
8. Generator
9. Turbine
10. Main Transformer
11. Switchyard
12. Communication facilities for
electrical control
[Consulting Services]
70km
3
6
Effective storage capacity: 30
million m3
Area:1.14km2
Height of the dam: 113m
Crest length:270m
H:58m×L:9m×W:8m
Discharge:18m3/s
10.6km
1,170m
Generation capacity: 128MW
Electric power generation:
561GWh
L:50m×H:20m×W:30m
262m / Diameter: 3.3m
76MVA, 60Hz, 720RPM, W41×2
64MW, 830.7m, 720RPM×2
(Pelton turbine)
13.8/230kV×3
230kV×1
ISDN
Optic fiber link
Radio system
Assistance of Detailed Design;
review of Tender Documents,
assistance of tendering process;
assistance of construction
supervision; assistance for project
management
145km
4
As planned
Effective storage capacity:
36 million m3
Area: 1.4km2
Height of the dam: As
planned
Crest length: As planned
H:32m×L:7.1m×W:7.1m
Discharge: As planned
10.5km
1,144m
Generation capacity:
138MW
Electric power generation:
503.65GWh
L:43.8m×H:18.6m×W:22.3
m
As planned
As planned
69MW, 830.7m,720RPM×2
As planned
As planned
As planned
As planned
As planned
As planned
As planned
II. Project Period
April 2001 - July 2007
(76 months)
April 2001 - December 2012
(131 months)

30
III. Project Cost
Amount paid in Foreign currency
Amount paid in Domestic currency
Total
Japanese ODA loan portion
Exchange rate
15,144 million yen
14,299 million yen
(132 million US dollars)
29,443million yen
16,683 million yen
1 U.S. dollar = 108.36
yen
(As of November 2000)
36,326 million yen
42,729million yen
(415 million US dollars)
79,056million yen
16,402 million yen
1 U.S. dollar =
103.03 yen
(Average of monthly rates
between April 2001 and 2011)
Source: ICE


![[Japanese Culture] Japanese Fairy Tale](https://static.fdocuments.net/doc/165x107/577dab5a1a28ab223f8c5222/japanese-culture-japanese-fairy-tale.jpg)