Reproductions supplied by EDRS are the best that can be ... women are poorer than men because many...
52
DOCUMENT RESUME ED 439 195 UD 033 414 AUTHOR Christopher, Karen; England, Paula; McLanahan, Sara; Ross, Katherin; Smeeding, Tim TITLE Gender Inequality in Poverty in Affluent Nations: The Role of Single Motherhood and the State. PUB DATE 2000-01-28 NOTE 50p.; Revised version of a paper presented at a conference on Child Well-Being in Rich and Transition Countries (Luxembourg, September 30-October 2, 1999). Funded by the MacArthur Research Network on Families and the Economy. PUB TYPE Reports Evaluative (142) Speeches/Meeting Papers (150) EDRS PRICE MF01/PCO2 Plus Postage. DESCRIPTORS *Economic Factors; *Fatherless Family; Foreign Countries; *Mothers; *Poverty; *Sex Differences IDENTIFIERS Single Parents; *Welfare State ABSTRACT Women have higher rates of poverty than men in almost all societies. This paper compares the difference between male and female poverty in modern nations, using data from the Luxembourg Income Study (LIS) to compare men's and women's poverty rates in eight Western industrialized countries in the 1990s. The LIS contains information on household income for more than 25 countries in 90 databases. The most recent wave of data was used to compare poverty rates in the United States, Australia, Canada, West Germany, France, the Netherlands, Sweden, and the United Kingdom. The findings show that women have higher poverty than men in every country except Sweden. However, the ratio of women's poverty to men's poverty among the nonelderly differs by nation, the highest being the United States (1.38), followed by Australia (1.30). To assess how countries' welfare states affect gender inequality, the hypothetical sex ratios were calculated if the state did no taxation and transfer payments. In the United States, Australia, Canada, France, and Germany, the welfare state does little to reduce the gender inequality in poverty produced by single motherhood and labor market inequalities. The United Kingdom, in contrast, reduces its sex-poverty rate by 8% through its tax and transfer system. The Netherlands and Sweden seem to be the countries in which welfare states do the most for women relative to men. Overall, nations with a higher percentage of women who are single mothers will generally have a higher sex gap in poverty. An appendix contains a table of equivalence scales from the analysis. (Contains 21 references.) (SLD) Reproductions supplied by EDRS are the best that can be made from the original document.
Transcript of Reproductions supplied by EDRS are the best that can be ... women are poorer than men because many...
DOCUMENT RESUME
ED 439 195 UD 033 414
AUTHOR Christopher, Karen; England, Paula; McLanahan, Sara; Ross,Katherin; Smeeding, Tim
TITLE Gender Inequality in Poverty in Affluent Nations: The Roleof Single Motherhood and the State.
PUB DATE 2000-01-28NOTE 50p.; Revised version of a paper presented at a conference
on Child Well-Being in Rich and Transition Countries(Luxembourg, September 30-October 2, 1999). Funded by theMacArthur Research Network on Families and the Economy.
PUB TYPE Reports Evaluative (142) Speeches/Meeting Papers (150)EDRS PRICE MF01/PCO2 Plus Postage.DESCRIPTORS *Economic Factors; *Fatherless Family; Foreign Countries;
*Mothers; *Poverty; *Sex DifferencesIDENTIFIERS Single Parents; *Welfare State
ABSTRACTWomen have higher rates of poverty than men in almost all
societies. This paper compares the difference between male and female povertyin modern nations, using data from the Luxembourg Income Study (LIS) tocompare men's and women's poverty rates in eight Western industrializedcountries in the 1990s. The LIS contains information on household income formore than 25 countries in 90 databases. The most recent wave of data was usedto compare poverty rates in the United States, Australia, Canada, WestGermany, France, the Netherlands, Sweden, and the United Kingdom. Thefindings show that women have higher poverty than men in every country exceptSweden. However, the ratio of women's poverty to men's poverty among thenonelderly differs by nation, the highest being the United States (1.38),followed by Australia (1.30). To assess how countries' welfare states affectgender inequality, the hypothetical sex ratios were calculated if the statedid no taxation and transfer payments. In the United States, Australia,Canada, France, and Germany, the welfare state does little to reduce thegender inequality in poverty produced by single motherhood and labor marketinequalities. The United Kingdom, in contrast, reduces its sex-poverty rateby 8% through its tax and transfer system. The Netherlands and Sweden seem tobe the countries in which welfare states do the most for women relative tomen. Overall, nations with a higher percentage of women who are singlemothers will generally have a higher sex gap in poverty. An appendix containsa table of equivalence scales from the analysis. (Contains 21 references.)(SLD)
Reproductions supplied by EDRS are the best that can be madefrom the original document.
Gender Inequality in Poverty
in Affluent Nations:
The Role of Single Motherhood
and the State
Karen Christopher, University of PittsburghPaula England, University of Pennsylvania
Sara McLanahan, Princeton UniversityKatherin Ross, The Urban InstituteTim Smeeding, Syracuse University
*1-28-2000 Version. Direct correspondence to Paula England,Population Studies Center, University of Pennsylvania, Philadelphia, PA19104-6298 USA. E-mail: PEnglandApon.upenn.edu. We thank theMacArthur Research Network on Families and the Economy for fundingthis research. An earlier version of this paper was presented at theconference on Child Wellbeing in Rich and Transition Countries,Luxembourg, September 30-October 2, 1999. Forthcoming inVleminckx, K., Smeeding, T.M., eds. Child well-being in ModernNations. Bristol: The Policy Press, 2000.
U.S. DEPARTMENT OF EDUCATIONOffice of Educational Research and Improvement
EDUCATIONAL RESOURCES INFORMATION
atCENTER (ERIC)
This document has been reproduced asreceived from the person or organizationoriginating it
71-BEST COPY AVAILABLE Minor changes have been made to
improve reproduction quality.MM ° Points of view or opinions stated in thisCl document do not necessarily representCZ) official OERI position or policy.
\...., }2
PERMISSION TO REPRODUCE ANDDISSEMINATE THIS MATERIAL HAS
BEEN GRANTED BY
KayeA 5toplvit
TO THE EDUCATIONAL RESOURCESINFORMATION CENTER (ERIC)
1
b
Gender Inequality in Poverty in Affluent Nations:
The Role of Single Motherhood and the State
Women have higher poverty rates than men in almost all societies
(Casper et al. 1994). In this paper, we compare modern nations on this
dimension. We use the Luxembourg Income Study (LIS) to compare
women's and men's poverty rates in eight Western industrialized
countries circa the early 1990s: the United States, Australia, Canada,
France, West Germany, the Netherlands, Sweden, and the United
Kingdom. We define individuals to be in poverty if they live in
households with incomes below half the median for their nation. We
examine, for each country, the ratio of women's to men's poverty rate.
We then use simple demographic simulation methods to estimate how
this gender disparity is affected by how prevalent single motherhood is,
and by state tax and transfer programs that may particularly help
households headed by women.
Our guiding framework emphasizes a web of interdependencies.
2
3
Individuals rely on others (family members, employers, or the state) to
obtain money and what it can buy. In addition, we have relationships
with other peopleas friends, spouses, employees, fellow citizens, or
neighborsand in this we are reliant on the labor of those who reared
these people. In this second emphasis, our analysis is inspired by
feminist interrogation of who pays the costs of children (England and
Folbre 1999; Folbre 1994a; 1994b). In this view, an important reason
that more women than men are in poor households is because women
are paying more of the costs of children than men. Folbre (1994a)
argues that many members of society share in the benefits of children
being brought up well. Most of us are dependent upon those who rear
children for our ability to find caring friends, a spouse, trustworthy
neighbors, or employees. But we seldom recognize this dependency,
and market mechanisms don't get all the beneficiaries to pay the parents
or others who reared children. Often when services have this "public
good" aspect, as for example with national defense or highways, the
state steps in to socialize the costs. Many social welfare programs, in
3
4
effect, socialize some of the costs of rearing children. But states differ
in how much they do this, and this may affect how much individual
mothers bear the costs of children relative to individual fathers, and
relative to male and female taxpayers. Single motherhood also affects
the distribution of the costs of children between individual mothers and
fathers, since in the case of nonmarital births and divorce, individual
fathers often contribute little or nothing to the labor of rearing children
and little to the financial costs. If women are poorer than men because
many of them are raising children alone, this is evidence that mothers
are bearing a disproportionate share of the costs of children relative to
fathers or other citizens. The prevalence of single mothers and the way
they (and others) are treated by social policies both affect the sex gap in
poverty rates.
Past Literature On Gender Inequality in Poverty Rates
Individuals get income from three main sources: the family, the market
and the state. Households get their money primarily from household
4
5
members selling their labor in labor markets or receiving transfers from
government programs.' Family members generally pool income, so the
family serves to redistribute income within households, with those who
either work for earnings or receive government transfers sharing these
types of income with those who receive less or no income from outside
the household.
Women have a higher poverty rate than men in almost all nations.
(Sweden is the exception among the countries in our sample.) In
thinking about possible causes of the gender gap in poverty rates, it is
crucial to understand that poverty is measured at the household or family
level in most all government and academic statistics. An individual is
in poverty if s/he lives in a household whose total income falls below the
poverty line. In households with an adult couple, either both partners are
in poverty or neither is in poverty. So, if all adults were married to or
cohabiting with a person of the other sex, there would be no sex gap in
poverty.2 Thus, the sex gap in poverty exists because single women are
5
poorer than single men. And for any size of the sex gap among singles,
the overall sex gap will be larger if a higher proportion of the population
is single.
Why are single women's households poorer than single men's? There
are two main reasons--women's lower income and the fact that more
single women live with children. Having children in the household
affects the likelihood of poverty in one definitional way. Since the
poverty line is adjusted for household size, the presence of children in a
household raises the income necessary for the household to escape
poverty, and thus, income equal, single adults who live with children are
more likely to be poor than those who live alone. Single women are
much more likely to live with children than single men, since women
usually have custody of the children in cases of divorce or nonmarital
births. Thus, even if single men and women had equal earnings, more of
the women than the men would be in poverty by virtue of supporting
children.
6
7
Single women's greater poverty also comes from their lower earnings.
Since single individuals typically do not have adult household members
to transfer income to them, most are reliant on either government
transfers or earnings. Although research on the sex gap in pay has
seldom examined patterns separately by marital status, it is safe to
assume that single women earn less than single men for many of the
same reasons that women earn less than men more generally. (For a
comparative overview of gender inequality in employment in earnings in
modern nations, see Gornick 1999.)
Jobs are still quite segregated by sex, both because a myriad of social
forces encourage individuals to seek out sex-typical jobs and because of
sex discrimination in hiring and job placement by employers (Jacobs
1989; Reskin and Roos 1990). Segregated jobs create a sex gap in pay
because, even though "female" jobs require as much education, on
average, as "male" jobs, they pay less (England 1992). The low pay in
7
8
"women's jobs" may arise because of crowding, the greater excess of
supply relative to demand in female jobs than in male jobs, resulting
from the exclusion of women from "male" jobs (Bergmann 1986). In
addition, there is evidence that sex bias affects employers' decisions
about how much to pay "women's jobs" relative to jobs dominated by
men; this is the type of discrimination at issue in "comparable worth"
(England 1992; Sorensen 1994).
Parenthood reduces women's but not men's pay, also contributing to the
sex gap in pay. Motherhood lowers the pay of women because some
women leave the labor force or work part-time when they have children.
In the case of single mothers this may require living on government
transfer payments. When mothers return to work full-time, their earnings
suffer from the accumulated deficit in experience and seniority.
However, even after adjustments for prior experience, motherhood
lowers women's earnings (Budig and England 1999; Waldfogel 1997,
1998). This may be because child care leaves mothers with less energy
8
9
when they go to work, cutting into their productivity, because they trade
off higher wages for "mother-friendly" jobs,3 or because employers
discriminate against mothers.
Nations differ in how their welfare states deal with these issues. Orloff
(1993:319) suggests the utility of classifying welfare states along "a
general dimension of self-determination" that would consider how much
the state allows individuals to be independent from either markets or
marriages. This contrasts with conceptualizations, like Esping-
Andersen's (1990) Marxist-inspired notion of "decommodification,"
which focus on how much independence from markets the state
provides. A feminist critique of this formulation is that it implicitly
assumes that men's (or women's) dependence on capitalist employers is
more problematic than wives' dependence upon husbands for money. In
her discussion of the gendered nature of welfare states, Orloff (1993)
focuses on how much the state facilitates women's independence from
either employers or husbands. Her work implies that a large sex gap in
9
10
poverty is not a necessary consequence of a high incidence of single
mothers. This is because welfare states can ameliorate poverty among
single mothers, either through policies that help women combine
employment with motherhood, through enforcement of obligations that
noncustodial fathers pay child support, and/or through transfer payments
that pull single mothers out of poverty.
The thrust of the literature on welfare states is that the U.S. and other
Anglo-Saxon nations provide less than other nations that facilitates
mothers' employment as well as less generous and universal income
support. Nordic nations provide the most, with other nations
intermediate. One might infer from this that nations in which the
welfare state is doing more for women (and mothers) have a lower
gender gap in poverty. However, state policies are not necessarily the
cause of national differences in the gender gap in poverty. In part this is
because there are other determinants of women having higher poverty
than men, such as the proportion of women who are single mothers and
10
the relative treatment of men and women in private-sector labor markets.
Also, having relatively generous programs for single women (including
single mothers) will not necessarily equalize poverty rates for women
relative to men. It could be that welfare states that have generous
policies for single women also have generous policies for single men,
and therefore that generous welfare states do nothing close the sex gap
in poverty.
Our goal is to assess the extent to which national differences in the
gender gap in poverty come from differences in family structure (the
proportion of people who are single, and whether single women are
mothers) and governmental transfers more favorable to women versus
men. The past research that comes closest to addressing our question is
that of Casper et al. (1994). Using data from the mid-1980s, they showed
nations arrayed as follows, in descending order of the size of their ratio
of women's to men's poverty rate. The U.S., Australia, West Germany,
Canada, and the U.K. all had a sizeable gender gap. In Italy and the
11
12
Netherlands women's poverty rate was about the same as men's. In
Sweden, women's poverty rate was actually less than men's. Like
Casper et al. (1994), we use LIS data, but we use a more recent wave of
data for each country. We analyze the same countries except that we
have added France because it is well known for welfare state policies
directed at children and excluded Italy.4
Casper et al. (1994) used logistic regression to predict individuals'
poverty from several variables; most describe household composition
and one dummy variable indicates whether are not individuals are
employed. They then performed a decomposition showing that nations
with more women relative to men living in households with children- -
which occurs when there are more single mothers--have larger sex gaps
in poverty. They found that the high levels of employment among single
females in Sweden are important in reducing women's poverty relative
to men's. They speculate that the near equal poverty rates of the Dutch
must come from generous transfer programs, since they show that the
12
BEST COPY AVAILABLE
13
Netherlands has low female employment and relatively high rates of
single motherhood, both factors that would tend to increase women's
poverty relative to men's.
Our analysis, like that of Casper et al. (1994), examines the effect of a
nation's family patterns (e.g. prevalence of single mothers) on the
gender gap in poverty. On this question, our contribution is in more
detailed measures of family status categories and use of more recent
data. Their analysis did not examine the contribution of the state to
men's and women's poverty. Their conclusions that the relatively low
gender gap in poverty in the Netherlands is explained by welfare policies
was largely speculative. We assess this more directly through our
simulations that examine each nation's ratio of women's to men's
poverty including and excluding transfer payments, after standardizing
poverty rates for demographic differences between nations in the
proportion of people in various family status categories.
DATA, MEASURES, AND METHOD
13
14
We use the Luxembourg Income Study (LIS). This data set contains
information on household income for over 25 nations in 90 databases
covering the period 1967 to 1995, and new waves of data continue to be
added (LIS User Guide 1998). The LIS consists of a set of household
income surveys representing the civilian non-institutionalized
population of each nation. We use the most recent wave for each of 8
nations; most are from early to mid-1990s. The United States database is
the March 1995 Current Population Survey with annual income
information for 1994. The other nations we examine are the U.S. (1994),
Australia (1994), Canada (1994), West Germany (1994), France (1989),
Netherlands (1991), Sweden (1992) and the United Kingdom (including
England, Scotland, Wales and Northern Ireland, 1995).5
In order to avoid including students and retirees, whose poverty is driven
by very different factors than that of "prime-age" adults, we limited our
sample to adults from age 25 to 54. Although our measures of poverty
and household type are defined at the household level, individual men
14
15
and women are the units of analysis.
The measure of economic poverty we use here considers an individual in
poverty if she or he lives in a household with a (size-adjusted)
disposable money income that is less than half the median for
households in the nation. This is a relative notion of poverty that
compares the economic well being of individuals to other residents of
the same nation (not to those in other countries or to some absolute
standard). We measure poverty at the household level. One limitation
of measuring poverty at the household level is the implicit assumption of
perfect pooling between household members. This ignores that an
individual who brings money into the household may not share
perfectly, but may retain disproportionate power over how money is
spent and may consume more than other family members. There is a
strong theoretical and an inconclusive but suggestive empirical literature
proposing that women may have less decision-making power over how
money is to be spent and in bargaining over other issues when they are
15
16
dependent on their husbands for money. (For reviews, see England and
Kilbourne 1990; Lundberg and Pollak 1996.) On the other hand, to
assume no pooling would even more seriously distort individuals' ability
to consume and to participate in societies in ways that require money.
The nonemployed wife of a corporate executive with extremely high
earnings would be classified in poverty if we took an individual rather
than household definition of poverty. Thus, we think the household
definition is preferable, as long as we do not forget that those who earn
or otherwise receive money from outside the household may gain more
from it than other household members.
The forms of income that go into the determination of whether a
household is in poverty are cash and near-cash income. LIS data sets
contain variables for earnings, pensions, many types of government
transfers, and other sources of income such as property income and child
support payments. These were added to form total household income.
We also include near-cash transfers such as food stamps7 and cash
16
17
denominated housing allowances in our definition of household income.
This gross income was then converted to "disposable income" by
subtracting out income and payroll taxes. For our simulation designed
to assess the effect of welfare state's tax and transfer programs on
gender inequality in poverty, discussed below, we compare ratios of
women's to men's poverty computed using this disposable (post-tax,
post-transfer) income to those computed using pre-tax, pre-transfer
income. (For both we take the poverty line to be half of median
disposable income.) Even post-transfer income excludes non-cash
benefits such as health care, child care, and education; they are not
measured by the US.
Before comparing a household's income to the poverty line for the
relevant nation to determine whether the household is in poverty,
income was adjusted by a commonly used equivalence scale. (The U.S.
governmental poverty line, which we do not use, is also constructed with
an equivalence scale.) Equivalence scales adjust income for family size.
17
18
However, instead of a simple linear transformation like per capita
income, they are calibrated to reflect the notion that while a larger
family needs more income than a smaller family, given economies of
scale, a family of four doesn't need twice of what a family of two needs.
Details on our choice of an equivalence scale are in the Appendix. The
Appendix also includes calculations showing that our basic substantive
conclusions are fairly robust regardless of whether our measure of
family size weights each adult and child as 1, or weights children 25%
more or less than adults. The former assumes that households need
more money per child than per adult because children need child care,
while the latter assumes children consume less of some goods, such as
food.
To assess how much between-nation differences in household
composition affect the degree of gender inequality in poverty, we
perform a simple demographic simulation making use of post-tax, post-
transfer (disposable) income. To do this, we first classify the individual
18
19
women and men who are our units of analysis by the household type
they live in, i.e. whether they are part of a male-female couple or not and
by the presence of absence of children under age 18 in the household.
As shorthand, we will refer to both married and cohabiting male-female
couples as "married."8 Whether individuals are classified as "parents" is
determined not by whether they have biological children, but by whether
a child under 18 lives in their household. So, for example, single fathers
who do not live with their children are classified as male single non-
parents. This yields four household types for each sex: married parents,
married non-parents, single parents, and single non-parents. The overall
poverty rate for women is a weighted average of the poverty rate for
women in each of the four household-type categories, and analogously
for men.
Our analysis begins with a simple calculation of poverty rates for men
and women. The measure of the gender gap in poverty that we use is the
ratio of women's poverty rate to men's poverty rates, called the "sex-
19
20
poverty ratio." (We take this term from McLanahan et al. 1989.) We
also examine these ratios for subgroups such as singles and single
parents.
We then move to simulations designed to assess the effects of welfare
state tax and transfer policies, and the effects of household composition
on cross-national differences in gender inequality in poverty. First, to
assess the effects of tax and transfer policies, we compare the sex-
poverty ratio if income is pre-tax and pre-transfer to the sex-poverty
ratio if it is post-tax and post-transfer. If we are willing to assume no
behavioral response (in labor supply, marriage, cohabitation, or fertility)
to policies, this tells us whether overall the tax and transfer policies help
women or men more, as regards being or not being in poverty.
Second, we assess the effects of family composition on nations'
sex-poverty ratio by performing a simulation that gives every other
nation the U.S. proportion of men and women in each household type,
20
21
but retains the nation's own poverty rates within household types. In
essence, we weight a country's sex- and household-type-specific poverty
rates by U.S. weights for family demography. This gives us the sex-
poverty ratios other nations would have if they had the U.S. household
composition.
RESULTS
Table 1 shows the raw sex gap in poverty in various subgroups. The
first two columns examine poverty rates among all men and women ages
25-54 and the third shows the "sex-poverty ratio," i.e. women's poverty
rates divided by men's poverty rates.
[TABLE 1 ABOUT HERE.]
Looking at the poverty rates, we see that men in Sweden and the
Netherlands have substantially lower poverty rates than men in the other
countries (under 5%), while U.S. and Canadian men have the highest
poverty rates (11%). The rank order of countries by women's poverty
21
22
rates is the same, with the lowest women's poverty in Sweden (3%) and
the Netherlands (6%) and highest rates in Canada (13%) and the U.S.
(15%).
Only Sweden has a sex-poverty ratio less than one, indicating that
Swedish men are more likely to live in poverty than Swedish women.
But both sexes have very low poverty, so the difference is not large in
percentage point terms (4% for men and 3% for women). In all other
countries, women have higher poverty rates then men; the country with
the next lowest sex-poverty ratio is France, where women are 11% more
likely than men to live in poverty. Sex-poverty ratios are higher than
this in Canada, the Netherlands, Germany and U.K., where women are
between 13% and 20% more likely to live in poverty than men. The two
outliers are Australia and the U.S., where women are respectively 30%
and 38% more likely to live in poverty than men.
Table 1 also shows poverty rates and ratios for single men and women.
22
23
We examine singles separately because the overall gender gap in
poverty is driven entirely by the gap among singles, weighted by what
proportion of people are single, as discussed previously. Nations'
rankings in single men's poverty rates are quite similar to the ranking
for all (single and married) men. The same holds for single women.
The low poverty of single women in Sweden (5%) is striking. Even
single men in all countries have higher poverty rates, and the poverty
rates of single women in other countries are in an entirely different
ballpark than that of their Swedish counterparts, from 13% in the
Netherlands to a high of 32% in the U.S. In all countries but Sweden,
single women have higher poverty than single men. In all countries but
Sweden and France, single women's poverty is more than 50% higher
than men's.
Table 1 also shows the poverty rates for single mothers. Swedish single
mothers are outliers with a poverty rate of only 3%. Rates of poverty for
single mothers are very high in all other countries, from a low of 25% in
23
24
France and the Netherlands to a high of 47% in the U.S. Single fathers
have poverty rates lower than single mothers, but quite high in the 10-
30% range except for the low 7% rate of Sweden.9
These descriptive statistics allow several generalizations: Women's
poverty rate is higher than men's everywhere except Sweden. However,
there are large national differences in the extent of inequality between
women's and men's rates of poverty. Single women, particularly single
mothers, have higher poverty rates than most other groups of men or
women in all nations but Sweden. But the extent to which single women
and single mothers have "surplus" poverty varies by nation.
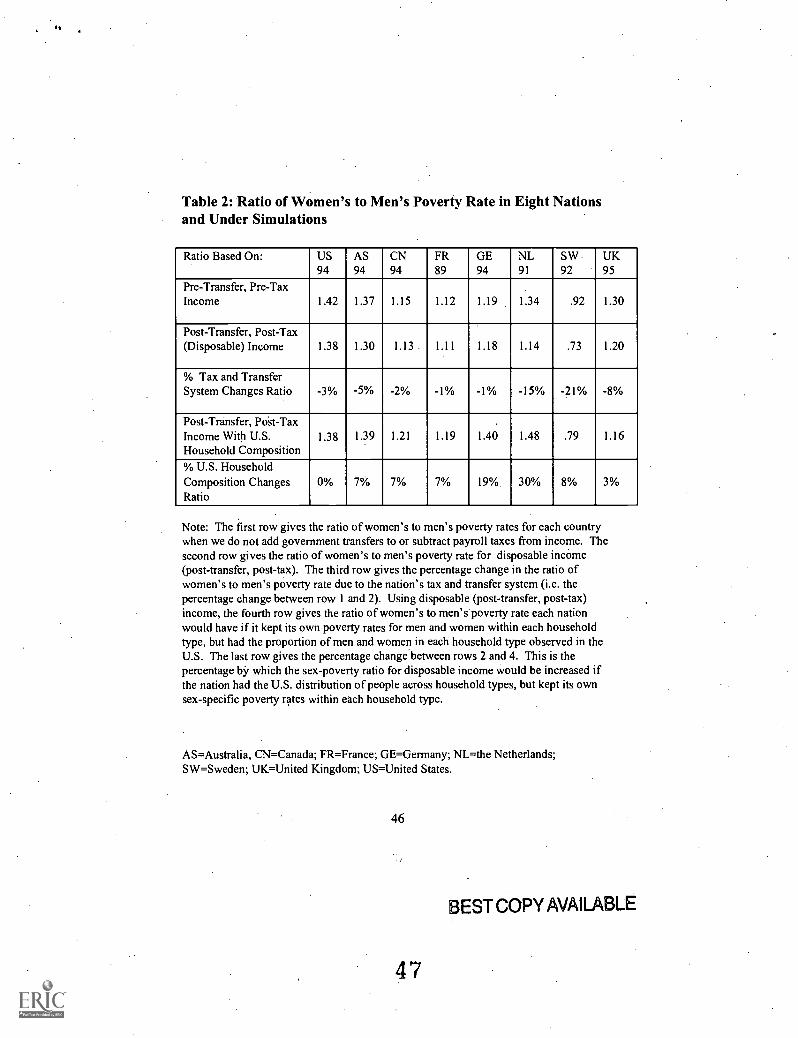
Next we want to assess how much differences between nations in their
sex-poverty ratio are driven by differences in their tax and transfer
policies, and how much by the prevalence of single motherhood. To do
this, we perform data-based simulations, presented in Table 2.
[TABLE 2 ABOUT HERE.]
24
25
First, we want to assess whether, all in all, tax and transfer payment
policies help reduce women's poverty relative to men's. That is, we
want to know if they change the ratio of women's poverty rate to men's.
For that to be true, the policies would have to raise proportionately
more women than men above the poverty line. To examine this, we first
compute hypothetical poverty rates for women and men in each nation
based on their income before subtracting taxes and before adding
government transfers. The ratio of women's to men's poverty in the
first row of Table 2 comes from these calculations. It can be compared
to the second row in Table 2, which gives the sex-poverty ratio when
each household's actual disposable (post-tax, post-transfer) income is
used.
Table 2 shows that in all cases the actual ratio of women's to men's
poverty is lower than it is before taxes and transfers, implying that every
nation's welfare state pulls proportionately more single women than
25
26
single men out of poverty. However, in most nations the reductions are
very small. If we count any reduction less than 5% as trivial, then the
welfare states of the U.S., Canada, France, and Germany are not
redistributive between men and women, at least across the poverty line.
They reduce the sex-poverty ratios by 3, 2, 1, and 1% respectively. The
tax and transfer systems of Australia and the U.K. are slightly more
friendly to women relative to men as regards poverty; they reduce the
sex-poverty ratio by 5% and 8% respectively. The nations with tax and
transfer systems that help women out of poverty the most, relative to
men, are the Netherlands and Sweden, whose systems reduce the ratio of
women's to men's poverty by 15% and 21% respectively (Table 2).
Thus, the fact that the U.S. has the highest ratio of women's poverty to
men's poverty can be attributed in part to its less gender-redistributive
system of tax and transfer policies as regards poverty. This is
particularly true in comparison with the Netherlands and Sweden.
The two nations whose welfare states reduce the gender gap in poverty
26
27
the most, Sweden and the Netherlands, also have the lowest poverty
rates of both men and women. However, the Netherlands has much
higher poverty of single mothers (25%, similar to that of France) than
Sweden (3%). The policies of most of the nations are scarcely
redistributive across gender lines. Some nations, like France and
Germany, may have relatively generous welfare systems compared to
the U.S., but because they help men nearly as much as women, they
scarcely reduce the gender inequality in poverty produced by family and
market.
We next address the question of the effect of family demography on the
ratio of women's to men's poverty. To do this, we can standardize any
nation's poverty rates to the demography of any other. To avoid too
many comparisons, and because the U.S. has the worst sex gap in
poverty, we use the U.S. as a comparator. The fourth row of Table 2
gives the hypothetical ratio of women's to men's poverty for each nation
if it were given the family demography of the U.S.
27
28
To calculate this, we first divide the individuals in each nation into eight
sex-specific household types. That is, we divide each sex into married
parents, married non-parents, single parents, and single non-parents.
The U.S. poverty rate for each of these groups is computed from the LIS
U.S. data. Then we create hypothetical male and female poverty rates
for the other nations under the assumption that they had the U.S. family
demography. To do this, for each sex, in each nation, we take a
weighted average of that nation's observed poverty rates. If we used
that nation's proportion of persons of that sex who are in that household
category, we would get the nation's observed (disposable, i.e. post-tax,
post-transfer) poverty rate. However, by using U.S. household category
proportions as weights, we get the poverty rate the nation would have if
it had U.S. family demography. The sex-poverty ratios corresponding to
these hypothetical rates are row 4 of Table 2. By comparing them to
row 2, the nation's actual post-transfer, post-tax ratios, we see how
much their gender inequality in poverty would be increased if they had
28
29
the U.S. family demography. Close examination of the detailed numbers
leading to these rates and ratios makes clear that it is largely the U.S.
higher proportion of single mothers that drives the differences between
the sex-poverty ratios with the nation's own versus the U.S. family
demography (row 2 versus row 4 in Table 2). The last row of Table 2
gives the percent by which the sex-poverty ratio is increased when each
nation is given the U.S. family demography (as weights) but keeps its
own poverty rates within household types.
The last rows of Table 2 show that every nation would have a higher
ratio of women's to men's poverty if they had the U.S. household family
composition. This is largely due to the high percentage of U.S. women
who are single mothers, about 12%. In Sweden, France, Germany, and
the Netherlands only 5% of women are single mothers. The Anglo-
Saxon nations have higher rates with Australia at 8%, Canada at 9%, the
U.K. at 11%, and the U.S. the highest at 12%. We see that, given that
the U.K. has nearly as many single mothers as the U.S., if they had the
29
30
U.S. family demography their sex-poverty ratio would go up only 3%.
But the ratios of Australia, Canada, France, and Sweden would all go up
7-8%. The ratios for Germany would go up 19% and the Netherlands
would go up 30%. Despite the fact that Germany and the Netherlands
have about the same proportion of single mothers as France and Sweden,
the ratio of women's to men's poverty would go up much more in the
former than the latter two nations if they had the U.S. family
composition. This is largely because single mothers have higher poverty
relative to single men in Germany and the Netherlands than in France
and Sweden.
CONCLUSION
Women have higher poverty than men in every nation besides Sweden.
However, the ratio of women's poverty to men's among the nonelderly
differs by nation, being highest in the U.S. (1.38), followed by Australia
(1.30). In this paper, we explored the operation of the welfare state and
family demography as they affect these sex-poverty ratios and how they
30
31_
differ across nations.
To assess how nations' welfare states affect gender inequality in
poverty, we compared the hypothetical sex-poverty ratios if the state did
no taxation and transfers (that is the ratios calculated from pre-transfer,
pre-tax income) to the actual ratios (calculated on disposable, i.e. post-
transfer, post-tax income). Systems of taxation and transfer payments
are the major way that welfare states affect the distribution of income.
While our analysis does not consider the effects of specific programs, it
provides a good "bottom line" assessment of whether tax and transfer
systems bring proportionately more women or men out of (or into)
poverty. The U.S., Australia, Canada, France, and Germany all reduce
the ratio of women's to men's poverty rates by 5% or less through their
tax and transfer systems. Thus, in these countries the welfare state does
little to reduce the gender inequality in poverty produced by single
motherhood and labor market inequalities. The UK reduces its sex-
poverty ratio from 1.30 to 1.20, by 8%, with its tax and transfer system.
31
32
The nations whose welfare states do the most for women relative to men
are the Netherlands and Sweden. In Sweden, women have no higher
poverty than men even when we look at pre-tax, pre-transfer income, but
after taxes and transfers are included in income, women's poverty goes
down even more relative to men's.
One might object to our analysis because it embodies the unrealistic
assumption that there are no behavioral effects of welfare, such as
women deciding not to be employed or not to get married because of the
availability of transfers for single mothers. However, if such behavioral
effects exist, and particularly affect women, then our analysis will
exaggerate the beneficial effects of transfers on women's poverty rates
relative to men's. If this is true, we may be exaggerating the helpful
effect of the state on gender equality in freedom from poverty in Sweden
and Netherlands. But the conclusion seems quite safe that the welfare
states of the other five nations (the U.S., Australia, Canada, France, and
Germany) make no more than trivial redistribution that reduces the
32
33
gender disparity in poverty rates.
Our analysis also examined the effect of household demography on
gender inequality in poverty. Poverty, as we measure it, applies to all
members of a household, so married couples can't contribute to a sex
gap in poverty, and any gap must come all from disparities between
single men and women. In particular, single mothers have higher
poverty than other groups everywhere but Sweden (although the extent
of their surplus rates varies). Single women are more likely to be
supporting children than single men, yet have lower earnings on
average. Thus, nations with a higher percent of women who are single
mothers will generally have a higher sex gap in poverty. We examined
how much household composition drives differences between nations in
the degree of sex inequality in poverty. To do this, we compared the
actual sex-poverty ratios to those each nation would have if it had the
proportion of men and women in each household category (single with
kids, single without kids, married with kids, and married without kids)
33
34
that the U.S. has. This simulation showed that every nation would have
more gender inequality in poverty if it had U.S. family demography.
The major factor in the increase is the higher proportion of American
women who are single mothers. Indeed, the poverty rates of Australia,
Germany and the Netherlands are such that if they had U.S. demography
but their own poverty rates within household types they would have
higher gender inequality in poverty than the U.S.
Sweden is doubly blessed, with family demography and the state
contributing to women's low poverty relative to men's. Even if single
mothers did have higher poverty than other groups in Sweden, its lower
proportion of single mothers relative to the U.S. would give it a lower
ratio of women's to men's poverty than in the U.S. Its welfare state is
also important to gender equality, as seen by the fact that taxes and
transfers reduce the ratio of women's poverty to men's below its already
low level.
34
35
France is also known for its ample government transfers and services for
families with children. We thought at first that this must be what
produced its relatively low poverty rates among single mothers and low
sex-poverty ratio among singles (Table 1). However, our simulations
make clear that state transfers of income are not what generates France's
greater gender equality compared to the U.S. Taxes and transfers do
little to reduce the gender disparity in poverty in either France or the
U.S. Apparently the French system is more generous to both men and
women, while the U.S. system is stingy to both, but neither does much
redistribution by gender. The superiority of France to the U.S. in gender
equality in poverty comes in part from its lower prevalence of single
mothers.
The Netherlands is a particularly interesting case with forces pulling for
and against gender equality in poverty. Dutch single mothers have very
high poverty rates. Before taxes and transfers the Dutch sex-poverty
ratio is as high as any nation but the U.S. and Australia, in part because
35
36
all mothers, single and married, have low employment rates. But the
Netherlands has fewer single mothers than the U.S. or other Anglo-
Saxon nations, which lowers their gender inequality in poverty. Their
tax and transfer system also works against gender inequality in poverty
more than that of any nation besides Sweden.
If Sweden is doubly blessed, the U.S. is "doubly damned," with high
levels of single motherhood and a welfare state that is relatively stingy
and redistributes little if at all by gender. Both the high rates of single
motherhood and the lack of gender redistribution by the welfare state
contribute to the highest gender disparity in poverty. It is important to
remember that the income data used here exclude noncash transfers,
such as health care and child care. Analyses that included these would
make the U.S. look even worse relative to other nations in poverty rates
and gender inequality in poverty. All other affluent nations have
universally available health care and more state child care funding than
the U.S. Universally available health care and child care are
36
37
particularly beneficial to single mothers for their direct benefits, as well
as because they make employment pay where it otherwise would not
because of child care costs and loss of welfare-provided health care for
children.
Single motherhood is growing in most industrial nations. As this occurs,
gender inequality in poverty will increase if women's employment and
earnings and/or state subsidization of the costs of rearing children do not
increase to compensate for women's loss of access to men's earnings.
This is an important concern for public policy, both out of a concern for
gender equity in bearing the costs of children, and also because the
higher poverty of single mothers means poverty for their children.
37
38
End Notes
1. Some individuals also receive market income from property- -
dividends from stock, rents from real estate, etc., although this
affects a fairly small proportion of households in modern nations.
Pensions received later in life are a delayed payment for work in
labor markets, so we consider them as part of an individual's own
market earnings. Self-employment earnings mix a return to labor
and capital, but we consider them together with labor earnings.
2. U.S. government poverty statistics consider cohabiting unmarried
couples as if they were two households. Following the convention
of most other governments, in this paper, we will consider
cohabiting different-sex couples and married couples together,
referring to them as married. This reflects the assumption that
cohabiting couples generally pool income.
3. A recent analysis by Budig and England (1999) casts doubt on the
hypothesis that the motherhood penalty arises because mothers trade
off wages for mother-friendly jobs. Entering a large number of
38
39
occupational characteristics and dummy variables for industry into a
regression predicting women's earnings showed that the presence or
absence of these controls had no effect on the size of the coefficient
measuring the effect of number of children on wages.
4. We omitted Italy because a few anomalies in the most recent wave
of data require correction.
5. The LIS databases for the other nations are: Australia 1994
(Housing and Income Survey), Canada 1994 (Survey of Consumer
Finances), France 1989 (Enquete Bourgeois, or Budget Survey),
West Germany 1994 (German Social and Economic Panel),
Netherlands 1991 (Income Distribution Survey), Sweden 1992
(Household Income Distribution Survey), and the United Kingdom
1995 Family Expenditure Survey). Each national database is sent to
LIS in its cleaned and edited form. At LIS, the data are harmonized
by reclassifying the income and demographic variables into
homogeneous types of income and family/household characteristics.
These consistently defined income and household types allow the
39
40
researcher to carry out analysis of a particular research question in
several countries on a comparable basis.
6. We only include individuals whom LIS classified as heads of
households or the spouses or cohabitants of heads. Single adults
living alone or with children were classified as heads, and one
person in each different-sex couple was called the head (with
decision rules varying by country). Thus, the individuals who are
omitted from our analysis are adults who are neither a single head
nor part of a married or cohabiting different-sex couple. For
example, if a single or married mother lives with her mother, the
grandmother is not a unit in our analysis. However, any income
provided by these extra adults is included in our measure of
household income, and the presence of the adult is taken account of
when the equivalence index is used to size-standardize the
household's income before determining if it is in poverty.
In including food stamps, our procedure differs from the U.S.
government poverty series, which excludes food stamps income
40
41
before determining if it is in poverty.
8. Only the data from the Netherlands identified same-sex couples; we
did not include them in our analysis since no other nations' data setsN
allow us to identify same-sex couples.
9. Caution is needed interpreting rates for single fathers, as the data
sets in many countries have quite small sample sizes of single
fathers, sometimes under 30.
41
42
References
1986. The Economic Emergence of Women. New York: Basic Books.
Blank,. Rebecca. 1997. It Takes A Nation: A New Agenda for Fighting Poverty. New
York: Russell Sage.
Budig, Michelle and.Paula England. 1999. "The Wage Penalty for Motherhood." Paper
presented at the 1999 annual meetings of the American Sociological Association,
Chicago.
Casper, Lynne M., Sara S. McLanahan, and Irwin Garfinkel. 1994. "The Gender-
Poverty Gap: What We Can Learn From Other Countries." American Sociological
Review 59:594-605.
Citro, Connie F. and Robert T. Michael. 1995. Measuring Poverty: A New Approach.
Washington, D. C.: National Academy Press.
England, Paula. 1992. Comparable Worth: Theories and Evidence. New York: Aldine.
England, Paula and Nancy Folbre. 1999. "Who Should Pay for the Kids?" Annals of
the American Association of Political and Social Sciences 563:194-207.
England, Paula and Barbara Kilbourne. 1990. "Markets, Marriages, and Other Mates:
The Problem of Power." Pp. 163-189 in Beyond the Marketplace: Rethinking Economy
and Society, edited by Roger Friedland and A.F. Robertson. Hawthorne, NY: Aldine de
Gruyter.
Esping-Andersen, Gosta. 1990. Three Worlds of Welfare Capitalism. Cambridge:
Polity.
42
BEST COPY AVAILABLE
43
Folbre, Nancy. 1994a. "Children as Public Goods." American Economic Review
84(2):86-90.
Folbre, Nancy. 1994b. Who Pays for the Kids? Gender and the Structures of
Constraint. New York: Routledge.
Gornick, Janet. 1999. "Gender Equality in the Labor Market: Women's Employment
and Earnings." Gender and Welfare State Regimes, edited by Diane Sainsbury. Oxford:
Oxford University Press.
Jacobs, Jerry. 1989. Revolving Doors: Sex Segregation and Women's Careers.
Stanford, CA: Stanford University Press.
Lundberg, Shelly and Robert A. Pollak. 1996. "Bargaining and Distribution in
Marriage." Journal of Economic Perspectives 10:139-158.
Luxembourg Income Study. 1996. LIS User Guide. Syracuse, NY: Luxembourg
Income Study, Syracuse University.
McLanahan, Sara, Annemette Sorensen, and Dorothy Watson. 1989. "Sex Differences
in Poverty 1950-1980." Signs: Journal of Women in Culture and Society 15(11): 102-
122.
Orloff, Anne Shola. 1993. "Gender and the Social Rights of Citizenship." American
Sociological Review 58:303-328.
Reskin, Barbara F. and Patricia A. Roos. 1990. Job Queues, Gender Queues: Explaining
Women's Inroads into Male Occupations. Philadelphia: Temple University Press.
Sorensen, Elaine. 1994. Comparable Worth. Princeton, New Jersey: Princeton
43
44
University Press.
Waldfogel, Jane. 1997. "The Effect of Children on Women=s Wages." American
Sociological Review 62:209-217.
1998. "Understanding the 'Family Gap' in Pay for Women with Children."
Journal of Economic Perspectives 12,1:137-156.
.44
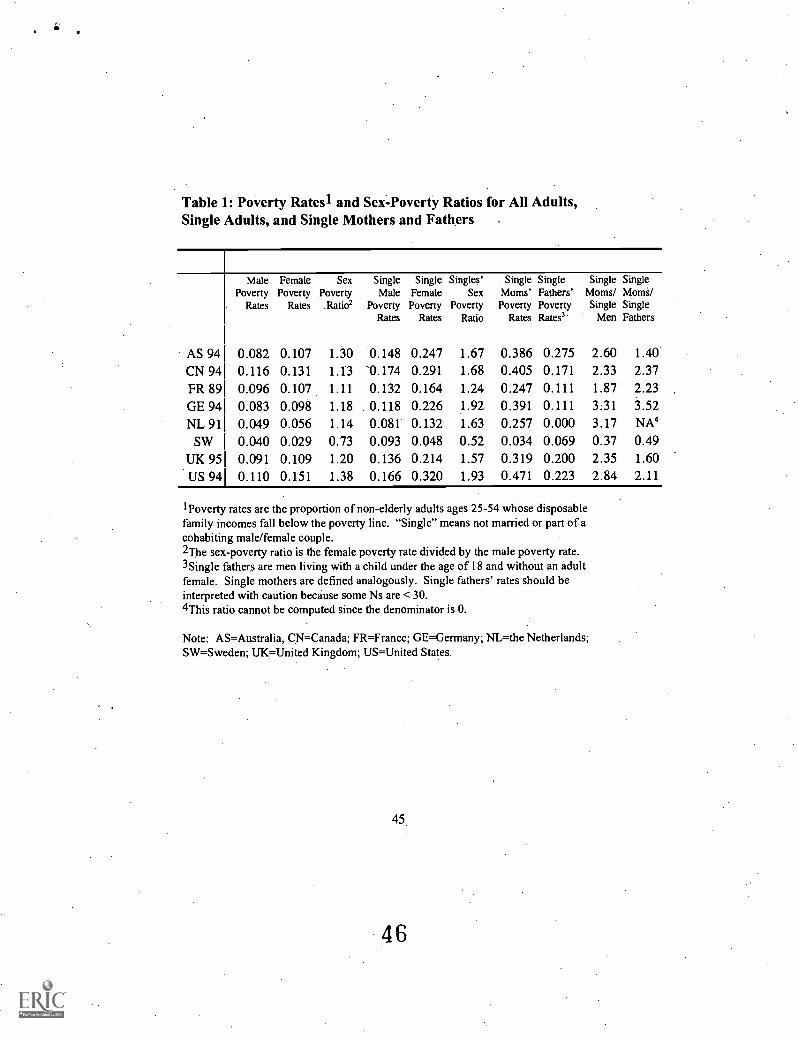
Table 1: Poverty Rates1 and Sex-Poverty Ratios for All Adults,Single Adults, and Single Mothers and Fathers
MalePoverty
Rates
FemalePoverty
Rates
SexPoverty,Ratio2
SingleMale
PovertyRates
SingleFemale
PovertyRates
Singles'Sex
PovertyRatio
Single SingleMoms' Fathers'Poverty Poverty
Rates Rates3'
Single SingleMoms/ Moms/Single Single
Men Fathers
AS 94 0.082 0.107 1.30 0.148 0.247 1.67 0.386 0.275 2.60 1.40
CN 94 0.116 0.131 1.13 '0.174 0.291 1.68 0.405 0.171 2.33 2.37FR 89 0.096 0.107 1.11 0.132 0.164 1.24 0.247 0.111 1.87 2.23GE 94 0.083 0.098 1.18 0.118 0.226 1.92 0.391 0.111 3.31 3.52NL 91 0.049 0.056 1.14 0.081 0.132 1.63 0.257 0.000 3.17 NA4
SW 0.040 0.029 0.73 0.093 0.048 0.52 0.034 0.069 0.37 0.49UK 95 0.091 0.109 1.20 0.136 0.214 1.57 0.319 0.200 2.35 1.60
US 94 0.110 0.151 1.38 0.166 0.320 1.93 0.471 0.223 2.84 2.11
'Poverty rates are the proportion of non-elderly adults ages 25-54 whose disposablefamily incomes fall below the poverty line. "Single" means not married or part of acohabiting male/female couple.2The sex-poverty ratio is the female poverty rate divided by the male poverty rate.3Single fathers are men living with a child under the age of 18 and without an adultfemale. Single mothers are defined analogously. Single fathers' rates should beinterpreted with caution because some Ns are < 30.4This ratio cannot be computed since the denominator is 0.
Note: AS=Australia, CN=Canada; FR=France; GE=Germany; NL=the Netherlands;SW=Sweden; UK=United Kingdom; US= United States.
45
It
Table 2: Ratio of Women's to Men's Poverty Rate in Eight Nationsand Under Simulations
Ratio Based On: US94
AS94
CN94
FR89
GE94
NL91
SW .92
UK95
Pre-Transfer, Pre-TaxIncome 1.42 1.37 1.15 1.12 1.19 1.34 .92 1.30
Post-Transfer, Post-Tax(Disposable) Income 1.38 1.30 1.13 1.11 1.18 1.14 .73 1.20
% Tax and TransferSystem Changes Ratio -3% -5% -2% -1% -1% -15% -21% -8%
Post-Transfer, Pok-TaxIncome With U.S.Household Composition
1.38 1.39 1.21 1.19 1.40 1.48 .79 1.16
% U.S. HouseholdComposition ChangesRatio
0% 7% 7% 7% 19 %. 30% 8% 3%
Note: The first row gives the ratio of women's to men's poverty rates for each countrywhen we do not add government transfers to or subtract payroll taxes from income. Thesecond row gives the ratio of women's to men's poverty rate for disposable income(post-transfer, post-tax). The third row gives the percentage change in the ratio ofwomen's to men's poverty rate due to the nation's tax and transfer system (i.e. thepercentage change between row 1 and 2). Using disposable (post-transfer, post-tax)income, the fourth row gives the ratio of women's to men's poverty rate each nationwould have if it kept its own poverty rates for men and women within each householdtype, but had the proportion of men and women in each household type observed in theU.S. The last row gives the percentage change between rows 2 and 4. This is thepercentage by which the sex-poverty ratio for disposable income would be increased ifthe nation had the U.S. distribution of people across household types, but kept its ownsex-specific poverty rates within each household type.
AS=Australia, CN=Canada; FR=France; GE=Germany; NL=the Netherlands;SW=Sweden; UK=United Kingdom; US=United States.
46
47
BEST COPY AVAILABLE

Appendix on Equivalence Scales to Adjust for Family Size
Equivalence scales adjust the poverty line for family size. Buhmann et
al. (1988) propose that income be adjusted for family size in the
following way:
Adjusted Income = Disposable Income/SizeE
The equivalence elasticity, E, varies between 0 and 1. The smaller the
E, the larger the economies of scale assumed by the equivalence scale.
An E of 0 makes no size adjustment; the poverty line is the same
regardless of family size. With an E of 1, adjusted income becomes per
capita income (with no economies of scale).. We use an equivalence
scale of .5, as this is the middle ground between no adjustment for size
and per capita income, and this figure is commonly used in cross-
national poverty research. The official poverty rate used by the U.S.
government is based on an equivalence scale of .56, but produces similar
poverty rates to the equivalence scale of .5.
A separate issue is how adults are to be weighted relative to children.
47
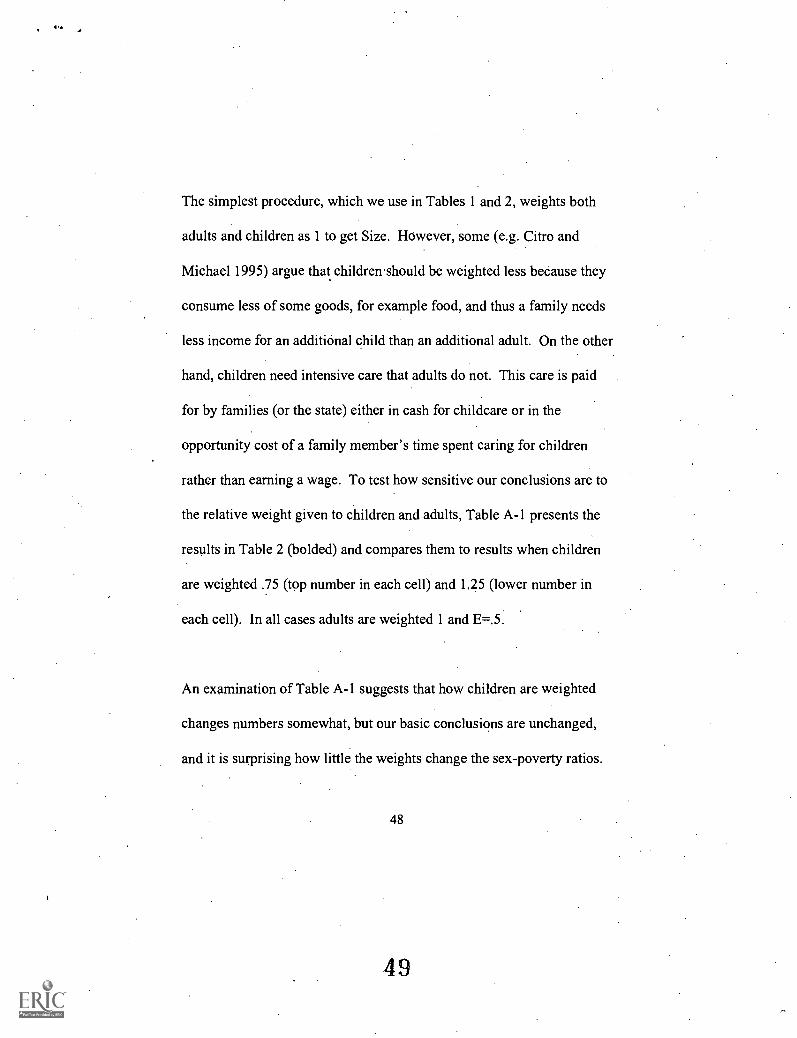
The simplest procedure, which we use in Tables 1 and 2, weights both
adults and children as 1 to get Size. However, some (e.g. Citro and
Michael 1995) argue that children. should be weighted less because they
consume less of some goods, for example food, and thus a family needs
less income for an additional child than an additional adult. On the other
hand, children need intensive care that adults do not. This care is paid
for by families (or the state) either in cash for childcare or in the
opportunity cost of a family member's time spent caring for children
rather than earning a wage. To test how sensitive our conclusions are to
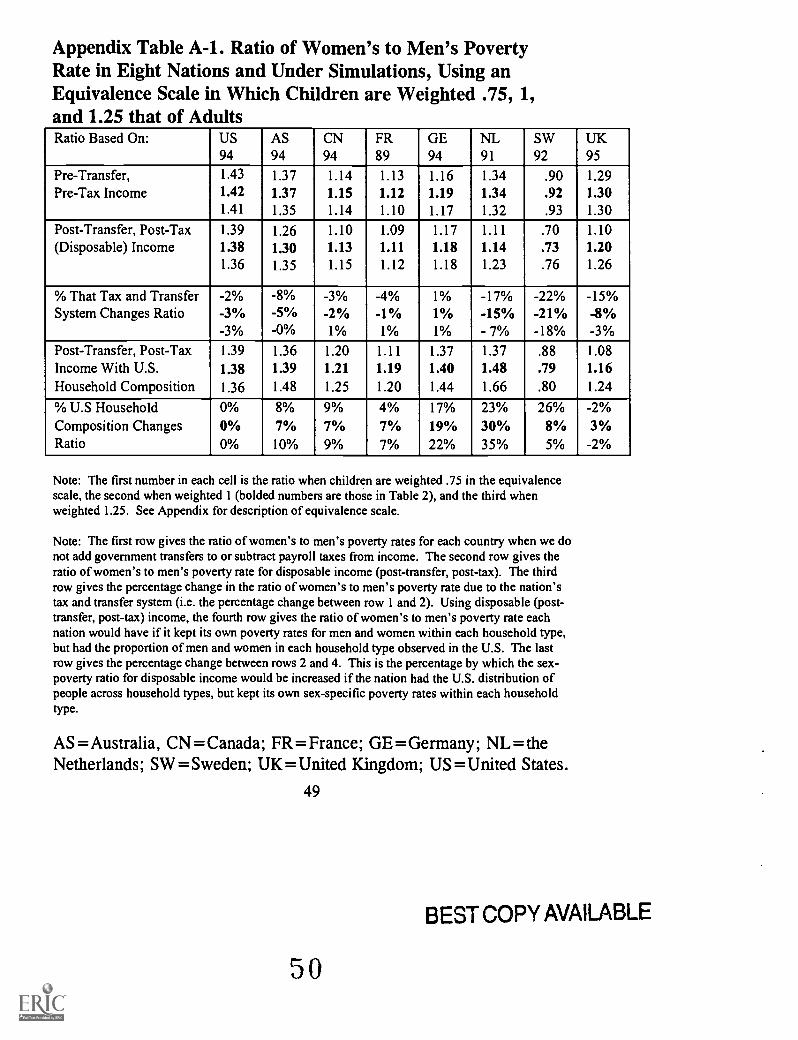
the relative weight given to children and adults, Table A-1 presents the
results in Table 2 (bolded) and compares them to results when children
are weighted .75 (top number in each cell) and 1.25 (lower number in
each cell). In all cases adults are weighted 1 and E=.5.
An examination of Table A-1 suggests that how children are weighted
changes numbers somewhat, but our basic conclusions are unchanged,
and it is surprising how little the weights change the sex-poverty ratios.
48
Appendix Table A-1. Ratio of Women's to Men's PovertyRate in Eight Nations and Under Simulations, Using anEquivalence Scale in Which Children are Weighted .75, 1,and 1.25 that of AdultsRatio Based On: US AS CN FR GE NL SW UK
94 94 94 89 94 91 92 95
Pre-Transfer, 1.43 1.37 1.14 1.13 1.16 1.34 .90 1.29Pre-Tax Income 1.42 1.37 1.15 1.12 1.19 1.34 .92 1.30
1.41 1.35 1.14 1.10 1.17 1.32 .93 1.30
Post-Transfer, Post-Tax 1.39 1.26 1.10 1.09 1.17 1.11 .70 1.10(Disposable) Income 1.38 1.30 1.13 1.11 1.18 1.14 .73 1.20
1.36 1.35 1.15 1.12 1.18 1.23 .76 1.26
% That Tax and Transfer -2% -8% -3% -4% 1% -17% -22% -15%System Changes Ratio -3% -5% -2% -1% 1% -15% -21% -8%
-3% -0% 1% 1% 1% - 7% -18% -3%Post-Transfer, Post-Tax 1.39 1.36 1.20 1.11 1.37 1.37 .88 1.08Income With U.S. 1.38 1.39 1.21 1.19 1.40 1.48 .79 1.16Household Composition 1.36 1.48 1.25 1.20 1.44 1.66 .80 1.24
% U.S Household 0% 8% 9% 4% 17% 23% 26% -2%Composition Changes 0% 7% 7% 7% 19% 30% 8% 3%Ratio 0% 10% 9% 7% 22% 35% 5% -2%
Note: The first number in each cell is the ratio when children are weighted .75 in the equivalencescale, the second when weighted 1 (bolded numbers are those in Table 2), and the third whenweighted 1.25. See Appendix for description of equivalence scale.
Note: The first row gives the ratio of women's to men's poverty rates for each country when we donot add government transfers to or subtract payroll taxes from income. The second row gives theratio of women's to men's poverty rate for disposable income (post-transfer, post-tax). The thirdrow gives the percentage change in the ratio of women's to men's poverty rate due to the nation'stax and transfer system (i.e. the percentage change between row 1 and 2). Using disposable (post-transfer, post-tax) income, the fourth row gives the ratio of women's to men's poverty rate eachnation would have if it kept its own poverty rates for men and women within each household type,but had the proportion of men and women in each household type observed in the U.S. The lastrow gives the percentage change between rows 2 and 4. This is the percentage by which the sex-poverty ratio for disposable income would be increased if the nation had the U.S. distribution ofpeople across household types, but kept its own sex-specific poverty rates within each householdtype.
AS = Australia, CN = Canada; FR = France; GE = Germany; NL = theNetherlands; SW = Sweden; UK = United Kingdom; US = United States.
49
BEST COPY AVAILABLE
50
Reproduction Release
U.S. Department of EducationOffice of Educational Research and Improvement
(OERI)National Library of Education (NLE)
Educational Resources Information Center (ERIC)
Reproduction Release(Specific Document)
I. DOCUMENT IDENTIFICATION:
http://ericfac.piccard.csc.com/reprod.html
E ICLAD033414
Title:Pt ve4) 1m. A Gluon I /464ion S Tv, 12414 e Ititto Akotkeikoad
SlottAuthor(s): w trt tvkipottl. 1_,SiLtk...AACWAA,ei :t_1(Cl. ri 'toss -Pm Amtuttiti
Publication Date:Coat s, 1,71AL Poi fag erti5, MO 0
Corporate Source:
II. REPRODUCTION RELEASE:
In order to disseminate as widely as possible timely and significant materials of interest to the educational community,documents announced in the monthly abstract journal of the ERIC system, Resources in Education (RIE), are usually madeavailable to users in microfiche, reproduced paper copy, and electronic media, and sold through the ERIC DocumentReproduction Service (EDRS). Credit is given to the source of each document, and, if reproduction release is granted, one ofthe following notices is affixed to the document.
If permission is granted to reproduce and disseminate the identified document, please CHECK ONE of the following threeoptions and sign in the indicated space following.
The sample sticker shown below will beaffixed to all Level 1 documents
The sample sticker shown below will be affixed to allLevel 2A documents
The sample sticker shown below will be affixed toLevel 2B documents
PERMISSION TO REPRODUCE ANDDISSEMINATE THIS MATERIAL IN
PERMISSION TO REPRODUCE AND , MICROFICH.E, AND IN ELECIRONIC MEDIA PERMISSION TO REPRODUCE ANDDISSEMINATE THIS MATERIAL HAS FOR ERIC COLLECTION SUBSCRIBERS ONLY, DISSEMINATE THIS MATERIAL IN
BEEN GlztA I BYI
I4AS BEEN GRAN IfY MICROFICHE ONLY HAS B "N GRANTED Ili
6,4j.....,TO THE EDUCATIONAL RESOURCES TO THE EDUCATIONAL RESOURCES To THE EDU ATIONAL RESOURCES
INFORMATION CENTER (ERIC) INFORMATION CENTER (ERIC) INFORMATION CENTER (ERIC)
Level I Level 2A Level 2B
t
Check here for Level 1 release, permitting Check here for Level 2A release, permittingreproduction and dissemination in reproduction and dissemination in microfiche and in Check here for Level 2B release, permitting
microfiche or other ERIC archival media electronic media for ERIC archival collection reproduction and dissemination in microfiche onl(e.g. electronic) and paper copy. subscribers only
Documents will be processed as indicated provided reproduction quality permits.If permission to reproduce is granted, but no box is checked, documents will be processed at Level I.
2/24/00 12:42 PM
Reproduction Release http://ericfac.piccard.csc.com/reprod.html
I hereby grant to the Educational Resources Information Center (ERIC) nonexclusive permission to reproduce anddisseminate this document as indicated above. Reproduction from the ERIC microfiche, or electronic media by personsother than ERIC employees and its system contractors requires permission from the copyright holder. Exception is madefor non-profit reproduction by libraries and other service agencies to satisfy information needs of educators in response todiscrete inquiries.
Signature:
PAIA- 60-C--'Printed Name/Position/Title:
1<a/6111 airisilikw.Organization/Address:
.
U,NNIC(5 61 Ur/ AVIMV111 tij" HIVY1\11fiX tkVi
Jr pitisLurp iput ult,
Telephone:
( C 2A) la ( ri 16Fax:
trt-6) (02-1.- qg75'"E-mail Address: ,
kCittViCf1) U,aflPfYIAdA4Date:
161 ITV
III. DOCUMENT AVAILABILITY INFORMATION (FROM NON-ERIC SOURCE):
If permission to reproduce is not granted to ERIC, or, if you wish ERIC to cite the availability of the document from anothersource, please provide the following information regarding the availability of the document. (ERIC will not announce adocument unless it is publicly available, and a dependable source can be specified. Contributors should also be aware thatERIC selection criteria are significantly more stringent for documents that cannot be made available through EDRS.)
Publisher/Distributor:
Address:
Price:
IV. REFERRAL OF ERIC TO COPYRIGHT/REPRODUCTION RIGHTS HOLDER:
If the right to grant this reproduction release is held by someone other than the addressee, please provide the appropriatename and address:
Name:
Address:
yyc.ss v.111114,01 oP Rvisttl
3%4 --(ArA.MCS poc51,:stot 6St I Pll VI<
V. WHERE TO SEND THIS FORM:
Send this form to the following ERIC Clearinghouse:
However, it solicited by the ERIC Facility, or if making an unsolicited contribution to ERIC, return this form and thedocument being contributed) to:
ERIC Processing and Reference Facility4483-A Forbes BoulevardLanham, Maryland 20706
2/24/00 12:42 PM