1 FRINGE BENEFIT TAX FRINGE BENEFIT TAX. August 19, 2015 2 Introduction to Fringe Benefit Tax..!!!!
DOCUMENT RESUME
ED 481 937CG 032 734
TITLE The ADSS Cost Study: Costs of Substance Abuse Treatment inthe Specialty Sector.
INSTITUTION Substance Abuse and Mental Health Services Administration(DHHS/PHS), Rockville, MD. Office of Applied Studies.
PUB DATE 2003-07-00NOTE 69p.
AVAILABLE FROM National Clearinghouse for Alcohol and Drug Information, P.O.Box 2345, Rockville, MD 20847-2345; Tel: 301-468-2600; Tel:800-729-6686 (Toll Free); Tel: 800-487-4889 (TDD) (TollFree). For full text: http://www.samhsa.gov/oas/ADSS/ADSSCostStudy.pdf.
PUB TYPE Numerical/Quantitative Data (110) Reports - Research (143)EDRS PRICE EDRS Price MF01/PC03 Plus Postage.DESCRIPTORS *Cost Effectiveness; Data Collection; *National Surveys;
*Rehabilitation Programs; *Resource Allocation; *SubstanceAbuse; Tables (Data)
ABSTRACT
Understanding the cost of resources used in substance abusetreatment is of critical concern to policymakers, payers, and providers ofcare. The Alcohol and Drug Services Study (ADSS) was performed from 1996 to1999. ADSS is a national study conducted in three phases to collectrepresentative data on the characteristics of substance abuse treatmentfacilities, clients in treatment, post-treatment client status, and financingof care in the specialty substance abuse treatment sector. The purpose of theADSS cost study was to provide a detailed data file and national estimatesfor cost, revenue, counseling activities, and staffing collected from anationally representative sample of substance abuse treatment facilities.This report provides a detailed description of the methods used in the ADSScost study, along with findings regarding key cost variables important tounderstanding the use of resources in substance abuse treatment. Fourappendixes contain the ADSS Data Review Worksheet, the Phases I and IIQuestionnaire Data Summary Table, Internal and External Data Estimates, andVariance Estimation of Ratio Estimators. (Contains 16 tables and 6 figures.)(GCP)
Reproductions supplied by EDRS are the best that can be madefrom the original document.
,
BEST COPY A A
U S DEPARTMENT OF EDUCATIONOffice of Educational Research and Improvement
EDUCATIONAL RESOURCES INFORMATIONCENTER (ERIC)
o This document has been reproduced asreceived from the person or organizationoriginating it
O Minor changes have been made toimprove reproduction quality
Points of view or opinions stated in thisdocument do not necessarily representofficial OERI osition or olic
a
I
I
SAMHSASubstance Abuse and Mental HealthServices Administration (SAMHSA)
Office of Applied Studies
The Office of Applied Studies (OAS) serves as a focal point for datacollection, analyses, and dissemination activities on the incidence andprevalence of substance abuse, the distribution and characteristics ofsubstance abuse treatment facilities and services, and the costs andoutcomes of substance abuse treatment programs. Both National and State-by-State data are available. Three major surveys provide information usedby OAS:
National Household Survey on Drug Abuse (NHSDA). TheNHSDA provides information on the prevalence of substance usein the population, and the problems associated with use. The surveycollects information on the sociodemographic characteristics ofusers, patterns of use, treatment, perceptions of risk, criminalbehavior, and mental health. Since 1999, the NHSDA sample hasbeen designed to provide State-level estimates, based on 70,000respondents per year.
Drug Abuse Warning Network (DAWN). The DAWN obtainsinformation on drug-related admissions to emergency departmentsand drug-related deaths identified by medical examiners.
Drug and Alcohol Services Information System (DASIS). TheDASIS consists of three data sets (I-SATS, N-SSATS, and TEDS)developed with State governments. These data collection effortsprovide National and State-level information on the substanceabuse treatment system.
SAMHSA Drug AbuseInformation
Office of Applied Studies (OAS)Parklawn BuildingRoom 16-1055600 Fishers LaneRockville, Maryland 20857
OAS Data Request Line:,301-443-6239
Fax: 301-443-9847
Substance Use and Treatment Data
General Population www.samhsa.gov/oas/nhsda htm
Treatment www samhsa.gov/oas/dasis.htm
Emergency Dept. www.samhsa.gov/oas/dawn.htm
SAMHSAI, 6
BEST COPY AVAILABLE 3
SAMHSAOffice of Applied Studies Web Site
Substance Abuse and Mental Health Statisticswww.DrugAbuseStatistics.samhsa.gov
The Substance Abuse and Mental Health Services Administration(SAMHSA), Office of Applied Studies (OAS) Web site contains highlightsfrom the latest OAS report, data on specific drugs of abuse, andpublications of alcohol, tobacco, and illegal drug use. It presents bothNational and State-by-State data. The Web site also contains data that havenot been published, such as detailed tables of data from the NHSDA andDAWN, and substance abuse treatment admissions data by State fromDASIS, as well as methodological reports.
OAS Short Reports: A new feature on the Web site is a series of illustratedshort reports on selected topics from OAS major data systems (NHSDA,DAWN, and DASIS). These may be accessed at the following OAS Website: http://www.samhsa.gov/oas/facts.cfm. Topics in this short reportseries include the following: club drugs, pregnancy and illicit drug use,women in treatment, marijuana use by adolescents, heroin use, heavyalcohol use, perceived availability of drugs, and beliefs about drug risks.
Substance Abuse Treatment Facility Locator: OAS's Web site alsocontains a searchable on-line version of the National Directory of Drug andAlcohol Abuse Treatment Programs. This Substance Abuse Treatment FacilityLocator produces maps with the location of the facilities you have listed.
Other OAS Web Site Features: You can:
Conduct data analysis online (SAMHDA)Download public use filesSubmit OAS publication requestsJoin the OAS mailing listFind answers to frequently asked questions (FAQ) about OAS data
sWeb Information
Office of Applied Studies (OAS)
OAS Homeiage:-www.DrugAbuseStatistics.samhsa.gov
OAS ShOrt-Reports:www.samhsa/oas/facts.cfm
'Data Archive & Online Analysis:www.icpsr.umich.edu/SAMHDA
Substance Abuse Treatment FacilityLocator:www.findtreatment.samhsa.gov
Substance Abuse and Mental Health Services Administration
(SAMHSA
BEST COPY AVAILABLE
The ADSS Cost Study: Costs of Substance AbuseTreatment in the Specialty Sector
DEPARTMENT OF HEALTH AND HUMAN SERVICESSubstance Abuse and Mental Health Services Administration
Office of Applied Studies
5?
Acknowledgments
This report was developed for the Substance Abuse and Mental Health Services Administration(SAMHSA), Office of Applied Studies (OAS), by the Schneider Institute for Health Policy, BrandeisUniversity, P.O. Box 549110, Waltham, MA 02454-9110, under Contract No. 283-99-9018. Significantcontributors at Brandeis include Donald S. Shepard (Director of the Cost Study), Aaron Beaston-Blaakman (Cost Study Manager), Grant Ritter (Statistician), Constance Horgan (Principal Investigator ofthe Alcohol and Drug Services Study [ADSS]), Della Faulkner, and Aggrey Kihombo. The significantcontributor at Capital Consulting Corporation was Robert B. Bennett. Reviewers at OAS include AlbertWoodward (lead SAMHSA reviewer on the ADSS cost study), Anita Gadzuk (ADSS Project Officer),and Sarah Duffy. At RTI, Research Triangle Park, NC, under Contract No. 283-99-9018, Michael A.Penne and David C. Heller validated the data appearing in the tables in Chapter 4, and Moshe Federprepared the variance estimation appearing in Appendix D. Also at RTI, the document was reviewed byCarol Council and Mary Ellen Marsden; it was prepared for print and web publication by Richard S.Straw, Pamela Couch-Prevatt, Teresa F. Gurley, and David Belton. Final report production was providedby Beatrice Rouse, Coleen Sanderson, and Jane Feldmann at SAMHSA.
Public Domain Notice
All material appearing in this report is in the public domain and may be reproduced or copied withoutpermission from the Substance Abuse and Mental Health Services Administration. However, thispublication may not be reproduced or distributed for a fee without specific, written authorization of theOffice of Communications, SAMHSA, U.S. Department of Health and Human Services. Citation of thesource is appreciated. Suggested citation:
Substance Abuse and Mental Health Services Administration. The ADSS Cost Study:Costs of Substance Abuse Treatment in the Specialty Sector. Office of Applied Studies(DHHS Publication No. SMA 03-3762, Analytic Series A-20). Rockville, MD, 2003.
Obtaining Additional Copies of Publications
Copies may be obtained, free of charge, from the National Clearinghouse for Alcohol and DrugInformation (NCADI), a service of SAMHSA. For copies of publications, please write or call:
National Clearinghouse for Alcohol and Drug Information (NCADI)P.O. Box 2345Rockville, MD 20847-2345(301) 468-2600 1-800-729-6686TDD 1-800-487-4889
Electronic Access to Publication
This publication can be accessed electronically through World Wide Web connections:
http://www.SAMHSA.govhttp://www.DrugAbuseStatistics.SAMHSA.gov
http://www.samhsa.gov/oas/adss.htm
Originating Office
SAMHSA, Office of Applied Studies5600 Fishers Lane, Room 16-105
Rockville, MD 20857
July 2003
ii 6
Table of Contents
Section Page
List of Tables ivList of Figures
1. Introduction 1
1.1 Purpose of the ADSS Cost Study 1
1.2 Outline of the ADSS Cost Report 21.3 Previous Methods 31.4 Need for an Efficient Strategy to Capture Cost Data 3
2. Data Verification Methods of the ADSS Cost Study 5
2.1 Study Design 52.2 Data Review Worksheet 6
2.2.1 Questionnaire Variables 72.2.2 Source Identifiers 7
2.3 Key Ratios and Analysis Variables 92.3.1 Comparisons of Phases I and II 92.3.2 Comparisons Within Phase I and Phase II 102.3.3 Comparisons Within Phase II Only 12
2.4 Facility Callback Process 13
3. Data Quality Control Analysis 15
4. Results of the ADSS Cost Study 194.1 Key Unit Cost Estimates 194.2 Personnel Costs 234.3 National Cost-Adjusted Estimates 27
5. Discussion and Conclusions 29
References 31
Appendices
A Data Review WorksheetADSS 35B Phases I and II Questionnaire Data Summary Table 47C Internal and External Data Estimates 55D Variance Estimation of Ratio Estimators 59
List of Tables
Page
Table 2.1 Distribution of Sample Facilities Responding to ADSS Phase II Cost Study 5Table 2.2 Distribution of Modalities in the 280 Sample Facilities 5Table 2.3 Questionnaire Variables Entered from Phases I and II 8Table 2.4 Four Main Clusters of Analysis Ratios Comparing Phase I and Phase II Data . . . 10Table 2.5 Ratios Used to Examine Data Collected Within Phase I and Phase II 11Table 2.6 Ratios Used to Examine Personnel and Counseling Data Specifically
Collected Within Phase II 12Table 4.1 Estimated Cost Per Admission 21Table 4.2 Estimated Cost Per Enrolled Client Day 21Table 4.3 Estimated Cost Per Reported Outpatient Visit: 1997 (Based on
Administrator-Reported Mean Individual and Group CounselingSessions Per Client and Methadone Treatment Visits) 22
Table 4.4 Cost Per Counseling Hour: 1997 (Based on the Total Number ofCounseling Hours) 23
Table 4.5 Cost Per Group Counseling Hour Per Client: 1997 (Based on the TotalNumber of Counseling Hours and Mean Number of Clients PerGroup) 23
Table 4.6 Mean Fringe Benefit Rate, by Type of Care and Ownership: 1997 24Table 4.7 Mean Hourly Personnel Rates, by Full-Time Staffing Category: 1997 24Table 4.8 Mean Weekly Hours Worked for Part-Time and Contract Staff, by
Staffing Category: 1997 25Table 4.9 Mean Proportion of Personnel Costs to Total Facility Costs, by Type
of Care: 1997 25Table 4.10 National Cost-Adjusted Estimates of Substance Abuse Treatment in
the Specialty Sector Covered by ADSS: 1997 27
3iv
List of Figures
Page
Figure 3.1 Key Phase II Variables: Point Prevalence, Admissions, and AverageLength of Stay, by Final Data Source Distribution 16
Figure 3.2 Percentage Distribution of Additional Key Phase II Variables:Revenues, Costs, and Discharges, by Final Data Source Distribution 17
Figure 3.3 Percentage Distribution of the Final Data Sources of Key Phase IIVariables: Provider-Reported and Estimate-Based Proportions 18
Figure 4.1 Percentage Distribution of Personnel Costs for OutpatientNonmethadone Treatment (n = 222), by Staffing Category: 1997 26
Figure 4.2 Percentage Distribution of Personnel Costs for Outpatient MethadoneTreatment (n = 44), by Staffing Category: 1997 26
Figure 4.3 Percentage Distribution of Personnel Costs for NonhospitalResidential Treatment (n = 48), by Staffing Category: 1997 27
v
9
1. Introduction
1.1 Purpose of the ADSS Cost Study
Understanding the cost of resources used in substance abuse treatment is of criticalconcern to policymakers, payers, and providers of care. Federal and State policymakers areinterested in cost-effective allocation of limited funds and in developing efficient financingstructures to deliver substance abuse treatment services. State agencies, Medicaid, and managedbehavioral health organizations allocate resources among types of care. Substance abusetreatment organizations are oriented toward producing services efficiently, setting appropriatecharge rates, and negotiating contracts with managed care organizations. Each of these decisionmakers can use improved information about the costs of substance abuse treatment to betterserve patients receiving treatment.
The Alcohol and Drug Services Study (ADSS) was performed from 1996 to 1999. ADSSis a national study conducted in three phases to collect representative data on the characteristicsof substance abuse treatment facilities, clients in treatment, post-treatment client status, andfinancing of care in the specialty substance abuse treatment sector. This sector includesfreestanding substance abuse treatment centers, methadone maintenance clinics, and otherfacilities that primarily serve persons with substance abuse problems.' Phase I of ADSSsurveyed a nationally representative set of 2,395 treatment facilities by telephone. Phase IIconducted in-person interviews with administrators regarding revenues, costs, and staffing, andit analyzed a client record abstraction at a subset of 280 facilities. Phase III conducted follow-upinterviews with a sample of clients for whom records were abstracted. ADSS data are animportant aid in understanding the organization of treatment, cost and availability of treatmentservices, characteristics of the client population, and managed care contract arrangements.2
The purpose of the ADSS cost study was to provide a detailed data file and nationalestimates for cost, revenue, counseling activities, and staffing collected from a nationallyrepresentative sample of substance abuse treatment facilities. A new, more accurate costcollection strategy was developed for this study and is described in the following steps.
First, cost, revenue, personnel, client volume, and counseling activity data were collectedfrom a sample of facilities as part of Phases I (2,395 facilities) and II (280 facilities) of ADSS.Although hospital inpatient facilities were sampled and included in the larger ADSS Phase Ifacility telephone survey, they were excluded from the Phase II site visit data collection in orderto sample more facilities that better represented the predominant types of care.' After datacollection was completed, an intensive facility callback process was undertaken to review cost,
The types of facilities that define the sector coincide with the sampling strata used in the study: hospitalinpatient, non-hospital residential, outpatient-predominantly methadone, outpatient-nonmethadone, and combinedtypes of care. For the outpatient, non-methadone type of care, the sample was further stratified to reflect whether ornot facility clients were almost exclusively alcohol abusers. A seventh stratum was included for facilities whose typeof care could not be determined based on existing information at the time of sampling. Types of facilities excludedfrom the ADSS sampling frame were halfway houses without paid counselors, solo practitioners, correctionalfacilities, Department of Defense and Indian Health Service facilities, and facilities that were prevention or intakeand referral only.
2 The documentation and data files for ADSS can be found at the following website:http://www.icpsnumich.edu:8080/ABSTRACTS/03088.xml?formatSAMHDA-DISPLAY. Two documents are ofparticular interest: Codebook, Part 2: Phase II, Administrator Interview (filename: cb3088p2.pdf.gz) and Phase II,Administrator Interview Questionnaire (Part 2) (filename: qu3088p2.pdf.gz).
3 However, 13 of the 280 facilities in Phase II had a hospital inpatient unit in combination with an eligibleresidential or outpatient unit. The cost data were collected for these 13 hospital units, but they were notrepresentative of all hospital facilities nationwide. As a result, they were excluded from the cost analysis.
1 0
personnel, services, and client data submitted by these facilities.' This callback process began inMay 1998 and was completed in September 1999. Staff used an innovative spreadsheet dataaudit instrument developed by Capital Consulting Corporation (CCC) to simultaneously analyzeand update the data file on each facility during the callback process. The instrument incorporatesa series of reliability checks to aid in obtaining the most accurate data possible (Zarkin et al.,1995).
1.2 Outline of the ADSS Cost Report
This report provides a detailed description of the methods used in the ADSS cost study,along with findings regarding key cost variables important to understanding the use of resourcesin substance abuse treatment. This report contains the first findings from the rich ADSS cost database; much more analysis remains to be done. The first section of the report provides anoverview of methods used in prior studies to estimate substance abuse treatment costs anddescribes the need for a more accurate and efficient way to collect treatment cost data in largenational studies.
The second section describes the methods used in the ADSS cost study to verify datacollected in the ADSS. These methods involve the application of a computerized data auditinstrument, a spreadsheet workbook used to enter and review selected questionnaire data fromPhases I and II of the ADSS.
The third section discusses data quality control analyses. Analyses of the distribution ofdata sources for key questionnaire variables collected in ADSS are discussed. These analysesindicate that a standard questionnaire administration is insufficient for collecting accuratesubstance abuse treatment cost and revenue data.
The fourth section discusses the ADSS cost study findings. Three types of cost measuresare examined: unit cost estimates, personnel costs, and national estimates. Mean unit costmeasures such as "cost per admission," "cost per enrolled client day," "cost per visit," and "costper counseling hour" are presented for three types of care: nonhospital residential, outpatientmethadone, and outpatient nonmethadone treatment. Personnel cost analyses include costpercounseling hour, mean fringe benefit rates, mean hourly personnel rates, the proportion ofpersonnel costs to total facility costs, and the proportion of personnel category costs to totalpersonnel costs and are presented for all three types of care. National cost-adjusted estimates forthe three types of care are developed by considering the estimated point prevalence client countfor each type of care and the estimated cost per enrolled client day.
Section 5 discusses results and the implications for estimating substance abuse treatmentcosts.
4The Phase II questionnaire can be found at the following website:
http://www.icpsnumich.edu:8080/ABSTRACTS/03088.xml?format=SAMHDA-DISPLAY: Phase II, AdministratorInterview Questionnaire (Part 2) (filename: qu3088p2.pdf.gz).
2
1 1
1.3 Previous Methods
The task of collecting and analyzing cost data in substance abuse treatment iscomplicated by a lack of standard methods of indirect cost allocation' and poor record keepingor management information systems. As a result, cost data vary in quality and reliability. Tobetter understand the economics and financing of substance abuse treatment services, severalcost analysis methods have been developed over the past decade to capture improved data on
direct and indirect substance abuse treatment costs and revenues. These include the Drug AbuseTreatment Cost Analysis Program (DATCAP) (French, Dunlap, Zarkin, Mc Geary, & McLellan,1997) and CCC's Cost Allocation Methodology (CCC, 1993).
DATCAP is a comprehensive 34-page cost analysis survey instrument that can be applied
to all types of substance abuse treatment providers. This extensive survey can be customized forindividual treatment settings and is structured to capture improved data on a facility's totalresource use. The survey requires an extensive inventory of information on revenue data, clientvolume, personnel counts and rates, supply and material costs, contracted services, building andfacility costs, and detailed information regarding equipment use and costs. The model attemptsto estimate both accounting and economic costs and to generate average cost estimates. Thissurvey allows for a detailed audit at the treatment site level and is feasible for large samples ofsubstance abuse treatment providers. DATCAP is an economic approach to measuring costs.
CCC's Cost Allocation Methodology, in contrast to DATCAP, is an accounting-basedmodel. Financial data are collected, analyzed, and presented in accordance with generallyaccepted accounting principles (GAAP). Data are collected and analyzed on-site at facilities byprofessional accountants. CCC has developed tools for collecting and calculating actual lengthsof stay, admissions, discharges, and treatment staff services and hours. Furthermore, the firm hasdeveloped data validation procedures to test the accuracy of provider-supplied statistics. CCC'smodel produces for each facility average cost estimates including "cost per client," "cost peradmission," and "cost per day." The CCC model is highly detailed and requires approximately12 hours of on-site data collection and validation, 24 hours of analysis time, and 4 hours ofquality assurance review, totaling 40 hours of work per site. This highly intensive method is notfeasible to apply to large-scale nationally representative data collection.
CCC's experience with the Cost Allocation Methodology served as the basis indeveloping the analysis/telephone callback techniques and data audit instrument implemented in
the ADSS cost study. From their experience in examining cost data in substance abuse treatmentfacilities, CCC was able to indicate which benchmark variables would be most important toinclude in the ADSS data audit instrument. These variables include the unit cost variablesindicated above plus information pertaining to personnel, counseling, and total facility costs.CCC also provided consultation and training for staff involved in the ADSS cost study tocommunicate clearly and effectively with substance abuse treatment facilities about the variablesof interest.
1.4 Need for an Efficient Strategy to Capture Cost Data
To capture substance abuse treatment cost data from a nationally representative sample,the ADSS cost study used the Cost Allocation Methodology to obtain accurate data. Themethodology depends upon a computerized data audit instrument. This instrument was used in
5 Indirect cost allocation is the process of assigning costs of support services and personnel to client care.The task of collecting and analyzing cost data in substance abuse treatment is complicated by the lack of astandardized reimbursement system for substance abuse treatment services. These services are generally publicly
funded, and thus a substance abuse treatment organization has no need to develop the cost of services beyond the
program level. Substance abuse treatment organizations often maintain and report expenditures at an aggregate level
of care such as residential or outpatient services.
3
12
conjunction with an intensive facility callback process based on data collected in Phases I and IIof ADSS from a sample large enough to be stable and representative. The next section addressesin detail the methods of the ADSS cost study.
413
2. Data Verification Methods of the ADSS Cost Study
2.1 Study Design
The ADSS cost study methods involved a multistage data collection and verificationprocess. Initial data were collected through the ADSS Phase I and Phase II surveys from 1996 to1999. Phase I was a telephone interview with the facility directors of a national stratifiedprobability sample of approximately 2,395 substance abuse treatment facilities. Thequestionnaire was mailed to the facility 2 weeks prior to the interview to allow the facility timeto collect the information. Follow-up telephone calls were done as needed. This phase of thestudy was conducted between December 1996 and June 1997. Phase II included site visits to asubsample of 280 of the Phase I facilities for a personal interview with the facility director andclient record abstraction for a sample of over 6,000 clients from these facilities. This phase of thestudy was conducted between August 1997 and April 1999. For each facility, information wasobtained on program treatment type (hospital inpatient, nonhospital residential, outpatientnonmethadone, and outpatient methadone), costs, clients served, and services provided. Moredetailed information on the facility selection and data collection procedures is presented in thecitations in the second footnote. Facilities offering only hospital inpatient treatment, althoughincluded in the ADSS Phase I survey, were excluded from Phase II and the cost study analysisfor the reason cited in the third footnote (see also footnote 1 in Table 2.2).
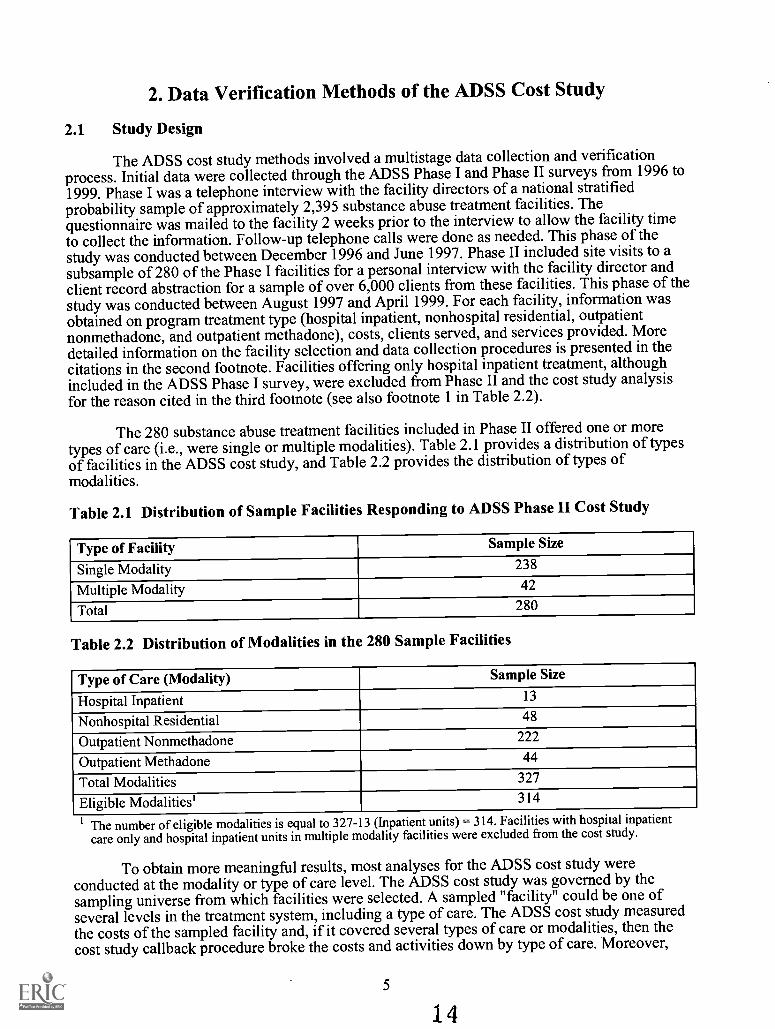
The 280 substance abuse treatment facilities included in Phase II offered one or moretypes of care (i.e., were single or multiple modalities). Table 2.1 provides a distribution of typesof facilities in the ADSS cost study, and Table 2.2 provides the distribution of types ofmodalities.
Table 2.1 Distribution of Sample Facilities Responding to ADSS Phase II Cost Study
Type of Facility Sample Size
Single Modality 238
Multiple Modality 42
Total 280
Table 2.2 Distribution of Modalities in the 280 Sample Facilities
Type of Care (Modality) Sample Size
Hospital Inpatient 13
Nonhospital Residential 48
Outpatient Nonmethadone 222
Outpatient Methadone 44
Total Modalities 327
Eligible Modalities' 314
1 The number of eligible modalities is equal to 327-13 (Inpatient units) = 314. Facilities with hospital inpatientcare only and hospital inpatient units in multiple modality facilities were excluded from the cost study.
To obtain more meaningful results, most analyses for the ADSS cost study wereconducted at the modality or type of care level. The ADSS cost study was governed by thesampling universe from which facilities were selected. A sampled "facility" could be one ofseveral levels in the treatment system, including a type of care. The ADSS cost study measuredthe costs of the sampled facility and, if it covered several types of care or modalities, then thecost study callback procedure broke the costs and activities down by type of care. Moreover,
5
14
facilities vary in their reporting of financial data. Facilities are generally able to distinguish costsbetween residential and outpatient services. If the questionnaires had attempted to obtain moredetailed financial data, many facilities would have been unable to furnish accurate data.Facilities can readily aggregate data, but disaggregation requires considerably more effort thanmany facilities were willing to do, thus potentially reducing participation rates in the study. Dataitems for the facility were entered into a spreadsheet data audit instrument for analyses at themodality level. For example, unit costs per admission were identified in each of three types ofcare: outpatient nonmethadone, outpatient methadone, and nonhospital residential treatment.
Within the residential and outpatient nonmethadone samples, different subtypes of carewere represented. For example, residential treatment units may include both detoxification andrehabilitation services. Moreover, outpatient nonmethadone treatment units may include amixture of intensive and regular outpatient treatment. However, data were not analyzed for thesemore specific types of care.
The cost analysis and data validation efforts began after the Phase II data collection. Thedata review worksheet or audit instrument was designed to compare Phase I versus II data forconsistency, and validate both cost and statistical data. During an initial review of Phase I andPhase II data, the cost study analysts sought to identify missing data and inconsistent data.Subsequently, staff recontacted facility administrators through an intensive facility callbackprocess to make an additional attempt to collect missing data and to verify specific data itemsthat appeared inconsistent through the data audit analysis. The only callbacks involving Phase Idata included facilities with Phase II cost data. The Phase I data were used to check consistencywith Phase II data. Upon final review with facility officials, variables were recorded anddescribed in the spreadsheet file as the most accurate data available. The source of updatedinformation was noted. Upon complete review and updating of each facility record, data weretransferred to the final ADSS cost study data file for research analyses.
Time between the two phases of ADSS data collection was 6 to 12 months. The coststudy relied primarily on Phase II data. Except for a few items, the Phase I cost data were notvalidated nor extensively checked for internal consistency.
The analysts found that 96.0 percent of the sample of facilities required a callback for atleast one variable in question and, of this group, 99.7 percent of facilities assisted in furtherclarifying these data inconsistencies.
2.2 Data Review Worksheet
The data review worksheet is a spreadsheet workbook designed to analyze specific cost,revenue, staffing, client volume, and counseling data reported in Phases I and II of ADSS. Acopy of the data review worksheet is provided in Appendix A. The workbook includes five dataentry pages, where data pertinent to the cost study from the original ADSS questionnaires wereentered, and five analysis pages that include formulas linking to the data entry worksheets forfurther review.6 Each questionnaire variable included on the data review worksheet has anassociated data source identifier that serves as an indicator of the final source of data entered intothe cost study file (e.g., data originally supplied by facility director, data revised by facilitydirector). This information helps identify which variables are reported most reliably by facilitydirectors in the original questionnaire. The analysis pages also include a series of ratios thatserve as key analysis variables in the study. These ratios enabled comparison of data from each
6A complete list of all specific questionnaire variables in the ADSS cost study is in Appendix B.
6 15
facility to expected industry norms identified through CCC's previous site visit research.' ADSScost analysts were trained by Robert Bennett of CCC to identify inconsistencies for discussionwith facility officials. Inconsistencies could immediately be identified as deviations fromexpected ratios and reported to facility officials for further review. These procedures weredesigned to improve the internal consistency of data reported by sampled substance abusetreatment facilities.
The specific data entry items, the primary key analysis ratios, and expected data rangesvaried by data variable from 25 to 80 percent. The ranges developed were used as data screeningtools and for the cross data variable validation process. Many of the initial questionnaires hadmissing data variables. These screening ratios were developed to inquire about submitted datathat did not appear within normal limits. The study attempted to minimize the number of facilitycallbacks. The subsequent sections present more detailed information on the ranges.
2.2.1 Questionnaire Variables
Data items chosen for the ADSS cost study include client volume, total costs, totalrevenues, staffing, and information on individual and group counseling. These variables werenecessary to derive estimates of the unit costs of substance abuse treatment, including cost peradmission, cost per client day, cost per visit, and cost per counseling hour. Table 2.3 shows thequestionnaire variables from Phases I and II of ADSS entered into the data audit spreadsheetworkbook. Phase II involved a more detailed collection of client services and other datapertaining specifically to individual and group counseling sessions received by clients andpersonnel costs borne by the sampled substance abuse treatment facility. Three variablescollected as part of Phase I were added to the cost study data audit spreadsheet midway throughthe cost study verification process and were therefore not verified with the facility: "DollarAmount or Percentage of Costs Attributed to Employee Personnel," "Dollar Amount orPercentage of Costs Attributed to Other Personnel (including consultants and other personnel),"and "Dollar Amount or Percentage of Costs Attributed to Non-Personnel." There is lessconfidence in the reliability of these three measures because they were not subject to rigorousreliability checks.
2.2.2 Source Identifiers
Each questionnaire variable entered into the data audit instrument has an associated datasource identifier. The source identifier indicates the final accepted source of data entered into thesubstance abuse treatment facility's cost study spreadsheet workbook.
The following three source identifiers were used when dealing with data received directlyfrom a facility during the study:
PO Provider Original (This includes data as reported in Phase I or II of ADSSwith no change upon analysis or verification.)
PR Provider Revised (This includes revised data via telephone callbackwith a facility official.)
PD Provider Documentation (This includes data as submitted to coststudy analysts from a facility official, e.g., financial statement, etc.)
7 CCC has collected cost data on over 400 different programs. With few exceptions (fewer than a dozen),the majority are public-sector programs. The majority of these were selected by the Substance Abuse and MentalHealth Services Administration (SAMHSA), were publicly funded, and offered services to those clients targeted bySAMHSA. If data values for a facility were not within the ranges for ratios developed for the data review worksheet,study staff reconfirmed selected data variables via a phone follow-up.
7
16
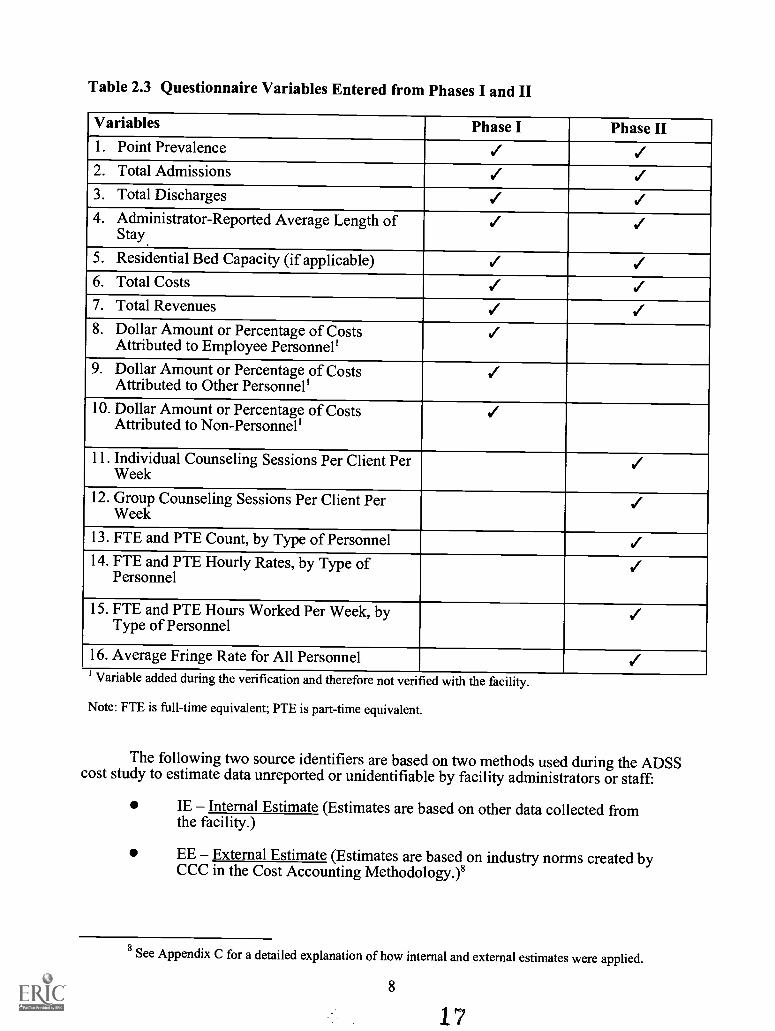
Table 2.3 Questionnaire Variables Entered from Phases I and II
Variables Phase I Phase II1. Point Prevalence / /2. Total Admissions / /3. Total Discharges / /4. Administrator-Reported Average Length of
Stay./ /
5. Residential Bed Capacity (if applicable) / /6. Total Costs / /7. Total Revenues / .18. Dollar Amount or Percentage of Costs
Attributed to Employee Personnel'/
9. Dollar Amount or Percentage of CostsAttributed to Other Personnel'
/10. Dollar Amount or Percentage of Costs
Attributed to Non-Personnel'/
11. Individual Counseling Sessions Per Client PerWeek
/12. Group Counseling Sessions Per Client Per
Week/
13. FTE and PTE Count, by Type of Personnel /14. FTE and PTE Hourly Rates, by Type of
Personnel/
15. FTE and PTE Hours Worked Per Week, byType of Personnel
/16. Average Fringe Rate for All Personnel /Variable added during the verification and therefore not verified with the facility.
Note: FTE is full-time equivalent; PTE is part-time equivalent.
The following two source identifiers are based on two methods used during the ADSScost study to estimate data unreported or unidentifiable by facility administrators or staff:
IE Internal Estimate (Estimates are based on other data collected fromthe facility.)
EE External Estimate (Estimates are based on industry norms created byCCC in the Cost Accounting Methodology.)8
8See Appendix C for a detailed explanation of how internal and external estimates were applied.
8
17
2.3 Key Ratios and Analysis Variables
Key ratios and analysis variables were developed to compare data reported in bothPhases I and II as well as to examine data collected within each phase.' The data auditinstrument was developed to examine the questionnaire variables from these two perspectives toobtain the most accurate data possible. To compare data from Phases I and II, difference ratioswere developed to represent the difference in values for a specific variable between Phase I andPhase II. For example, if a facility reported the number of admissions as 450 in Phase I and 485in Phase II, the difference ratio would equal 7.78 percent, signifying a difference in admissionsof about 8 percent. Consistent responses among the data collection values engenderedconfidence in the data, while large differences served as flags, indicating the need for a facilitycallback and further data verification. Comparisons within Phases I and II involve analysis ratiosof cost per admission and cost per enrolled client day using three different measures of annualclient volume, including point prevalence and length of stay, to estimate admissions anddischarges. Similarly, ratios pertaining to phase-specific analyses either were accepted into thefile record or prompted a facility callback. No value for a variable was entered into thespreadsheet workbook until the entire analysis for a substance abuse treatment facility wascomplete. An update or change of one value for a variable may have prompted reexamination ofone or several related variables in the data set.
2.3.1 Comparisons of Phases I and II
Four main clusters of analysis ratios pertain to the comparison of data reported in PhasesI and II of ADSS. These ratios are located in Appendix A in this report and are summarized inTable 2.4. Expected values and ranges were applied to each modality of treatment. The valuesused allowed for changes in facility structure and workload during the average 1-year intervalbetween Phase I and Phase II of ADSS.
The first cluster of comparison ratios used for analyzing the differences between Phases Iand II of ADSS pertains to differences in client volume as measured by the difference in pointprevalence client counts (difference "a" in Table 2.4), the difference in reported annualadmissions (difference "b"), and the difference in the average daily client count (difference "c").Difference "c" is based on a formula using admissions and the administrator-reported averagelength of stay. All three client count values are summarized in the ratio "average client countdifference," which is the mean difference in reported client volume. In the analysis, each specificcomparison count difference or ratio was expected to be within 20 percent of the average clientcount difference. Values outside this range were marked for telephone verification with thefacility.
The second cluster of comparison ratios pertains to differences in financial data asmeasured by the differences in total costs and the differences in total revenue. These twomeasures are summarized in a summary ratio titled "average financial difference," which denotesthe mean difference in Phase I and Phase II reported costs and revenues. Given the linearrelationship between program finances and client volume, the average financial difference wasexpected to be within 15 percent of the difference in client volume, summarized by the averageclient difference. Values outside this range were marked for subsequent investigation with thefacility staff.
The third comparison ratio used for analysis of the differences between Phases I and II ofADSS was "difference in the administrator-reported average length of stay." As more substanceabuse treatment programs shifted into the managed care market, there was a possibility for
9 A complete list of all key ratios and analysis variables used in the ADSS cost study is in Appendix B.
9
18
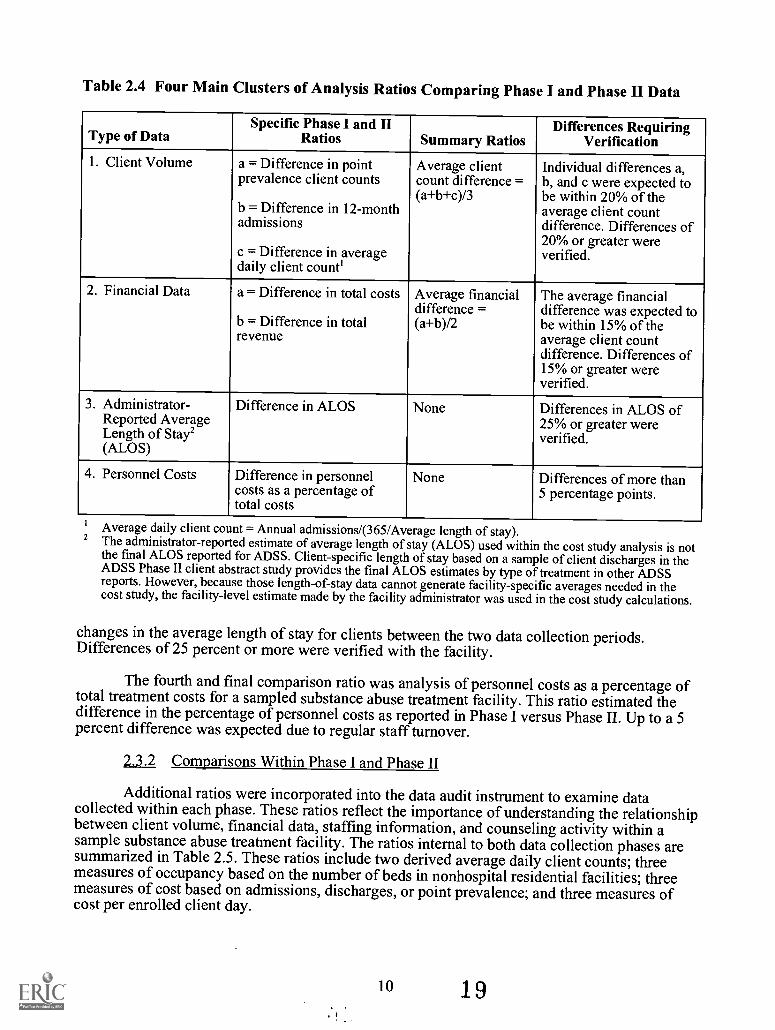
Table 2.4 Four Main Clusters of Analysis Ratios Comparing Phase I and Phase II Data
Type of DataSpecific Phase I and II
Ratios Summary RatiosDifferences Requiring
Verification1. Client Volume a = Difference in point
prevalence client counts
b = Difference in 12-monthadmissions
c = Difference in averagedaily client count'
Average clientcount difference =(a+b+c)/3
Individual differences a,b, and c were expected tobe within 20% of theaverage client countdifference. Differences of20% or greater wereverified.
2. Financial Data a = Difference in total costs
b = Difference in totalrevenue
Average financialdifference =(a+b)/2
The average financialdifference was expected tobe within 15% of theaverage client countdifference. Differences of15% or greater wereverified.
3. Administrator-Reported AverageLength of Stay'(ALOS)
Difference in ALOS None Differences in ALOS of25% or greater wereverified.
4. Personnel Costs Difference in personnelcosts as a percentage oftotal costs
None Differences of more than5 percentage points.
1 Average daily client count = Annual admissions/(365/Average length of stay).2The administrator-reported estimate of average length ofstay (ALOS) used within the cost study analysis is notthe final ALOS reported for ADSS. Client-specific length ofstay based on a sample of client discharges in theADSS Phase II client abstract study provides the final ALOS estimates by type of treatment in other ADSSreports. However, because those length-of-stay data cannot generate facility-specific averages needed in thecost study, the facility-level estimate made by the facility administrator was used in the cost study calculations.
changes in the average length of stay for clients between the two data collection periods.Differences of 25 percent or more were verified with the facility.
The fourth and final comparison ratio was analysis of personnel costs as a percentage oftotal treatment costs for a sampled substance abuse treatment facility. This ratio estimated thedifference in the percentage of personnel costs as reported in Phase I versus Phase II. Up to a 5percent difference was expected due to regular staff turnover.
2.3.2 Comparisons Within Phase I and Phase II
Additional ratios were incorporated into the data audit instrument to examine datacollected within each phase. These ratios reflect the importance of understanding the relationshipbetween client volume, financial data, staffing information, and counseling activity within asample substance abuse treatment facility. The ratios internal to both data collection phases aresummarized in Table 2.5. These ratios include two derived average daily client counts; threemeasures of occupancy based on the number of beds in nonhospital residential facilities; threemeasures of cost based on admissions, discharges, or point prevalence; and three measures ofcost per enrolled client day.
10 19
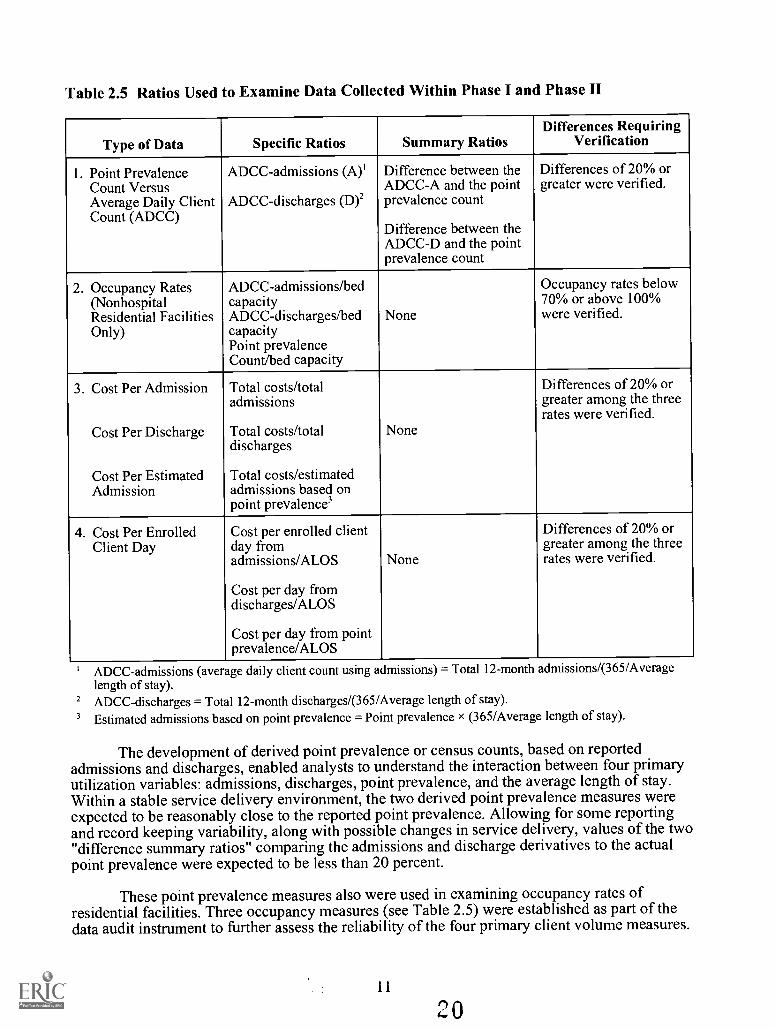
Table 2.5 Ratios Used to Examine Data Collected Within Phase I and Phase II
Type of Data Specific Ratios Summary RatiosDifferences Requiring
Verification
1. Point PrevalenceCount VersusAverage Daily ClientCount (ADCC)
ADCC-admissions (A)'
ADCC-discharges (D)2
Difference between theADCC-A and the pointprevalence count
Difference between theADCC-D and the pointprevalence count
Differences of 20% orgreater were verified.
2. Occupancy Rates(NonhospitalResidential FacilitiesOnly)
ADCC-admissions/bedcapacityADCC-discharges/bedcapacityPoint prevalenceCount/bed capacity
None
Occupancy rates below70% or above 100%were verified.
3. Cost Per Admission
Cost Per Discharge
Cost Per EstimatedAdmission
Total costs/totaladmissions
Total costs/totaldischarges
Total costs/estimatedadmissions based onpoint prevalence3
None
Differences of 20% orgreater among the threerates were verified.
4. Cost Per EnrolledClient Day
Cost per enrolled clientday fromadmissions/ALOS
Cost per day fromdischarges/ALOS
Cost per day from pointprevalence/ALOS
None
Differences of 20% orgreater among the threerates were verified.
ADCC-admissions (average daily client count using admissions) = Total 12-month admissions/(365/Averagelength of stay).
2 ADCC-discharges = Total 12-month discharges/(365/Average length of stay).3 Estimated admissions based on point prevalence = Point prevalence X (365/Average length of stay).
The development of derived point prevalence or census counts, based on reportedadmissions and discharges, enabled analysts to understand the interaction between four primaryutilization variables: admissions, discharges, point prevalence, and the average length of stay.Within a stable service delivery environment, the two derived point prevalence measures wereexpected to be reasonably close to the reported point prevalence. Allowing for some reportingand record keeping variability, along with possible changes in service delivery, values of the two"difference summary ratios" comparing the admissions and discharge derivatives to the actualpoint prevalence were expected to be less than 20 percent.
These point prevalence measures also were used in examining occupancy rates ofresidential facilities. Three occupancy measures (see Table 2.5) were established as part of thedata audit instrument to further assess the reliability of the four primary client volume measures.
11
Again, assuming a stable environment, these variables were expected to be reasonably close toeach other but should individually fall within a range of 70 to 100 percent occupancy.
Cost per admission and cost per enrolled client day were two additional types of ratiosused in examining data reported within each phase. Cost per admission was developed as a ratioof total costs to three measures of client volume: admissions, discharges, or a derived clientthroughput measure developed from point prevalence and the average length of stay." The costper enrolled client day was in turn developed by taking each measure of cost per admission anddividing it by the average length of stay. These ratios assisted analysts to understand not only therelationship between the primary client volume measures but also provided insight into therelationship between client volume and total cost. These values were expected to be reasonablyclose within a stable environment, and any differences over 20 percent were discussed withfacility staff.
2.3.3 Comparisons Within Phase II Only
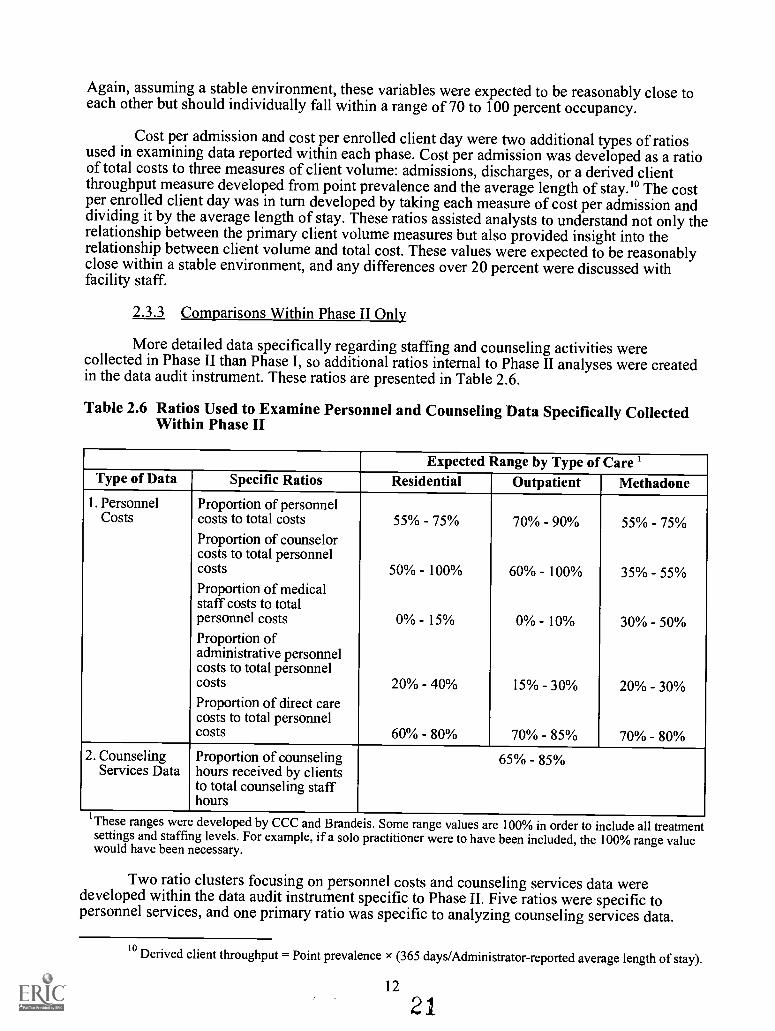
More detailed data specifically regarding staffing and counseling activities werecollected in Phase II than Phase I, so additional ratios internal to Phase II analyses were createdin the data audit instrument. These ratios are presented in Table 2.6.
Table 2.6 Ratios Used to Examine Personnel and Counseling Data Specifically CollectedWithin Phase II
Expected Range by Type of Care 1Type of Data Specific Ratios Residential Outpatient Methadone
1. Personnel Proportion of personnelCosts costs to total costs 55% - 75% 70% - 90% 55% - 75%
Proportion of counselorcosts to total personnelcosts 50% 100% 60% - 100% 35% - 55%Proportion of medicalstaff costs to totalpersonnel costs 0% - 15% 0% 10% 30% - 50%Proportion ofadministrative personnelcosts to total personnelcosts 20% 40% 15% - 30% 20% - 30%Proportion of direct carecosts to total personnelcosts 60% 80% 70% - 85% 70% - 80%
2. CounselingServices Data
Proportion of counselinghours received by clientsto total counseling staffhours
65% 85%
'Theseranges were developed by CCC and Brandeis. Some range values are 100% in order to include all treatment
settings and staffing levels. For example, if a solo practitioner were to have been included, the 100% range valuewould have been necessary.
Two ratio clusters focusing on personnel costs and counseling services data weredeveloped within the data audit instrument specific to Phase II. Five ratios were specific topersonnel services, and one primary ratio was specific to analyzing counseling services data.
toDerived client throughput = Point prevalence x (365 days/Administrator-reported average length of stay).
12
21
Each ratio had an expected range by type of care, based on the experience of CCC's previousanalyses of substance abuse treatment facility data.
The ratios pertaining to personnel services included the proportion of personnel costs tototal costs, the proportion of counselor costs to total personnel costs, the proportion of medicalstaff costs to total personnel costs, the proportion of administrative personnel costs to totalpersonnel costs, and the proportion of direct care costs to total personnel costs. This analysisprovided a series of summary variables for assessing the distribution ofpersonnel costs in asubstance abuse treatment facility. According to CCC's cost accounting study, 55 to 75 percentof residential and methadone facility costs were likely to be attributed to personnel (includingsalaries and fringe benefits of full-time, part-time, and contract staff). For outpatientnonmethadone programs, the range was 70 to 90 percent. Personnel costs identified outside thisrange prompted analysts to inquire further with the facility about its overall distribution of costs.
Counselor costs were identified by obtaining the number of counselors within variouscategories identified by education level (e.g., master's, bachelor's, and nondegreed counselors),and by obtaining the average number of hours worked per week by counselors in each categoryalong with their average hourly rates. Average fringe benefit rates were calculated for eachfacility as well. Counselor costs were expected to be the highest proportion of personnel costs,greater than 50 percent of personnel costs for residential facilities and greater than 60 percent ofpersonnel costs for outpatient nonmethadone facilities. For methadone facilities, medical staffcosts were expected to be equal to or greater than the proportion of counselor costs to totalpersonnel costs. Administrative personnel were expected to represent 20 to 40 percent ofresidential total personnel costs, 15 to 30 percent of outpatient nonmethadone total personnelcosts, and 20 to 30 percent of methadone total personnel costs. Direct service staff was expectedto represent 60 to 80 percent of residential facility personnel costs, 70 to 85 percent of outpatientnonmethadone facility personnel costs, and 70 to 80 percent of methadone facility personnelcosts.
Lastly, counseling services were analyzed by assessing the proportion ofcounselinghours received by clients to total counseling staff hours. On average, 65 to 85 percent ofcounseling staff time was expected to be attributed to client counseling services. Otherwise, coststudy analysts would have inquired about the reported data represented in this ratio.
Analyzing Phase I and Phase II data from the two perspectives provided a solidframework for assessing the reliability of data collected from facilities. Changes in one set ofvariables often prompted further review of related data. A facility data audit analysis wasconsidered complete only when the analysts were satisfied with their review of these primaryanalysis ratios.
2.4 Facility Callback Process
As previously indicated in this report, 96 percent of sample treatment modalities requireda callback from the cost analysis team for at least one variable in question. As a result, it wasimperative to develop an efficient, comprehensive strategy for entering the original ADSS PhaseI and Phase II data into individual spreadsheet workbooks, conducting an initial review,summarizing the data in question for facility administrators to examine, and then contacting thefacility over the telephone to discuss and finalize the data for entry into the main cost file.
Upon completion of the ADSS data collection, Phase I and Phase II questionnaires weresent to cost analysts for the ADSS cost study. Trained support staff first entered data into thedata audit instrument and identified any missing data. One of the cost analysts then conducted aninitial review of the data audit file, identified data inconsistencies as represented in the analysisratios, and prepared a series of summary tables and brief paragraphs explaining the data inquestion for facility review. A telephone call was made to the facility to briefly summarize the
13
22
data in question and to set up a mutually convenient time to discuss the data review. Thedocument was then faxed to the facility in preparation for a callback. Generally, the call wasscheduled within a week of the initial fax, providing adequate time for facility officials to lookover the data inconsistencies.
The analysis staff called the administrator at the agreed-upon time andworked directlyover the phone with the data audit file within view. Ideally, the administrator discussed with theanalyst the necessary updates to the file, allowing for further prompting by the analyst ifnecessary. Often, the analyst would be referred to additional administrative and clinical staff toclarify information. This entailed additional follow-up with facility officials.
Initially, the time spent entering data, analyzing and reviewing the data audit, andfollowing up with facilities averaged about 10 to 12 hours per facility. After developing a moreefficient approach, this time was reduced to approximately 4 to 5 hours per facility.
23
14
3. Data Quality Control Analysis
Given the complex data collection methods undertaken in the ADSS, it is important toassess the consistency of responses by facilities to the Phase I and Phase II surveys. Because thedata audit instrument provided for analysis of variables in relationship to one another throughformulas or ratios, as a single variable was checked, other variables that "related" to the variablein question also required further review. Given this multistage data collection process, allquestionnaire variables were categorized by a "source identifier" in the cost file: provideroriginal, provider revised, and provider documentation (see Section 2.2.2). Data quality controlanalyses of the source variables provided insight into which questionnaire variables werereported most reliably and which variables were updated most frequently during the callbackprocess.
The distribution of source identifiers for six primary key Phase II questionnaire variables(point prevalence, admissions, discharges, the administrator-reported average length of stay,total costs, and total revenues) are presented below. They are presented in order of reportingreliability based on the distribution of source identifiers. Each distribution represents responsesfrom all 314 treatment units included in the ADSS cost study.
Figure 3.1 shows the distribution of source identifiers for three key questionnairevariables: point prevalence, admissions, and the administrator-reported average length of stay.Among key client volume and financial data collected from facilities, these three variablesmaintained the highest percentage of final data coming from providers' originally reportedinformation in the Phase II administrator interview. Point prevalence was the most reliablevariable for facilities to report, with 82 percent of the final data coming from Phase II originallyreported data. In contrast, Phase II admissions had 62 percent of final data coming from theoriginal Phase II questionnaire, while the Phase II administrator-reported average length of stayhad 43 percent of final data coming from this original source."
All three variables had between 10 and 25 percent of final data coming from provider-revised data obtained from the facility callback process. A very small percentage of final data forall three variables (under 5 percent) was obtained through additional provider documentation.Internal and external estimates were used infrequently for both point prevalence and admissionsvariables, but the administrator-reported average length of stay had a high percentage (30percent) of internal estimates. The use of internal estimates often was required to determine thefinal administrator-reported average length of stay because facility officials lacked confidence inreporting the average length of stay for clients. In this type of situation, the client volume datawere used to develop an estimate of the average length of stay.
11 In checking data on discharges, study staff asked facilities to consider a client "discharged" if she or hehad received no services within the past 45 days. Estimated lengths of stay were based on other data variablescontained within the questionnaire: staffing, admissions, discharges, and point prevalence. Estimates are based onthese factors and CCC historical data for length of stay.
15 24
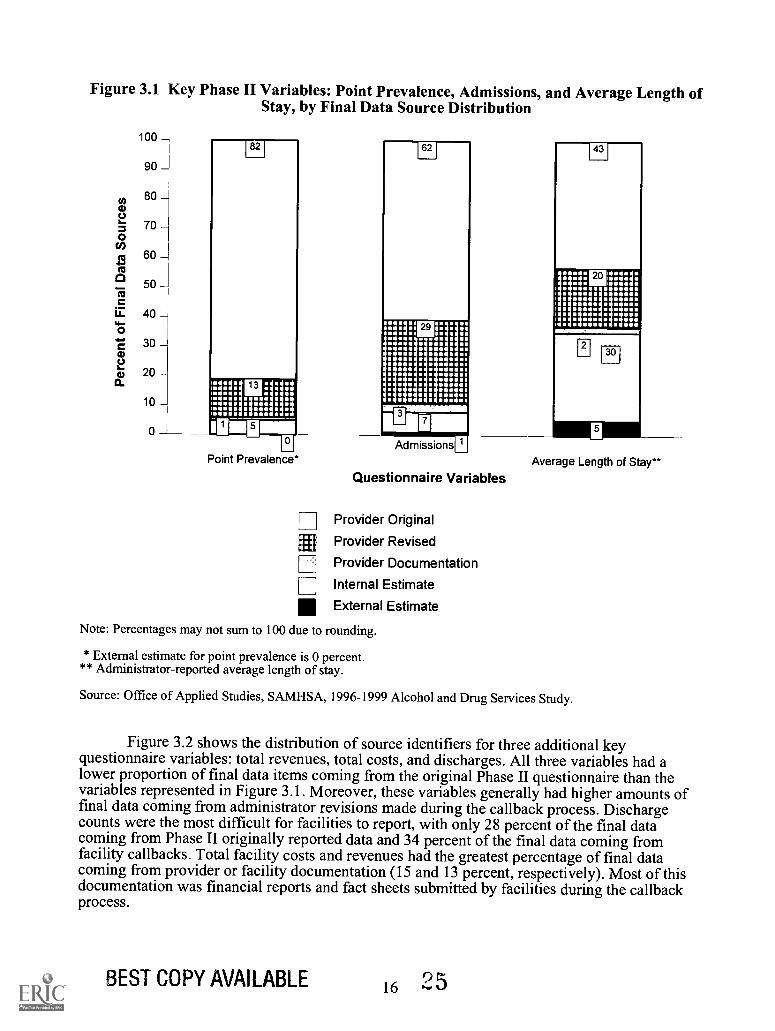
Figure 3.1 Key Phase II Variables: Point Prevalence, Admissions, and Average Length ofStay, by Final Data Source Distribution
100
90
80
70
60
50
40
30
20
10
0
Point Prevalence*AdmissionsT
Questionnaire Variables
Provider Original
Provider Revised
Provider Documentation
Internal Estimate
External Estimate
Average Length of Stay**
Note: Percentages may not sum to 100 due to rounding.
* External estimate for point prevalence is 0 percent.** Administrator-reported average length of stay.
Source: Office of Applied Studies, SAMHSA, 1996-1999 Alcohol and Drug Services Study.
Figure 3.2 shows the distribution of source identifiers for three additional keyquestionnaire variables: total revenues, total costs, and discharges. All three variableshad alower proportion of final data items coming from the original Phase II questionnaire than thevariables represented in Figure 3.1. Moreover, these variables generally had higheramounts offinal data coming from administrator revisions made during the callback process. Dischargecounts were the most difficult for facilities to report, with only 28 percent of the final datacoming from Phase II originally reported data and 34 percent of the final data coming fromfacility callbacks. Total facility costs and revenues had the greatest percentage of final datacoming from provider or facility documentation (15 and 13 percent, respectively). Most of thisdocumentation was financial reports and fact sheets submitted by facilities during the callbackprocess.
BEST COPY AVAILABLE 16 25
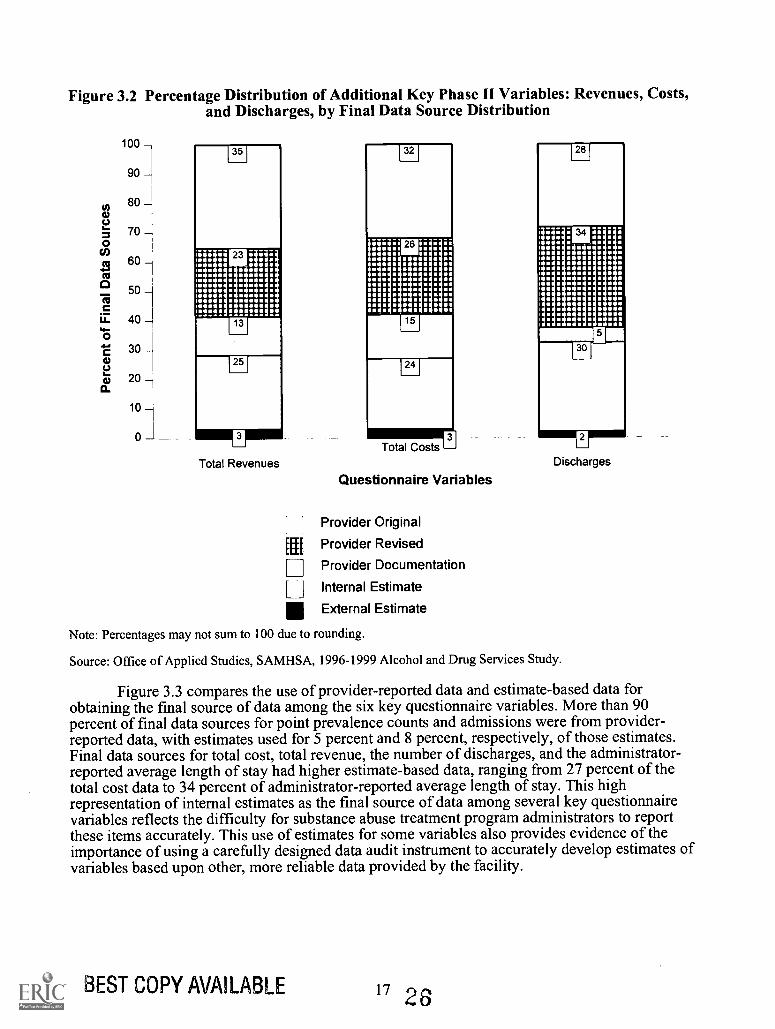
Figure 3.2 Percentage Distribution of Additional Key Phase II Variables: Revenues, Costs,and Discharges, by Final Data Source Distribution
100
90
80
70
60
50
40
30
20
10
35
1251
Total Revenues
[EU
[
Total Costs
Questionnaire Variables
Provider Original
Provider Revised
Provider Documentation
Internal Estimate
External Estimate
Discharges
Note: Percentages may not sum to 100 due to rounding.
Source: Office of Applied Studies, SAMHSA, 1996-1999 Alcohol and Drug Services Study.
Figure 3.3 compares the use of provider-reported data and estimate-based data forobtaining the final source of data among the six key questionnaire variables. More than 90percent of final data sources for point prevalence counts and admissions were from provider-reported data, with estimates used for 5 percent and 8 percent, respectively, of those estimates.Final data sources for total cost, total revenue, the number of discharges, and the administrator-reported average length of stay had higher estimate-based data, ranging from 27 percent of thetotal cost data to 34 percent of administrator-reported average length of stay. This highrepresentation of internal estimates as the final source of data among several key questionnairevariables reflects the difficulty for substance abuse treatment program administrators to reportthese items accurately. This use of estimates for some variables also provides evidence of theimportance of using a carefully designed data audit instrument to accurately develop estimates ofvariables based upon other, more reliable data provided by the facility.
BEST COPY AVAILABLE 17 26
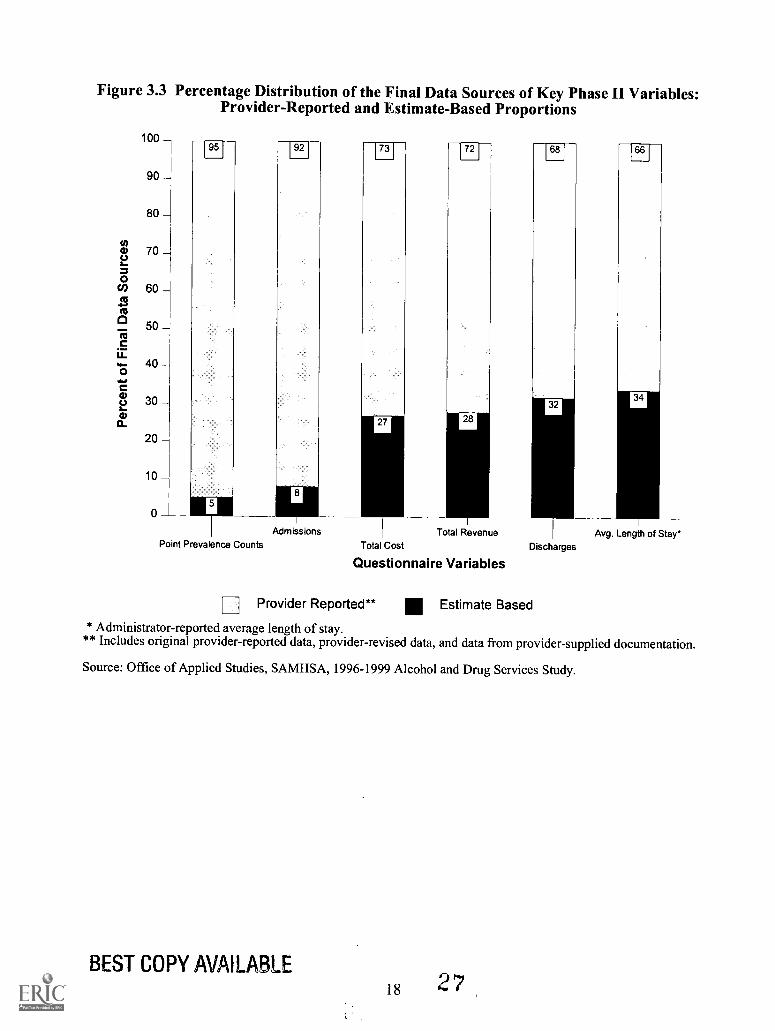
Figure 3.3 Percentage Distribution of the Final Data Sources of Key Phase II Variables:Provider-Reported and Estimate-Based Proportions
100
90
80
70
60
50
40
30
20
10
o
95
Point Prevalence Counts
92
Admissions
73
rio
72
Total RevenueTotal Cost
Questionnaire Variables
68
DischargesAvg. Length of Stay*
Provider Reported** Estimate Based
* Administrator-reported average length of stay.** Includes original provider-reported data, provider-revised data, and data from provider-supplied documentation.
Source: Office of Applied Studies, SAMHSA, 1996-1999 Alcohol and Drug Services Study.
BEST COPY AVAILABLE18 27
4. Results of the ADSS Cost Study
Estimates of the cost of treatment resulting from the ADSS cost study fall into threecategories: key unit costs, personnel costs, and national cost estimates. These cost data are keyindicators useful for policymakers and participants in the delivery and financing of substanceabuse treatment. All analyses were conducted using weighted Phase II sample data to producenational estimates.'2
Section 4.1 provides national estimates of key unit cost variables, including cost peradmission and cost per enrolled client day for nonhospital residential, outpatient methadone, andoutpatient nonmethadone facilities. The mean cost per reported visit' also was analyzed foroutpatient methadone and outpatient nonmethadone facilities, and the cost per documentedvisit' and cost per counseling hour' are reported for outpatient nonmethadone facilities.
Section 4.2 contains personnel cost estimates. This section also includes personnelanalyses, important to understanding the distribution and cost of personnel services in substanceabuse treatment. Personnel analyses include descriptive measures of fringe benefit rates,personnel cost proportions, and weighted analyses of hourly rates by staffing category acrossnonhospital residential, outpatient methadone, and outpatient nonmethadone facilities.
Finally, national cost-adjusted estimates are provided for all three types of care in Section4.3.
4.1 Key Unit Cost Estimates
Five main unit cost variables were developed as a result of the ADSS cost study: meancost per admission, mean cost per client day, mean cost per reported visit, mean cost perdocumented visit, and mean cost per counseling hour. These variables have been usedconsistently as benchmarks in other substance abuse treatment studies (see references) and havebeen found to provide useful information to policymakers, payers, and providers of care.
Total annual costs, the numerator in the mean cost calculations, include all costs orexpenditures for the substance abuse treatment modality during the most recent 12-monthreporting period. Facilities were instructed to report explicit costs (direct and indirect facilityoutlays and operating noncapital expenditures) as well as implicit costs (asset depreciation andthe estimated market value of resources used free of charge, such as donated use of a building,by the treatment facility). Most facilities were able to report these latter costs accurately.
As indicated in the review of ratios contained in the data audit instrument, the unitvariable "mean cost per admission" was measured using three primary client volume measures:annual admissions, annual discharges, and a derived annual throughput measure based on thepoint prevalence count. These three measures were studied for reliability, and in the finalanalysis, the annual admissions measure was found to be the best representative of reportedclient volume data in the study. The number of admissions was more accurately reported by
12 The documentation on weights can be found in the Codebook, Part 2: Phase II, Administrator Interview(filename: cb3088p2.pdf.gz) at the website cited in footnote 2.
13 Reported visits were based on the number of visits reported in aggregate by the facility administrator.
14 Documented visits were based on actual visits documented in individual client records in the Phase IIclient record abstract study.
15 Counseling hours were based on administrators' report of the average number of counseling sessions perclient per week.
19
28
facilities than the number of discharges, while the throughput measure was derived using theadministrator-reported average length of stay, which required internal or external estimates formore than 30 percent of the facilities.
For the variable "cost per enrolled client day," three similar ratios were developed foranalysis purposes. For final reporting of this unit cost variable, client days were calculated foreach sampled substance abuse treatment facility based on the point prevalence count and theadministrator-reported average length of stay. The point prevalence count was reported with highaccuracy (82 percent based on original data provided by the administrator), while theadministrator-reported average length of stay was the only estimate of days enrolled in treatmentby facility. Note that, for outpatient modalities, "enrolled client days" included the entireestimated enrollment period, not just the days a client visited the facility. A separate variable, the"mean cost per visit," reflected only the days during which an outpatient client visited thefacility.
"Mean cost per visit" was calculated in two ways. The "cost per reported visit" measurerepresented the average client counseling sessions based on the administrator's best estimate inthe Phase II administrator interview. The "cost per documented visit" measure resulted from themean number of visits calculated from documented client visits in client records sampled andreviewed in the Phase II client record abstract study.
"Cost per counseling hour" was calculated using an estimated total number of counselinghours provided by the facility during the year. This is the product of the administrator's estimateof the number of counseling sessions per client per week times 52 weeks per year times the pointprevalence client count. Assuming individual sessions were approximately 1 hour in length, thecost per counseling hour equaled the cost of an individual session. The cost per group counselinghour was derived as the cost per counseling hour divided by the estimated mean number ofclients in a group session.
To calculate nationally representative statistics, facility-level weights were applied toboth the numerator (total annual costs), and denominators (annual admissions, client days, visits,or counseling hours) of each of these unit cost measures. Estimates were calculated usingSUrvey DAta ANalysis (SUDAAN) statistical software, Release 8.0 (RTI, 2001). Furthermore,for each mean unit cost measure, a minimum value, maximum value, standard error (SE), andcoefficient of variation (CV) were calculated. A detailed description regarding the derivation ofthe standard error for these unit cost variables is provided in Appendix D.
As indicated in Table 4.1, the mean cost per admission for residential care (n = 48treatment modalities) was $3,132, with a standard error of the mean of $490 and coefficient ofvariation of 16 percent. The mean cost per admission for outpatient methadone treatment (n = 44treatment modalities) was $6,048, with a standard error of the mean of $1,013 and coefficient ofvariation of 17 percent. The mean cost per admission for outpatient nonmethadone facilities (n =222 treatment modalities) was $1,169, with a standard error of the mean of $81 and coefficientof variation of 7 percent. As indicated, the mean cost per admission for outpatient methadonefacilities was found to be greater than that of residential facilities, while the cost per admissionfor outpatient nonmethadone facilities was the lowest among the three types of care. A likelyexplanation for differences in cost per admission among the three types of care is that clients inoutpatient methadone treatment have a much longer average length of stay (an estimated 520days for outpatient methadone care compared with 144 days for outpatient nonmethadone careand 45 days in nonhospital residential care, based on Phase II client record abstract data). Totalcosts for all facilities are presented to show how the mean cost per admission was calculated.(The final total costs, derived with a more accurate method based on combining enrollment daysfrom the larger sample of Phase I facilities with detailed Phase II mean costs, are presented inTable 4.10 at the end of this chapter.)
20
29
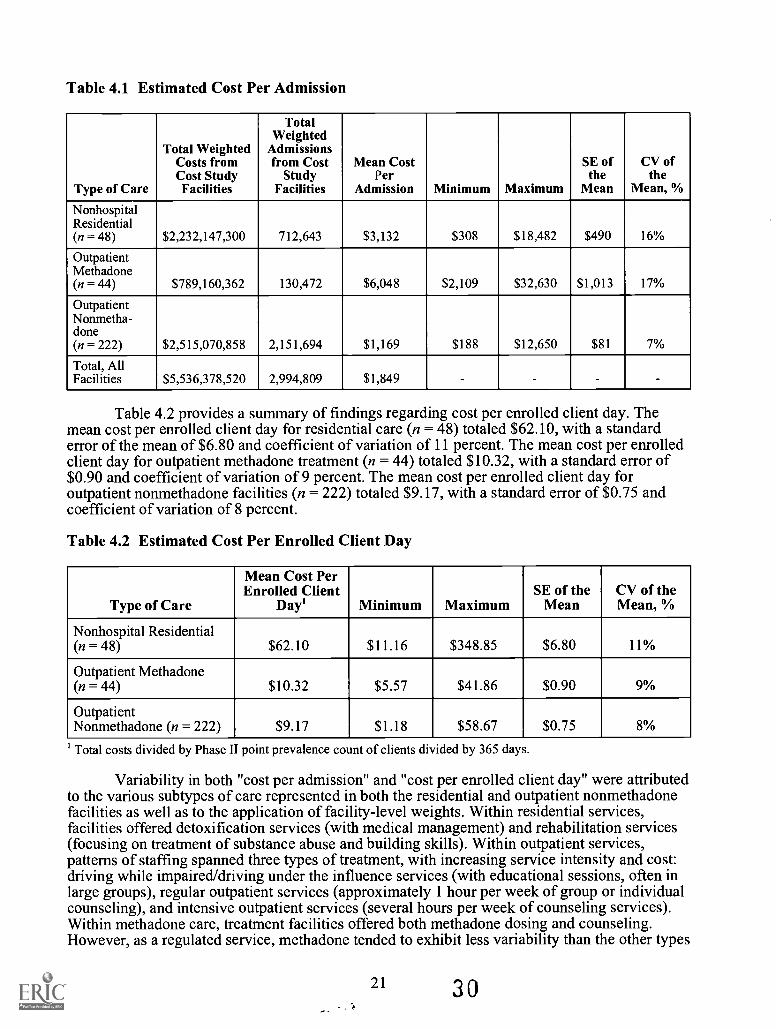
Table 4.1 Estimated Cost Per Admission
Type of Care
Total WeightedCosts fromCost StudyFacilities
TotalWeighted
Admissionsfrom Cost
StudyFacilities
Mean CostPer
Admission Minimum Maximum
SE ofthe
Mean
CV ofthe
Mean, %
NonhospitalResidential(n = 48) $2,232,147,300 712,643 $3,132 $308 $18,482 $490 16%
OutpatientMethadone(n = 44) $789,160,362 130,472 $6,048 $2,109 $32,630 $1,013 17%
OutpatientNonmetha-done(n = 222) $2,515,070,858 2,151,694 $1,169 $188 $12,650 $81 7%
Total, AllFacilities $5,536,378,520 2,994,809 $1,849 - - - -
Table 4.2 provides a summary of findings regarding cost per enrolled client day. Themean cost per enrolled client day for residential care (n = 48) totaled $62.10, with a standarderror of the mean of $6.80 and coefficient of variation of 11 percent. The mean cost per enrolledclient day for outpatient methadone treatment (n = 44) totaled $10.32, with a standard error of$0.90 and coefficient of variation of 9 percent. The mean cost per enrolled client day foroutpatient nonmethadone facilities (n = 222) totaled $9.17, with a standard error of $0.75 andcoefficient of variation of 8 percent.
Table 4.2 Estimated Cost Per Enrolled Client Day
Type of Care
Mean Cost PerEnrolled Client
Day' Minimum MaximumSE of the
MeanCV of theMean, %
Nonhospital Residential(n = 48) $62.10 $11.16 $348.85 $6.80 11%
Outpatient Methadone(n = 44) $10.32 $5.57 $41.86 $0.90 9%
OutpatientNonmethadone (n = 222) $9.17 $1.18 $58.67 $0.75 8%
' Total costs divided by Phase II point prevalence count of clients divided by 365 days.
Variability in both "cost per admission" and "cost per enrolled client day" were attributedto the various subtypes of care represented in both the residential and outpatient nonmethadonefacilities as well as to the application of facility-level weights. Within residential services,facilities offered detoxification services (with medical management) and rehabilitation services(focusing on treatment of substance abuse and building skills). Within outpatient services,patterns of staffing spanned three types of treatment, with increasing service intensity and cost:driving while impaired/driving under the influence services (with educational sessions, often inlarge groups), regular outpatient services (approximately 1 hour per week of group or individualcounseling), and intensive outpatient services (several hours per week of counseling services).Within methadone care, treatment facilities offered both methadone dosing and counseling.However, as a regulated service, methadone tended to exhibit less variability than the other types
21 30
of care. The variations within each type of care reflect both differences among the types oftreatment and facilities' approaches to offering treatment.
The variations in cost per enrollment day depended on both the intensity and mix ofservices per enrollment day and the prices of inputs (e.g., hourly wages of counselors andmedical personnel). Analyses in the cost study found relatively little variation in hourly wages,but substantial variations in intensities and mix of services, suggesting that the latter was theprimary reason for the large variations in cost.
The following identity helps relate cost per enrollment day to another important unitcostthe cost per admission:
Cost per admission = (Enrollment days per admission) x (Cost per enrollment day).
On a log scale, the product on the right-hand side of the equation is transformed to a sum.If the factors are independent, then the variance of the result is the sum of the variances of thecomponents. Because the components were empirically almost independent, the measures thathad more possible sources of variation did in fact show greater variation. Cost per admissionvaried for two reasons: The number of enrollment days per admission (also known as the lengthof stay) varied among facilities, as did the cost per enrollment day.
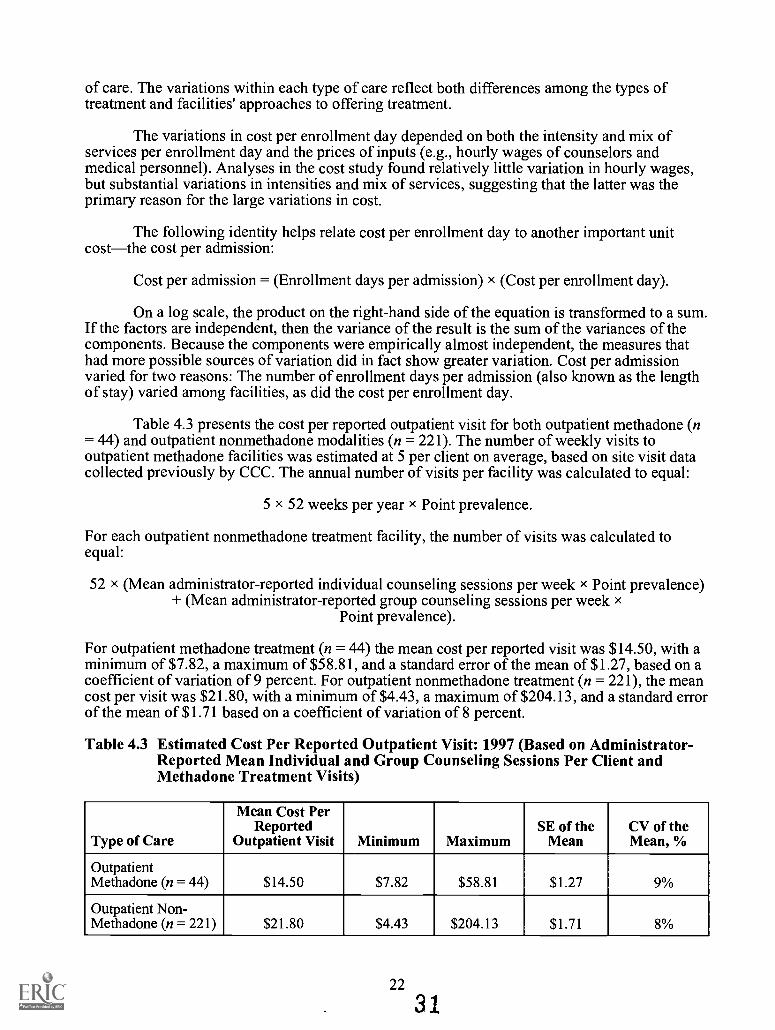
Table 4.3 presents the cost per reported outpatient visit for both outpatient methadone (n= 44) and outpatient nonmethadone modalities (n = 221). The number of weekly visits tooutpatient methadone facilities was estimated at 5 per client on average, based on site visit datacollected previously by CCC. The annual number of visits per facility was calculated to equal:
5 x 52 weeks per year x Point prevalence.
For each outpatient nonmethadone treatment facility, the number of visits was calculated toequal:
52 x (Mean administrator-reported individual counseling sessions per week x Point prevalence)+ (Mean administrator-reported group counseling sessions per week x
Point prevalence).
For outpatient methadone treatment (n = 44) the mean cost per reported visit was $14.50, with aminimum of $7.82, a maximum of $58.81, and a standard error of the mean of $1.27, based on acoefficient of variation of 9 percent. For outpatient nonmethadone treatment (n = 221), the meancost per visit was $21.80, with a minimum of $4.43, a maximum of $204.13, and a standard errorof the mean of $1.71 based on a coefficient of variation of 8 percent.
Table 4.3 Estimated Cost Per Reported Outpatient Visit: 1997 (Based on Administrator-Reported Mean Individual and Group Counseling Sessions Per Client andMethadone Treatment Visits)
Type of Care
Mean Cost PerReported
Outpatient Visit Minimum MaximumSE of the
MeanCV of theMean, %
OutpatientMethadone (n = 44) $14.50 $7.82 $58.81 $1.27 9%
Outpatient Non-Methadone (n = 221) $21.80 $4.43 $204.13 $1.71 8%
22
31
4.2 Personnel Costs
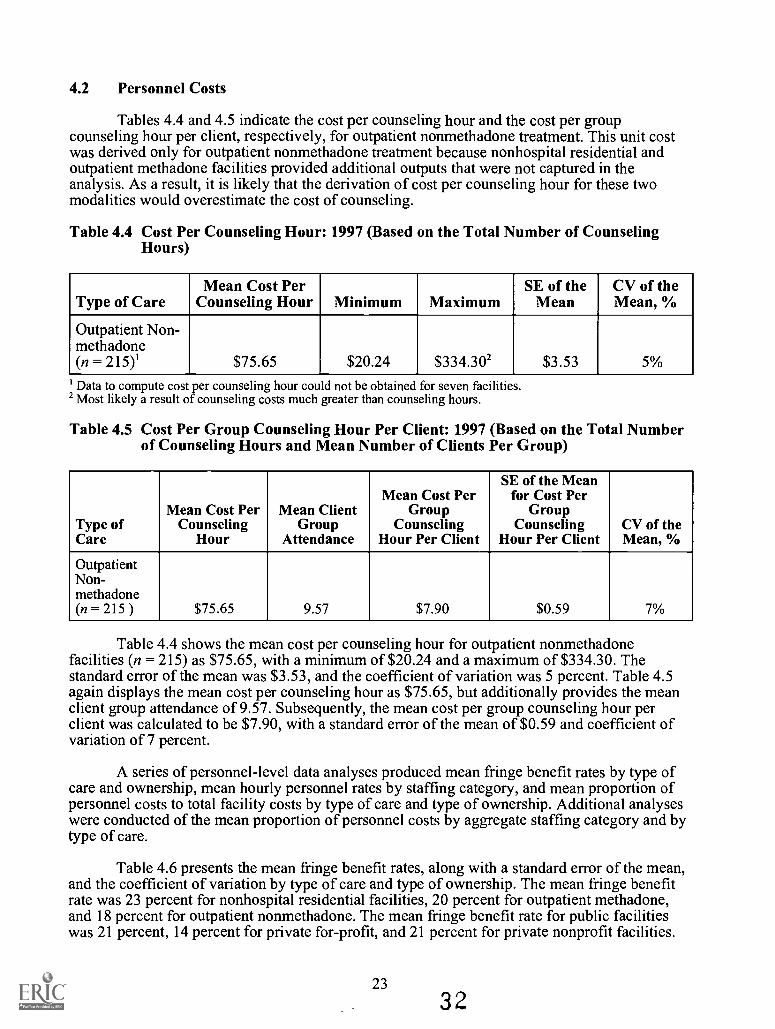
Tables 4.4 and 4.5 indicate the cost per counseling hour and the cost per groupcounseling hour per client, respectively, for outpatient nonmethadone treatment. This unit costwas derived only for outpatient nonmethadone treatment because nonhospital residential andoutpatient methadone facilities provided additional outputs that were not captured in theanalysis. As a result, it is likely that the derivation of cost per counseling hour for these twomodalities would overestimate the cost of counseling.
Table 4.4 Cost Per Counseling Hour: 1997 (Based on the Total Number of CounselingHours)
Type of CareMean Cost Per
Counseling Hour Minimum MaximumSE of the
MeanCV of theMean, %
Outpatient Non-methadone(n = 215)1 $75.65 $20.24 $334.30' $3.53 5%
' Data to compute cost per counseling hour could not be obtained for seven facilities.2 Most likely a result of counseling costs much greater than counseling hours.
Table 4.5 Cost Per Group Counseling Hour Per Client: 1997 (Based on the Total Numberof Counseling Hours and Mean Number of Clients Per Group)
Type ofCare
Mean Cost PerCounseling
Hour
Mean ClientGroup
Attendance
Mean Cost PerGroup
CounselingHour Per Client
SE of the Meanfor Cost Per
GroupCounseling
Hour Per ClientCV of theMean, %
OutpatientNon-methadone(n = 215 ) $75.65 9.57 $7.90 $0.59 7%
Table 4.4 shows the mean cost per counseling hour for outpatient nonmethadonefacilities (n = 215) as $75.65, with a minimum of $20.24 and a maximum of $334.30. Thestandard error of the mean was $3.53, and the coefficient of variation was 5 percent. Table 4.5again displays the mean cost per counseling hour as $75.65, but additionally provides the meanclient group attendance of 9.57. Subsequently, the mean cost per group counseling hour perclient was calculated to be $7.90, with a standard error of the mean of $0.59 and coefficient ofvariation of 7 percent.
A series of personnel-level data analyses produced mean fringe benefit rates by type ofcare and ownership, mean hourly personnel rates by staffing category, and mean proportion ofpersonnel costs to total facility costs by type of care and type of ownership. Additional analyseswere conducted of the mean proportion of personnel costs by aggregate staffing category and bytype of care.
Table 4.6 presents the mean fringe benefit rates, along with a standard error of the mean,and the coefficient of variation by type of care and type of ownership. The mean fringe benefitrate was 23 percent for nonhospital residential facilities, 20 percent for outpatient methadone,and 18 percent for outpatient nonmethadone. The mean fringe benefit rate for public facilitieswas 21 percent, 14 percent for private for-profit, and 21 percent for private nonprofit facilities.
23
3 2
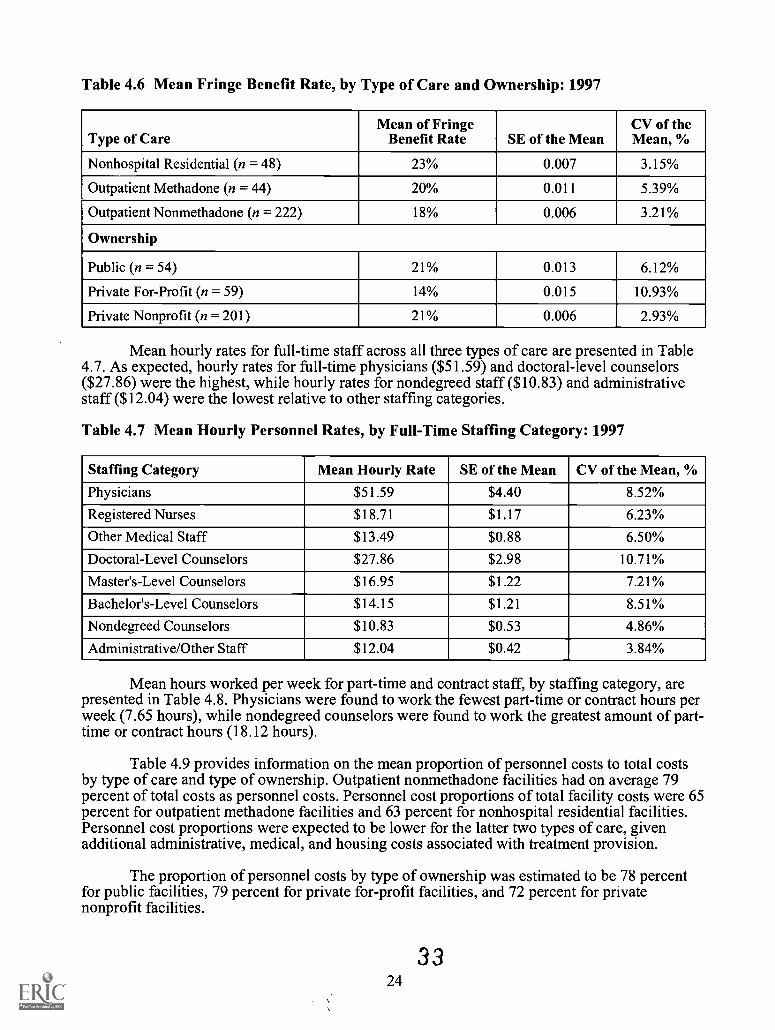
Table 4.6 Mean Fringe Benefit Rate, by Type of Care and Ownership: 1997
Type of CareMean of Fringe
Benefit Rate SE of the MeanCV of theMean, %
Nonhospital Residential (n = 48) 23% 0.007 3.15%
Outpatient Methadone (n = 44) 20% 0.011 5.39%
Outpatient Nonmethadone (n = 222) 18% 0.006 3.21%
Ownership
Public (n = 54) 21% 0.013 6.12%
Private For-Profit (n = 59) 14% 0.015 10.93%
Private Nonprofit (n = 201) 21% 0.006 2.93%
Mean hourly rates for full-time staff across all three types of care are presented in Table4.7. As expected, hourly rates for full-time physicians ($51.59) and doctoral-level counselors($27.86) were the highest, while hourly rates for nondegreed staff ($10.83) and administrativestaff ($12.04) were the lowest relative to other staffing categories.
Table 4.7 Mean Hourly Personnel Rates, by Full-Time Staffing Category: 1997
Staffing Category Mean Hourly Rate SE of the Mean CV of the Mean, %
Physicians $51.59 $4.40 8.52%
Registered Nurses $18.71 $1.17 6.23%
Other Medical Staff $13.49 $0.88 6.50%
Doctoral-Level Counselors $27.86 $2.98 10.71%
Master's-Level Counselors $16.95 $1.22 7.21%
Bachelor's-Level Counselors $14.15 $1.21 8.51%
Nondegreed Counselors $10.83 $0.53 4.86%
Administrative/Other Staff $12.04 $0.42 3.84%
Mean hours worked per week for part-time and contract staff, by staffing category, arepresented in Table 4.8. Physicians were found to work the fewest part-time or contract hours perweek (7.65 hours), while nondegreed counselors were found to work the greatest amount of part-time or contract hours (18.12 hours).
Table 4.9 provides information on the mean proportion of personnel costs to total costsby type of care and type of ownership. Outpatient nonmethadone facilities had on average 79percent of total costs as personnel costs. Personnel cost proportions of total facility costs were 65percent for outpatient methadone facilities and 63 percent for nonhospital residential facilities.Personnel cost proportions were expected to be lower for the latter two types of care, givenadditional administrative, medical, and housing costs associated with treatment provision.
The proportion of personnel costs by type of ownership was estimated to be 78 percentfor public facilities, 79 percent for private for-profit facilities, and 72 percent for privatenonprofit facilities.
3324
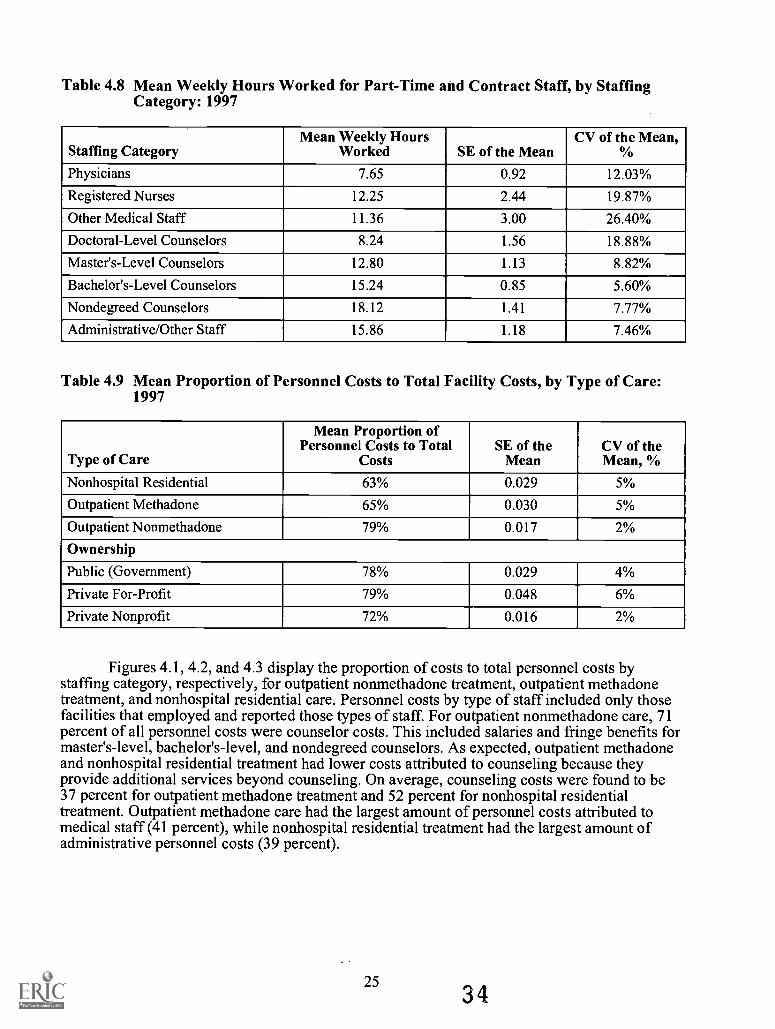
Table 4.8 Mean Weekly Hours Worked for Part-Time and Contract Staff, by StaffingCategory: 1997
Staffing CategoryMean Weekly Hours
Worked SE of the MeanCV of the Mean,
%
Physicians 7.65 0.92 12.03%
Registered Nurses 12.25 2.44 19.87%
Other Medical Staff 11.36 3.00 26.40%
Doctoral-Level Counselors 8.24 1.56 18.88%
Master's-Level Counselors 12.80 1.13 8.82%
Bachelor's-Level Counselors 15.24 0.85 5.60%
Nondegreed Counselors 18.12 1.41 7.77%
Administrative/Other Staff 15.86 1.18 7.46%
Table 4.9 Mean Proportion of Personnel Costs to Total Facility Costs, by Type of Care:1997
Type of Care
Mean Proportion ofPersonnel Costs to Total
CostsSE of the
MeanCV of theMean, %
Nonhospital Residential 63% 0.029 5%
Outpatient Methadone 65% 0.030 5%
Outpatient Nonmethadone 79% 0.017 2%
Ownership
Public (Government) 78% 0.029 4%
Private For-Profit 79% 0.048 6%
Private Nonprofit 72% 0.016 2%
Figures 4.1, 4.2, and 4.3 display the proportion of costs to total personnel costs bystaffing category, respectively, for outpatient nonmethadone treatment, outpatient methadonetreatment, and nonhospital residential care. Personnel costs by type of staff included only thosefacilities that employed and reported those types of staff For outpatient nonmethadone care, 71percent of all personnel costs were counselor costs. This included salaries and fringe benefits formaster's-level, bachelor's-level, and nondegreed counselors. As expected, outpatient methadoneand nonhospital residential treatment had lower costs attributed to counseling because theyprovide additional services beyond counseling. On average, counseling costs were found to be37 percent for outpatient methadone treatment and 52 percent for nonhospital residentialtreatment. Outpatient methadone care had the largest amount of personnel costs attributed tomedical staff (41 percent), while nonhospital residential treatment had the largest amount ofadministrative personnel costs (39 percent).
253 4
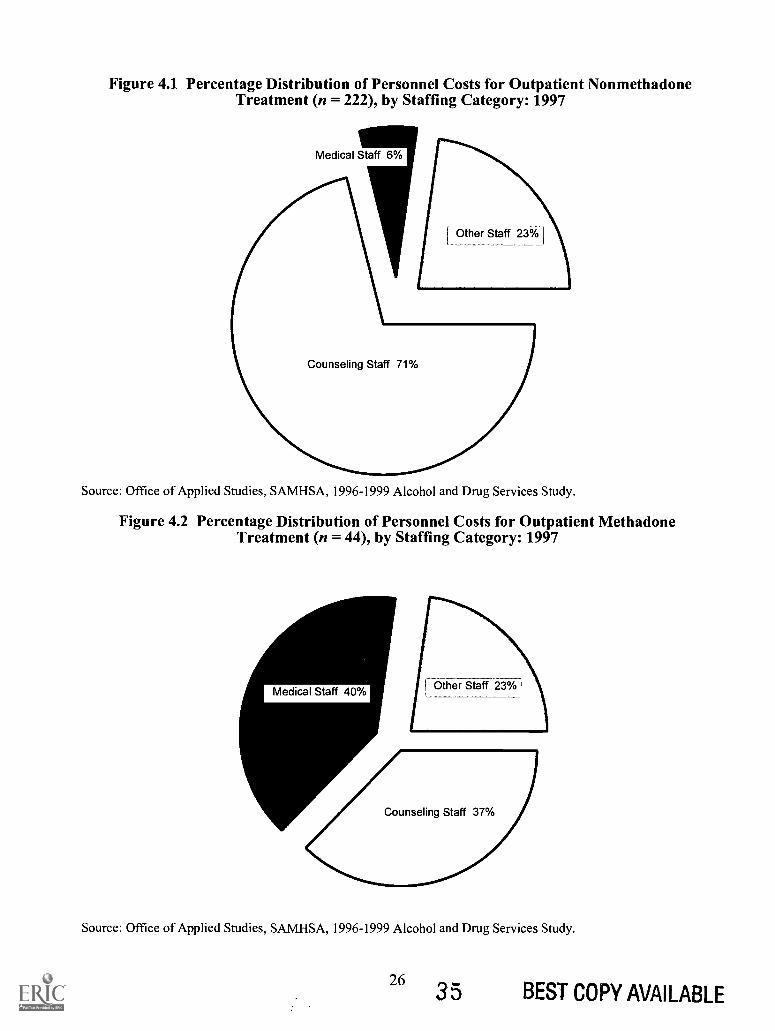
Figure 4.1 Percentage Distribution of Personnel Costs for Outpatient NonmethadoneTreatment (n = 222), by Staffing Category: 1997
Medical Staff 6%
Source: Office of Applied Studies, SAMHSA, 1996-1999 Alcohol and Drug Services Study.
Figure 4.2 Percentage Distribution of Personnel Costs for Outpatient MethadoneTreatment (n = 44), by Staffing Category: 1997
Source: Office of Applied Studies, SAMHSA, 1996-1999 Alcohol and Drug Services Study.
26 35 BEST COPY AVAILABLE
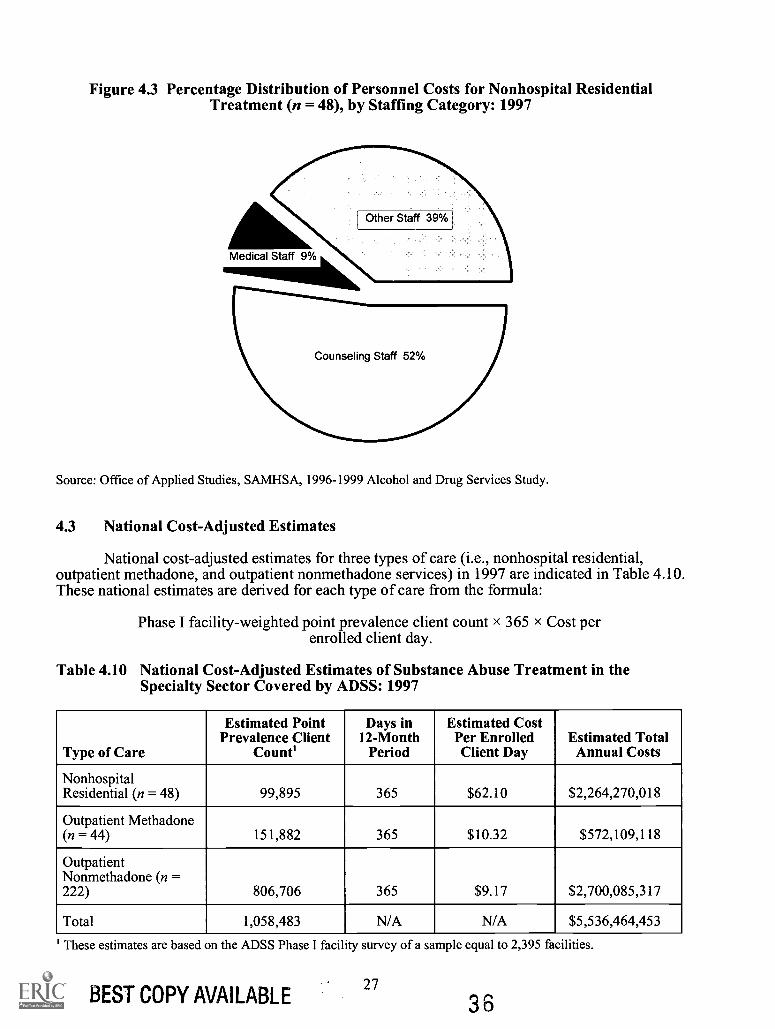
Figure 4.3 Percentage Distribution of Personnel Costs for Nonhospital ResidentialTreatment (n = 48), by Staffing Category: 1997
Source: Office of Applied Studies, SAMHSA, 1996-1999 Alcohol and Drug Services Study.
4.3 National Cost-Adjusted Estimates
National cost-adjusted estimates for three types of care (i.e., nonhospital residential,outpatient methadone, and outpatient nonmethadone services) in 1997 are indicated in Table 4.10.These national estimates are derived for each type of care from the formula:
Phase I facility-weighted point prevalence client count x 365 x Cost perenrolled client day.
Table 4.10 National Cost-Adjusted Estimates of Substance Abuse Treatment in theSpecialty Sector Covered by ADSS: 1997
Type of Care
Estimated PointPrevalence Client
Count'
Days in12-Month
Period
Estimated CostPer EnrolledClient Day
Estimated TotalAnnual Costs
NonhospitalResidential (n = 48) 99,895 365 $62.10 $2,264,270,018
Outpatient Methadone(n = 44) 151,882 365 $10.32 $572,109,118
OutpatientNonmethadone (n =222) 806,706 365 $9.17 $2,700,085,317
Total 1,058,483 N/A N/A $5,536,464,453
' These estimates are based on the ADSS Phase I facility survey of a sample equal to 2,395 facilities.
BEST COPY AVAILABLE27
3 6

For nonhospital residential care in the specialty sector, the national cost estimate ofsubstance abuse treatment was $2.3 billion. For outpatient methadone care in the specialty sector,the national cost estimate of substance abuse treatment was $0.6 billion. For outpatientnonmethadone treatment in the specialty sector, the national cost estimate of substance abusetreatment was $2.7 billion. The total cost of these three modalities in the specialty sector wasestimated to be $5.5 billion.
3 728
5. Discussion and Conclusions
The ADSS cost study is believed to be the first study of treatment costs with validatedcost data from a nationally representative sample of substance abuse treatment facilities. It buildson previous studies that have each contained some but not all of the elements of this study. Oneimportant group of previous studies (DATCAP) (French et al., 1997) was based on careful,systematic procedures for collecting cost data based on principles of economics. The CCC (1993)study and the Treatment Outcome Prospective Study (TOPS) (Hubbard et al., 1989) appliedsystematic data collection based on accounting principles. In neither case, however, were themethods applied to a representative random sample of facilities.
The ADSS cost study supports other studies that have found that nonmethadone outpatienttreatment is substantially less expensive than residential treatment. The cost study found that themean cost of a nonmethadone outpatient admission was only a third of the mean cost of anonhospital residential admission ($1,169 vs. $3,132). In terms of cost per enrolled client day, thelower cost of nonmethadone outpatient care was even more dramaticonly one seventh of thecost of a nonhospital residential day ($9.17 vs. $62.10). The ADSS cost study found that the costper enrolled client day in outpatient methadone care ($10.32) was only marginally higher than thecost per enrolled client day in nonmethadone outpatient care ($9.17).
One of the most important conclusions from the ADSS cost study was the variability inunit costs within a type of care. The variations in totals, such as cost or revenue per facility, werenot surprising. These magnitudes depended on the size of the facility. Other data in ADSS,particularly the point prevalence client count, showed the extent of such variation. However,within a type of care, the cost per admission would be expected to exhibit only moderatevariation, and cost per enrollment day would be expected to show little variation. In fact, bothvariations proved to be relatively large.
The smallest element of cost was the cost per enrollment day. The coefficients of variationof the means for nonhospital residential, outpatient methadone, and nonmethadone outpatientwere 11 percent, 9 percent, and 8 percent, respectively. Multiplying each of these coefficients bythe square roots of the respective sample sizes, approximate coefficients of variation of the costper day were obtained: 74 percent, 101 percent, and 372 percent, respectively. Although a moreprecise estimate of the coefficient of variation would need to take the multistage sampling intoaccount, these approximations indicate the relative variations among the three types of care.
Although comparison with other studies would be of interest, the estimates from theADSS cost study are not directly comparable with those from similar studies because ofdifferences in methods, variables, and national representation. For example, the Substance Abuseand Mental Health Services Administration (SAMHSA) spending estimates study also reportedaggregate national spending (Mark et al., 2000). However, that study covered more types of care(such as treatment in inpatient hospitals, in the general medical sector, and retail prescriptiondrugs) than the ADSS cost study, which covered only outpatient and residential specialtysubstance abuse treatment facilities. Thus, the amount reported in SAMHSA's spending estimatesstudy for 1997 ($11.9 billion) substantially exceeded the aggregate in the ADSS cost study ($5.5billion). When one excludes services not counted in ADSS (hospital-based services, independentpractitioners, retail prescription drugs, and insurance administration), the remaining componentsof the spending estimates study that approximated the ADSS cost study (termed "other") aresimilar to the ADSS cost study. Their magnitude for 1997 ($5.3 billion) is similar to the amountfor the ADSS cost study ($5.5 billion). Other studies, such as those conducted by CCC or TOPS,are not based on national probability samples and are therefore not directly comparable with thosederived in the ADSS cost study.
29 38
References
Capital Consulting Corporation. (1993). Uniform system of accounting and cost reporting forsubstance abuse treatment providers (Contract No. SAMHSA 270-91-8327). Fairfax, VA:Author.
French, M. T., Dunlap, L. J., Zarkin, G. A., McGeary, K. A., & McLellan, A. T. (1997). Astructured instrument for estimating the economic cost of drug abuse treatment: The Drug AbuseTreatment Cost Analysis Program (DATCAP). Journal of Substance Abuse Treatment, 14,445-455.
Hubbard, R. L., Marsden, M. E., Rachal, J. V., Harwood, H. J., Cavanaugh, E. R., & Ginzburg, H.M. (1989). Drug abuse treatment: A national study of effectiveness. Chapel Hill, NC: Universityof North Carolina Press.
Mark, T. L., Coffey, R. M., King, E., Harwood, H., McKusick, D., Genuardi, J., Dilonardo, J., &Buck, J. A. (2000). Spending on mental health and substance abuse treatment, 1987-1997. HealthAffairs (Millwood), 19(4), 108-120.
RTI. (2001). SUDAAN user's manual: Release 8.0. Research Triangle Park, NC: Author.
Zarkin, G. A., Galinis, D. N., French, M. T., Fountain, D. L., Ingram, P. W., & Guyett, J. A.(1995). Financing strategies for drug abuse treatment programs. Journal of Substance AbuseTreatment, 12, 385-399.
31 3 9
The ADSS Cost Study: Costs of SubstanceAbuse Treatment in the Specialty Sector
Appendices
33 4 0
Appendix A
Data Review WorksheetADSS
35 4 1
Appendix A - Data ReviewWorksheet - ADSS -
Instructions
This Data Review Worksheet is a series of linked spreadsheets. There are five that require entry. Theseare labeled as:InstructionsTwolTwo2Two3One
Hence, the name implies the source document from which the source input data is recordedThe remaining six pages of spreadsheets are the actual cost report, which is locked, andrequires no input. These spreadsheets should be printed & reviewed after all data is inputted
The Phase I survey instrument is titled: A. Facility Organization and Staffing (legal size)The Phase II survey instrument is titled: Date of Interview and begins with page 2
In some cases, there are no identified input fields, such asfacility ID number, andsurvey date, facility type and setting. Use the F - 2 key to edit these fields.1. Obtain the Facility ID from the - Facility Information Sheet2. Obtain Survey Date from Phase II top right corner Date of Interview3. The Facility Type is from Phase II Question 24. The Setting is from Phase I - A5, please indicate in the space corresponding with facility type
Facili0 ID: 0000Survey Date: _00 / 00 / 97
1. Facility Type:( ) Hospital Inpatient( ) Non-Hosp Residential( ) Outpatient - Methadone( ) Outpatient - Non Methadone
Preparer's Initial (Below):
Date of Preparation (below):
Sources (SC2PO=Prov OriginalPR=Prov RevisedIE=Internal EstimateEE=External Estimate
Setting (A5):
37 4 2
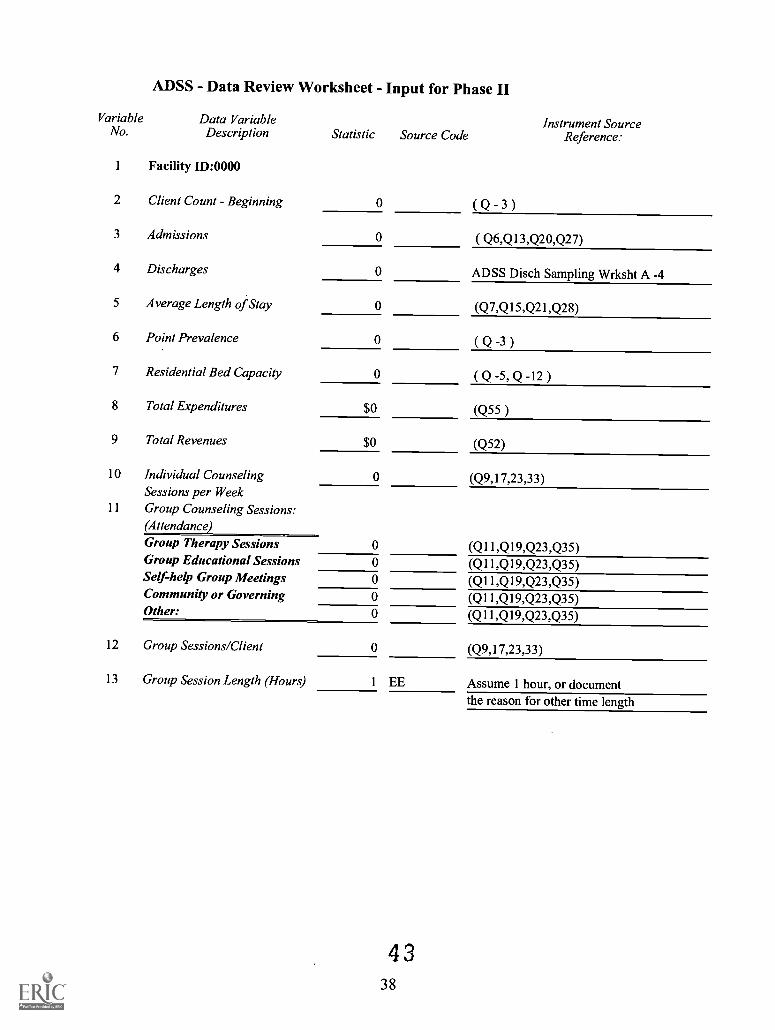
ADSS - Data Review Worksheet - Input for Phase II
VariableNo.
1
2
Data VariableDescription
Facility ID:0000
Client Count - Beginning
Statistic
0
Source CodeInstrument Source
Reference:
( Q 3 )
3 Admissions 0 ( Q6,Q13,Q20,Q27)
4 Discharges 0 ADSS Disch Sampling Wrksht A -4
5 Average Length of Stay 0 (Q7,Q15,Q21,Q28)
6 Point Prevalence 0 Q -3 )
7 Residential Bed Capacity 0 (Q-5,Q-12 )
8 Total Expenditures $0 (Q55 )
9 Total Revenues $0 (Q52)
10 Individual Counseling 0 (Q9,17,23,33)Sessions per Week
11 Group Counseling Sessions:(Attendance)Group Therapy Sessions 0 (Q11,Q19,Q23,Q35)Group Educational Sessions 0 (Q11,Q19,Q23,Q35)Self-help Group Meetings 0 (Q11,Q19,Q23,Q35)Community or Governing 0 (Q11,Q19,Q23,Q35)Other: 0 (Q11,Q19,Q23,Q35)
12 Group Sessions/Client 0 (Q9,17,23,33)
13 Group Session Length (Hours) 1 EE Assume 1 hour, or documentthe reason for other time length
4 338
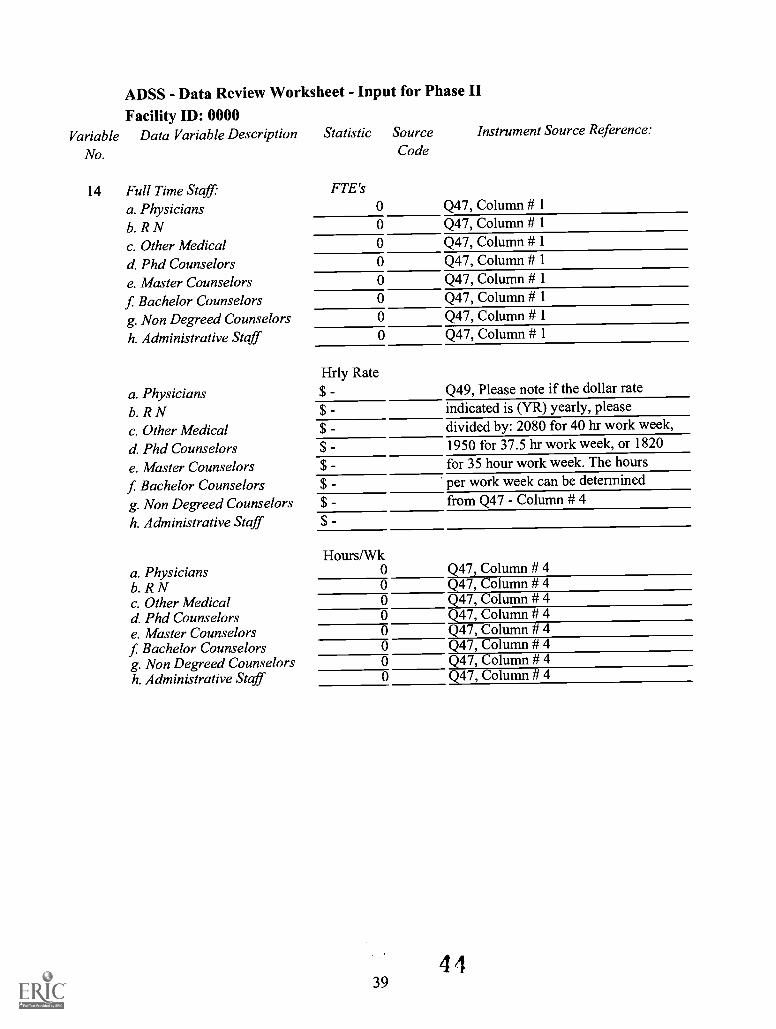
ADSS - Data Review Worksheet - Input for Phase II
Facility ID: 0000Variable Data Variable Description Statistic Source Instrument Source Reference:
No. Code
14 Full Time Staffa. Physiciansb. R Nc. Other Medicald. Phd Counselorse. Master Counselorsf Bachelor Counselorsg. Non Degreed Counselorsh. Administrative Staff
a. Physiciansb. R Nc. Other Medicald Phd Counselorse. Master Counselorsf Bachelor Counselorsg. Non Degreed Counselorsh. Administrative Staff
a. Physiciansb. R Nc. Other Medicald Phd Counselorse. Master Counselorsf Bachelor Counselorsg. Non Degreed Counselorsh. Administrative Staff
FTE's00000000
Hrly Rate$ -$ -$ -$
$
$
$
$
Q47, Column # 1Q47, Column # 1Q47, Column # 1Q47, Column # 1Q47, Column # 1Q47, Column # 1Q47, Column # 1Q47, Column # 1
Q49, Please note if the dollar rateindicated is (YR) yearly, pleasedivided by: 2080 for 40 hr work week,1950 for 37.5 hr work week, or 1820for 35 hour work week. The hoursper work week can be determinedfrom Q47 - Column # 4
Hours/Wk00000000
Q47, Column # 4Q47, Column # 4Q47, Column # 4Q47, Column # 4Q47, Column # 4Q47, Column # 4Q47, Column # 4Q47, Column # 4
394 4
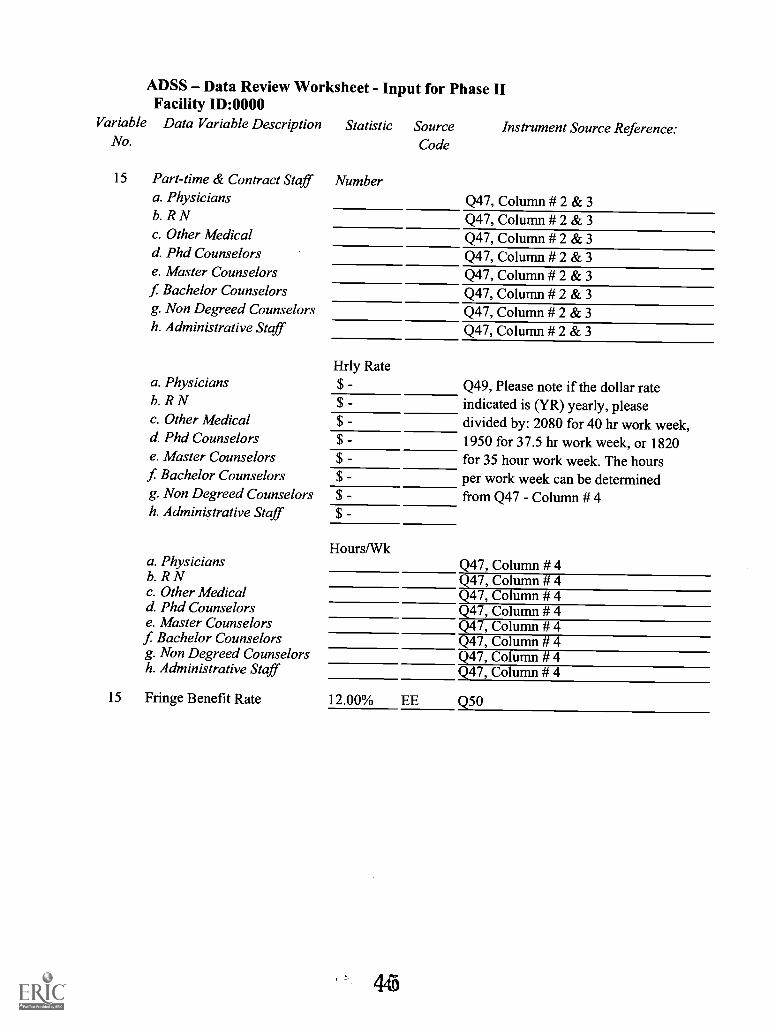
ADSS Data Review Worksheet - Input for Phase IIFacility ID:0000
Variable Data Variable DescriptionNo.
15 Part-time & Contract Staffa. Physiciansb. R Nc. Other Medicald. Phd Counselorse. Master Counselorsf Bachelor Counselorsg. Non Degreed Counselorsh. Administrative Staff
a. Physiciansb. R Nc. Other Medicald. Phd Counselorse. Master Counselors
f Bachelor Counselorsg. Non Degreed Counselorsh. Administrative Staff
a. Physiciansb. R Nc. Other Medicald. Phd Counselorse. Master Counselorsf Bachelor Counselorsg. Non Degreed Counselorsh. Administrative Staff
Statistic Source Instrument Source Reference:Code
Number
Q47, Column # 2 & 3Q47, Column # 2 & 3
Q47, Column # 2 & 3
Q47, Column # 2 & 3
Q47, Column # 2 & 3
Q47, Column # 2 & 3
Q47, Column # 2 & 3
Q47, Column # 2 & 3
Hrly Rate$ -$ -$ -$
$$
$
$
Hours/Wk
Q49, Please note if the dollar rateindicated is (YR) yearly, pleasedivided by: 2080 for 40 hr work week,1950 for 37.5 hr work week, or 1820for 35 hour work week. The hoursper work week can be determinedfrom Q47 - Column # 4
Q47, Column # 4Q47, Column # 4Q47, Column # 4Q47, Column # 4Q47, Column # 4Q47, Column # 4Q47, Column # 4Q47, Column # 4
15 Fringe Benefit Rate 12.00% EE Q50
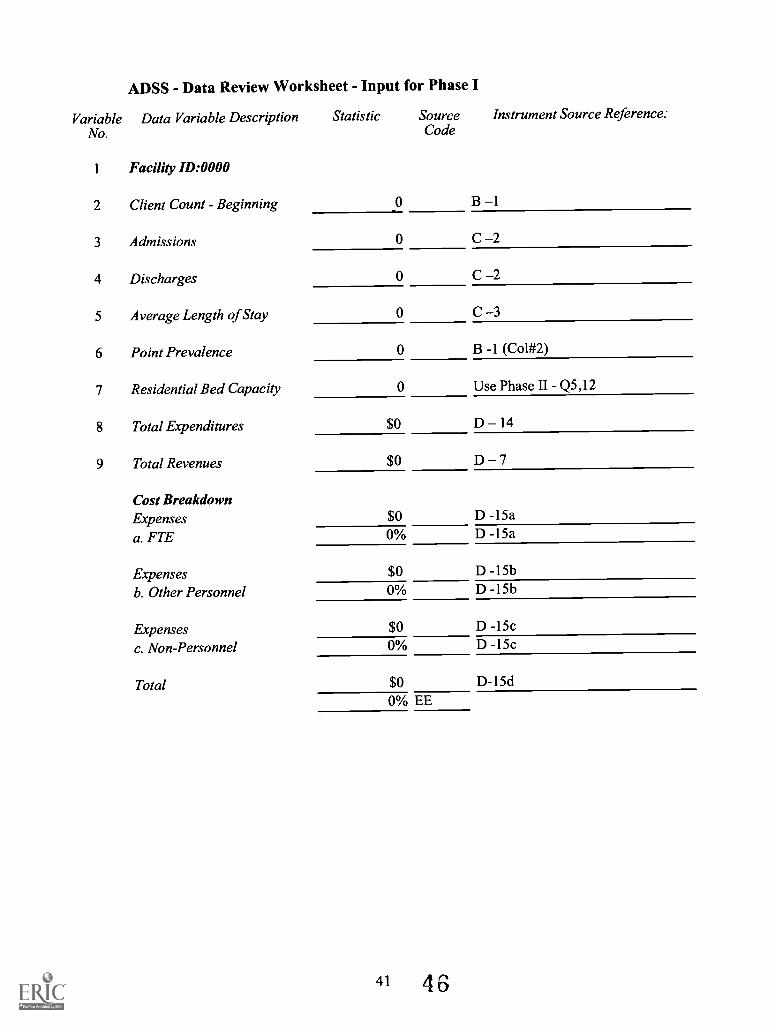
VariableNo.
1
ADSS - Data Review Worksheet - Input for Phase I
Data Variable Description Statistic Source Instrument Source Reference:Code
Facility ID:0000
2 Client Count - Beginning 0 B 1
3 Admissions 0 C 2
4 Discharges 0 C 2
5 Average Length of Stay 0 C 3
6 Point Prevalence 0 B -1 (Col#2)
7 Residential Bed Capacity 0 Use Phase II Q5,12
8 Total Expenditures $0 D 14
9 Total Revenues $0 D 7
Cost BreakdownExpenses $0 D -15a
a. FTE 0% D -15a
Expenses $0 D -15b
b. Other Personnel 0% D -15b
Expenses $0 D -15c
c. Non-Personnel 0% D -15c
Total $0 D-15d0% EE
41 4 6
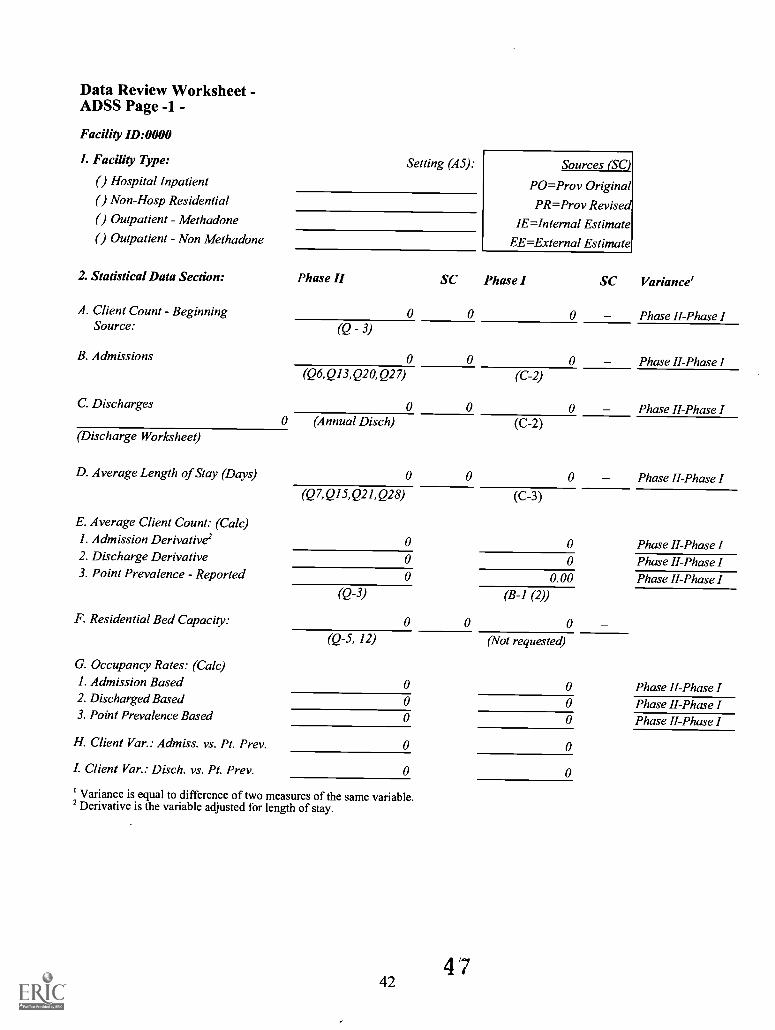
Data Review Worksheet -ADSS Page -1 -
Facility ID:0000
I. Facility Type:
( ) Hospital Inpatient
( ) Non-Hosp Residential
( ) Outpatient - Methadone
( ) Outpatient - Non Methadone
Setting (A5): Sources (SC)
PO=Prov OriginalPR=Prov Revised
IE=Internal Estimate
EE=External Estimate
2. Statistical Data Section: Phase II SC Phase I SC Variance'
A. Client Count Beginning 0 0 Phase II-Phase ISource:
B. Admissions 0 0 Phase II-Phase I(Q6,Q13,Q20,Q27) (C-2)
C. Discharges 0 0 Phase II-Phase I0 (Annual Disch) (C-2)
(Discharge Worksheet)
D. Average Length of Stay (Days) 0 0 0 Phase II-Phase I(Q7,Q15,Q21,Q28) (C-3)
E. Average Client Count: (Calc)1. Admission Derivative2 0 0 Phase II-Phase I2. Discharge Derivative 0 0 Phase II-Phase I3. Point Prevalence - Reported 0 0.00 Phase II-Phase I
(Q-3) (B-1 (2))
F. Residential Bed Capacity: 0 0(Q-5, 12) (Not requested)
G. Occupancy Rates: (Calc)1. Admission Based2. Discharged Based3. Point Prevalence Based
H. Client Var.: Admiss. vs. Pt. Prey.
I. Client Var.: Disch. vs. Pt. Prey.
' Variance is equal to difference of two measures of the same variable.2 Derivative is the variable adjusted for length ofstay.
4 742
0
Phase II-Phase IPhase II-Phase IPhase II-Phase I
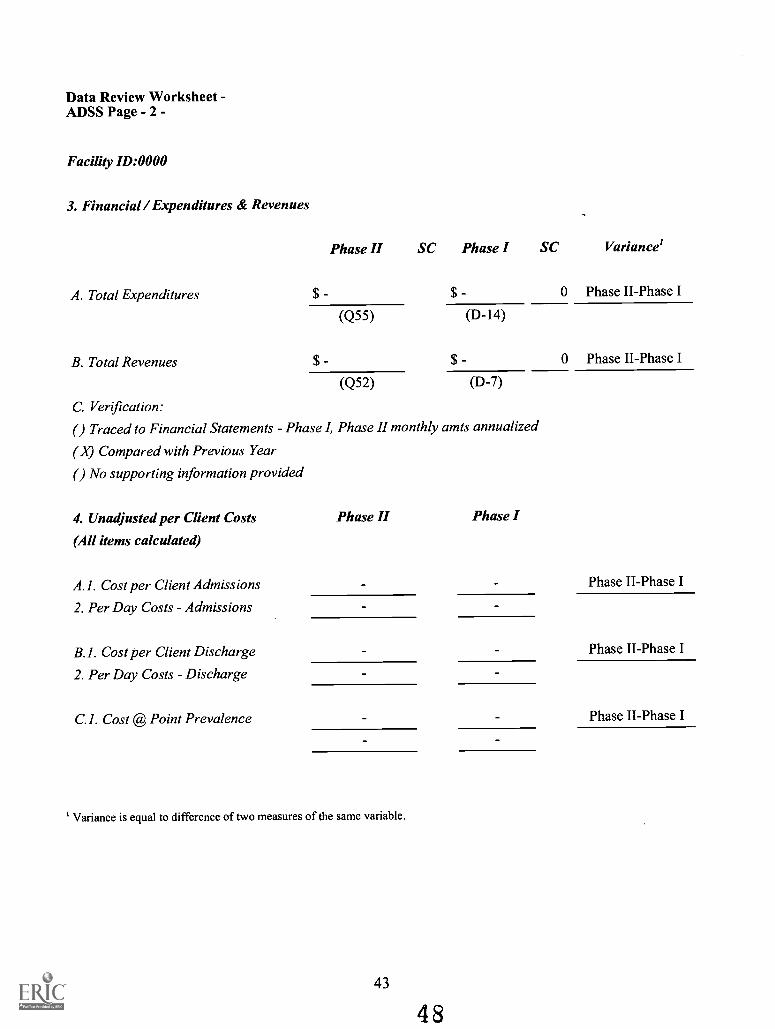
Data Review Worksheet -ADSS Page - 2 -
Facility ID:0000
3. Financial / Expenditures & Revenues
Phase II SC Phase I SC Variance'
A. Total Expenditures $ - $ - 0 Phase II-Phase I
(Q55) (D-14)
B. Total Revenues $ - $ - 0 Phase II-Phase I
(Q52) (D-7)
C. Verification:
( ) Traced to Financial Statements Phase I, Phase II monthly amts annualized
( X) Compared with Previous Year
( ) No supporting information provided
4. Unadjusted per Client Costs
(All items calculated)
Phase II Phase I
A.I . Cost per Client Admissions Phase II-Phase I
2. Per Day Costs Admissions
B.I . Cost per Client Discharge Phase II-Phase I
2. Per Day Costs - Discharge
C.I. Cost @ Point Prevalence Phase II-Phase I
' Variance is equal to difference of two measures of the same variable.
43
4 8
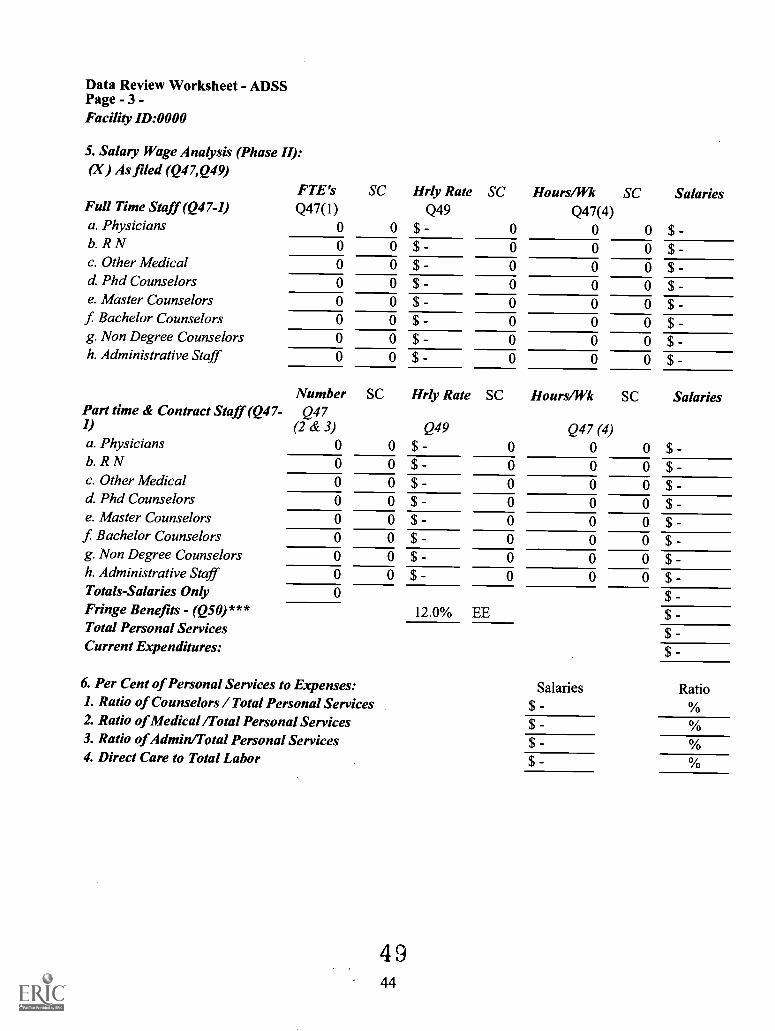
Data Review Worksheet - ADSSPage - 3 -Facility ID:0000
5. Salary Wage Analysis (Phase II):(X) As filed (Q47,Q49)
Full Time Staff (Q47-1)a. Physiciansb. R Nc. Other Medicald. Phd Counselorse. Master Counselors
f Bachelor Counselorsg. Non Degree Counselorsh. Administrative Staff
Part time & Contract Staff (Q47-I)a. Physiciansb. R Nc. Other Medicald. Phd Counselorse. Master Counselorsf Bachelor Counselorsg. Non Degree Counselorsh. Administrative StaffTotals-Salaries OnlyFringe Benefits - (Q50)***Total Personal ServicesCurrent Expenditures:
FTE'sQ47(1)
0
SC
0
Hrly RateQ49
$
SC
0
Hours/WkQ47(4)
0
SC
0
Salaries
$0 0 $ - 0 0 0 $ -0 0 $ 0 0 0 $0 0 $ - 0 0 0 $ -0 0 $ - 0 0 0 $ -0 0 $ - 0 0 0 $ -0 0 $ - 0 0 0 $ -0 0 $ - 0 0 0 $ -
NumberQ47
(2 & 3)0
SC
0
Hrly Rate
Q49$ -
SC
0
Hours/Wk
Q47 (4)0
SC
0
Salaries
$ -0 0 $ - 0 0 0 $ -0 0 $ - 0 0 0 $ -0 0 $ 0 0 0 $ -0 0 $ 0 0 0 $0 0 $ - 0 0 0 $ -0 0 $ - 0 0 0 $ -0 0 $ - 0 0 0 $ -0
12.0% EE$ -$ -$ -$
6. Per Cent of Personal Services to Expenses: Salaries Ratio1. Ratio of Counselors / Total Personal Services $ %2. Ratio of Medical /Total Personal Services $ %3. Ratio of Admin/Total Personal Services $ %4. Direct Care to Total Labor $ %
4 944
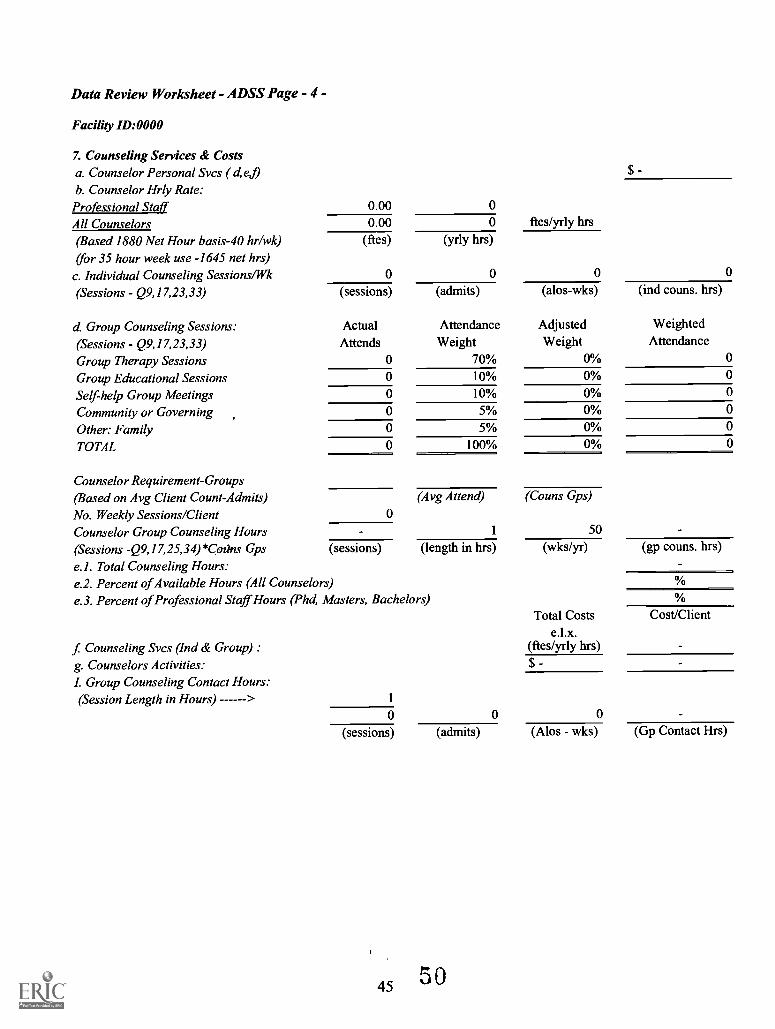
Data Review Worksheet - ADSS Page - 4 -
Facility ID:0000
7. Counseling Services & Costsa. Counselor Personal Svcs ( d,ef)b. Counselor Hrly Rate:
Professional Staff 0.00 0
All Counselors 0.00 0 ftes/yrly hrs
(Based 1880 Net Hour basis-40 hr/wk)(for 35 hour week use -1645 net hrs)c. Individual Counseling Sessions/Wk
(ftes)
0
(yrly hrs)
0 0 0
(Sessions - Q9,17,23,33) (sessions) (admits) (alos-wks) (ind couns. hrs)
d Group Counseling Sessions: Actual Attendance Adjusted Weighted
(Sessions - Q9,17,23,33) Attends Weight Weight Attendance
Group Therapy Sessions 0 70% 0% 0
Group Educational Sessions 0 10% 0% 0
Self-help Group Meetings 0 10% 0% 0
Community or Governing 0 5% 0% 0
Other: Family 0 5% 0% 0
TOTAL 0 100% 0% 0
Counselor Requirement-Groups(Based on Avg Client Count-Admits) (Avg Attend) (Couns Gps)
No. Weekly Sessions/Client 0
Counselor Group Counseling Hours 1 50
(Sessions -Q9, I 7,25,34)*Codns Gpse. I . Total Counseling Hours:
(sessions) (length in hrs) (wks/yr) (gp couns. hrs)
e.2. Percent of Available Hours (All Counselors)e.3. Percent of Professional Staff Hours (Phd, Masters, Bachelors)
f Counseling Svcs (Ind & Group) :g. Counselors Activities:I. Group Counseling Contact Hours:(Session Length in Hours) 1
Total Costse.l.x.
(ftes/yrly hrs)$ -
Cost/Client
(sessions) (admits) (Alos - wks) (Gp Contact Hrs)
5045
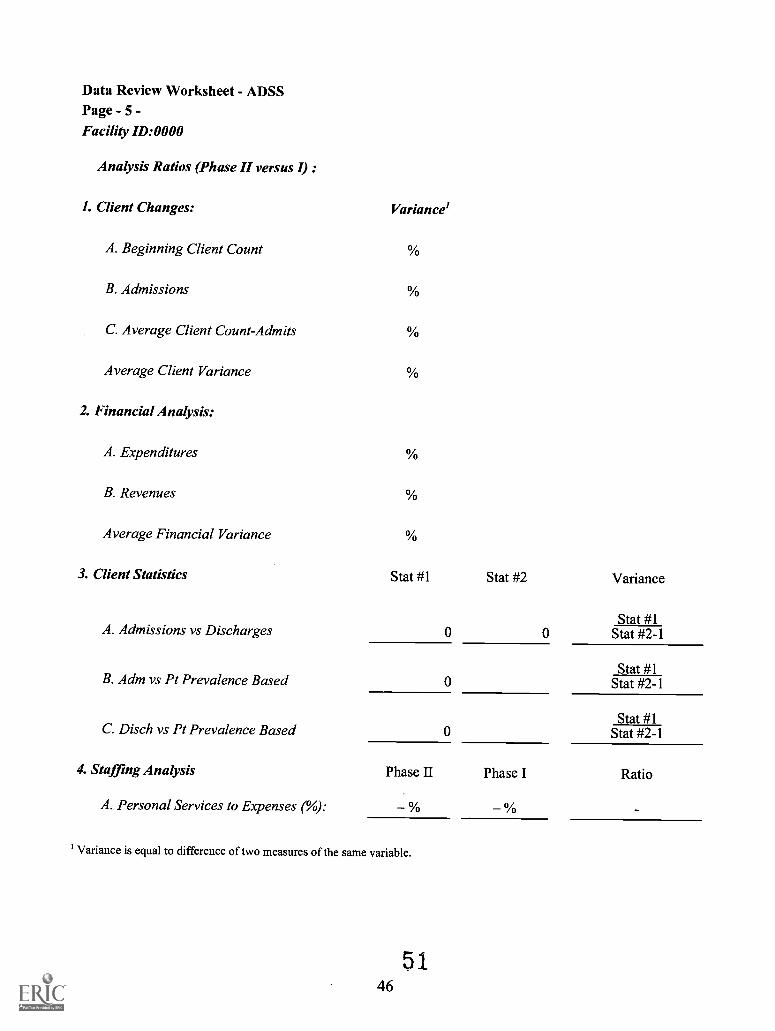
Data Review Worksheet - ADSSPage - 5 -Facility ID:0000
Analysis Ratios (Phase II versus I) :
1. Client Changes: Variance'
A. Beginning Client Count
B. Admissions
C. Average Client Count-Admits
Average Client Variance
2. Financial Analysis:
A. Expenditures
B. Revenues
Average Financial Variance
3. Client Statistics Stat #1 Stat #2 Variance
Stat #1A. Admissions vs Discharges 0 0 Stat #2-1
Stat #1B. Adm vs Pt Prevalence Based 0 Stat #2-1
Stat #1C. Disch vs Pt Prevalence Based 0 Stat #2-1
4. Staffing Analysis Phase II Phase I Ratio
A. Personal Services to Expenses (%): % %
' Variance is equal to difference of two measures of the same variable.
5 146

Appendix B
Phases I and II Questionnaire Data Summary Table
-
47 52
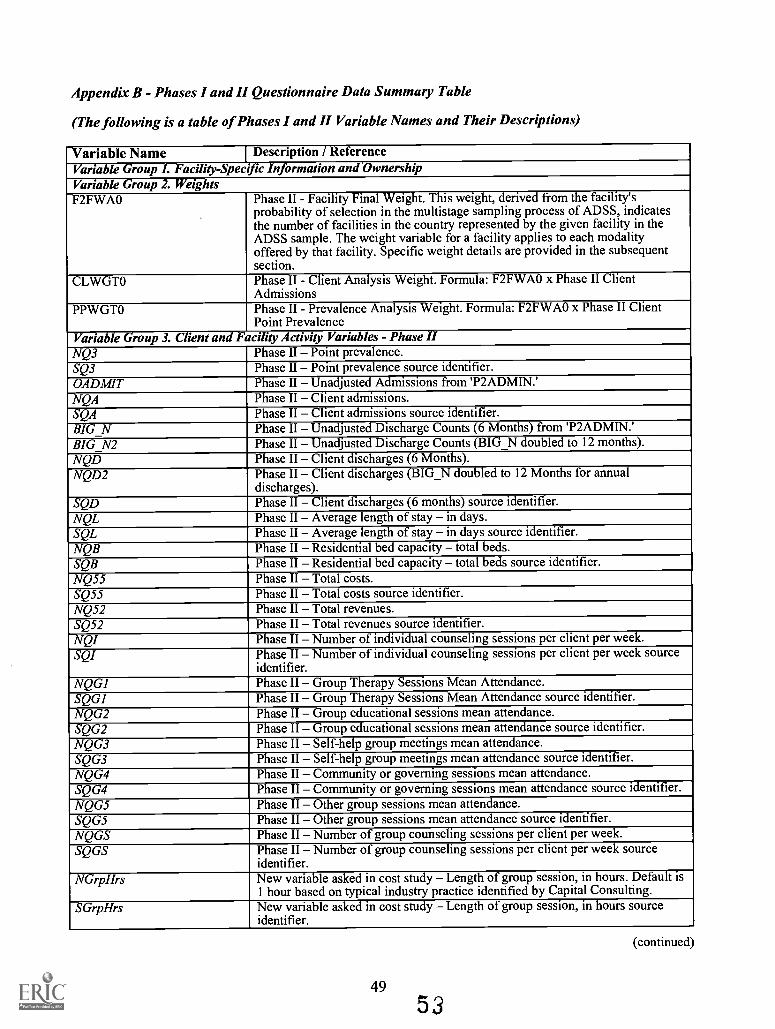
Appendix B - Phases I and II Questionnaire Data Summary Table
(The following is a table of Phases I and II Variable Names and Their Descriptions)
Variable Name I Description / ReferenceVariable Group I. Facility-Specific Information andOwnershipVariable Group 2. WeightsF2FWAO Phase II - Facility Final Weight. This weight, derived from the facility's
probability of selection in the multistage sampling process of ADSS, indicatesthe number of facilities in the country represented by the given facility in theADSS sample. The weight variable for a facility applies to each modalityoffered by that facility. Specific weight details are provided in the subsequentsection.
CLWGTO Phase II - Client Analysis Weight. Formula: F2FWAO x Phase II ClientAdmissions
PPWGTO Phase II - Prevalence Analysis Weight. Formula: F2FWAO x Phase II ClientPoint Prevalence
Variable Group 3. Client and Facility Activity Variables - Phase IINQ3 Phase II Point prevalence.SQ3 Phase II Point prevalence source identifier.OADM1T Phase II Unadjusted Admissions from 'P2ADMIN.'NQA Phase II Client admissions.SQA Phase II Client admissions source identifier.BIG_N Phase II Unadjusted Discharge Counts (6 Months) from 'P2ADMIN.'BIG_N2 Phase II Unadjusted Discharge Counts (BIG_N doubled to 12 months).NQD Phase II Client discharges (6 Months).NQD2 Phase II Client discharges (BIG_N doubled to 12 Months for annual
discharges).SQD Phase II Client discharges (6 months) source identifier.NQL Phase II Average length of stay in days.SQL Phase H Average length of stay in days source identifier.NQB Phase H Residential bed capacity total beds.SQB Phase II Residential bed capacity total beds source identifier.NQ55 Phase II Total costs.SQ55 Phase II Total costs source identifier.NQ52 Phase II Total revenues.SQ52 Phase II Total revenues source identifier.NQI Phase II Number of individual counseling sessions per client per week.SQI Phase II Number of individual counseling sessions per client per week source
identifier.NQG1 Phase II Group Therapy Sessions Mean Attendance.SQG1 Phase II Group Therapy Sessions Mean Attendance source identifier.NQG2 Phase II Group educational sessions mean attendance.SQG2 Phase II Group educational sessions mean attendance source identifier.NQG3 Phase II Self-help group meetings mean attendance.SQG3 Phase II Self-help group meetings mean attendance source identifier.NQG4 Phase II Community or governing sessions mean attendance.SQG4 Phase II Community or governing sessions mean attendance source identifier.NQG5 Phase II Other group sessions mean attendance.SQG5 Phase II Other group sessions mean attendance source identifier.NQGS Phase II Number of group counseling sessions per client per week.SQGS Phase II Number of group counseling sessions per client per week source
identifier.NGrpHrs New variable asked in cost study Length of group session, in hours. Default is
1 hour based on typical industry practice identified by Capital Consulting.SGrpHrs New variable asked in cost study Length of group session, in hours source
identifier.
(continued)
49
53
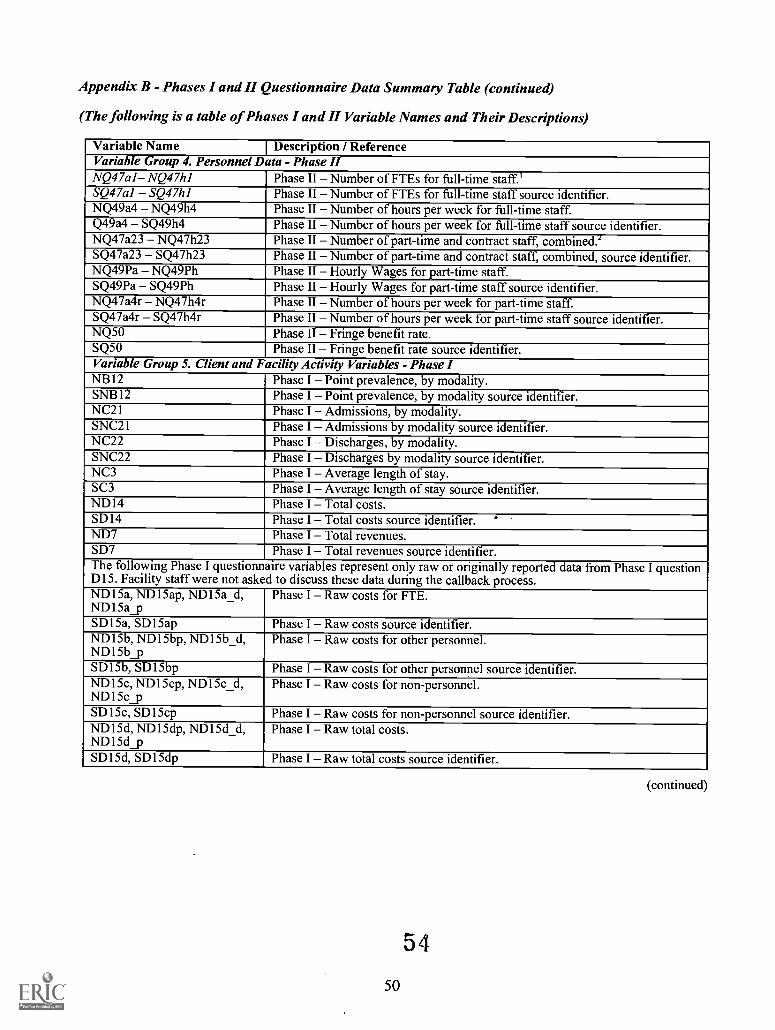
Appendix B - Phases I and II Questionnaire Data Summary Table (continued)
(The following is a table of Phases I and II Variable Names and Their Descriptions)
Variable Name Description / ReferenceVariable Group 4. Personnel Data - Phase IINQ47a1 NQ47h1 Phase II Number of FTEs for full-time staff.'SQ47a1 SQ47h1 Phase II Number of FTEs for full-time staff source identifier.NQ49a4 NQ49h4 Phase II Number of hours per week for full-time staff.Q49a4 SQ49h4 Phase II Number of hours per week for full-time staff source identifier.NQ47a23 NQ47h23 Phase II Number of part-time and contract staff, combined.'SQ47a23 SQ47h23 Phase II Number of part-time and contract staff, combined, source identifier.NQ49Pa NQ49Ph Phase II Hourly Wages for part-time staff.SQ49Pa SQ49Ph Phase II Hourly Wages for part-time staff source identifier.NQ47a4r NQ47h4r Phase II Number of hours per week for part-time staff.SQ47a4r SQ47h4r Phase II Number of hours per week for part-time staff source identifier.NQ50 Phase II Fringe benefit rate.SQ50 Phase II Fringe benefit rate source identifier.Variable Group 5. Client and Facility Activity Variables - Phase INB12 Phase I Point prevalence, by modality.SNB12 Phase I Point prevalence, by modality source identifier.NC21 Phase I Admissions, by modality.SNC21 Phase I Admissions by modality source identifier.NC22 Phase I Discharges, by modality.SNC22 Phase I Discharges by modality source identifier.NC3 Phase I Average length of stay.SC3 Phase I Average length of stay source identifier.ND14 Phase I Total costs.SD14 Phase I Total costs source identifier.ND7 Phase I Total revenues.SD7 Phase I Total revenues source identifier.The following Phase I questionnaire variables represent only raw or originally reported data from Phase I questionDI5. Facility staff were not asked to discuss these data during the callback process.ND15a, ND15ap, ND15a_d,ND15a_p
Phase I Raw costs for FTE.
SD15a, SD15ap Phase I Raw costs source identifier.ND15b, ND15bp, ND15b_d,ND15b_p
Phase I Raw costs for other personnel.
SD 1 5b, SD 1 5bp Phase I Raw costs for other personnel source identifier.ND15c, ND15cp, ND15c_d,ND15c_p
Phase I Raw costs for non-personnel.
SD15c, SD15cp Phase I Raw costs for non-personnel source identifier.ND15d, ND15dp, ND15d_d,ND15d_p
Phase I Raw total costs.
SD15d, SD15dp Phase I Raw total costs source identifier.
54
50
(continued)
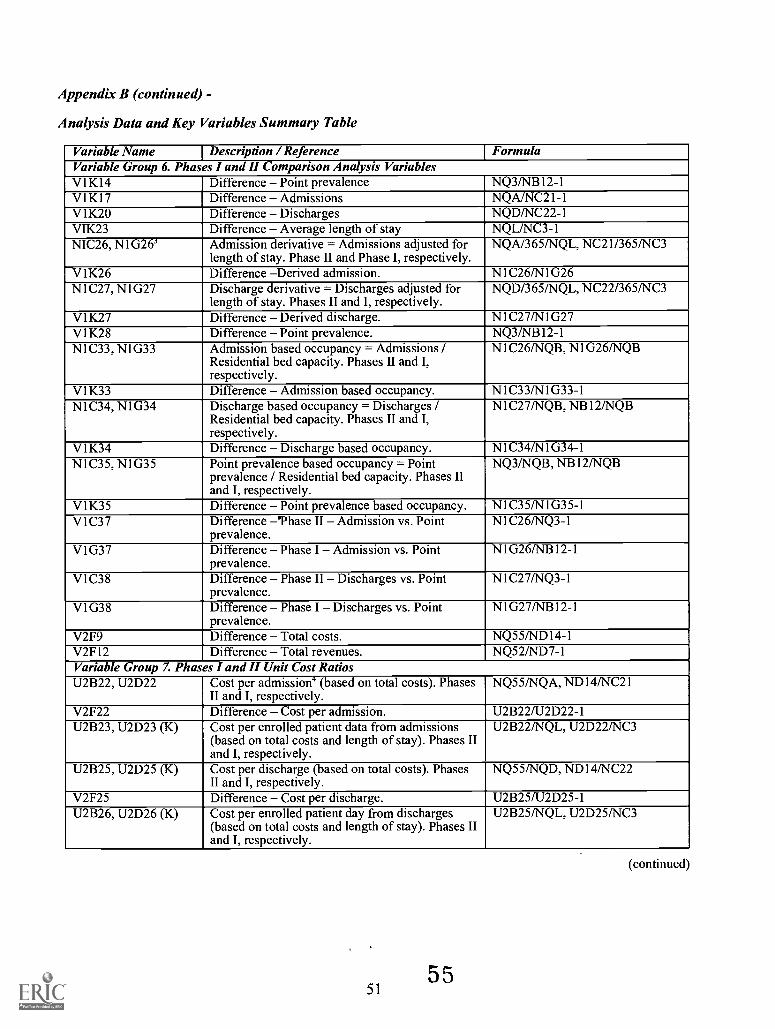
Appendix B (continued) -
Analysis Data and Key Variables Summary Table
Variable Name Description / Reference FormulaVariable Group 6. Phases I and II Comparison Analysis VariablesV1K14 Difference Point prevalence NQ3/NB12-1V1K17 Difference Admissions NQA/NC21-1V1K20 Difference Discharges NQD/NC22-1VIK23 Difference Average length of stay NQL/NC3-1NIC26, N1G263 Admission derivative = Admissions adjusted for
length of stay. Phase II and Phase I, respectively.NQA/365/NQL, NC21/3651NC3
V1K26 Difference Derived admission. N1C26/N1G26N1C27, N1G27 Discharge derivative = Discharges adjusted for
length of stay. Phases II and I, respectively.NQD/365/NQL, NC22/365/NC3
V1K27 Difference Derived discharge. N1C271N1G27V1K28 Difference Point prevalence. NQ3/NB12-1N1C33, N1G33 Admission based occupancy = Admissions /
Residential bed capacity. Phases II and I,respectively.
N1C26/NQB, N1G26/NQB
V1K33 Difference Admission based occupancy. N1C33/N1G33-1N1C34, N1G34 Discharge based occupancy = Discharges /
Residential bed capacity. Phases II and I,respectively.
N1C27/NQB, NB12/NQB
V1K34 Difference Discharge based occupancy. N1C34/N1G34-1N1C35, N1G35 Point prevalence based occupancy = Point
prevalence / Residential bed capacity. Phases IIand I, respectively.
NQ3/NQB, NB12/NQB
V1K35 Difference Point prevalence based occupancy. N1C35/N1G35-1V1C37 Difference 'Phase II Admission vs. Point
prevalence.N1C26/NQ3-1
V1G37 Difference Phase I Admission vs. Pointprevalence.
N1G26/NB12-1
V1C38 Difference Phase II Discharges vs. PointPrevalence.
N1C27/NQ3-1
V1G38 Difference Phase I Discharges vs. PointPrevalence.
N1G27/NB12-1
V2F9 Difference Total costs. NQ55/ND14-1V2F12 Difference Total revenues. NQ52/ND7-1Variable Group 7. Phases I and II Unit Cost RatiosU2B22, U2D22 Cost per admission' (based on total costs). Phases
II and I, respectively.NQ55/NQA, ND14/NC21
V2F22 Difference Cost per admission. U2B221U2D22-1U2B23, U2D23 (K) Cost per enrolled patient data from admissions
(based on total costs and length of stay). Phases IIand I, respectively.
U2B22/NQL, U2D22/NC3
U2B25, U2D25 (K) Cost per discharge (based on total costs). PhasesII and I, respectively.
NQ55/NQD, ND14/NC22
V2F25 Difference Cost per discharge. U2B25/U2D25-1U2B26, U2D26 (K) Cost per enrolled patient day from discharges
(based on total costs and length of stay). Phases IIand I, respectively.
U2B25/NQL, U2D25/NC3
5155
(continued)
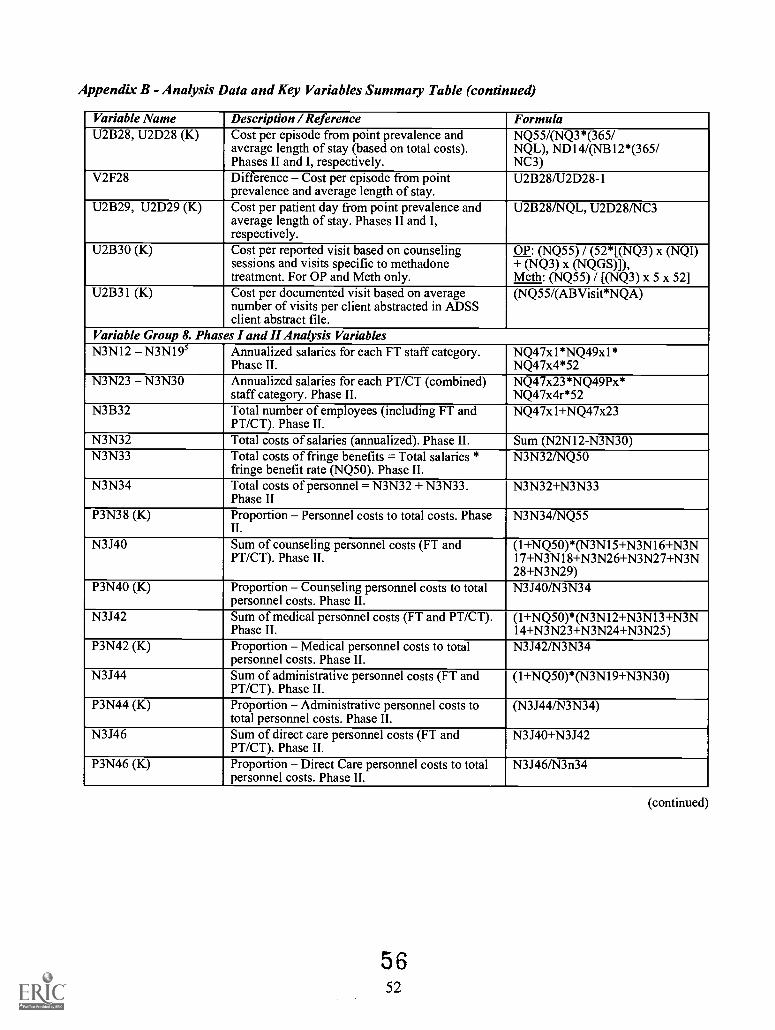
Appendix B - Analysis Data and Key Variables Summary Table (continued)
Variable Name Description / Reference FormulaU2B28, U2D28 (K) Cost per episode from point prevalence and
average length of stay (based on total costs).Phases II and I, respectively.
NQ55/(NQ3*(365/NQL), ND14/(NB12*(365/NC3)
V2F28 Difference Cost per episode from pointprevalence and average length of stay.
U2B28/U2D28-1
U2B29, U2D29 (K) Cost per patient day from point prevalence andaverage length of stay. Phases II and I,respectively.
U2B28/NQL, U2D28/NC3
U2B30 (K) Cost per reported visit based on counselingsessions and visits specific to methadonetreatment. For OP and Meth only.
OP: (NQ55) / (52*[(NQ3) x (NQI)+ (NQ3) x (NQGS)]),Meth: (NQ55) / [(NQ3) x 5 x 52]
U2B31 (K) Cost per documented visit based on averagenumber of visits per client abstracted in ADSSclient abstract file.
(NQ55/(ABVisit*NQA)
Variable Group 8. Phases I and II Analysis VariablesN3N12 N3N195 Annualized salaries for each FT staff category.
Phase II.NQ47x1 *NQ49xl*NQ47x4*52
N3N23 N3N30 Annualized salaries for each PT/CT (combined)staff category. Phase II.
NQ47x23*NQ49Px*NQ47x4r*52
N3B32 Total number of employees (including FT andPT/CT). Phase II.
NQ47x1+NQ47x23
N3N32 Total costs of salaries (annualized). Phase II. Sum (N2N12-N3N30)N3N33 Total costs of fringe benefits = Total salaries *
fringe benefit rate (NQ50). Phase II.N3N321NQ50
N3N34 Total costs of personnel = N3N32 + N3N33.Phase II
N3N32+N3N33
P3N38 (K) Proportion Personnel costs to total costs. PhaseII.
N3N34/NQ55
N3J40 Sum of counseling personnel costs (FT andPT/CT). Phase II.
(1+NQ50)*(N3N15+N3N16+N3N17+N3N18+N3N26+N3N27+N3N28+N3N29)
P3N40 (K) Proportion Counseling personnel costs to totalpersonnel costs. Phase II.
N3J40/N3N34
N3J42 Sum of medical personnel costs (FT and PT/CT).Phase II.
(1+NQ50)*(N3N12+N3N13+N3N14+N3N23+N3N24+N3N25)
P3N42 (K) Proportion Medical personnel costs to totalpersonnel costs. Phase II.
N3J421N3N34
N3J44 Sum of administrative personnel costs (FT andPT/CT). Phase II.
(1+NQ50)*(N3N19+N3N30)
P3N44 (K) Proportion Administrative personnel costs tototal personnel costs. Phase II.
(N3J44/N3N34)
N3J46 Sum of direct care personnel costs (FT andPT/CT). Phase II.
N3J40+N3J42
P3N46 (K) Proportion Direct Care personnel costs to totalpersonnel costs. Phase II.
N3J46/N3n34
(continued)
5 652
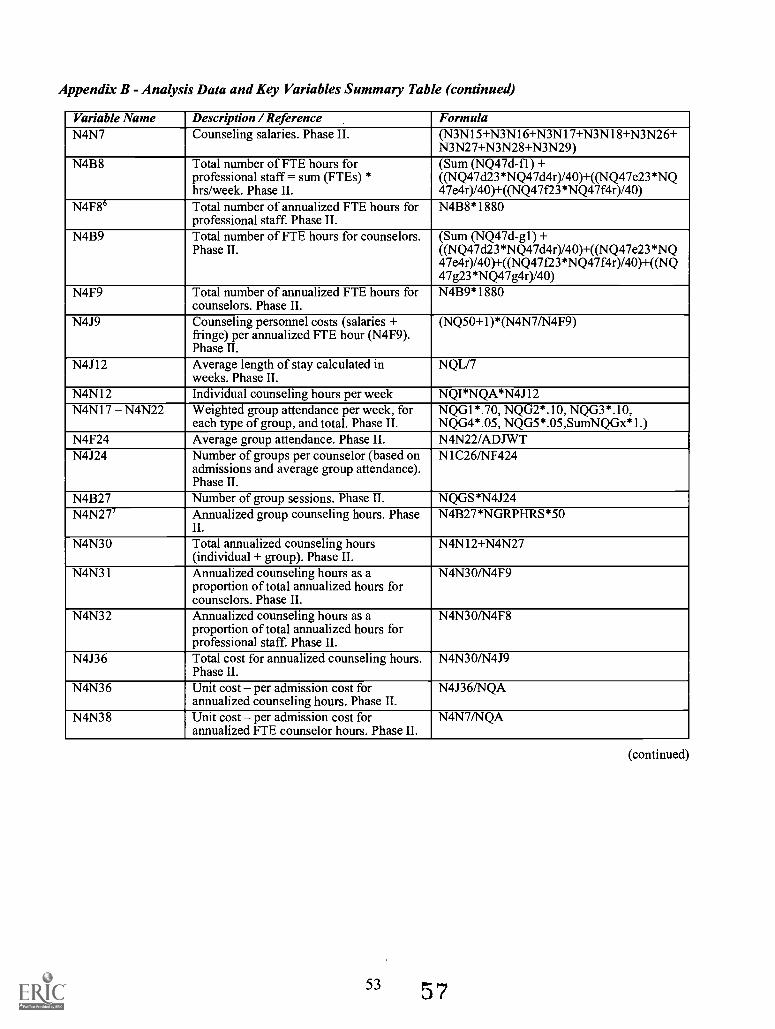
Appendix B - Analysis Data and Key Variables Summary Table (continued)
Variable Name Description / Reference FormulaN4N7 Counseling salaries. Phase II. (N3N15+N3N16+N3N17+N3N18+N3N26+
N3N27+N3N28+N3N29)N4B8 Total number of FTE hours for
professional staff = sum (FTEs) *hrs/week. Phase II.
(Sum (NQ47d-fl) +((NQ47d23*NQ47d4r)/40)+((NQ47e23*NQ47e4r)140)+((NQ47f23*NQ47f4r)/40)
N4F86 Total number of annualized FTE hours forprofessional staff. Phase II.
N4B8*1880
N4B9 Total number of FTE hours for counselors.Phase II.
(Sum (NQ47d-g1) +((NQ47d23*NQ47d4r)/40)+((1%1Q47e23*NQ47e4r)/40)+((NQ47f23*NQ47f4r)/40)+((NQ47g23*NQ47g4r)140)
N4F9 Total number of annualized FTE hours forcounselors. Phase II.
N4B9*1880
N4J9 Counseling personnel costs (salaries +fringe) per annualized FTE hour (N4F9).Phase II.
(NQ50+1)*(N4N71N4F9)
N4J12 Average length of stay calculated inweeks. Phase II.
NQL/7
N4N12 Individual counseling hours per week NQI*NQA*N4J12N4N17 N4N22 Weighted group attendance per week, for
each type of group, and total. Phase II.NQG1*.70, NQG2*.10, NQG3*.10,NQG4*.05, NQG5*.05,SumNQGx*1.)
N4F24 Average group attendance. Phase II. N4N22/ADJWTN4J24 Number of groups per counselor (based on
admissions and average group attendance).Phase II.
N1C26/NF424
N4B27 Number of group sessions. Phase II. NQGS*N4J24N4N27' Annualized group counseling hours. Phase
II.N4B27*NGRPHRS*50
N4N30 Total annualized counseling hours(individual + group). Phase II.
N4N12+N4N27
N4N31 Annualized counseling hours as aproportion of total annualized hours forcounselors. Phase II.
N4N301N4F9
N4N32 Annualized counseling hours as aproportion of total annualized hours forprofessional staff. Phase II.
N4N301N4F8
N4J36 Total cost for annualized counseling hours.Phase II.
N4N301N4J9
N4N36 Unit cost per admission cost forannualized counseling hours. Phase II.
N4J36/NQA
N4N38 Unit cost per admission cost forannualized FTE counselor hours. Phase II.
N4N7/NQA
53 57
(continued)
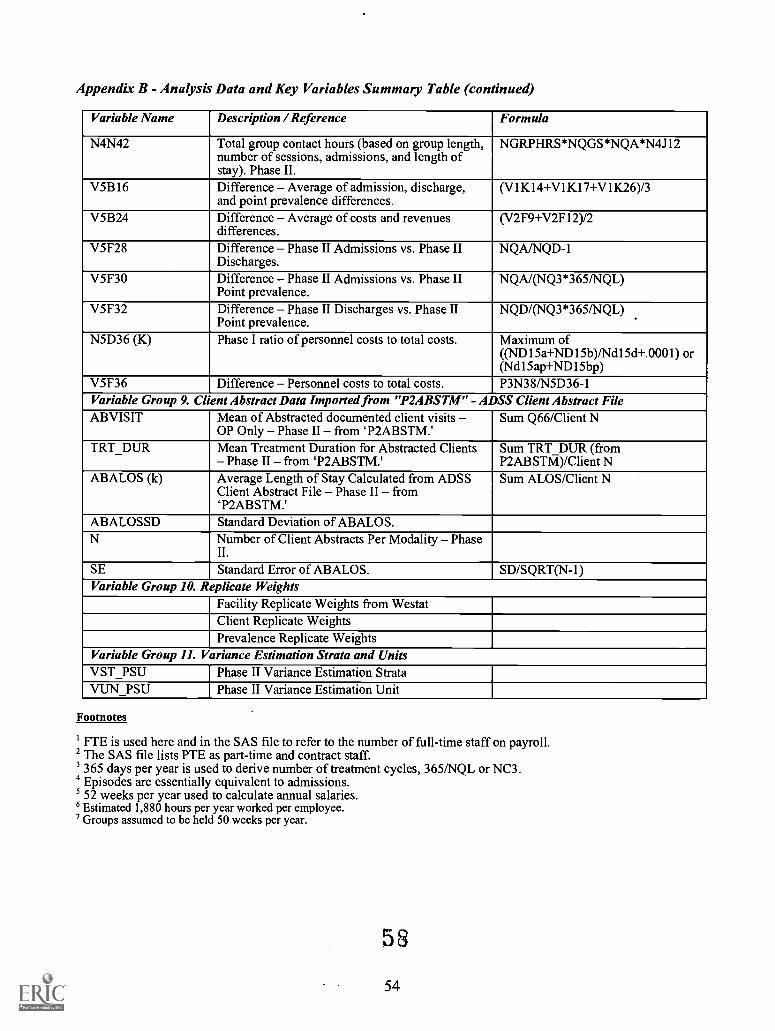
Appendix B - Analysis Data and Key Variables Summary Table (continued)
Variable Name Description / Reference Formula
N4N42 Total group contact hours (based on group length,number of sessions, admissions, and length ofstay). Phase II.
NGRPHRS*NQGS*NQA*N4J12
V5B16 Difference Average of admission, discharge,and point prevalence differences.
(V1K14+V1K17+V1K26)/3
V5B24 Difference Average of costs and revenuesdifferences.
(V2F9+V2F12)/2
V5F28 Difference Phase II Admissions vs. Phase IIDischarges.
NQA/NQD-1
V5F30 Difference Phase II Admissions vs. Phase IIPoint prevalence.
NQA/(NQ3*365/NQL)
V5F32 Difference Phase II Discharges vs. Phase IIPoint prevalence.
NQD/(NQ3*365/NQL)
N5D36 (K) Phase I ratio of personnel costs to total costs. Maximum of((ND15a+ND15b)/Ndl5d+.0001) or(Ndl5ap+ND15bp)
V5F36 Difference Personnel costs to total costs. P3N38/N5D36-1Variable Group 9. Client Abstract Data Imported from "P2ABSTM" - ADSS Client Abstract FileABVISIT Mean of Abstracted documented client visits
OP Only Phase II from P2ABSTM.'Sum Q66/Client N
TRT_DUR Mean Treatment Duration for Abstracted ClientsPhase II from T2ABSTM.'
Sum TRT DUR (fromP2ABSTM)/Client N
ABALOS (k) Average Length of Stay Calculated from ADSSClient Abstract File Phase II from`P2ABSTM.'
Sum ALOS/Client N
ABALOSSD Standard Deviation of ABALOS.N Number of Client Abstracts Per Modality Phase
II.
SE Standard Error of ABALOS. SD/SQRT(N-1)Variable Group 10. Replicate Weights
Facility Replicate Weights from WestatClient Replicate WeightsPrevalence Replicate Weights
Variable Group 11. Variance Estimation Strata and UnitsVST_PSU Phase II Variance Estimation StrataVUN_PSU Phase II Variance Estimation Unit
Footnotes
FTE is used here and in the SAS file to refer to the number of full-time staff on payroll.2 The SAS file lists PTE as part-time and contract staff.3365 days per year is used to derive number of treatment cycles, 3651NQL or NC3.Episodes are essentially equivalent to admissions.
5 52 weeks per year used to calculate annual salaries.'Estimated 1,880 hours per year worked per employee.
Groups assumed to be held 50 weeks per year.
53
54
Appendix C
Internal and External Data Estimates
55 5 9
Appendix C Internal and External Data Estimates
Internal Data Estimates
Internal estimation of a variable was based on the variable's relationship to other variables reported by thefacility. Internal estimation was used for a variety of variable types including admissions, discharges, pointprevalence, facility costs and revenues, and staffing data and hourly rates. A series of examples areprovided below to demonstrate how "internal estimates" were developed.
Example 1 Admissions and Discharges
Generally, if a facility administrator was confident in reporting either the annual admission or the annualdischarge count of clients, but not both variables, the reported measure was used to estimate thecorresponding unreported client count measure. Given a reliably reported point prevalence and averagelength of stay, this provides the best estimate of client throughput, assuming a stable, steady state ofservice delivery.
Example 2 Facility Costs and Revenues
If a facility administrator was confident in reporting either the facility's total annual costs or the totalannual revenues, but not both variables, the reported measure was used to estimate the correspondingunreported measure of resource use. This occurred most frequently when a facility's reporting sampled unitor 'modality' was administratively part of a larger umbrella organization. Often, facility officials were ableto report program costs, but were unable to report revenue data, which was maintained at a higher levelwithin the organization. In this type of situation, the unobtainable revenue data were estimated based onreported cost figures.
Example 3 Staffing and Hourly Rates
If a multi-modality facility's outpatient methadone program is able to report an hourly rate of pay for itsMaster's Degree Counselors, but the regular outpatient program is unable to report the same variable, theidentical hourly rate would similarly be applied to the outpatient program. This internal estimate assumesan equivalent average rate of pay for a Master's Degree Counselor throughout the entire substance abusetreatment facility.
Example 4 Average Length of Stay
A residential facility director confidently reports its point prevalence (55), along with the number ofadmissions (1813) and discharges (1878) over the past 12-month period. The facility director also indicatesthat he or she is very unclear about the average length of stay for clients and is uncomfortable giving anydata regarding this variable. As a result, the cost analyst staff would provide an internal estimate of theaverage length of stay, NQL, based on the above reported variables, namely, point prevalence, totaladmissions, and total discharges. In order to obtain this estimate, average client count calculations wereused as analysis variables in the facility's data analysis.
These variables include:
N1C26 (Phase II Admission Derivative) = NQA/(365/NQL)N1C27 (Phase II Discharge Derivative) = NQD/(3651NQL)NQ3 (Point Prevalence)
N1C26 and N1C27 are formulas of derived average client counts for the facility.
Subsequently, the information given by the director is entered into the above formulas.
N1C26 = 1813/(365/x1) = 55N1C27 = 1878/(365/x2) = 55NQ3 = 55
57 6 0

Solving, xl (based on admission) = 11.1 days and x2 (based on discharges) = 10.7 days. As a result, x orNQL = approximately 11 days.
This result would be entered into the facility's data set as the internal estimate. It is apparent that thisanalysis is heavily dependent upon the accuracy of the reported admissions, discharges, and pointprevalence.
In other facilities, the director could provide only a range, rather than a specific value, for some items.Then a sensitivity analysis was conducted using the above formulas to identify a reasonable estimate of theaverage length of stay, NQL.
61
58

Appendix D
Variance Estimation of Ratio Estimators
59 62

Appendix D - Variance Estimation of Ratio Estimators
One of the major goals of the ADSS cost study is the estimation of cost and revenues rates (e.g.,the cost per client admission, the cost per client day, or the cost per client visit). These parameters ofinterest involve ratios of population totals and means. In general, these ratios can be estimated by means ofeither combined or separate ratio estimators. See Cochran (1977) and Lohr (1999) for a discussion.
The combined ratio estimator was the preferred method of estimation in the form R =
where Y and 1 , respectively, are estimates of the population means 47= Y / N and .;17 = x/ N (N isthe population size; Y and X are the corresponding population totals). One advantage, pointed outby Lohr(p. 225), is smaller bias when there is a small number of primary sampling units (PSUs) in the strata.
Because ratio estimators are non-linear, estimation of their variances is more involved than that oftotals and means. In this report, variances of ratio estimators were estimated by the delete-1 Jackknifemethod:
nh 2
varfic (i)=E h E( ,
h=1 i=1
where h = L are the strata, i = 1,...,nh are the PSUs in stratum h, and h = Y X is the
estimated ratio based on the sample with PSU i in stratum h deleted, and the weights recalibrated.
Note: In this appendix, true variances are denoted by Var and their estimates by lowercase var.
Variance of a Ratio of a Ratio and a Mean
One parameter of interest (e.g., cost per counseling hour per client) was of the form
U = (/7 / X)/ Z. f(I2-). It was estimated by 0= f/(c7i). Note that U = N U1 where
= YI(XZ) .
Its variance was estimated by first performing Taylor linearization and then estimating thevariance by applying delete-1 jackknife to the residuals. In more detail, the following steps were followed.
a. Taylor linearization:
So,
where
If u = y /(xz), then
1Au
1Ay Y°
2Az = Ay Ax Az .
x z x2Z xo zoo o o o o o o o
\Tar A,21z, Var (6)
y y j7 Ygi= yi --x = yiX Z X Z
and where G is the estimate of the population total Ei g, .
61
6 3
(1)

b. Applying the jackknife:
To estimate the variances in (1), because the gis involve the unknown values Y and X, weapproximate them by
f f Y Y= yi xi Zi yi xi -a- ZiX Z X Z
and use
1var var
)= x zwhere II is the estimate of the population total of the variable h.
Because U= N U1, Var (U) = N'Var(U1). So
(2)
S.E.(0)= ,1 NS.E.(i1)1
) 1 S.E.(h) (3)(NX)(NZ) A7Z N
Therefore, the procedure used was as follows:
1. Create a new variable h for each unit, using (2).
2. Calculate the standard error S.E. (H).
3. Use formula (3).
References
Cochran, W. G. (1977). Sampling techniques (3rd ed.). New York: John Wiley & Sons.
Lohr, S. L. (1999). Sampling: Design and analysis. Pacific Grove, CA: Duxbury Press.
6264
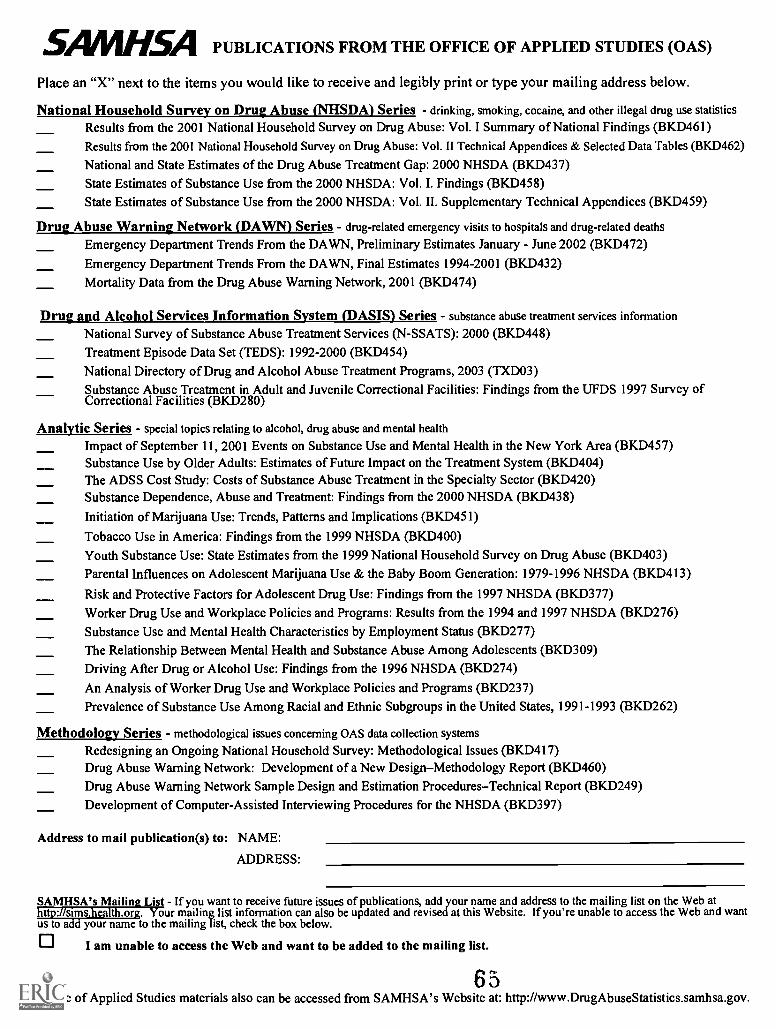
SAMHSA PUBLICATIONS FROM THE OFFICE OF APPLIED STUDIES (OAS)
Place an "X" next to the items you would like to receive and legibly print or type your mailing address below.
National Household Survey on Drug Abuse (NHSDA) Series - drinking, smoking, cocaine, and other illegal drug use statisticsResults from the 2001 National Household Survey on Drug Abuse: Vol. I Summary of National Findings (BKD461)Results from the 2001 National Household Survey on Drug Abuse: Vol. II Technical Appendices & Selected Data Tables (BKD462)
National and State Estimates of the Drug Abuse Treatment Gap: 2000 NHSDA (BKD437)State Estimates of Substance Use from the 2000 NHSDA: Vol. I. Findings (BKD458)State Estimates of Substance Use from the 2000 NHSDA: Vol. II. Supplementary Technical Appendices (BKD459)
Drug Abuse Warning Network (DAWN) Series - drug-related emergency visits to hospitals and drug-related deathsEmergency Department Trends From the DAWN, Preliminary Estimates January - June 2002 (BKD472)
Emergency Department Trends From the DAWN, Final Estimates 1994-2001 (BKD432)
Mortality Data from the Drug Abuse Warning Network, 2001 (BKD474)
Drug and Alcohol Services Information System (DASIS) Series - substance abuse treatment services informationNational Survey of Substance Abuse Treatment Services (N-SSATS): 2000 (BKD448)
Treatment Episode Data Set (TEDS): 1992-2000 (BKD454)
National Directory of Drug and Alcohol Abuse Treatment Programs, 2003 (TXDO3)Substance Abuse Treatment in Adult and Juvenile Correctional Facilities: Findings from the UFDS 1997 Survey ofCorrectional Facilities (BKD280)
Analytic Series - special topics relating to alcohol, drug abuse and mental healthImpact of September 11, 2001 Events on Substance Use and Mental Health in the New York Area (BKD457)Substance Use by Older Adults: Estimates of Future Impact on the Treatment System (BKD404)The ADSS Cost Study: Costs of Substance Abuse Treatment in the Specialty Sector (BKD420)Substance Dependence, Abuse and Treatment: Findings from the 2000 NHSDA (BKD438)
Initiation of Marijuana Use: Trends, Patterns and Implications (BKD451)
Tobacco Use in America: Findings from the 1999 NHSDA (BKD400)Youth Substance Use: State Estimates from the 1999 National Household Survey on Drug Abuse (BKD403)
Parental Influences on Adolescent Marijuana Use & the Baby Boom Generation: 1979-1996 NHSDA (BKD413)
Risk and Protective Factors for Adolescent Drug Use: Findings from the 1997 NHSDA (BKD377)
Worker Drug Use and Workplace Policies and Programs: Results from the 1994 and 1997 NHSDA (BKD276)
Substance Use and Mental Health Characteristics by Employment Status (BKD277)The Relationship Between Mental Health and Substance Abuse Among Adolescents (BKD309)Driving After Drug or Alcohol Use: Findings from the 1996 NHSDA (BKD274)
An Analysis of Worker Drug Use and Workplace Policies and Programs (BKD237)Prevalence of Substance Use Among Racial and Ethnic Subgroups in the United States, 1991-1993 (BKD262)
Methodology Series - methodological issues concerning OAS data collection systemsRedesigning an Ongoing National Household Survey: Methodological Issues (BKD417)Drug Abuse Warning Network: Development of a New DesignMethodology Report (BKD460)Drug Abuse Warning Network Sample Design and Estimation ProceduresTechnical Report (BKD249)Development of Computer-Assisted Interviewing Procedures for the NHSDA (BKD397)
Address to mail publication(s) to: NAME:
ADDRESS:
SAMHSA's Mailin2 List - If you want to receive future issues of publications, add your name and address to the mailing list on the Web athttp://sims.health.org. Your mailing list information can also be updated and revised at this Website. If you're unable to access the Web and wantus to add your name to the mailing list, check the box below.
0 I am unable to access the Web and want to be added to the mailing list.
6 '5Office of Applied Studies materials also can be accessed from SAMHSA's Website at: http://www.DrugAbuseStatistics.samhsa.gov.
FOLD
STAMP
NATIONAL CLEARINGHOUSE FOR ALCOHOL AND DRUG INFORMATIONP. 0. BOX 2345
ROCKVILLE, MD 20847-2345
FOLD
6 6
Substance Abuse and Mental Health Services Administration (SAMHSA)Office of Applied Studies Publications Series
National Household Survey on Drug Abuse (NHSDA) Series:Reports in the Household Survey Series present information from SAMHSA's National Household Survey onDrug Abuse. This representative survey is the primary source of information on the prevalence, patterns, andconsequences of drug and alcohol use and abuse in the general U.S. civilian non-institutionalizedpopulation, age12 and older. This survey has been conducted periodically since 1971 and annually since 1990.
"H" Series publications currently available:H-1: National Household Survey on Drug Abuse: Main Findings 1995H-2: The Prevalence and Correlates of Treatment for Drug ProblemsH-3: Preliminary Results from the 1996 National Household Survey on Drug AbuseH-4: National Household Survey on Drug Abuse: Population Estimates 1996H-5: National Household Survey on Drug Abuse: Main Findings 1996H-6: Preliminary Results from the 1997 National Household Survey on Drug AbuseH-7: National Household Survey on Drug Abuse: Population Estimates 1997H-8: National Household Survey on Drug Abuse: Main Findings 1997H-9: National Household Survey on Drug Abuse: Population Estimates 1998H-10: Summary of Findings from the 1998 National Household Survey on Drug AbuseH-11: National Household Survey on Drug Abuse: Main Findings 1998H-12: Summary of Findings from the 1999 National Household Survey on Drug AbuseH-13: Summary of Findings from the 2000 National Household Survey on Drug AbuseH-14: National and State Estimates of the Drug Abuse Treatment Gap: 2000 NHSDAH-15: State Estimates of Substance Use from the 2000 NHSDA: Vol. I. Findings11-16: State Estimates of Substance Use from the 2000 NHSDA: Vol. II. Supplementary Technical AppendicesH-17: Results from the 2001 NHSDA: Vol. I. Summary of National FindingsH-18: Results from the 2001 NHSDA: Vol. II. Technical Appendices and Selected Data Tables
Drug Abuse Warning Network (DAWN) Series:Reports in the DAWN Series provide data on the number and characteristics of (1) drug abuse related visits to anational representative sample of hospital emergency departments, and (2) drug abuse related deaths from selectedmedical examiner offices. The medical examiner cases are not from a national representative sample. DAWNis an ongoing data system that began in the early 1970's.
"D" Series publications currently available:D-1: Drug Abuse Warning Network Annual Medical Examiner Data 1995D-2: Mid-Year Preliminary Estimates from the 1996 Drug Abuse Warning NetworkD-3: Year-End Preliminary Estimates from the 1996 Drug Abuse Warning NetworkD-4: Drug Abuse Warning Network Annual Medical Examiner Data 1996D-5: Mid-Year 1997 Preliminary Emergency Department Data from the Drug Abuse Warning NetworkD-6: Year-End 1997 Emergency Department Data from the Drug Abuse Warning NetworkD-7: Annual Emergency Department Data from the Drug Abuse Warning Network, 1995D-8: Annual Emergency Department Data from the Drug Abuse Warning Network, 1996D-9: Annual Emergency Department Data from the Drug Abuse Warning Network, 1997D-10: Mid-Year 1998 Preliminary Emergency Department Data from the Drug Abuse Warning NetworkD-11: Year-End 1998 Emergency Department Data from the Drug Abuse Warning NetworkD-12: Drug Abuse Warning Network Annual Medical Examiner Data 1997D-13: Drug Abuse Warning Network Annual Medical Examiner Data 1998D-14: Mid-Year 1999 Preliminary Emergency Department Data from the Drug Abuse Warning NetworkD-15: Year-End 1999 Emergency Department Data from the Drug Abuse Warning NetworkD-16: Drug Abuse Warning Network Annual Medical Examiner Data 1999D-17: Mid-Year 2000 Preliminary Emergency Department Data from the Drug Abuse Warning NetworkD-18: Year-End 2000 Emergency Department Data from the Drug Abuse Warning NetworkD-19: Mortality Data from the Drug Abuse Warning Network, 2000D-20: Emergency Dept. Trends From the Drug Abuse Warning Network, Preliminary Estimates Jan.-June 2001D-21: Emergency Department Trends From the Drug Abuse Warning Network, Final Estimates 1994 -2001D-22: Emergency Dept. Trends From the Drug Abuse Warning Network, Preliminary Estimates Jan.-June 2002D-23: Mortality Data from the Drug Abuse Warning Network, 2001
(Continued on next page)
6 7
Drug and Alcohol Services Information System (DASIS) Series:Reports in the Services Series provide national and state level data on (1) the characteristics of specialtytreatment facilities providing drug and alcohol services; (2) the number of persons in treatment; and (3) thedemographic and drug use characteristics of treatment admissions. The Services Series also includes theNational Directory of Drug and Alcohol Abuse Treatment Programs. The publications in this Series are basedon SAMHSA's Drug and Alcohol Services Information System (DASIS).
"S" Series publications currently available:S-1: National Directory of Drug Abuse and Alcoholism Treatment and Prevention Programs 1996S-2: Uniform Facility Data Set (UFDS): Data for 1995 and 1980-1995S-3: Uniform Facility Data Set (UFDS): Data for 1996 and 1980-1996S-4R: National Directory of Drug Abuse and Alcoholism Treatment and Prevention Programs 1997S-5: National Admissions to Substance Abuse Treatment Services: The Treatment Episode Data Set (TEDS)
1992-1996S-6: Uniform Facility Data Set (UFDS): 1997S-7: Treatment Episode Data Set (TEDS): 1992-1997S-8: National Directory of Drug Abuse and Alcoholism Treatment Programs,1998S-9: Substance Abuse Treatment in Adult and Juvenile Correctional Facilities: Findings from the UFDS
1997 Survey of Correctional FacilitiesS-10: Uniform Facility Data Set (UFDS): 1998S-11: Treatment Episode Data Set (TEDS): 1993-1998S-12: National Directory of Drug and Alcohol Abuse Treatment Programs 2000S-13: Uniform Facility Data Set (UFDS): 1999S-14: Treatment Episode Data Set (TEDS): 1994-1999S-15: National Directory of Drug and Alcohol Abuse Treatment Programs 2001S-16: National Survey of Substance Abuse Treatment Services (N-SSATS): 2000S-17: Treatment Episode Data Set (TEDS): 1992-2000S-18: National Directory of Drug and Alcohol Abuse Treatment Programs 2003
Analytic Series:Reports in the Analytic Series address special topics relating to alcohol, drug abuse, and mental health. TheAnalytic Series generally provides data from outcome and other special studies, secondary analysis of multipledata sources, or more in-depth analysis of the data presented in the standard annual reports in the other Officeof Applied Studies publication series.
"A" Series publications currently available:A-1: Employment Outcomes of Indigent Clients Receiving Alcohol and Drug Treatment in Washington StateA-2: An Analysis of Worker Drug Use and Workplace Policies and ProgramsA-3: Substance Use Among Women in the United StatesA-4: Substance Abuse and Mental Health Statistics Source Book 1998A-5: Services Research Outcomes StudyA-6: Prevalence of Substance Use Among Racial and Ethnic Subgroups in the U.S., 1991-1993A-7: Analyses of Substance Abuse and Treatment Need IssuesA-8: Driving After Drug or Alcohol Use: Findings from the 1996 NHSDAA-9: The Relationship Between Mental Health and Substance Abuse Among AdolescentsA-10: Substance Use and Mental Health Characteristics by Employment StatusA-11: Worker Drug Use and Workplace Policies and Programs: Results from the 1994 and 1997 NHSDAA-12: Risk and Protective Factors for Adolescent Drug Use: Findings from the 1997 National Household
Survey on Drug AbuseA-13: Parental Influences on Adolescent Marijuana Use and the Baby Boom Generation: Findings from the
1979-1996 NHSDAA-14: Youth Substance Use: State Estimates from the 1999 NHSDAA-15: Tobacco Use in America: Findings from the 1999 NHSDAA-16: Substance Dependence, Abuse and Treatment: Findings from the 2000 NHSDAA-17: Initiation of Marijuana Use: Trends, Patterns and ImplicationsA-18: Impact of September 11, 2001 Events on Substance Use and Mental Health in the New York AreaA-19: Risk and Protective Factors for Adolescent Drug Use: Findings from the 1999 NHSDAA-20: The ADSS Cost Study: Costs of Substance Abuse Treatment m the Specialty SectorA-21: Substance Use by Older Adults: Estimates of Future Impact on the Treatment System
Methodology Series:Reports in the Methodology Series address methodological issues concerning data collection systemsconducted by SAMHSA's Office of Applied Studies. These reports include studies of new statisticaltechniques and theories, survey methods, sample design, survey instrument design, and objective evaluationsof the reliability of collected data.
"M" Series publications currently available:M-1: Substance Abuse in States and Metropolitan Areas: Model Based Estimates from the 1991-1993
NHSDA--Methodology ReportM-2: Drug Abuse Warning Network Sample Design and Estimation Procedures--Technical ReportM-3: Development of Computer-Assisted Interviewing Procedures for the NHSDAM-4: Drug Abuse Warning Network: Development of a New Design--Methodology Report
A

SMHSADHHS Publication No. (SMA) 03-3762Substance Abuse and Mental Health Services AdministrationPrinted 2003
U.S. Department of EducationOffice of Educational Research and Improvement (OERI)
National Library of Education (NLE)
Educational Resources Information Center (ERIC)
NOTICE
Reproduction Basis
-
Education! Room es lanolin Center
This document is covered by a signed "Reproduction Release (Blanket)"form (on file within the ERIC system), encompassing all or classes ofdocuments from its source organization and, therefore, does not require a"Specific Document" Release form.
This document is Federally-funded, or carries its own permission toreproduce, or is otherwise in the public domain and, therefore, may bereproduced by ERIC without a signed Reproduction Release form (either"Specific Document" or "Blanket").
EFF-089 (1/2003)