Reproductions supplied by EDRS are the best that can be ... · bayi 11491i-l-vd-e. TO THE...
52
DOCUMENT RESUME ED 452 333 UD 034 159 AUTHOR Passel, Jeffrey S.; Zimmermann, Wendy TITLE Are Immigrants Leaving California? Settlement Patterns of Immigrants in the Late 1990s. INSTITUTION Urban Inst., Washington, DC. SPONS AGENCY Ford Foundation, New York, NY.; Hewlett Foundation, Inc., Garden City, NY.; Andrew W. Mellon Foundation, New York, NY. PUB DATE 2001-00-00 NOTE 54p.; An earlier version of this paper was presented at the Annual Meeting of the Population Association of America (Los Angeles, CA, March 2000). AVAILABLE FROM Urban Institute, 2100 M Street, NW, Washington, DC 20037. Tel: 202-261-5678-7200 or 202-261-5621; Web site: http://www.urban.org. PUB TYPE Reports Research (143) Speeches/Meeting Papers (150) EDRS PRICE MF01/PC03 Plus Postage. DESCRIPTORS Economic Factors; Geographic Distribution; *Immigrants; Immigration; Mexicans; *Migration Patterns; Population Distribution; Residential Patterns; Welfare Services IDENTIFIERS California ABSTRACT This paper uses data from the U.S. decennial censuses and March Supplements to the Current Population Survey of 1995-99 to examine the historic patterns of immigrant settlement within the United States, recent shifts in these patterns, and the extent to which changes are due to the international versus internal migration, focusing particularly on California. The paper examines the characteristics of internal migrants, comparing those moving out, those moving in, and those staying put. It also revisits the welfare magnet theory to see if immigrants are drawn to states with the strongest safety nets for immigrants. The data strongly suggest that jobs, economic opportunity, and family are the principal reasons people move between states, and the availability of welfare plays only a negligible role in determining the settlement patterns of immigrants. During the latter half of the 1990s, California's share of the immigrant population dropped, while the immigrant population overall continued to grow nationwide, with many immigrants settling in new places. These new growth states, with little experience integrating immigrants, will receive not only more immigration but will have a larger share of immigrants who have recently arrived and are unfamiliar with U.S. customs and institutions.(Contains 10 references.) (SM) Reproductions supplied by EDRS are the best that can be made from the original document.
Transcript of Reproductions supplied by EDRS are the best that can be ... · bayi 11491i-l-vd-e. TO THE...

DOCUMENT RESUME
ED 452 333 UD 034 159
AUTHOR Passel, Jeffrey S.; Zimmermann, WendyTITLE Are Immigrants Leaving California? Settlement Patterns of
Immigrants in the Late 1990s.INSTITUTION Urban Inst., Washington, DC.SPONS AGENCY Ford Foundation, New York, NY.; Hewlett Foundation, Inc.,
Garden City, NY.; Andrew W. Mellon Foundation, New York, NY.PUB DATE 2001-00-00NOTE 54p.; An earlier version of this paper was presented at the
Annual Meeting of the Population Association of America (LosAngeles, CA, March 2000).
AVAILABLE FROM Urban Institute, 2100 M Street, NW, Washington, DC 20037.Tel: 202-261-5678-7200 or 202-261-5621; Web site:http://www.urban.org.
PUB TYPE Reports Research (143) Speeches/Meeting Papers (150)EDRS PRICE MF01/PC03 Plus Postage.DESCRIPTORS Economic Factors; Geographic Distribution; *Immigrants;
Immigration; Mexicans; *Migration Patterns; PopulationDistribution; Residential Patterns; Welfare Services
IDENTIFIERS California
ABSTRACTThis paper uses data from the U.S. decennial censuses and
March Supplements to the Current Population Survey of 1995-99 to examine thehistoric patterns of immigrant settlement within the United States, recentshifts in these patterns, and the extent to which changes are due to theinternational versus internal migration, focusing particularly on California.The paper examines the characteristics of internal migrants, comparing thosemoving out, those moving in, and those staying put. It also revisits thewelfare magnet theory to see if immigrants are drawn to states with thestrongest safety nets for immigrants. The data strongly suggest that jobs,economic opportunity, and family are the principal reasons people movebetween states, and the availability of welfare plays only a negligible rolein determining the settlement patterns of immigrants. During the latter halfof the 1990s, California's share of the immigrant population dropped, whilethe immigrant population overall continued to grow nationwide, with manyimmigrants settling in new places. These new growth states, with littleexperience integrating immigrants, will receive not only more immigration butwill have a larger share of immigrants who have recently arrived and areunfamiliar with U.S. customs and institutions.(Contains 10 references.) (SM)
Reproductions supplied by EDRS are the best that can be madefrom the original document.

1
ARE IMMIGRANTS LEAVING CALIFORNIA?
SETTLEMENT PATTERNS OF IMMIGRANTS IN THE LATE 199051
Jeffrey S. Passel and Wendy ZimmermannUrban Institute
2100 M St., N.W.Washington, DC 20037
202-261-5678; [email protected]; [email protected]
An earlier version of this paper was presented at the annual meeting of the Population Association ofAmerica in March 2000 in Los Angeles, California. The authors wish to thank Laureen Laglagaron for hervery able assistance in preparing the various data sets and tabulations used in preparing this analysis. Thispaper was prepared with partial support from the Ford Foundation, the Hewlett Foundation, and the MellonFoundation. The views and opinions expressed are the authors' and do not necessarily reflect those of theorganizations providing financial support, the Urban Institute, its staff, officers or trustees.
PERMISSION TO REPRODUCE ANDDISSEMINATE THIS MATERIAL HAS
BEEN GRANTED BY
ovJ
U bayi 11491i-l-vd-eTO THE EDUCATIONAL RESOURCES
INFORMATION CENTER (ERIC)
U.S. DEPARTMENT OF EDUCATIONOffice of Educational Research and Improvement
EDUCATIONAL RESOURCES INFORMATIONCENTER (ERIC)
This document has been reproduced asreceived from the person or organizationoriginating it.
Minor changes have been made toimprove reproduction quality.
Points of view or opinions stated in thisdocument do not necessarily representofficial OERI position or policy.
BEST COPY AVAILABLE

ARE IMMIGRANTS LEAVING CALIFORNIA?SETTLEMENT PATTERNS OF IMMIGRANTS IN THE LATE 19905
Jeffrey S. Passel and Wendy Zimmermann.
TABLE OF CONTENTS
INTRODUCTION 1
Policy Context 2
CHANGING SETTLEMENT PATTERNS OF IMMIGRANTS 3
Growing concentration. in a few states, especially California 3
Increased dispersal and slower growth in California in the late 1990s 6
INTERNATIONAL AND INTERNAL MIGRATION 9
Immigation flows to big states large but declining 10Foreign-born moving out of big immigrant states and into new growth states 11
California's natives also moving out 12
WHO IS MOVING AND WHO IS STAYING? 14
Mexicans more likely to move out of California 14Reasons for moving 16
WELFARE AND MOBILITY 18
More recent immigrants in new growth states 20
CONCLUSION 21
REFERENCES 26
FIGURES AND TEXT TABLES
Figure 1 Immigration by Decade, 1821-1830 to 1991-2000 4
Figure 2. Percent of Foreign-Born Population by State: 1850-1999 5
Figure 3. Immigration Growth Categories for States 8
Figure 4. Migration Rates by Age and Nativity, for California: 1995-1999 13
Figure 5. Availability of Safety Net to Immigrants after Welfare Reform, for States 20
Text Table A. Mean Earnings for Mexican-Born Males Aged 18-64 Years, by MobilityStatus, for California and the Rest of the United States: March 1996-1999 CPS ... 15
3

TABLES
Table 1. Foreign-Born Population, for Regions, Divisions, and States: 1850 to 1999 27
Table 2. Foreign-Born Population, for Regions, Divisions, and States: 1990 to 1999 29
Table 3. Foreign-Born Population by State Groups, 1970-1999 30
Table 4. Foreign-Born Population and Components of Change, 1970 to 1999, forCalifornia, Selected States, and Groups of States 31
Table 5. Mobility by Age and Nativity for California: 1990-1999,1990-1995, and1995-1999 33
Table 6. Mobility by Period of Entry and Country of Birth for the Foreign-BornPopulation, California: 1995-1999, Based on March 1996-1999 CPS 34
Table 7. Reasons for Moving, by Mobility Status and Nativity, for Persons MovingWithin, Into, and Out of California: March 1998-1999 CPS 35
Table 8a. Foreign-Born Population by State "Safety Net" Groups, 1970-1999 36
Table 8b. Movement of Foreign-Born by State Groups, 1995-1999 37
Appendix Table A. Growth in Foreign-Born Population by Decade, for Regions,Divisions, and States: 1850 to 1999 38
Appendix Table B. Percent Growth in Foreign-Born Population by Decade, for Regions,Divisions, and States: 1850 to 1999 39
Appendix Table C-1. Foreign-Born Population by State Groups, 1970-1999 40
Appendix Table C-2. Distribution of Foreign-Born by State Groups, 1970-1999 42
Appendix Table C-3. Movement of Foreign-Born by State Groups, 1995-1999 44
Appendix Table D-1. Mobility by Educational Attainment, Poverty Level, and FoodStamp Usage, by Nativity for California: 1995-1999, Based on March 1996-1999CPS 46
Appendix Table D-2. Distribution by Educational Attainment, Poverty Level, and FoodStamp Usage within Mobility Categories by Nativity for California: 1995-1999,Based on March 1996-1999 CPS 47
4
ARE IMMIGRANTS LEAVING CALIFORNIA?SETTLEMENT PATTERNS OF IMMIGRANTS IN THE LATE 1990S
Jeffrey S. Passel and Wendy ZimmermannUrban Institute
INTRODUCTION
For at least the last century and a half, the immigrant population in the United States has
been highly concentrated in a handful of states. Even at the beginning of the 20th century, when
the foreign-born population was less than half its current size, just over half of all immigrants
lived in only six states. By 1990, that share had increased to nearly three-quarters. But, between
1990 and 1999, the geographic concentration of immigrants began to wane slightly, as the
foreign-born population grew substantially faster in states that have not traditionally received
large numbers of immigrants. This dispersal of the immigrant population is particularly
noteworthy in the face of dramatically increased numbers, especially in the new settlement areas,
and policy changes surrounding the noncitizen population.
Although the share of immigrants living in only a few states has remained high, which
states had the most immigrants has changed over the years. In fact, New York is the only state
which was among the top six in terms of numbers of immigrants at the turn of the 20th and the
21st centuries. California did not enter that group until 1920 but, since 1980, it has remained the
state with the largest foreign-born population. In fact, the number of immigrants in California
grew so rapidly that within 20 years of becoming the state with the most foreign-born, it had
more than twice as many immigrants as the next largest state (New York). But, while the share
of all immigrants living in California grew steadily from 1900 to 1995 (from about 4 percent to
35 percent), during the latter half of the 1990s its share of the immigrant population dropped to
BEST COPY AVAILABLE
15

30 percent. More striking even than this drop in California's share of the foreign-born
population is the fact that the number of immigrants living in the state has not changed in the last
five years, stabilizing at roughly 8 million between 1995 and 1999. Further, this reduction in
share is due to both fewer immigrants coming to live in California and increased internal
migration of the foreign-bornespecially Mexicansout of California to the rapidly growing
nontraditional immigrant receiving states. (See tables 1 and 2, pages 27-29 for state-level
measures of the foreign-born population.')
Policy context
The heavy concentration of immigrants in a few statesand California's demographic
dominance in particularhas strongly influenced the politics and policymaking surrounding
immigration in the United States. Immigration-related debates in California have long been seen
as forerunners of issues that arise at the national level (Espenshade and Calhoun 1993). For
instance, Proposition 187, California's 1994 effort to bar illegal immigrants from a wide range of
public benefits including education, prefigured federal welfare and illegal immigration reforms
of 1996, which imposed broad restrictions on illegal and legal immigrants' rights and access to
benefits. Recent increases in targeted impact aid to states have also come in large part because
of the efforts of a handful of states to ameliorate some of the fiscal impacts of immigrants on
state and local governments. (See Fix and Zimmermann 2001 for a discussion of these trends.)
The new dispersal of the foreign-born to states with comparatively few immigrants is
taking place at the same time that states are shouldering new responsibilities under welfare
reform. Federal welfare reform shifted broad new authority to states to decide whether legal
Tables 1-8, providing detailed information, can be found on pages 27-37 following the references. Textreferences to the tables are inserted to provide sources for data. Appendix tables AD with further data follow.
2(0

immigrants should be eligible for state- and federally funded public benefits (Zimmermann and
Tumlin 1999). With the federal restrictions on eligibility, nontraditional immigrant receiving,
states now have not only more immigrants than before, but also more responsibility to set policy
for them and to pay for services provided to them. The states' new decisionmaking authority
will continue to raise questions about the long-debated issue of welfare magnets. Will
immigrants be drawn to those states that make their safety nets more accessible to them?
In this paper, we use data from U.S. decennial censuses and March Supplements to the
Current Population Surveys (CPS) of 1995-1999 to examine the historic patterns of immigrant
settlement within the United States, recent shifts in these patterns, and the extent to which
changes are due to international versus internal migration,, focusing particularly on California.
We examine the characteristics of internal migrants, comparing those moving out, those moving
in, and those staying put. We also revisit briefly the so-called "welfare magnet" theory to see if
immigrants are drawn to states with the strongest safety nets for immigrants. Our data strongly
suggest that jobs, economic opportunity, and family are the principal reason people move
between states and that the availability of welfare plays a negligible role in determining the
settlement patterns of immigrants.
CHANGING SETTLEMENT PATTERNS OF IMMIGRANTS
Growing concentration in a few states, especially California
The number of immigrants entering the United States has climbed dramatically each
decade since the 1930s, growing from about 500,000 to more than 11 million in the 1990s
(figure 1, page 4). Most of those immigrants have settled in just a few states with the result that
immigrants are, in fact, far more geographically concentrated than the native-born population. In
3

1990, 73 percent of all foreign-born lived in only six statesCalifornia, New York, Florida,
Texas, New Jersey, Illinoiscompared with only 36 percent of the native-born population. (See
table 1, page 27 for foreign-born populations and rankings covering 1850 through 1999.)
Figure 1. Immigration by Decade, 1821-1830 to 1991-2000
Millions of Irnrnigrants Arriving During Decade
9.0
11 (est.)
10
Europe/Canada (Legal)
I:=1 All Other (Legal)
Additional*
Additional immigrantsinclude illegals, SAWS,refugees, apices, etc.
5.2
3.7
6.0
4.13.8
2.62.3
2.8= 2.5
1.7
1.00.6 0.5 _
0.1
_1.4
ZO. A to to
a0
a a a a a a a
Source: INS Statistical Yearbooks and authors' estimates, Urban Institute (2001).
The early 1990s represent the culmination of three long-run trends toward increased
geographic concentration. First, the percentage of the foreign-born in the top six states with the
largest foreign-born populations increased steadily from a low of 54 percent in 1880-1890 to
74 percent in 1994 (figure 2, page 5). Second, we see a growing divide between the states with
largest numbers of immigrants and the rest of the states. In 1960, the sixth largest state
(Massachusetts) with 576,000 immigrants had only 9 percent more than the seventh largest
(Michigan) with 530,000 immigrants. By 1990, Illinois, had the sixth largest foreign-born
population with 952,000, fully 66 percent more than Massachusetts, which had dropped to
number seven and had only 574,000. This large gap has persisted through the 1990s.
4BEST COPY AVAILABLE
8

Figure 2. Percent of Foreign-Born Population by State: 1850-1999Percent of U.S. total
80%
60%
40%
20%
0%
Top 6 States (Current Year)- - Top 6 States (1980-1999)
ti California--- New York
73.7%
1994
53.8%
1890
1840 1860 1880 1900 1920 1940 1960 1980
Source: Based on Tables 1 and 2, Urban Institute 2001.
2000
Third, the share of immigrants living in just one stateCaliforniahas grown
dramatically, far exceeding the number and share in the other top immigrant receiving states. By
1990, California's immigrant population had grown steadily and so rapidly that its share of the
total immigrant population (33 percent) was more than 18 percentage points greater than New
York's share (14 percent). In contrast, in 1970, the last year that New York (22 percent) had a
larger immigrant population than California (18 percent), the gap was only 4 percentage points.
California's share of the immigrant population in 1990and even in 1999 (30 percent)is
larger than New York's was at any point during the 20th century (which reached only 25 percent
in 1940). Put differently, never before have so many immigrants lived in only one state, either in
terms of absolute numbers or share of the country's foreign-born population.2
2 Interestingly, California's share of the native-born population has also been increasing steadily since the middle ofthe last century, growing from 6.8 percent in 1950 to 10.3 percent in 1999. By 1990, California had a larger share ofnative-born residents than did the largest state at any time since 1860 (New York at 10.5 percent).
5
BEST COPY AVAILABLE

In line with these trends of increasing concentration, we see greater stability in the make
up of the states with the largest numbers of immigrants. While at least one new state entered the
top six nearly every decade since the turn of the 20th century, the same six states have remained
"in the lead" since 1980.3 Further, because of the large gap between the sixth and seventh largest
states, noted above, it will probably be at least another decade before even a rapidly growing
state like Arizona can surpass the foreign-born population in New Jersey or Illinois.
Increased dispersal and slower growth in California in the late 1990s
These dramatic trends toward concentration underscore the significance of the reversals
we see in the late 1990s. First, we see faster growth in the states that have not traditionally
received large numbers of immigrants than in the states that have. Second, California's
foreign-born population, which had grown steadily and very rapidly for several decades, virtually
stopped growing after 1995 (table 2).
The share of the immigrant population living in the six states with the largest numbers of
immigrants dropped from 73 percent in 1990 to 70 percent in 1999. This decline may seem
slight but it results from two rather dramatic shiftsa decrease in the foreign-born population's
rate of growth in the states with the largest numbers of immigrants and a rapid increase in
foreign-born growth in the new settlement areas.
Nationally, the foreign-born population grew by 34 percent during the 1990s but in the
six largest states it grew by only 29 percent, after growing by more than 50 percent during the
1970s and 1980s (table 3). To focus more directly on the changing patterns of growth in recent
years, we define two additional groups of states. The first, designated as "traditional
3 The exceptions are 1950 and 1960, the end of an era of very low immigration.
610

immigration" states, includes the principal destinations of the great wave of immigrants during
1880-1920, that is, the immigrants from southern and eastern Europe. We define this group of
eight states as those with 250,000 or more immigrants in the 1920 Census and that are not in the
top six in 1999: Massachusetts, Connecticut, Pennsylvania, Ohio, Michigan, Wisconsin,
Minnesota, and Washington. The remaining 37 states are designated as "nontraditional
immigration" states (and will be further subdivided below).
During the 1990s, the immigrant population in the traditional immigration states grew
even more slowly than in the six largest immigrant states, by 23 percent (table 3). However,
even this modest growth greatly exceeds the 1.4 percent growth for each of the previous two
decades in these traditional immigration states. The remaining 37 nontraditional immigration
states4which historically have received comparatively few immigrantssaw their immigrant
populations grow by an astounding 71 percent in the 1990s. These states had only 15 percent of
the foreign-born at the beginning of the decade, 3.0 million out of 19.7 million, but accounted for
31 percent of the growth in the foreign-born population between 1990 and 1999, or 2.1 million
out of 6.8 million (table 3). We can further disaggregate the non-traditional immigration states
into the 19 with the fastest foreign-born growth rates during the 1990s; we designate these as the
"new growth" states,5 and the remaining 18 as "other" states (figure 3). In these "new growth"
states, the foreign-born population grew by a dramatic 95 percent during the 1990s.
4 Total of "New Growth" and "Other" states in table 3. See below for further definition.
5 The nontraditional immigration states are split between the 19 "new growth" states that grew faster during 1990-1999 than the fastest growing of the "top six" states (i.e., Texas at 53 percent). The new growth states, in order fromlargest 1999 foreign-born population to smallest, are: Arizona, Maryland, Virginia, North Carolina, Georgia,Nevada, Oregon, Colorado, Kansas, Oklahoma, Utah, South Carolina, Iowa, Kentucky, Idaho, Alabama, Arkansas,Nebraska, and Mississippi. See figure 3.
7

Figure 3. Immigration Growth Categories for States
,e7,0
Immigration Categories
Major Desenatlone (70% of Immigrants) (8)Traditional States (>2508 in 1920) (8)
LI New Growth States (1980-99 > 50%) (19)LI Other States (18)
Source: Urban Institute 2001.
In the six states with the largest numbers of immigrants, growth has not been uniform
during the 1990sTexas and Florida experienced faster growth rates than California, New York,
New Jersey, and Illinois. California, after decades of growth exceeding the national rate, saw the
growth rate of its immigrant population slow from 103 percent in the 1970s to 80 percent in the
1980s to only 24 percent in the 1990swell below the national average of 34 percent. As a
result, California's share of the national foreign-born population dropped slightly from
33 percent in 1990 to 30 percent in 1999, the first time its share decreased in the 20th century.
When we examine more closely the growth patterns of the 1990s, we see that the slowed
growth in California occurred in the second half of the decade. The foreign-born population of
California reached 8 million during 1994-1996,6 with the immigrant population growing by
6 The official CPS figures for 1994 and 1995 suffered from a weighting problem that erroneously reduced theweights of Asians, American Indians, and also the foreign-born population. Passel (1998) produced correctedweights by approximating the proper weighting procedures. The new weights increase the size of the foreign-born(Continued)
BEST COPY AVAILABLE
812

roughly 20 percent from 6.5 million in 1980. But, since reaching 8 million by 1996, the
foreign-born population in California remained unchanged for 1997-1999.
This new pattern of dramatically reduced growth of the foreign-born population in
California (or no growth at all) raises questions about the extent to which the lessened growth
can be accounted for by lower levels of in-migration, both from abroad and from other states,
versus increased amounts of out-migration. Changes in California's political climate, as
evidenced by its anti-immigrant legislation and rhetoric, may have played a role, but this factor is
not the subject of our research.
INTERNATIONAL AND INTERNAL MIGRATION
The slow growth of the foreign-born population in the states with the largest numbers of
immigrants can be accounted for by both a decline in the number of new immigrants settling in
those states and a new pattern of more immigrants moving out of those states than moving in.
The relative strength of the three flows (immigration from abroad, in-migration from other states,
and out-migration to other states) varies considerably across the top six states.7 The reduced
immigration from abroad combined with net internal out-migration of the foreign-born is a new
pattern appearing in the 1990s for the six states combined and is especially pronounced for
California.
population nationally and in California. The shares for California are not affected by the reweighting, but theforeign-born totals are. For 1994, the official CPS shows a foreign-born population in California of 7.45 millionversus the corrected figure-from table 2 of 8.01 million; for 1995, 7.76 million versus 8.25 million. By 1996, whenthe Census Bureau had corrected its weighting procedures, California's foreign-born population was 8.06 million.Thus, the year when California reached 8 million immigrants falls in the 1994-1996 period.7 Mortality and emigration from the United States also affect the size of the foreign-born population. The lattercomponent is not insignificant, but has proved difficult to measure, especially with any geographic specificity within(Continued)
913

Immigration flows to big states large but declining
In 1990, the top six states had 73 percent of the foreign-born population, but during the
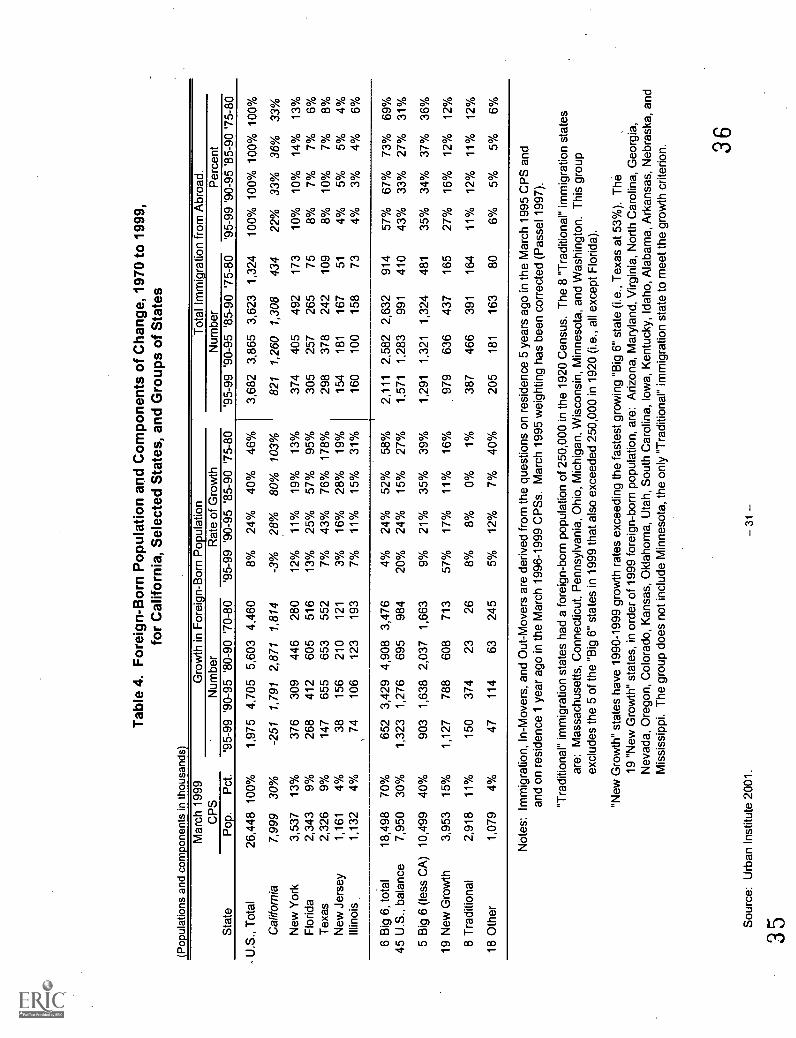
1990s, they received only 63 percent of all new immigrants8 (tables 3 and 4). California, for its
part, had 33 percent of the foreign-born population in 1990 but received only 28 percent of all
new immigrants, or 2.1 million out of 7.5 million. Most of this reduction occurred in the late
1990s (1995-1999), when California received only 22 percent of all immigrants coming to the
United States versus the 1990-1995 period when it received 33 percent of new immigrants. In
fact, if California had received in the late 1990s the same share of immigrants it had been
receiving in the late 1980s (36 percent), it would have received about 400,000 additional
immigrantsor 50 percent more than it did. Among the top six states, only Texas received its
proportionate share of the immigration flow during the 1990s; that is, only Texas received as
large a share of the newly arriving immigrants as its share of the foreign-born population at the
beginning of the 1990s.
The geographic distribution of new immigrants during the 1990s can be described as a
redirection of part of the immigration stream from California and the other large immigrant states
into the new growth areas. The 8 traditional immigration states and the 18 other states each
received approximately their share of the new in-flows from abroad, getting 11 percent and
6 percent respectively while representing 12 percent and 5 percent of the initial population. The
new growth states, on the other hand, had only 10 percent of all foreign-born in 1990 but
received more than double that share (21 percent) of the new immigrants arriving in the 1990s.
the United States. Changes in emigration patterns may also explain some of the geographic shifts, but we are unableto measure them.
8 New immigrants are defined as foreign-born persons who lived outside the United States the previous year, basedon the CPS questions on nativity, citizenship, and residence one year ago.
10
14

In terms of absolute numbers, then, the new growth states received almost as many new
immigrants during the 1990s as had been living there in 1990 1.6 million new immigrants
compared to 2.0 million resident immigrants in 1990 (table 4).
Foreign-born moving out of big immigrant states and into new growth states
In addition to receiving fewer international migrants, most of the top six states lost
foreign-born to other states through net out-migration during the 1990s. Together, California
and New York had 465,000 immigrants move out of their states to others (219,000 and 246,000
respectively). Unlike California though, New York had been losing immigrants to internal
migration since the 1970s. Among the other top six states only Florida (127,000) and Texas
(27,000) gained from net internal migration of the foreign-born during the 1990s (table 4).
These patterns of slowing international migration to the top immigration states in the
1990s (at least in relative terms) and increasing internal out-migration from these states represent
a turnaround from previous decades. In the latter half of both the 1970s and 1980s, the top
six states as a group increased their share of the foreign-born population by receiving more than
their share of immigrants from abroad while neither gaining nor losing much from internal
migration of the foreign-born to other states.9
9 .During 1975-1980, the top six states received 69 percent of immigration from abroad when they represented
62 percent of the foreign-born in 1970 (table 4); similarly for 1985-1990, they received 73 percent of newimmigration but represented 67 percent of the foreign-born population in 1980. Net internal migration of theforeign-born was negligible for both periods, +5,000 for 1975-80 and 16,000 for 1985-90. California's net lossthrough internal migration in the 1990s represents a turnaround from the previous two periods as it gained 29,000 in1975-1980 and 57,000 in 1985-1990. Florida, which gained 128,000 internal migrants in the 1990s, also gainedsubstantial numbers in the latter half of the 1970s (56,000) and the 1980s (129,000).. New York, on the other hand,lost substantial numbers ,during all three periods while Illinois also lost, but smaller numbers. New Jersey had quitesmall changes, both gains and losses. Texas patterns differed in that it gained during the 1970s, lost during the1980s, gained chiring the first half of the 1990s, and lost during the second half.
15 BEST COPY AVAILABLE

Mirroring settlement patterns of new immigrants, internal migration has been redirected
into the new growth states, as the traditional immigration states showed a rough balance between
in- and out-migration of the foreign-born. While the new growth states gained through internal
migration during the 1970s and 1980s, their growth in foreign-born population from internal
migration" has been massive in the 1990s. Almost as many foreign-born moved into the new
growth states from other states during the 1990s (1.3 million) as moved in from abroad (1.6
million). (see Table 4.) Their net growth of 539,000 foreign-born from internal migration
during the 1990s represented over one-quarter of the total growth of their foreign-born
population during the decade.
California's natives also moving out
Though the numbers of immigrants moving out of California and some of the other big
immigrant-receiving states are large, immigrants are moving out at slower rates than natives.
The out-migration rates from California and in-migration percentages into California for
immigrants are about one-third to one-half those of natives (figure 4, page 12). For example,
persons in immigrant households had an out-migration rate from California of 4.1 percent for
1995-1999 while native households moved out at a rate of 8.1 percent (table 5). For the same
period, the percentages of in-movers from other states were 2.5 percent for immigrant
households and 6.5 percent for native households.1° Clearly, many of the same forces that have
led to immigrant net migration out of California have led to even greater net out-migration of
natives.
10The out-migration rate is defined as the number of migrants to other states during the period divided by the sum
of the nonmigrants plus the out-migrants. The in-migration percentage is defined as the number of migrants fromother states into California divided by the sum of California's nonmigrants plus the in-migrants.
12
16 BEST COPY AVAILABLE

Figure 4. Migration Rates by Age and Nativity, for California: 1995-1999Annual Out-Migration Rate or In-Migration Percentage per 1,000
50
40
-30
20
10
Nativity of Family Householder or Individual
4Foreign-Born Out-Migration from California - 11 per 1,000
0 - Foreign-Born hi-Migration to California - 6 per 1,000
Native Out-Migration from California - 22 per 1,000
Native hi-Migration from California - 17 per 1,000
0-4 5-9 10-14 15-19 20-24 25-29 30-34 35-39 40-44 45-49 50-54 55-59 60-64 65-69
Age Group
Source: Urban Institute 2001. Authors' tabulations from March 1996-1999 CPS. See text for definitions.
'70-74 75+
The full impact of these migration streams on the states' populations is even greater than
the figures discussed previously on migration of the foreign-born population. Many of the
foreign-born migrants move as family and household units, and these units include sizable
numbers of natives, particularly children. To illustrate this impact, we define foreign-born
households as all persons in family households in which either the head or spouse is
foreign -born, regardless of the individual's nativity plus all foreign-born in nonfamily
households. With this definition, California's net population loss from internal migration of
foreign-born households during the 1990s was 363,000, compared to 219,000 when using
individual nativity as a lens. Virtually all of the difference is accounted for by the inclusion of
native-born children in immigrants' households.
BEST COPY AVAILABLE13
17

WHO IS MOVING AND WHO IS STAYING?
The rising share of immigrants choosing io settle in places other than California and the
other five large immigrant-receiving states and, especially, the net-movement out of California
raises the question of who is moving and who is staying. We uncovered few differences between
the characteristics of immigrants moving out of California and immigrants moving in or staying
put. Similarly, the differences between native movers and immigrant movers generally reflect
underlying differences in the two. population groups."
Mexicans more likely to move out of California
A closer examination of the population moving out of California reveals that nearly all of
the net movement out of California by immigrants during the 1990s is accounted for by
Mexican-born immigrants. Among the adult foreign-born population, Mexicans made up
103,000 out of 109,000 total net out-migrants from California between 1995 and 1999
(table 6).12 While new settlement patterns for Mexican immigrants in the United States have
been noted by several analysts (Durand et al. 2000, Passel 1997), the role of interstate migration,
especially migration out of California, has not been. Again, the CPS is limited in providing data
to differentiate movers from nonmovers, but the data suggest a significant role for employment
opportunities.
H The relatively small sample size in the CPS for interstate movers among the immigrant population limits thepotential scope of such analyses. Nonetheless, Appendix table D shows some results for socioeconomic differencesbetween migrants and nonmigrants, natives and the foreign-born. Census 2000 will provide sufficiently detaileddata to pursue such analyses.12 Note that there is sizable out-movement of Asians, as well-110,000 versus 140,000 Mexicans moving to otherstates.
14
18

Text Table A. Mean Earnings for Mexican-Born Males Aged 18-64 Years,by Mobility Status, for California and the Rest of the United States: March
1996-1999 CPS
StateAndStatus
Males withEarnings
(000s)AverageEarnings
CaliforniaStayed in California 1,319 $18,500From abroad 121 $14,200In-mover 23 $15,100Out-mover 70 $23,800
Other StatesStayed in state 1,407 $18,400From abroad 260 $ 9,200Intrastate mover 140 $13,000
Notes: "Stayed" is an average of nonmovers and within-state movers for March CPSfrom 1996-1999 CPS. Moversfrom abroad, in-movers, and out-movers--arethe total across the four CPSs. All data are from the residence one year agoquestion.
"California" includes persons whose current or previous residence is California.Movers in "Other States" excludes persons moving to or from California.
Although Mexican immigrants tend to have low-incomes and work in blue-collar jobs,
the men tend to have very high rates of labor force participation rates. Not surprisingly, Mexican
immigrants from abroad tend to have lower incomes than the immigrants already residing in the
United States. Immigrants to California have, on average, higher incomes than Mexican
immigrants to other states. Most striking, however, is that the average earnings for Mexican
males aged 18-64 moving out of California ($23,800) exceed, by a substantial amount, not only
those who moved into California from other states ($15,100) but also those who stayed in
California ($18,500). (See Text table A, page 15.) While Mexican out-movers from California
earned substantially more than those who stayed in California, movers out of other states earned
substantially less than those who stayed put.
15
19
Reasons for moving
A full investigation of factors associated with movement of immigrants to and from
California to try to ascertain potential causes is beyond the scope of this report. However, the
high wages reported by Mexicans leaving California, noted above, suggests an important role for'
economic factors, namely that they are leaving for better-paying jobs.13 Although a broader
investigation is clearly warranted, the CPS supplies some data with which to address the
underlying factors. Beginning in March 1998, the Census Bureau began collecting new
information from respondents on the principal reason why they moved.
The data in table 7 suggest that almost half of immigrants and interstate movers, both
native and foreign-born, give employment as the principal reason for moving, whereas only
one-eighth of intrastate movers do so. A slightly higher share of native in-movers than
foreign-born give a job as the principal reason (53 percent versus 43 percent). 14 Among
immigrants, a slightly higher share of out-movers (47 percent) than either in-movers (43 percent)
or immigrants from abroad (41 percent) lists a job. The other key reasons provided for moving
are family and housingboth for foreign-born and natives. For intrastate movers, more than
half of immigrants and natives give housing as their principal reason for moving. Immigrants
from abroad are much more likely than any other group to list family reasons as primary; the
high prevalence of this reason is not surprising given that family unification is the principal route
for legal immigration to the United States. Overall, the reasons for moving are strikingly similar
for native and immigrants, but especially so for persons moving out of California.
13 Since the CPS does not tell us when in the last year the person moved, it is difficult to tease out whether thathigher income resulted from higher earnings in California prior to moving or from higher earnings after leavingCalifornia.
14 We should note, however, that the sample sizes are quite small.
16-
20

Macroeconomic factors almost certainly play a role in determining migration patterns.
For the 1985-1990 period, there is a strong association between employment growth and
mobility patterns of the foreign-born population. For the five-year period, there is a correlation
of 0.41 between the in-migration rate of immigrants from other states and overall employment
growth; for the out-migration rate to other states, the correlation was negative, as expected-
-0.27. The resulting correlation between the net internal migration rate of immigrants and the
overall rate of employment growth was 0.74. For the 1995-1999 period, the correlations are
substantially smaller, but the much smaller CPS sample sizes affect the result. The correlations
with overall employment growth are 0.11, 0.29, and 0.33 for the in-migration, out-migration,
and net migration rates, respectively. 15
One possible explanation for these mobility patterns is that California serves as an initial,
but not the final, destination for many Mexican immigrants. They may come directly to
California from Mexico, work there, and gain skills and knowledge. Once they have established
themselves, the Mexicans can move to another state where greater opportunities may await them.
In fact, many immigrants moving out of California and into the new growth states are finding
both higher-paying jobs and lower costs of living. We have not been able to ascertain whether
this pattern is new for the late 1990s. It does seem clear, however, that the movement of
Mexicans out of California is larger than in the past. Possible factors in this movement are likely
to include greater differences in earnings for out-movers, the availability of relatively
well-established communities of Mexican immigrants in other states, and a more widespread
recognition of the available opportunities.
15 The correlations are computed using weights representing the size of the foreign-born population at the beginningof the period.
17
21

WELFARE AND MOBILITY
Although the CPS does not list "welfare" as a reason for moving, it is worth revisiting the
question of whether immigrants are settling in specific states or moving to states that have the
most generous welfare programs or social safety nets.16 This issue becomes even more
important following the passage of the 1996 Personal Responsibility and Work Opportunity
Reconciliation Act (PRWORA), the 1996 federal welfare reforms that restrict immigrants'
accessto benefits, including food stamps, Temporary Assistance for Needy Families (TANF, the
main welfare program), Medicaid, and Supplemental Security Income (SSI). Further, welfare
reform shifted broad new authority to the individual states to decide whether and under what
conditions to provide federal and state-funded assistance to immigrants. While virtually all
states have kept immigrants who entered before PRWORA's passage in 1996 eligible for
benefits, assistance to post-1996 entrants is far more uneven across the states (Zimmermann and
Tumlin 1999).
Borjas (1999), in his most recent book and other research suggests that immigrants settle
where they do, in part, because of the availability of welfare. He particularly makes this claim
for the concentration of immigrants in California. Our analysis paints a quite contrary picture.
California has made perhaps the most generous choices toward immigrants by providing
substantial state-funded assistance to replace lost federal benefits. These decisions coincide with
the trends noted earlier that have seen California's foreign-born population literally stop growing
since the federal immigrant eligibility restrictions were enacted in 1996. Further, this slow down
16 Also not captured in the CPS, of course, is the degree to which anti-immigrant sentiment in Californiaembodied in Proposition 187drove immigrants out of California.
18
22

in growth is occurring because fewer immigrant are choosing to move into the state, either from
abroad or other states, and more are leaving for other states.
Looking beyond California, the states that have made the most generous choices by
making welfare more accessible to immigrants (figure 5, page 20) to the states with the fastest
growing foreign-born populations (figure 3, page 7), we see little overlap. As a group, the states
with the fastest growth in foreign-born population during the 1990s (i.e., the "new growth"
states") are, in fact, the ones that have made services less available to immigrants. The highest
two categories in terms of availability of the welfare safety net had foreign-born growth rates
below average (25 percent and 29 percent) whereas the lowest two categories had growth rates
well above average (75 percent and 49 percent); the pattern in terms of strength of the welfare
safety net was virtually identical (see table 8a). In addition, the states with lesser availability of
welfare also received more than their share of immigrants from abroad during the 1990s
21 percent of the immigrants versus 10 percent of the 1980 foreign-born population (tables 8a
and 8b).
19
23
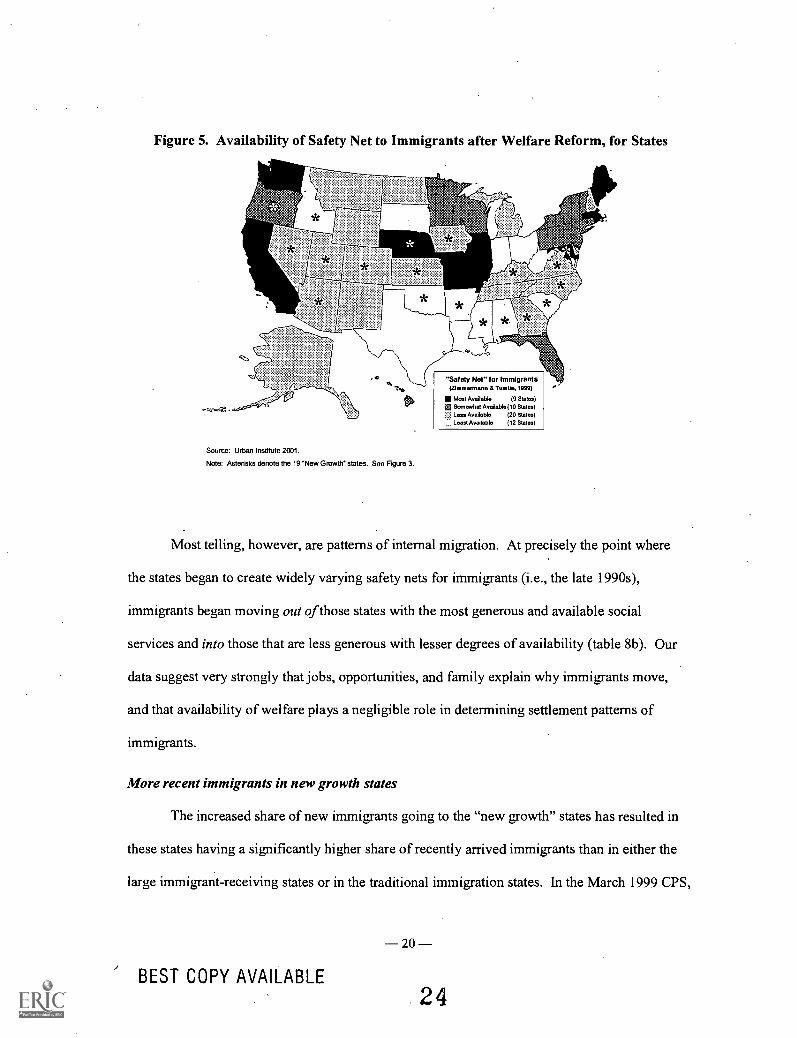
Figure 5. Availability of Safety Net to Immigrants after Welfare Reform, for States
aC
*
* *
Source: Urban Institute 2001.
Note: Asterisks denote the 19 "New Growth' states. See Figure 3.
*
* **
* ** * *
"Safety Not for Immigrants(Zimmermann 6 Tumlin, 1999)
Most Available (9 States)gp Sanewhat Avolable(10 States)p Less Available (20 States)
Least Available (12 States)
Most telling, however, are patterns of internal migration. At precisely the point where
the states began to create widely varying safety nets for immigrants (i.e., the late 1990s),
immigrants began moving out of those states with the most generous and available social
services and into those that are less generous with lesser degrees of availability (table 8b). Our
data suggest very strongly that jobs, opportunities, and family explain why immigrants move,
and that availability of welfare plays a negligible role in determining settlement patterns of
immigrants.
More recent immigrants in new growth states
The increased share of new immigrants going to the "new growth" states has resulted in
these states having a significantly higher share of recently arrived immigrants than in either the
large immigrant-receiving states or in the traditional immigration states. In the March 1999 CPS,
BEST COPY AVAILABLE
20
24

11 percent of the foreign-born population in the top six immigrant-receiving states had entered
the country within the last three years (i.e., 1996-1999). In contrast, 21 percent of the
foreign-born population in the new growth states had entered the country in the last three years.
Given that the new growth states are among the least generous, the post-1996 immigrants are
disproportionately represented in states with the weakest safety nets. These new growth states,
with little experience integrating immigrants, will not only have more immigrants to deal with
but will have a large share of immigrants who have recently arrived and are themselves
unfamiliar with U.S. customs and institutions. Hence, the new growth states may face a greater
relative burden than other states.
CONCLUSION
During the 20th century the U.S. foreign-born population became increasingly
concentrated in just a few states. The post-1965 increases in immigration levels and shifts in
origins reinforced the trend toward geographic concentration with a specific tilt toward
California, especially, but also Texas and Florida. By 1990, more than one-third of all
immigrants lived in California and more than 70 percent in the top six states. There was every
reason to expect this growing concentration to continue since more than one-third of all new
immigrants were headed for California and the state was receiving more foreign-born migrants
from other states than it lost to them. These patterns continued through the early 1990s.
Beginning in the 1990s a dramatic shift occurred. The share of the immigrant population
living in the six states with the largest immigrant populations declined for the first time in
decades, dropping from more than 73 percent to below 70 percent in 1999. California's share
slipped from 34 percent to 30 percent as its foreign-born population stopped growing during the
21
25

latter half of the 1990s. This shift occurred as a result of a large drop in the share of immigrants
settling in California and a net flow out of the state among the settled immigrant population, an
outflow made up primarily of low-skilled Mexican-born immigrants.
Meanwhile, the immigrant population overall has continued to grow, but many
immigrants are settling in new places. Our analysis shows that the share of growth and
population lost by California (and the other top six states) was almost entirely shifted to a group
of 19 "new growth" states. These states are in a swath reaching all the way across the entire
country and are generally experiencing healthy levels of job and population growth overall.
The shifts in settlement patterns of the foreign-born population fit well within the
implications of migration theories. Prior to 1990, a very high percentage of immigrants settled in
a few areas where previous immigrants had settled. Then, in the 1990s (and perhaps earlier),
some small shifts occurred. A new immigrant (or perhaps a migrant from California) ended up
in a nontraditional area. There were few immigrants in these areas, but the settlers found jobs,
economic opportunity, and hospitable living conditions. Over time, friends, relatives, and
countrymen of the original immigrants moved to the new areas from California and other
traditional settlement areas. Then, new immigrant streams developed, bypassing the traditional
settlement states and going directly to the new areas (see Massey et al. 1993). This stereotypical
tale of migration fits very well with the pattern shown by our datanet internal migration into
the new growth areas in the early 1990s followed by a shift in destinations of new immigrants in
the late 1990s.
This dispersal of the immigrant population to new settlement areas is occurring at the
same time that federal welfare reform devolved to the states new policymaking authority and
fiscal responsibility for immigrants. These coinciding trends of dispersal and devolution raise
22
26

the question of whether immigrants are moving to states providing the most generous benefits to
them. Our analysis indicates that this is, indeed, not the case as immigrants appear to be moving
mainly for higher-paying jobs in areas of growing employment.
The new dispersal trends outlined here raise a number of questions that still need to be
examined. These include:
How will immigrants integrate into next destination communities? Will patterns ofintegration differ substantially from patterns of integration seen in the moretraditional destinations?
How will states respond to growing immigration? The new growth states have highershares of post-1996 immigrants than other states, yet they have made among the leastgenerous choices with regard to eligibility for benefits. Over time the number andshare of these immigrants will only grow, raising the question of how they will fare instates with comparatively weak safety nets and little experience integratingimmigrants.
What impact will immigration growth have on local labor markets, schools, the healthcare system, and the nonprofit structure, especially in light of the recent slowing ofthe country's economic expansion?
These new settlement patterns have not been fully incorporated into "common
knowledge" or demographic and social databases. The critical nature of immigration for
understanding population change is underscored by the early results from Census 2000 which
found significantly more people than expected overall and approximately 10 percent more
Hispanics and Asians than anticipated," groups especially affected by the new immigration
patterns (Passel 2001). The Hispanic population grew much faster between the 1990 and 2000
Censuses in the new immigration states than elsewhere-127 percent from 2.3 million to
5.3 million versus 43 percent in California, 48 percent in the top six immigration states,
23
27

71 percent in the traditional immigration states, and only 52 percent in the remaining states. A
very similar pattern shows up for Asians with 111 percent growth in the new immigration states_
versus 52 percent in California, 64 percent in the top six immigration states, 93 percent in the
traditional immigration states, and 52 percent in the remaining states.
Further, initial analysis of the state data shows at least two results that can be traced to
immigration patterns. First,;he census count for the total population of California was somewhat
lower than the predictions based on population estimates. This result is particularly notable in a
context where the overall count is 5 million or more above expectations and the national totals
for the state's principal minorities are well above expectations. Second, the census counts for
Hispanics and Asians are disproportionately higher in the new growth states than in other
states. 18 Put simply, this pattern of systematically higher-than-expected counts for Hispanics and
Asians overall, but especially in the new growth states, combined with a low count for California
arose because the Census Bureau failed to fully measure immigration and relied on data from the
1980s to estimate where the new immigrants were settling rather than data reflecting the patterns
we describe in this report. Analysts who relied on the Census Bureau's population estimates and
INS data on immigration could easily have missed the full impact of the new settlement patterns
(e.g., Frey and DeVol 2000).
Eventually, the data from Census 2000 will permit further investigation of the
immigration and settlement patterns described here. These new data should not only reinforce
17 Census 2000 counted 35.3 million Hispanics whereas the Census Bureau estimated this group at 32.2 millionprior to the census; for the Asian and Pacific Islander population the census count was 12.3 million versus anestimate of 11.1 million.18
For some states the degree of underestimation for the Hispanic population was particularly notable. Georgia'scensus count of Hispanics at 435,000 was 72 percent higher than the Census Bureau's estimate of 254,000; theNorth Carolina count of Hispanics at 379,000 was more than double the estimate of 186,000.
24
28

our results, but may ultimately describe even greater shifts.° The census can provide
significantly more detail in terms of geographic specificity (i.e., metropolitan areas and cities in
addition to states) and the characteristics of immigrants and migrants to study settlement
patterns. Finally, settlement and integration patterns, particularly for local areas, can be
addressed in much more detail with the census data than is possible with the CPS.
19 The CPS data, by definition, understated the degree of growth in the Hispanic and Asian populations because theyincorporate the Census Bureau's national population estimates. Further, even though we show more rapid growth ofthe immigrant population in the new growth areas, the census results suggest that the CPS understated groWth ratesin the new areas, but not in the biggest immigrant states.
25
29

REFERENCES
Borjas, George G. 1999. Heaven's Door: Immigration Policy and the American Economy.Princeton, N.J.: Princeton University Press.
Durand, Jorge, Douglas S. Massey, and Fernando Charvet. 2000. "The Changing Geography ofMexican Immigration to the United States: 1910-1996. Social Science Quarterly 81(1):1-15.
Espenshade, Thomas J. and Charles A. Calhoun. 1993. "An Analysis of Public Opinion TowardUndocumented Immigration." Population Research and Policy Review 13: 189-224.
Frey, William H. and Ross C. DeVol. 2000. America's Demography in the New Century:Aging Baby Boomers and New Immigrants as Major Players. Policy Brief Number 9.Santa Monica: Milken Institute.
Fix, Michael and Wendy Zimmermann. 2001. "The Integration of Immigrant Families in theUnited States." In The Citizens' Commission for Civil Rights Biennial Report on FederalCivil Rights and Enforcement. Washington, D.C.: Citizen's Commission on Civil Rights.Forthcoming.
Passel, Jeffrey S. 1997. "Recent Trends in Mexican Migration to the United States" Programfor Research on Immigration Policy Paper. Washington, D.C.: Urban Institute.Presented at colloquium on Contributions of Mexican Migration to United States Society,Mexico City, Instituto Nacional de Migracion.
. 1998. "Issues on the Foreign-Born Population in the Current Population Survey."Memorandum for CPS Users. Washington, D.C.: Urban Institute. December.
. 2001. "Some Thoughts on Undocumented Immigration, Census 2000, DemographicAnalysis, A.C.E., and the CPS." Research note. Washington, D.C.: Urban Institute.March 20.
U.S. Census Bureau. 1999. Historical Census Statistics on the Foreign-born Population of theUnited States: 1850-1990 by Campbell J. Gibson. Population Division Working PaperNo. 29. Washington, D.C. February.
Zimmermann, Wendy and Karen C. Tumlin. 1999. Patchwork Policies: State Assistance forImmigrants under Welfare Reform. Assessing the New Federalism, Occasional PaperNumber 24. Washington, D.C.: Urban Institute.
26
30

Table 1. Foreign-Born Population, for Regions, Divisions, and States: 1850 to 1999
Division 8 state 1999 1990 1980 1970 1960 1950 1940 1930 1920 1910 1900Total 26,448 19,767 14,080 9,619 9,738 10,347 11,595 14,204 13,921 13,516 10,341
Top 6% Top 6% Top 6 from 1990Changes in Top 6
18,49869.9%69.9%
0
14,41772.9%72.9%
0
9,46567.2%67.2%
1
6,16664.1%62.2%
1
6,11562.8%56.5%
0
6,56463.4%52.8%
0
7,34763.4%50.3%
1
8,73761.5%48.3%
1
8,01757.6%42.8%
1
7,71457.1%40.6%
2
5,75655.7%37.4%
0
% in California 30.2% 32.7% 25.4% 18.3% 13.8% 10.2% 8.0% 7.6% 5.4% 4.3% 3.6%
Rank 1 CA CA CA NY NY NY NY NY NY NY NYRank 2 NY NY NY CA CA CA PA IL PA PA PARank 3 FL FL FL NJ IL IL IL PA IL IL ILRank 4 TX TX TX IL NJ PA CA CA MA MA MARank 5 NJ NJ IL FL PA MA MA MA CA NJ MI
Rank 6 IL IL NJ MA MA NJ . NJ MI NJ OH WIPercent by State
Rank 1 30.2% 32.7% 25.4% 21.9% 23.5% 24.9% 25.2% 23.0% 20.3% 20.3% 18.4%Rank 2 13.4% 14.4% 17.0% 18.3% 13.8% 10.2% 8.4% 8.7% 10.0% 10.7% 9.5%Rank 3 8.9% 8.4% 7.5% 6.6% 7.0% 7.6% 8.4% 8.7% 8.7% 8.9% 9.3%Rank 4 8.8% 7.7% 6.1% 6.5% 6.3% 7.6% 8.0% 7.6% 7.8% 7.8% 8.2%Rank 5 4.4% 4.9% 5.9% 5.6% 6.2% 7.0% 7.4% 7.5% 5.4% 4.9% 5.2%Rank 6 4.3% 4.8% 5.4% 5.1% 5.9% 6.1% 6.0% 6.0% 5.3% 4.4% 5.0%
STATESNew England Rank Rank Rank Rank Rank Rank Rank Rank Rank Rank Rank
Maine 34 42 36 38 43 35 43 24 60 22 74 21 84' 19 101 21 108 22 111 23 93 22New Hampshire 51 41 41 37 41 36 37 27 45 26 57 24 68 25 83 24 91 26 97 26 88 25Vermont 20 47 18 46 21 45 18 38 23 36 28 35 32 33 43 32 45 33 50 31 45 31
Massachusetts 696 7 574 7 501 7 495 6 576 6 721 5 858 5 1,066 5 1,089 4 1,059 4 846 4Rhode Island 93 30 95 24 84 25 74 19 86 17 113 15 139 14 172 14 175 16 179 16 135 17
Connecticut 317 14 279 13 268 11 262 11 276 10 296 9 329 9 385 11 378 11 330 11 238 12Middle Atlantic
New York 3,537 2 2,852 2 2,389 2 2,110 1 2,289 1 2,577 1 2,917 1 3,262 1 2,825 1 2,748 1 1,900 1
New Jersey 1,161 5 967 5 758 6 635 3 615 4 635 6 699 6 850 7 742 6 661 5 432 9Pennsylvania 407 13 369 8 401 9 446 7 603 5 784 4 977 2 1,240 3 1,393 2 1,442 2 985 2
East North CentralOhio 263 20 260 15 302 10 316 9 397 8 440 8 521 8 649 8 680 8 598 6 459 8Indiana 112 26 94 25 102 21 83 16 93 16 99 16 111 17 143 17 151 17 160 18 142 16Illinois 1,132 6 952 6 824 5 629 4 686 3 786 3 972 3 1,242 2 1,211 3 1,205 3 967 3
Michigan 418 12 355 9 417 8 424 8 530 7 604 7 686 7 853 6 729 7 598 7 542 5
Wisconsin 108 27 122 20 125 17 131 13 172 13 217 11 289 11 388 10 460 10 513 10 516 6West North Central
Minnesota 284 17 113 22 107 20 98 15 144 14 211 12 295 10 391 9 487 9 544 9 505 7Iowa 82 33 43 36 48 33 40 25 56 24 84 20 117 15 168 15 226 14 274 12 306 11
Missouri 121 24 84 27 86 23 66 22 78 18 91 17 115 16 153 16 187 15 230 15 216 13North Dakota 4 51 9 49 15 49 18 39 30 33 48 25 74 23 106 20 132 19 157 19 113 19South Dakota 7 49 8 50 10 51 11 47 19 40 31 33 44 28 66 28 83 27 101 25 89 24Nebraska 61 39 28 41 31 40 29 31 40 27 58 23 82 21 119 18 151 18 177 17 177 15Kansas 128 23 63 30 48 32 28 33 33 29 38 29 52 27 81 25 111 21 135 20 127 18
South AtlanticDelaware 32 45 22 44 19 46 16 44 15 45 13 45 15 41 17 41 20 41 17 44 14 43Maryland 508 9 313 11 196 13 124 14 94 15 85 18 83 20 96 23 103 24 105 24 94 21
District of Columbia 56 40 59 32 41 37 34 28 39 28 43 28 35 31 31 35 29 39 25 39 20 37Virginia 495 10 312 12 177 14 72 20 48 25 36 30 23 36 24 37 32 36 27 38 19 38West Virginia 21 46 16 47 22 44 17 41 24 35 34 31 42 29 52 30 62 29 57 29 22 35North Carolina 307 15 115 21 78 26 29 32 22 37 15 41 9 46 9 47 7 48 6 49 4 49South Carolina 86 32 50 34 46 34 14 45 11 47 7 49 5 49 5 49 7 49 6 48 6 48Georgia 288 16 173 16 91 22 33 29 25 34 16 39 12 42 14 44 17 43 15 46 12 45Florida 2,343 3 1,663 3 1,059 3 540 5 272 11 131 14 78 22 70 27 54 31 41 34 24 34
East South CentralKentucky 80 34 34 39 35 39 17 42 17 41 16 40 16 39 22 40 31 37 40 36 50 30Tennessee 73. 37 59 31 48 31 19 37 16 42 14 42 11 44 13 45 16 45 19 43 18 39Alabama 77 36 44 35 39 38 16 43 15 44 13 43 12 43 16 42 18 42 19 42 15 41Mississippi 33 44 20 45 24 41 8 49 8 50 9 48 6 48 8 48 8 47 10 47 8 47
West South CentralArkansas 67 38 25 42 22 43 8 48 7 51 9 47 8 47 11 46 14 46 17 45 14 42Louisiana 107 28 87 26 86 24 40 26 31 32 30 34 28 34 37 33 46 32 53 30 53 29Oklahoma 105 29 65 29 56 27 20 35 20 39 18 37 21 37 31 36 40 35 40 35 21 36Texas 2,326 4 1,524 4 856 4 310 10 299 9 278 10 236 12 362 12 364 12 242 14 179 14
MountainMontana 11 48 14 48 18 47 20 36 31 31 43 '27 56 26 76 26 96 25 95 27 67 26Idaho 78 35 29 40 23 42 13 46 16 43 20 36 25 35 32 34 41 34 43 33 25 32Wyoming 6 50 8 51 10 50 7 51 10 48 13 44 17 38 23 39 27 40 29 37 17 40Colorado 255 21 142 18 114 18 60 23 60 23 61 22 72 24 100 22 119 20 130 21 91 23New Mexico 113 25 81 28 52 29 23 34 21 38 17 38 15 40 24 38 30 38 23 40 14 44Arizona 671 8 278 14 163 15 77 17 70 20 47 26 39 30 66 29 81 28 49 32 24 33Utah 93 31 59 33 50 30 30 30 32 30 31 32 33 32 48 31 59 30 66 28 54 28Nevada 274 18 105 23 54 28 18 40 13 46 11 46 11 45 15 43 16 44 20 41 10 46
PacificWashington 425 11 322 10 239 12 156 12 179 12 197 13 210 13 255 13 265 13 256 13 111 20Oregon 266 19 139 19 108 19 66 21 71 19 85 19 90 18 110 19 108 23 113 22 66 27California 7,999 1 6,459 1 3,580 1 1,758 2 1,344 2 1,060 2 925 4 1,074 4 758 5 586 8 367 10Alaska 33 43 25 43 16 48 8 50 8 49 (X) (X) (X) (X) (X) (X) (X) (X) (X) (X) (X) (X)Hawaii 183 22 163 17 137 16 76 18 69 21 (X) (X) (X) (X) (X) (X) (X) (X) (XLX) (X) (X)
Note: Populations in thousands. "(X)" is not aoolicable. Bold face entries are new states in the too 6. Italics are states that drooped out of the too 6.Italics am states that dropped out of the top 6. Data for 1900 for Oklahoma include Oklahoma Territory and the Indian Territory;
Source: U.S. Bureau of the Census (1999); authors' tabulations from March Current Population Surveys.
Source: Urban Institute 2001. - 27 -
31BEST COPY AVAILABLE

Table 1. Foreign-Born Population, for Regions, Divisions, and States:1850 to 1999 (continued)
Division & state 1890 1880 1870 1860 1850Total 9,250 6,680 5,567 4,139 2,245
Top 6 4,979 3,627 3,289 2,622 1,564% Top 6 53.8% 54.3% 59.1% 63.3% 69.7%% Top 6 from 1990 35.5% 36.4% 38.1% 39.7% 38.8%Changes in Top 6 1 0 0 0 (x)
% in California 4.0% 4.4% 3.8% 3.5% 1.0%
Rank 1 NY NY NY NY NYRank 2 PA PA PA PA PARank 3 IL IL IL OH OHRank 4 MA MA OH IL MARanks MI WI WI WI ILRank 6 WI OH MA MA WI
Percent by StateRank 1 17.0% 18.1% 20.4% 24.2% 29.2%Rank 2 9.1% 8.8% 9.8% 10.4% 13.5%Rank 3 9.1% 8.7% 9.3% 7.9% 9.7%Rank 4 7.1% 6.6% 6.7% 7.8% 7.3%Rank 5 5.9% 6.1% 6.5% 6.7% 5.0%Rank 6 5.6% 5.9% 6.3% 6.3% 4.9%"
STATESNew England Rank Rank Rank Rank Rank
Maine 79 24 59 21 49 20 37 19 32 15
New Hampshire 72 25 46 24 30 25 21 24 14 22Vermont 44 30 41 26 47 22 33 22 34 14
Massachusetts 657 4 443 4 353 6 260 6 164 4Rhode Island 106 18 74 19 55 19 37 20 24 17Connecticut 184 14 130 14 114 14 81 14 39 13
Middle AtlanticNew York 1,571 1 1,211 1 1,138 1 1,001 1 656 1
New Jersey 329 10 222 11 189 11 123 10 60 9Pennsylvania 846 2 588 2 545 2 431 2 303 2
East North CentralOhio 459 8 395 6 372 4 328 3 218 3Indiana 146 17 144 13 141 13 118 11 56 10Illinois 842 3 584 3 515 3 325 4 112 5Michigan 544 5 389 7 268 7 149 8 55 11
Wisconsin 519 6 405 5 364 5 277 5 110 6West North Central
Minnesota 467 7 268 9 161 12 59 17 2 34Iowa 324 11 262 10 205 10 106 12 21 20Missouri 235 12 212 12 222 8 161 7 77 7
North Dakota 81 23 (N) (X) (N) (X) (N) (X) (NA) (X)South Dakota 91 20 52 23 5 45 2 42 (NA) (X)Nebraska 203 13 97 17 31 23 6 34 (NA) (X)Kansas 148 16 110 16 48 21 13 26 (NA) (X)
South AtlanticDelaware 13 43 9 .42 9 35 9 31 5 27Maryland 94 19 83 18 83 15 78 15 51 12District of Columbia 19 36 17 31 16 29 12 27 5 28Virginia 18 37 15 35 14 30 35 21 23 18
West Virginia 19 34 18 30 17 28 (N) (X) (N) (X)North Carolina 4 48 4 47 3 47 3 38 3 31
South Carolina 6 47 8 45 8 36 10 30 9 23Georgia 12 44 11 37 11 33 12 29 6 25Florida 23 32 10 40 5 44 3 37 3 30
East South CentralKentucky 59 26 60 20 63 16 60 18 31 16Tennessee 20 33 17 32 19 26 21 23 6 26Alabama 15 40 10 41 10 34 12 28 8 24Mississippi 8 46 9 43 11 32 9 32 5 29
West South CentralArkansas 14 42 10 38 5 42 4 36 1 35Louisiana 50 29 54 22 62 18 81 13 68 8
'Oklahoma 3 49 (NA) (X) (NA) (X) (NA) (X) (NA) (X)Texas 153 15 115 15 62 17 43 18 18 21
MountainMontana 43 31 12 36 8 37 (NA) (X) (NA) (X)Idaho 17 38 10 39 8 38 (NA) (X) (NA) (X)Wyoming 15 39 6 46 4 46 (NA) (X) (NA) (X)Colorado 84 22 40 27 7 39 3 40 (NA) (X)New Mexico 11 45 8 44 6 41 7 33 2 32Arizona 19 35 16 33 6 40 (NA) (X) (NA) (X)Utah 53 28 44 25 31 24 13 25 2 33Nevada 15 41 26 29 19 27 2 41 (NA) (X)
PacificWashington 90 21 16 34 5 43 3 39 (NA) (X)Oregon 57 27 31 28 12 31 5 35 1 36California 366 9 293 8 210 9 147 9 22 19
Alaska (X) (X) (X) (X) (X) (X) (X) (X) (X) (X)Hawaii (X) (X) (X) (X) (X) (X) (X) (X) (X) (X)
Source: Urban Institute 2001.
Note: Populations in thousands. "(X)" is not applicable. Bold face entries are new states in the top 6. Italics are statesthat dropped out of the top 6. "(N)' - data for 1860-80 for South Dakota are for the Dakota Territory and induct(North Dakota; data for 1850-60 for Virginia include West Virginia. For sources, see first page of table.
- 28 -
3 2 BEST COPY AVAILABLE

Table 2. Foreign-Born Population, for Regions, Divisions, and States:1990 to 1999
Division 8 state 1999 1998 1997 1996 1995* 1994* 1990Total 26,448 26,281 25,779 24,557 24,473 23,389 19,767
Top 6% Top 6% Top 6 from 1990Changes in Top 6
18,49869.9%69.9%
0
18,58970.7%70.7%
0
18,50471.8%71.8%
0
17,76872.4%72.4%
0
17,84672.9%72.9%
0'
17,20073.5%73.5%
0
14,41772.9%72.9%
0
% in California 30.2% 30.3% 31.3% 32.8% 33.7% 34.2% 32.7%
Rank 1 CA CA CA CA CA CA CARank 2 NY NY NY NY NY NY NYRank 3 FL FL FL FL TX FL FLRank4 TX TX TX TX FL TX TXRank 5 NJ IL NJ NJ NJ NJ NJRank 6 IL NJ IL IL IL IL IL
Percent by StateRink 1 30.2% 30.3% 31.3% 32.8% 33.7% 34.2% 32.7%Rank 2 13.4% 13.8% 14.0% 13.2% 12.9% 12.8% 14.4%Rank 3 8.9% 8.8% 9.1% 8.9% 8.9% 9.0% 8.4%Rank 4 8.8% 8.8% 8.4% 8.5% 8.5% 7.9% 7.7%Rank 5 4.4% 4.5% 4.7% 4.7% 4.6% 4.8% 4.9%Rank 6 4.3% 4.5% 4.3% 4.3% 4.3% 4.8% 4.8%
New England Rank Rank Rank Rank Rank Rank RankMaine 34 42 27 45 27 44 31 43 28 43 33 40 36 38New Hampshire 51 41 44 41 38 42 39 40 50 34 53 35 41 37Vermont 20 47 20 46 18 47 17 47 15 47 17 46 18 46Massachusetts 696 7 598 8 493 8 592 7 633 7 617 7 574 7Rhode Island 93 30 109 28 104 30 100 27 98 27 96 26 95 24Connecticut 317 14 317 15 253 18 322 14 297 14 302 15 279 13
Middle AtlanticNew York 3,537 2 3,633 2 3,602 2 3,232 2 3,161 2 2,997 2 2,852 2New Jersey 1,161 5 1,181 6 1,208 5 1,152 5 1,122 5 1,120 5 967 5Pennsylvania 407 13 487 10 386. 12 421 10 426 9 374 12 369 8
East North CentralOhio 263 20 349 14 265 16 252 15 276 15 249 16 260 15Indiana 112 26 124 25 130 24 97 28 75 30 61 32 94 25Illinois 1,132 6 1,193 5 1,100 6 1,062 6 1,058 6 1,118 6 952 6Michigan 418 12 493 9 433 10 491 8 411 10 387 11 355 9Wisconsin 108 27 146 23 157 23 141 24 152 23 124 23 122 20
West North CentralMinnesota 284 17 217 20 216 20 218 18 198 20 158 18 113 22Iowa 82 33 70 34 77 31 41 37 26 44 64 30 43 36Missouri 121 24 81 33 117 27 108 26 99 26 95 27 84 27North Dakota 4 51 6 50 5 51 9 50 8 51 9 49 9 49South Dakota 7 49 7 49 7 50 8 51 13 49 13 48 8 50Nebraska 61 39 58 38 58 34 40 39 25 45 36 39 28 41Kansas . 128 23 100 29 107 28 95 29 83 29 63 31 63 30
South AtlanticDelaware 32 45 28 44 36 43 35 42 36 39 20 45 22 44Maryland 508 9 479 11 436 9 412 11 366 12 342 14 313 11
District of Columbia 56 40 52 40 51 38 38 41 53 33 66 29 59 32Virginia 495 10 443 12 430 11 372 13 353 13 409 8 312 12West Virginia 21 46 16 47 19 46 16 48 17 46 14 47 16 47North Carolina 307 15 247 18 263 17 195 21 178 21 142 22 115 21
South Carolina 86 32 62 37 44 40 40 38 44 35 43 37 50 34Georgia 288 16 223 19 225 19 221 17 266 16 356 13 173 16Florida 2,343 3 2,324 3 2,351 3 2,187 3 2,075 4 2,110 3 1,663 3
East South CentralKentucky 80 34 65 36 48 39 52 35 29 42 23 44 34 39Tennessee 73 37 85 32 68 32 69 31 43 37 57 33 59 31
Alabama 77 36 95 30 55 37 52 34 72 31 57 34 44 35Mississippi 33 44 33 43 56 35 24 45 32 40 24 43 20 45
West South CentralArkansas 67 38 55 39 41 41 52 33 39 38 27 42 25 42Louisiana 107 28 123 26 106 29 74 30 113 25 85 28 87 26Oklahoma 105 29 66 35 67 33 69 32 87 28 122 24 65 29Texas 2,326 4 2,302 4 2,169 4 2,081 4 2,179 3 1,849 4 1,524 4
MountainMontana 11 48 8 48 9 48 17 46 14 48 9 50 14 48Idaho 78 35 86 31 56 36 50 36 44 36 43 38 29 40Wyoming 6 50 6 51 8 49 13 49 9 50 6 51 8 51
Colorado 255 21 262 17 336 14 241 16 231 17 151 20 142 18New Mexico 113 25 118 27 127 25 144 23 123 24 101 25 81 28Arizona 671 8 638 7 689 7 472 9 497 8 392 10 278 14Utah 93 31 137 24 118 26 113 25 71 32 45 36 59 33Nevada 274 18 196 22 182 22 178 22 171 22 146 21 105 23
PacificWashington 425 11 372 13 373 13 386 12 375 11 394 9 322 10Oregon 266 19 307 18 299 15 210 19 211 18 176 17 139 19California 7,999 1 7,955 1 8,074 1 8,056 1 8,250 1 8,006 1 6,459 1
Alaska 33 43 36 42 25 45 28 44 30 41 30 41 25 43Hawaii 183 22 205 21 213 21 197 20 209 19 158 19 163 17
Source: Urban Institute 2001.
Note: Populations in thousands. '1994 and 1995 reweighted (Passel 1997).Source: U.S. Bureau of the Census (1999) and authors' tabulations from March Current Population Surveys.
3 3 BEST COPY AVAILABLE

Table 3. Foreign-Born Population by State Groups, 1970-1999(Populations in thousands)
State or Group of StatesForeign-Born Population Growth Growth Rate
19991990
19801970 1990-
19991980-1990
1970-1980
1990-1999
1980-1990
1970-1980Pop. Rank Pop. Rank
Population
U.S. Total 26,448 19,682 (x) 14,079 9,619 (x) 6,766 5,603 4,460 34% 40% 46%
California 7,999 6,443 1 3,572 1,758 2 1,556 2,871 1,814 24% 80% 103%
New York 3,537 2,836 2 2,390 2,110 1 702 446 280 25% 19% 13%Florida 2,343 1,661 3 1,056 540 5 682 605 516 41% 57% 95%Texas 2,326 1,515 4 862 310 10 811 653 552 54% 76% 178%New Jersey 1,161 966 5 756 635 3 195 210 121 20% 28% 19%Illinois 1,132 946 6 822 629 4 186 123 193 20% 15% 31%
6 Top Foreign-Born States 18,498 14,366 (x) 9,458 5,982 (x) 4,132 4,908 3,476 29% 52% 58%U.S. balance 7,950 5,316 (x) 4,621 3,638 (x) 2,634 695 984 50% 15% 27%
5 Top States, less California 10,499 7,923 (x) 5,886 4,224 (x) 2,576 2,037 1,663 33% 35% 39%
19 New Growth States 3,953 2,023 (x) 1,415 702 (x) 1,930 608 713 95% 43% 102%
8 Traditional Immigration State 2,918 2,377 (x) 2,353 2,328 (x) 542 23 26 23% 1% 1%
18 Other States 1,079 916 (x) 853 608 (x) 162 63 245 18% 7 %. 40%
Percent of Total
U.S. Total 100% 100% (x) 100% 100% (x) 100% 100% 100% (x) (x) (x)
California 30.2% 32.7% (x) 25.4% 18.3% (x) 23.0% 51.3% 40.7% (x) (x) (x)
New York 13.4% 14.4% (x) 17.0% 21.9% (x) 10.4% 8.0% 6.3% (x) (x) (x)Florida 8.9% 8.4% (x) 7.5% 5.6% (x) 10.1% 10.8% 11.6% (x) (x) (x)Texas 8.8% 7.7% (x) 6.1% 3.2% (x) 12.0% 11.6% 12.4% (x) (x) (x)New Jersey 4.4% 4.9% (x) 5.4% 6.6% (x) 2.9% 3.7% 2.7% (x) (x) (x)Illinois 4.3% 4.8% (x) 5.8% 6.5% (x) 2.8% 2.2% 4.3% (x) (x) (x)
6 Top Foreign-Born States 69.9% 73.0% (x) 67.2% 62.2% (x) 61.1% 87.6% 77.9% (x) (x) (x)U.S. balance 30.1% 27.0% (x) 32.8% 37.8% (x) 38.9% 12.4% 22.1% (x) (x) (x)
5 Top States, less California 39.7% 40.3% (x) 41.8% 43.9% (x) 38.1% 36.4% 37.3% (x) (x) (x)
19 New Growth States 14.9% 10.3% (x) 10.0% 7.3% (x) 28.5% 10.9% 16.0% (x) (x) (x)
8 Traditional Immigration State 11.0% 12.1% (x) 16.7% 24.2% (x) 8.0% 0.4% 0.6% (x) (x) (x)
18 Other States 4.1% 4.7% (x) 6.1% 6.3% (x) 2.4% 1.1% 5.5% (x) (x) .(x)
Note: "Traditional" immigration states had a foreign-born population of 250,000 in the 1920 Census. The 8 "Traditional"immigration states are: Massachusetts, Connecticut, Pennsylvania, Ohio, Michigan, Wisconsin, Minnesota, andWaShington. This group excludes the 5 of the "Big 6" states in 1999 that also exceeded 250,000 in 1920 (i.e.,all except Florida).
"New Growth" states have 1990-1999 growth rates exceeding the fastest growing "Big 6" state (i.e., Texas at 53%).The 19 "New Growth" states, in order of 1999 foreign-born population, are: Arizona, Maryland, Virginia,North Carolina, Georgia, Nevada, Oregon, Colorado, Kansas, Oklahoma, Utah, South Carolina, Iowa, Kentucky,Idaho, Alabama, Arkansas, Nebraska, and Mississippi. The group does not include Minnesota,the only "Traditional" immigration state to meet the growth criterion.
Sources: 1999 data - Urban Institute tabulations of March CPS Supplement;1970-1990 - decennial census data presented in "Historical Census Statistics on the Foreign-born
Population of the United States: 1850-1990", by Campbell J. Gibson, Population DivisionWorking Paper No. 29, U.S. Census Bureau (February 1999).
Source: Urban Institute 2001. -- 30 --
34
Tab
le 4
. For
eign
-Bor
n P
opul
atio
n an
d C
ompo
nent
s of
Cha
nge,
197
0 to
199
9,fo
r C
alifo
rnia
, Sel
ecte
d S
tate
s, a
nd G
roup
s of
Sta
tes
(Pop
ulat
ions
and
com
pone
nts
in th
ousa
nds)
Mar
ch 1
999
CP
SG
row
th in
For
eign
-Bor
n P
opul
atio
nT
otal
Imm
igra
tion
from
Abr
oad.
Num
ber
Rat
e of
Gro
wth
Num
ber
Per
cent
Sta
teP
op.
Pct
.'9
5-99
'90-
95'8
0-90
'70-
80'9
5-99
'90-
95'8
5-90
'75-
80'9
5-99
'90-
95'8
5-90
'75-
80'9
5-99
'90-
95'8
5-90
'75-
80
U.S
., T
otal
26,4
4810
0%1,
975
4,70
55,
603
4,46
08%
24%
40%
46%
3,68
23,
865
3,62
31,
324
100%
100%
100%
100%
Cal
iforn
ia7,
999
30%
-251
1,79
12,
871
1,81
4-3
%28
%80
%10
3%82
11,
260
1,30
843
422
%33
%36
%33
%
New
Yor
k3,
537
13%
376
309
446
280
12%
11%
19%
13%
374
405
492
173
10%
10%
14%
13%
Flo
rida
2,34
39%
268
412
605
516
13%
25%
57%
95%
305
257
265
758%
7%7%
6%T
exas
2,32
69%
147
655
653
552
7%43
%76
%17
8%29
837
824
210
98%
10%
7%8%
New
Jer
sey
1,16
14%
3815
621
012
13%
16%
28%
19%
154
181
167
514%
5%5%
4%Ill
inoi
s1,
132
4%74
106
123
193
7%11
%15
%31
%16
010
015
873
4%3%
4%6%
6 B
ig 6
, tot
al18
,498
70%
652
3,42
94,
908
3,47
64%
24%
52%
58%
2,11
12,
582
2,63
291
457
%67
%73
%69
%45
U.S
., ba
lanc
e7,
950
30%
1,32
31,
276
695
984
20%
24%
15%
27%
1,57
11,
283
991
410
43%
33%
27%
31%
5 B
ig 6
(le
ss C
A)
10,4
9940
%90
31,
638
2,03
71,
663
9%21
%35
%39
%1,
291
1,32
11,
324
481
35%
34%
37%
36%
19 N
ew G
row
th3,
953
15%
1,12
778
860
871
357
%17
%11
%16
%97
963
643
716
527
%16
%12
%12
%
8 T
radi
tiona
l2,
918
11%
150
374
2326
8%8%
0%1%
387
466
391
164
11%
12%
11%
12%
18 O
ther
1,07
94%
4711
463
245
5%12
%7%
40%
205
181
163
806%
5%5%
6%
Not
es: I
mm
igra
tion,
In-M
over
s, a
nd O
ut-M
over
s ar
e de
rived
from
the
ques
tions
on
resi
denc
e 5
year
s ag
o in
the
Mar
ch 1
995
CP
S a
ndan
d on
res
iden
ce 1
yea
r ag
o in
the
Mar
ch 1
996-
1999
CP
Ss.
Mar
ch 1
995
wei
ghtin
g ha
s be
en c
orre
cted
(P
asse
l 199
7).
"Tra
ditio
nal"
imm
igra
tion
stat
es h
ad a
fore
ign-
born
pop
ulat
ion
of 2
50,0
00 in
the
1920
Cen
sus.
The
8 "
Tra
ditio
nal"
imm
igra
tion
stat
esar
e: M
assa
chus
etts
, Con
nect
icut
, Pen
nsyl
vani
a, O
hio,
Mic
higa
n, W
isco
nsin
, Min
neso
ta, a
nd W
ashi
ngto
n. T
his
grou
pex
clud
es th
e 5
of th
e "B
ig 6
" st
ates
in 1
999
that
als
o ex
ceed
ed 2
50,0
00 in
192
0 (i.
e., a
ll ex
cept
Flo
rida)
.
"New
Gro
wth
" st
ates
hav
e 19
90-1
999
grow
th r
ates
exc
eedi
ng th
e fa
stes
t gro
win
g "B
ig 6
" st
ate
(i.e.
, Tex
as a
t 53%
). T
he19
"N
ew G
row
th"
stat
es, i
n or
der
of 1
999
fore
ign-
born
pop
ulat
ion,
are
: Ariz
ona,
Mar
ylan
d, V
irgin
ia, N
orth
Car
olin
a, G
eorg
ia,
Nev
ada,
Ore
gon,
Col
orad
o, K
ansa
s, O
klah
oma,
Uta
h, S
outh
Car
olin
a, Io
wa,
Ken
tuck
y, Id
aho,
Ala
bam
a, A
rkan
sas,
Neb
rask
a, a
ndM
issi
ssip
pi. T
he g
roup
doe
s no
t inc
lude
Min
neso
ta, t
he o
nly
"Tra
ditio
nal"
imm
igra
tion
stat
e to
mee
t the
gro
wth
crit
erio
n. 36S
ourc
e: U
rban
Inst
itute
200
1.--
31
--
35

Tab
le 4
. For
eign
-Bor
n P
opul
atio
n an
d C
ompo
nent
s of
Cha
nge,
197
0 to
199
9,fo
r C
alifo
rnia
, Sel
ecte
d S
tate
s, a
nd G
roup
s of
Sta
tes
(con
tinue
d)
(Pop
ulat
ions
and
cor
n
For
eign
-Bor
n In
-Mov
ers
from
Oth
er S
tate
sF
orei
gn-B
orn
Out
-Mov
ers
to O
ther
Sta
tes
Net
Inte
rnal
Mig
ratio
nof
the
For
eign
-Bor
nN
umbe
rP
erce
ntN
umbe
rP
erce
ntS
tate
'95-
99'9
0-95
'85-
90'7
5-80
'95-
99'9
0-95
'85-
90'7
5-80
'95-
99'9
0-95
'85-
90'7
5-80
'95-
99'9
0-95
'85-
90'7
5-80
'95-
99'9
0-95
'85-
90'7
5-80
U.S
., T
otal
2,55
91,
457
1,37
049
810
0%10
0%10
0%10
0%2,
559
1,45
71,
370
498
100%
100%
100%
100%
00
00
Cal
iforn
ia24
218
523
480
9%13
%17
%16
%34
330
317
851
13%
21%
13%
10%
-101
-118
5729
New
Yor
k15
273
8223
6%5%
6%5%
284
187
219
101_
11%
13%
16%
20%
-132
-114
-137
-78
Flo
rida
243
150
203
839%
10%
15%
17%
162
103
7427
6%7%
5%5%
8148
129
56T
exas
158
177
8638
6%12
%6%
8%21
099
130
218%
7%9%
4%-5
279
-44
17N
ew J
erse
y14
759
8729
6%4%
6%6%
138
8278
355%
6%6%
7%10
-23
9-6
Illin
ois
6757
4417
3%4%
3%3%
8510
673
313%
7%5%
6%-1
8-4
9-2
9-1
4
6 B
ig 6
, tot
al1,
010
703
736
271
39%
48%
54%
54%
1,22
288
075
226
648
%60
%55
%53
%-2
13-1
77-1
65
45 U
.S.,
bala
nce
1,54
975
463
422
861
%52
%46
%46
%1,
336
577
618
232
52%
40%
45%
47%
213
177
16-5
5 B
ig 6
(le
ss C
A)
768
518
502
191
30%
36%
37%
38%
879
577
575
215
34%
40%
42%
43%
-111
-59
-73
-24
19 N
ew G
row
th92
441
832
211
036
%29
%24
%22
%57
323
026
089
22%
16%
19%
18%
351
189
6221
8 T
radi
tiona
l45
221
919
771
18%
15%
14%
14%
438
215
209
8917
%15
%15
%18
%14
3-1
2-1
8
18 O
ther
173
117
115
467%
8%8%
9%32
613
215
054
13%
.9%
11%
11%
-153
-15
-35
-8
Not
es: I
mm
igra
tion,
In-M
over
s, a
nd O
ut-M
over
s ar
e de
rived
from
the
ques
tions
on
resi
denc
e 5
year
s ag
o in
the
Mar
ch 1
995
CP
S a
ndan
d on
res
iden
ce 1
yea
r ag
o in
the
Mar
ch 1
996-
1999
CP
Ss.
Mar
ch 1
995
wei
ghtin
g ha
s be
en c
orre
cted
(P
asse
l 199
7).
"Tra
ditio
nal"
imm
igra
tion
stat
es h
ad a
fore
ign-
born
pop
ulat
ion
of 2
50,0
00 in
the
1920
Cen
sus.
The
8 "
Tra
ditio
nal"
imm
igra
tion
stat
esar
e: M
assa
chus
etts
, Con
nect
icut
, Pen
nsyl
vani
a, O
hio,
Mic
higa
n, W
isco
nsin
, Min
neso
ta, a
nd W
ashi
ngto
n. T
his
grou
pex
clud
es th
e 5
of th
e "B
ig 6
" st
ates
in 1
999
that
als
o ex
ceed
ed 2
50,0
00 in
192
0 (i.
e., a
ll ex
cept
Flo
rida)
.
"New
Gro
wth
" st
ates
hav
e 19
90-1
999
grow
th r
ates
exc
eedi
ng th
e fa
stes
t gro
win
g "B
ig 6
" st
ate
(i.e.
, Tex
as a
t 53%
). T
he19
"N
ew G
row
th"
stat
es, i
n or
der
of 1
999
fore
ign-
born
pop
ulat
ion,
are
: Ariz
ona,
Mar
ylan
d, V
irgin
ia, N
orth
Car
olin
a, G
eorg
ia,
Nev
ada,
Ore
gon,
Col
orad
o, K
ansa
s, O
klah
oma,
Uta
h, S
outh
Car
olin
a, Io
wa,
Ken
tuck
y, Id
aho,
Ala
bam
a, A
rkan
sas,
Neb
rask
a, a
ndM
issi
ssip
pi. T
he g
roup
doe
s no
t inc
lude
Min
neso
ta, t
he o
nly
"Tra
ditio
nal"
imm
igra
tion
stat
e to
mee
t the
gro
wth
crit
erio
n.
38S
ourc
e: U
rban
Inst
itute
200
1.--
32
--

Tab
le 5
. Mob
ility
by
Age
and
Nat
ivity
for
Cal
iforn
ia:
1990
-199
9, 1
990-
1995
, and
199
5-19
99
(In
thou
sand
s)
Per
sons
in N
ativ
e* H
ouse
hold
sP
erso
ns in
For
eign
-Bor
n* H
ouse
hold
sA
ge a
ndS
taye
d Im
mig
.Im
mig
. &In
-O
ut-
Sta
yed
Imm
ig.
,Im
mig
. &In
-O
ut-
Typ
e of
infr
omIn
-O
ut-
Net
In-m
over
Mov
er M
over
infr
omIn
-O
ut-
Net
In-m
over
Mov
er M
over
Nat
ivity
Cal
if. A
broa
dM
over
Mov
er M
oves
Pct
.P
ct.
Rat
eC
alif.
Abr
oad
Mov
er M
over
Mov
esP
ct.
Pct
.R
ate
1990
-199
9 (S
um o
f 199
0-19
95 a
nd 1
995-
1999
)T
otal
17,9
2636
32,
222
3,79
2-1
,570
12.6
% 1
1.0%
-17
.5%
11,4
622,
070
590
953
-363
18.8
%4.
9%-7
.7%
Und
er 1
84,
415
5444
793
8-4
9110
.2%
9.2%
-17
.5%
4,17
052
116
828
5-1
1714
.2%
3.9%
-6.4
%18
-34
3,90
221
498
61,
449
-463
23.5
% 2
0.2%
-27
.1%
3,09
399
425
940
4-1
4528
.8%
7.7%
-11
.5%
35 6
47,
027
7567
01,
218
-548
9.6%
8.7%
-14
.8%
3,42
750
314
923
7-8
716
.0%
4.2%
-6.5
%65
and
ove
r2,
582
1911
918
7-6
85.
1%4.
4%-6
.8%
771
5313
27-1
47.
9%1.
7%-3
.4%
1990
-199
5 (B
ased
on
Mar
ch 1
995
CP
S)
Tot
al17
,926
177
861
2,05
0 -1
,189
5.5%
4.6%
-10
.3%
11,4
621,
242
271
425
-154
11.7
%2.
3%-3
.6%
Und
er 1
84,
415
2918
745
5-2
694.
7%4.
1%-9
.3%
4,17
033
585
118
-32
9.1%
2.0%
-2.7
%18
-34
3,90
210
039
974
2-3
4311
.3%
9.3%
-16
.0%
3,09
354
010
216
2-6
017
.2%
3.2%
-5.0
%35
64
7,02
736
246
748
-502
3.9%
3.4%
-9.6
%3,
427
337
7712
2-4
510
.8%
2.2%
-3.4
%65
and
ove
r2,
582
1229
105
-76
1.6%
1.1%
-3.9
%77
131
723
-16
4.6%
0.9%
-2.9
%
1995
-199
9 (B
ased
on
Mar
ch C
PS
of 1
996-
1999
)T
otal
19,6
4618
51,
361
1,74
3-3
817.
3%6.
5%-8
.1%
12,3
9282
831
852
8-2
108.
5%2.
5%-4
.1%
Und
er 1
84,
885
2526
148
3-2
235.
5%5.
1%-9
.0%
4,24
218
683
168
-85
6.0%
1.9%
-3.8
%18
-34
4,51
511
458
770
7-1
2113
.4%
11.
5% -
13.5
%3,
497
453
157
242
-85
14.9
%4.
3%-6
.5%
35 6
47,
685
3942
447
0-4
65.
7%5.
2%-5
.8%
3,88
216
672
115
-43
5.8%
1.8%
-2.9
%65
and
ove
r2,
561
790
828
3.7%
3.4%
-3.1
%77
222
64
23.
6%0.
8%-0
.5%
Not
e:*
"Nat
ivity
of H
ouse
hold
" is
def
ined
diff
eren
tly fo
r fa
mily
and
non
-fam
ily h
ouse
hold
s. A
ll pe
rson
s in
a fa
mily
hou
seho
ld a
reas
sign
ed th
e sa
me
nativ
ity: "
fore
ign-
born
" if
eith
er th
e ho
useh
olde
r or
hou
seho
lder
's s
pous
e is
fore
ign-
born
; "na
tive"
if b
oth
"nat
ive"
if b
oth
the
hous
ehol
der
and
spou
se a
re n
ativ
e. F
or n
on-f
amily
hou
seho
lds,
eac
h in
divi
dual
's o
wn
nativ
ity is
use
d.
"Sta
yed
in C
alifo
rnia
" is
an
aver
age
of n
onm
over
s an
d w
ithin
sta
te m
over
s fo
r th
e M
arch
199
6-19
99 C
PS
s.Im
mig
rant
s fr
om a
broa
d, in
-mov
ers,
and
out
-mov
ers
are
the
tota
l acr
oss
the
four
CP
Ss.
All
data
are
from
the
ques
tion
on r
esid
ence
one
yea
r ag
o fo
r 19
96-1
999
and
resi
denc
e fiv
e ye
ars
ago
for
1990
-199
5..
40S
ourc
e: U
rban
Inst
itute
200
1.33
--
39

Table 6. Mobility by Period of Entry and Country of Birthfor the Foreign-Born Population, California:1995-1999, Based on March 1996-1999 CPS
(In thousands)
Period of Entry Foreign-BornOr . Stayed Immig. Immig. & In- Out-Country of in from In- Out- Net In-mover Mover MoverBirth Calif. Abroad Mover Mover Moves Pct. Pct. Rate
Period of EntryAges 18-64 6,286 620 198 308 -110 11.5% 3.1% -4.7%
1990s 1,394 479 93 113 -20 29.1% 6.3% -7.5%1980s 2,608 108 60 115 -55 6.0% 2.3% -4.2%Pre-1980 2,285 34 45 80 -35 3.3% 1.9% -3.4%
Country of BirthAges 18 and over 6,994 643 202 312 -109 10.8% 2.8% -4.3%
Mexico 2,870 272 37 140 -103 9.7% 1.3% -4.6%Latin America, balance 898 43 20 29 -9 6.5% 2.1% -3.1%Asia 2,356 223 104 . 110 -6 12.2% 4.2% -4.5%All Other 870 105 42 33 9 14.5% 4.6% -3.6%
Note: "Stayed in California" is an average of nonmovers and within state movers for the March1996-1999 CPSs. Immigrants from abroad, in-movers, and out-movers are the total acrossthe four CPSs. All data are from the question on residence one year ago.
Source: Urban Institute 2001. 34 --
41

Table 7. Reasons for Moving, by Mobility Status and NatiVity,for Persons Moving Within, Into, and Out of California:
March 1998-1999 CPS(Populations in thousands)
Population DistributionNativity andReason
MovedwithinCalif.
Immig.from In-
Abroad MoverOut-
Mover
MovedwithinCalif.
Immig.from In-
Abroad MoverOut-
Mover
Native, ages 18-64Total 5,027 87 599 661. 100% 100% 100% 100%
Family 1,286 9 157 167 26% 10% 26% 25%Job 601 32 319 294 12% 37% 53% 44%Housing 2,622 10 46 97 52% 11% 8% 15%College 100 4 28 34 2% 5% 5% 5%Health/Climate 85 4 33 27 2% 4% 5% 4%Other 333 28 16 43 7% 32% 3% 6%
Foreign-born, ages 18-64Total 2,363 311 111 163 100% 100% 100% 100%
Family 448 113 29 29 19% 36% 26% 18%Job 273 126 48 77 12% 41% 43% 47%Housing 1,472 0 15 22 62% 0% 14% 14%College 34 35 12 9 1% 11% 11% 5%Health/Climate 18 4 2 11 1% 1% 2% 7%Other 119 33 5 14 5% 11% 4% 9%
Index of Dissimilarity, native versus foreign-born 10% (x) 14% 8%
Source: Authors' tabulations from the March 1998-1999 CPS Supplements.
Source: Urban Institute 2001. 35 --
42

Table 8a. Foreign-Born Population by State "Safety Net" Groups,1970-1999
(Populations in thousands)
State or Group of StatesForeign-BornPopulation
Growth Growth Rate1990-1999
1980-1990
1970-1980
1990-1999
1980-1990
1970 -19801999 1990 1980 1970
Population - U.S., Total 26,448 19,682 14,079 9,619 6,766 5,603 4,460 34.4% 39.8% 46.4%
California 7,999 6,443 3,572 1,758 1,556 2,871 1,814 24% 80% 103%
6 Top Foreign-Born States 18,498 14,366 9,458 5,982 4,132 4,908 3,476 28.8% 51.9% 58.1%U.S. balance 7,950 5,316 4,621 3,638 2,634 695 984 49.5% 15.0% 27.0%
Availability of Safety Net to Immigrants
U.S. Total 26,448 19,682 14,079 9,619 6,766 5,603 4,460 34.4% 39.8% 46.4%
Most Available (9) 11,069 8,834 5,572 3,374 2,235 3,262 2,198 25.3% 58.5% 65.1%Somewhat Available (10) 8,625 6,657 5,374 4,381 1,968 1,283 992 29.6% 23.9% 22.6%Less Available (20) 3,472 1,985 1,540 1,008 1,487 444 532 74.9% 28.9% 52.8%Least Available (12) 3,281 2,206 1,594 856 1,075 613 738 48.7% 38.4% 86.2%
Strength of Existing Safety Net
U.S. Total 26,448 19,682 14,079 9,619 6,766 5,603 4,460 34.4% 39.8% 46.4%
Most Generous States (4) 679 541 443 287 138 99 155 25.4% 22.4% 54.1%Somewhat Generous (12) 15,562 12,489 8,855 6,600 3,073 3,634 2,255 24.6% 41.0% 34.2%Less Generous (16) 2,426 1,332 1,044 606 1,094 287 439 82.1% 27.5% 72.5%Least Generous (19) 7,781 5,320 3,738 2,127 2,461 1,582 1,611 46.3% 42.3% 75.7%
Percent of U.S. Total 100% 100% 100% 100% 100% 100% 100% (x) (x) (x)
California 30.2% 32.7% 25.4% 18.3% 23.0% s51.3% 40.7% (x) (x) (x)
6 Top Foreign-Born States 69.9% 73.0% 67.2% 62.2% 61.1% 87.6% 77.9% (x) (x) (x)U.S. balance 30.1% 27.0% 32.8% 37.8% 38.9% 12.4% 22.1% (x) (x) (x)
Availability of Safety Net to Immigrants
U.S. Total 100% 100% 100% 100% 100% 100% 100% (x) (x) (x)
Most Available (9) 41.9% 44.9% 39.6% 35.1% 33.0% 58.2% 49.3% (x) (x) (x)Somewhat Available (10) 32.6% 33.8% 38.2% 45.5% 29.1% 22.9% 22.2% (x) . (x) (x)Less Available (20) 13.1% 10.1% 10.9% 10.5% 22.0% 7.9% 11.9% (x) (x) (x)Least Available (12) 12.4% 11.2% 11.3% 8.9% 15.9% 10.9% 16.5% (x) (x) (x)
Strength of Existing Safety Net
U.S. Total 100% 100% 100% 100% 100% 100% 100% (x) (x) (x)
Most Generous States (4) 2.6% 2.8% 3.1% 3.0% 2.0% 1.8% 3.5% (x) (x) (x)Somewhat Generous (12) 58.8% 63.5% 62.9% 68.6% 45.4% 64.9% 50.6% (x) (x) (x)Less Generous (16) 9.2% 6.8% 7.4% 6.3% 16.2% 5.1% 9.8% (x) (x) (x)Least Generous (19) 29.4% 27.0% 26.5% 22.1% 36.4% 28.2% 36.1% (x) (x) (x)
Note: The measures of state safety nets' "availability" and "generosity" are developed in Patchwork Policies: StateAssistance for Immigrants Under Welfare Reform by Wendy Zimmermann and Karen C. Tumlin, Urban Institute, May1999. See this publication for details.
"Availability of State Safety Net" is a measure of the many decisions regarding immigrant eligibility for federal andstate benefits made by states following welfare reform. These include whether states opted to keep immigrants eligiblefor Medicaid and TANF, whether they placed conditions on eligibility (such as sponsor-deeming or requiring immigrants toapply for naturalization), and whether they created state-funded programs for immigrants otherwise ineligible for benefits.States are scored for each decision they made and grouped accordingly.
"Strength of Existing Safety Net" is a measure of the existence and generosity of a state's safety net programs,separate from immigrant eligibility decisions. States were scored, for example, on their TANF benefit levels and theMedicaid income cutoffs they established. This measure also takes into account whether states have GeneralAssistance or state medical insurance programs for those ineligible for federal assistance.
Sources: See next page.
Source: Urban Institute 2001. - 36 -
4 3 BEST COPY MAILABLE

Table 8b. Movement of Foreign-Born by State Groups,1995-1999
(Populations in thousands)
Foreign-BornState or Group of States Population, 1999
Immigration from Abroad1995-1999
Internal Migration ofF-B (Net), 1995-99
No. Pct. No. Pct. Rate* No. Rate*
U.S. Total 26,448
California 7,999
6 Top Foreign-Born States 18,498U.S. balance 7,950
100.0%
30.2%
69.9%30.1%
3,682
821
2,1111,571
100.0%
22.3%
57.3%42.7%
15.0%
9.9%
11.8%23.7%
0 0.0%
-101 -1.2%
-213213
-1.2%3.2%
Availability of Safety Net to Immigrants
U.S. Total 26,448 100.0% 3,682 100.0% 15.0% 0 0.0%
Most Available (9) 11,069 41.9% 1,311 35.6% 12.0% -72 -0.7%Somewhat Available (10) 8,625 32.6% 1,106 30.0% 14.1% -101 -1.3%Less Available (20) 3,472 13.1% 769 20.9% 28.7% 292 10.9%Least Available (12) 3,281 12.4% 497 13.5% 16.6% -118 -4.0%
Strength of Existing Safety Net
U.S. Total 26,448 100.0% 3,682 100.0% 15.2% 0 0.0%
Most Generous States(4) 679 2.6% 101 2.7% 15.5% -13 -2.1%Somewhat Generous (12) 15,562 58.8% 1,816 49.3% 12.0% -173 -1.1%Less Generous (16) 2,426 9.2% 666 18.1% 35.3% 49 2.6%Least Generous States (19) 7,781 29.4% 1,099 29.9% 16.2% 138 2.0%
* As percent of estimated 1995 population.
Note: The measures of state safety nets' "availability" and "generosity" are developed in Patchwork Policies:State Assistance for Immigrants Under Welfare Reform by Wendy Zimmermann and Karen C. Tumlin, UrbanInstitute, May 1999. See this publication for details.
"Availability of State Safety Net" is a measure of the many decisions regarding immigrant eligibility forfederal and state benefits made by states following welfare reform. These include whether states opted to keepimmigrants eligible for Medicaid and TANF, whether they placed conditions on eligibility (such as sponsor-deeming or requiring immigrants to apply for naturalization), and whether they created state-funded programsfor immigrants otherwise ineligible for benefits. States are scored for each decision they made and groupedaccordingly.
"Strength of Existing Safety Net" is a measure of the existence and generosity of a state's safety netprograms, separate from immgirant eligibility decisions. States were scored, for example, on their TANF benefitlevels and the Medicaid income cutoffs they established. This measure also takes into account whether stateshave General Assistance or state medical insurance programs for those ineligible for federal assistance.
Sources: 1999 data - Urban Institute tabulations of March CPS Supplement;1970-1990 - decennial census data presented in "Historical Census Statistics on the
Foreign-born Population of the United States: 1850-1990", by Campbell J. Gibson,Population Division Working Paper No. 29, U.S. Census Bureau (February 1999).
Source: Urban Institute 2001. - 37 --
44

AppendixTable A. Growth in Foreign-Born Population by Decade, for Regions, Divisions, and States: 1850 to 1999
Division & state 1990-99 1980-90 1970-80 1960-70 1950-60 1940-50 1930-40 1920-30 1910-20 1900-101890-1900 1880-90 1870-80 1860-70 1850-60Total 6,680 5,687 4,461 -119 -686 -1,248 -2,609 283 405 3,175 1,092 2,485 1,113 1,386 1,865
Top 6% Top 6% Top 6 from 1990Changes in Top 6
4,08161.1%61.1%
0
4,95187.1%87.1%
0
3,48478.1%78.1%
1
383(X)(X)
1
-450(X)(X)
0
-783(X)(X)
0
-1,387(X)(X)
1
734258.8%320.0%
1
31577.8%
116.3%1
2,12566.9%50.8%
2
77771.2%53.6%
0
1,35954.7%34.2%
1
337- 30.3%
28.3%0
66748.1%34.5%
0
1,05856.7%41.4%
0
% in California 23.1% 50.6% 40.8% (X) (X) (X) (X) 111.6% 42.3% 6.9% 0.1% 3.0% 7.5% 4.6% 6.7%
Rank 1Rank 2Rank 3Rank 4Rank 5Rank 6
CANYFLTXNJIL
CANYFLTXNJ
IL
CANYFLTX
ILNJ
NYCANJ
IL
FLMA
NYCAIL
NJPAMA
NYCA
ILPAMANJ
NY' PA
ILCAMANJ
NYIL
PACAMA
MI
NYPA
ILMACANJ
NYPAIL
MANJOH
NYPA
IL
MAMI
WI
NYPA
IL
MAMI
WI
NYPA
ILMAWIOH
NYPAIL
OHWIMA
NYPAOH
ILWIMA
Percent by StateRank 1 23.1% 50.6% 40.8% (X) (X) (X) (X) 154.1% 19.1% 26.7% 30.2% 14.5% 6.6% 9.9% 18.5%Rank 2 10.3% 8.1% 6.3% (X) (X) (X) (X) 11.2% -12.3% 14.4% 12.8% 10.4% 3.8% 8.3% 6.8%Rank 3 102% 10.6% 11.6% (X) (X) (X) (X) -53.7% 1.3% 7.5% 11.4% 10.4% 6.1% 13.7% 5.9%Rank 4 12.0% 11.7% 12.3% (X) (X) (X) (X) 111.6% 7.2% 6.7% 17.3% 8.6% 8.1% 3.2% 11.4%Rank 5 2.9% 3.7% 4.4% (X) (X) (X) (X) -8.1% 42.3% 7.2% -0.2% 6.3% 3.7% 6.3% 8.9%Rank 6 2.7% 2.3% 2.8% (X) (X) (X) (X) 43.6% 20.2% 4.4% -0.3% 4.8% 2.0% 6.N 5.2%
New EnglandMaine -2 -7 0 -17 -14 -10 -17 -7 -3 17 14 20 10 11 6New Hampshire 10 0 4 -8 -13 -11 -15 -8 -5 9 16 26 17 9 7
Vermont 3 -3 3 -5 -5 -3 -11 -1 -5 '5 1 3 -6 14 -1
Massachusetts 123 73 6 -82 -145 -136 -208 -23 29 213 189 214 90 93 96Rhode Island -2 11 10 -12 -27 -25 -33 -3 -4 45 28 32 19 18 13
Connecticut 38 12 6 -14 -21 -33 -55 6 49 91 55 54 16 33 42Middle Atlantic
New York 685 463 279 -180 -288 -340 -346 437 77 848 329 360 73 137 345New Jersey 194 209 123 19 -20 -64 -151 108 82 229 103 107 33 66 63Pennsylvania 37 -32 -45 -158 -180 -193 -264 -152 -50 457 140 258 43 115 127
East North CentralOhio 3 -43 -14 -80 -44 -80 -128 -31 82 140 -1 64 22 44 110
Indiana 18 -8 19 -10 -12 -32 -8 -8 18 -4 2 3 23 63Illinois 180 129 195 -57 -100 -186 -270 32 5 239 124 259 68 191 213Michigan 63 -62 -7 -105 -74 -82 -167 123 132 56 -2 155 120 119 94WIsconsin -13 -4 -5 -41 -45 -72 -99 -72 -52 -3 -3 114 41 88 166
West North CentralMinnesota 171 6 9 -46 -67 -85 -95 -96 -57 38 38 200 107 102 57Iowa 39 -4 7 -16 -28 -33 -51 -58 -48 -32 -18 62 57 99 85Missouri 38 -2 20 -12 -14 -23 -39 -34 -43 13 -18 23 -11 62 84North Dakota -5 -5 -4 -11 -18 -26 -31 -26 -25 44 32 (X) (X) (X) (X)South Dakota -1 -2 -1 -8 -12 -13 -22 -16 -18 12 -3 39 47 3 (X)Nebraska 33 -3 2 -11 -17 -25 -37 -31 -26 -1 -25 105 67 24 (X)Kansas 65 15 20 -5 -5 -14 -29 -30 -24 9 -21 38 62 36 (X)
South AtlanticDelaware 10 3 3 1 2 -2 -2 -3 2 4 1 4 0 0 4Maryland 194 118 71 30 9 3 -14 -7 -2 11 0 11 -1 6 26District of Columbia -3 18 7 -5 -4 8 4 1 4 5 1. 2 1 4 8Virginia 183 134 105 24 12 12 -1 -7 5 8 1 4 1 -21 12
West Virginia 5 -6 5 -7 -10 -8 -10 -10 5 35 4 1 1 (X) (X)North Carolina 192 37 50 7 7 6 0 2 1 2 1 0 1 0 1
South Carolina 36 4 32 3 4 2 0 -1 0 1 -1 -1 0 -2 1
Georgia 115 82 58 8 9 4 -2 -2 1 3 0 2 -1 -1 5
Florida 680 604 518 268 141 53 8 16 13 17 1 13 5 2 1
East South CentralKentucky 46 0 18 0 1 0 -6 -9 -9 -10 -9 0 -4 4 28Tennessee 14 11 29 3 2 3 -2 -2 -3 1 -2 3 -3 -2 16
Alabama 33 5 23 1 2 1 -4 -2 -1 5 0 5 0 -2 5
Mississippi 12 -3 15 0 -1 2 -2 0 -1 2 0 -1 -2 3 4West South Central
Arkansas 42 2 14 1 -2 2 -3 -4 -3 3 0 4 5 1 2
Louisiana 19 2 46 9 1 2 -9 -9 -6 0 3 -4 -8 -19 13
Oklahoma 40 9 36 0 2 -2 -10 -10 0 20 18 (X) (X) (X) (X)Texas 802 668 546 11 21 42 -127 -2 122 63 26 38 52 19 26
MountainMontana -3 -5 -1 -11 -13 -13 -20 -20 1 28 24 32 4 (X) (X)Idaho 49 6 11 -3 -4 -5 -8 -8 -2 18 7 7 2 (X) (X)
Wyoming -2 -2 3 -3 -4 -4 -6 -3 -2 12 3 9 2 (X) (X)Colorado 113 28 54 0 -1 -11 -28 -19 -10 38 7 44 33 4 (X)New Mexico 33 28 30 1 4 2 -9 -6 7 10 2 3 2 -1 5
Arizona 393 115 86 6 23 9 -27 -15 32 25 5 3 10 (X) (X)Utah 34 8 21 -3 1 -2 -15 -11 -7 12 1 9 13 18 11
Nevada 169 51 36 5 2 0 -4 -1 -4 10 -5 -11 7 17 (X)Pacific
Washington 103 83 83 -23 -18 -14 -45 -10 9 145 21 74 11 2 (X)Oregon 126 32 42 -5 -14 -5 -20 3 -5 47 8 27 19 6 4California 1,540 2,879 1,822 414 283 136 -149 316 171 219 1 73 83 63 125Alaska 8 9 8 0 (X) (X) (X) (X) (X) (X) (X) (X) (X) (X) (X)Hawaii 20 26 61 7 (X) (X) (X) (X) (X) (X) (X) (X) (X) (X) (X)
Note: Populations in thousands "(X)" is not applicable. Bold face entries are new states in the top 6. Italics are states that dropped out of the top 6.Italics are states that dropped out of the top 6 See Table 1 for special notes.
Source: U.S. Bureau of the Census (1999); authors' tabulations from March Current Population Surveys.
Source: Urban Institute 2001. - 38 -
4 5 BEST COPY AVAILABLE

Appendix Percent Growth in Foreign-Born Population by Decade, for Regions, Divisions, and States:Table B. 1850 to 1999
Division & state 1990-99 1980-90 1970-80 1960-70 1950-60 1940-50 1930-40 1920-30 1910-20 1900-101890-1900 1880-90 1870-80 1860-70 1850-60Total 33.8% 40.4% 46.4% -1.2% -6.6% -10.8% -18.4% 2.0% 3.0% 30.7% 11.8% 37.2% 20.0% 33.5% 83.1%
Top 6California
28.3%23.8%
52.3%80.4%
56.5%103.6%
6.3%30.8%
-6.8%26.7%
-10.7%14.7%
-15.9%-13.9%
9.1%41.8%
4.1%29.2%
36.9%59.7%
15.6%0.3%
37.5%25.1%
10.3%39.6%
25.5%43.2%
67.6%572.1%
New EnglandMaine -7% -16% 1% -29% -19% -11% -17% -7% -2% 18% 18% 34% 20% 31% 18%New Hampshire 25% 1% 11% -17% -22% -16% -18% -9% -5% 10% 22% 56% 56% 41% 47%Vermont 14% -16% 14% -21% -18% -11% -26% -3% -11% 12% 1% 8% -13% 44% -3%Massachusetts 21% 15% 1% -14% -20% -16% -20% -2% 3% 25% 29% 48% 26% 36% 59%Rhode Island -2% 13% 13% -13% -24% -18% -19% -2% -2% 33% 27% 44% 34% 48% 56%Connecticut 14% 4% 2% -5% -7% -10% -14% 2% 15% 38% 30% 41% 14% 41% 110%
Middle AtlanticNew York 24% 19% 13% -8% -11% -12% -11% 15% 3% 45% 21% 30% 6% 14% 53%New Jersey 20% 28% 19% 3% -3% -9% -18% 14% 12% 53% 31% 48% 17% 54% 105%Pennsylvania 10% -8% -10% -26% -23% -20% -21% -11% -3% 46% 16% 44% 8% 27% 42%
East North CentralOhio 1% -14% -5% -20% -10% -15% -20% -5% 14% 30% 0% 16% 6% 13% 50%Indiana 19% -7% 22% -11% -6% -11% -22% -6% -5% 12% -3% 1% 2% 20% 113%Illinois 19% 16% 31% -8% -13% -19% -22% 3% 0% 25% 15% 44% 13% 59% 190%Michigan 18% -15% -2% -20% -12% -12% -20% 17% 22% 10% 0% 40% 45% 80% 173%Wisconsin -11% -3% -4% -24% -21% -25% -26% -16% -10% -1% -1% 28% 11% 32% 151%
West North CentralMinnesota 151% 5% 10% -32% -32% -29% -24% -20% -10% 8% 8% 75% 67% 174% 2871%Iowa 90% -9% 19% -29% -33% -28% -30% -26% -17% -11% -6% 24% 28% 93% 406%Missouri 45% -2% 30% -15% -15% -20% -25% -18% -19% 6% -8% 11% -5% 38% 110%North Dakota -58% -37% -20% -38% -38% -35% -30% -20% -16% 39% 39% (X) (X) (X) (X)South Dakota -10% -19% -12% -41% -40% -30% -33% -20% -18% 14% -3% 76% 976% 171% (X)Nebraska 116% -9% 8% -28% -30% -30% -31% -21% -15% 0% -12% 108% 217% 384% (X)Kansas 104% 31% 72% -16% -13% -26% -36% -27% -18% 7% -14% 34% 127% 281% (X)
South AtlanticDelaware 45% 18% 20% 7% 12% -12% -12% -14% 14% 27% 5% 39% 4% 0% 74%Maryland 62% 60% 57% 32% 11% 3% -14% -7% -2% 12% 0% 14% -1% 8% 51%District of Columbia -5% 45% 21% -14% -9% 22% 14% 5% 18% 24% 7% 10% 5% 30% 154%Virginia 59% 76% 145% 50% 35% 52% -4% -23% 17% 39% 6% 25% 7% -61% 53%West Virginia 31% -29% 32% -30% -30% -19% -19% -16% 9% 155% 19% 3% 7% (X) (X)North Carolina 167% 47% 174% 30% 44% 66% 3% 23% 19% 36% 21% -1% 24% -8% 28%South Carolina 72% 8% 221% 29% 56% 43% -7% -19% 7% 12% -12% -18% -5% -19% 15%Georgia 66% 89% 177% 30% 54% 35% -15% -14% 7% 25% 2% 15% -5% -5% 80%Florida 41% 57% 96% 99% 108% 68% 12% 29% 33% 70% 4% 131% 99% 50% 20%
East South CentralKentucky 135% -1% 109% -2% 8% -1% -28% -29% -23% -20% -15% 0% -6% 6% 90%Tennessee 24% 22% 154% 20% 11% 25% -13% -15% -16% 5% -11% 20% -14% -9% 275%Alabama 76% 12% 144% 7% 12% 10% -24% -11% -7% 32% -1% 52% -2% -19% 64%Mississippi 61% -13% 190% 1% -8% 35% -20% -4% -14% 22% 0% -14% -18% 31% 79%
West South CentralArkansas 170% 11% 170% 11% -21% 20% -25% -25% -17% 19% 0% 38% 106% 40% 145%Louisiana 22% 2% 116% 29% 3% 6% -25% -20% -12% 0% 6% -8% -12% -24% 19%Oklahoma 60% 16% 179% 1% 9% -11% -33% -24% 0% 97% 650% (X) (X) (X) (X)Texas 53% 78% 176% 4% 8% 18% -35% 0% 50% 35% 17% 33% 84% 44% 146%
MountainMontana -20% -25% -7% -36% -29% -23% -26% -21% 1% 41% 56% 274% 44% (X) (X)Idaho 169% 24% 86% -19% -22% -20% -23% -21% -4% 73% 41% 75% 26% (X) (X)Wyoming -20% -20% 37% -28% -28% -22% -27% -12% -8% 67% 17% 155% 67% (X) (X)Colorado 79% 25% 89% 1% -1% -15% -28% -16% -8% 42% 9% 111% 503% 148% (X)New Mexico 41% 54% 133% 5% 23% 13% -36% -19% 29% 70% 21% 40% 43% -16% 213%Arizona 141% 71% 113% 9% 48% 22% -41% -18% 65% 101% 29% 17% 176% (X) (X)Utah 58% 16% 71% -8% 4% -7% -31% -19% -10% 22% 1% 21% 43% 141% 524%Nevada 161% 95% 196% 38% 23% -3% -27% -6% -19% 95% -31% -43% 36% 811% (X)
PacificWashington 32% 35% 53% -13% -9% -7% -18% -4% 4% 130% 24% 470% 215% 60% (X)Oregon 91% 29% 63% -7% -16% -6% -18% 3% -5% 72% 15% 88% 163% 126% 401%California 24% 80% 104% 31% 27% 15% -14% 42% 29% 60% 0% 25% 40% 43% 572%Alaska 33% 53% 109% -6% (X) (X) (X) (X) (X) (X) (X) (X) (X) (X) (X)Hawaii 13% 19% 81% 10% (X) (X) (X) (X) (X) (X) (X) (X) (X) (X) (X)
Note: Populations in thousands "(X)" is not applicable. Bold face entries are new states in the top 6. Italics are states that dropped out of the top 6./fa ics are states that dropped out o the top 6. See Table 1 for special notes.
Source: U.S. Bureau of the Census (1999); authors' tabulations from March Current Population Surveys.
BEST COPY AVAILABLE
Source: Urban Institute 2001. - 39 -
4 6

Appendix Table C-1. Foreign-Born Population by State Groups, 1970-1999(Populations in thousands)
State or Group of StatesForeign-Born Population Growth Growth Rate
19991990 1970 1990-
19991980-1990
1970-1980
1990-1999
1980-1990
1970-1980Pop. Rank 1980 Pop. Rank
U.S. Total 26,448 19,682 (x) 14,079 9,619 (x) 6,766 5,603 4,460 34.4% 39.8% 46.4%
California 7,999 6,443 1 3,572 1,758 2 1,556 2,871 1,814 24% 80% 103%
New York 3,537 2,836 2 2,390 2,110 1 702 446 280 25% 19% 13%Florida 2,343 1,661 3 1,056 540 5 682 605 516 41% 57% 95%Texas 2,326 1,515 4 862 310 10 811 653 552 54% 76% 178%New Jersey 1,161 966 5 756 635 3 195 210 121 20% 28% 19%Illinois 1,132 946 6 822 629 4 186 123 193 20% 15% 31%
6 Top Foreign-Born States 18,498 14,366 (x) 9,458 5,982 (x) 4,132 4,908 3,476 28.8% 51.9% 58.1%U.S. balance 7,950 5,316 (x) 4,621 3,638 (x) 2,634 695 984 49.5% 15.0% 27.0%
5 Top States, less California 10,499 7,923 (x) 5,886 4,224 (x) 2,576 2,037 1,663 32.5% 34.6% 39.4%
19 New Growth States 3,953 2,023 (x) 1,415 702 (x) 1,930 608 713 95.4% 43.0% 101.6%
Arizona 671 276 14 165 77 17 395 111 89 143% 67% 116%Maryland 508 311 11 194 124 14 197 116 70 63% 60% 56%Virginia 495 310 12 180 72 20 185 129 108 60% 72% 149%North Carolina 307 116 21 78 29 32 191 38 50 164% 49% 173%Georgia 288 173 16 92 33 29 115 81 59 66% 89% 178%Nevada 274 104 23 56 18 40 169 48 38 162% 86% 208%Oregon 266 138 19 106 66 21 127 32 40 92% 30% 61%Colorado 255 142 18 114 60 23 114 27 54 80% 24% 90%Kansas 128 62 30 49 28 33 66 14 21 105% 28% 75%Oklahoma 105 64 29 58 20 35 41 6 38 63% 11% 188%Utah 93 57 33 53 30 30 36 5 23 62% 9% 78%South Carolina 86 48 34 47 14 45 38 2 32 78% 4% 225%Iowa 82 45 35 48 40 25 37 -3 8 83% -6% 19%Kentucky 80 32 39 34 17 42 48 -1 17 147% -4% 105%Idaho 78 28 40 24 13 46 49 4 11 174% 19% 90%Alabama 77 42 36 40 16 43 35 2 24 83% 5% 149%Arkansas 67 25 42 22 8 48 42 3 14 165% 13% 171%Nebraska 61 27 41 31 29 31 34 -4 2 130% -14% 7%Mississippi 33 21 45 24 8 49 12 -3 16 57% -12% 192%
8 Traditional Immigration State 2,918 2,377 (x) 2,353 2,328 (x) 542 23 26 22.8% 1.0% 1.1%
Massachusetts 696 574 7 497 495 6 122 77 3 21% 15% 1%Washington 425 319 10 240 156 12 106 79 84 33% 33% 54%Michigan 418 353 9 414 424 8 65 -61 -10 18% -15% -2%Pennsylvania 407 365 8 402 446 7 42 -38 -44 11% -9% -10%Connecticut 317 278 13 271 262 11 39 7 9 14% 3% 4%Minnesota 284 114 22 105 98 15 170 9 7 149% 8% 7%Ohio 263 256 15 298 316 9 8 -43 -18 3% -14% -6%Wisconsin 108 117 20 125 131 13 -9 -8 -6 -8% -6% -4%
Source: Urban Institute 2001. 40
47

Appendix Table C-1. Foreign-Born Population by State Groups, 1970-1999(Populations in thousands)
Foreign-Born Population Growth Growth RateState or Group of States 1990 1970 1990- 1980- 1970- 1990- 1980- 1970-
1999 Pop. Rank 1980 Pop. Rank 1999 1990 1980 1999 1990 1980
18 Other States 1,079 916 (x) 853 608 (x) 162 63 245 17.7% 7.4% 40.3%
Hawaii 183 165 17 140 76 18 18 25 64 11% 18% 85%Missouri 121 83 27 87 66 22 39 -4 21 47% -5% 33%New Mexico 113 79 28 51 23 34 34 27 29 44% 54% 128%Indiana 112 97 24 103 83 16 15 -6 20 15% -6% 24%Louisiana 107 86 26 85 40 26 21 2 45 24% 2% 114%Rhode Island 93 95 25 85 74 19 -1 10 10 -2% 12% 14%Tennessee 73 58 32 49 19 37 15 9 30 26% 19% 159%District of Columbia 56 59 31 40 34 28 -3 20 6 -6% 49% 18%New Hampshire 51 40 37 41 37 27 11 0 4 28% -1% 10%Maine 34 37 38 43 43 24 -3 -6 0 -8% -15% 0%Alaska 33 23 43 15 8 50 10 8 8 43% 49% 99%Delaware 32 22 44 18 16 44 11 4 2 49% 21% 15%West Virginia 21 16 47 21 17 41 5 -5 4 30% -25% 27%Vermont 20 17 46 22 18 38 3 -5 3 15% -21% 19%Montana 11 14 48 19 20 36 -3 -5 -1 -19% -28% -4%South Dakota 7 7 51 10 11 47 0 -3 -1 -6% -27% -7%Wyoming 6 8 50 9 7 51 -2 -1 2 -27% -9% 33%North Dakota 4 10 49 15 18 39 -6 -6 -3 -59% -37% -18%
Note: "Traditional" immigration states had a foreign-born population of 250,000 in the 1920 Census. The 8 "Traditional"immigration states are: Massachusetts, Connecticut, Pennsylvania, Ohio, Michigan, Wisconsin, Minnesota, andWashington. This group excludes the 5 of the "Big 6" states in 1999 that also exceeded 250,000 in 1920 (i.e.,all except Florida).
"New Growth" states have 1990-1999 growth rates exceeding the fastest growing "Big 6" state (i.e., Texas at 53%).The 19 "New Growth" states, in order of 1999 foreign-born population, are: Arizona, Maryland, Virginia,North Carolina, Georgia, Nevada, Oregon, Colorado, Kansas, Oklahoma, Utah, South Carolina, Iowa, Kentucky,Idaho, Alabama, Arkansas, Nebraska, and Mississippi. The group does not include Minnesota,the only "Traditional" immigration state to meet the growth criterion.
Sources: 1999 data Urban Institute tabulations of March CPS Supplement;1970-1990 decennial census data presented in "Historical Census Statistics on the Foreign-born
Population of the United States: 1850-1990", by Campbell J. Gibson, Population DivisionWorking Paper No. 29, U.S. Census Bureau (February 1999).
Source: Urban Institute 2001. 41 --
4 8
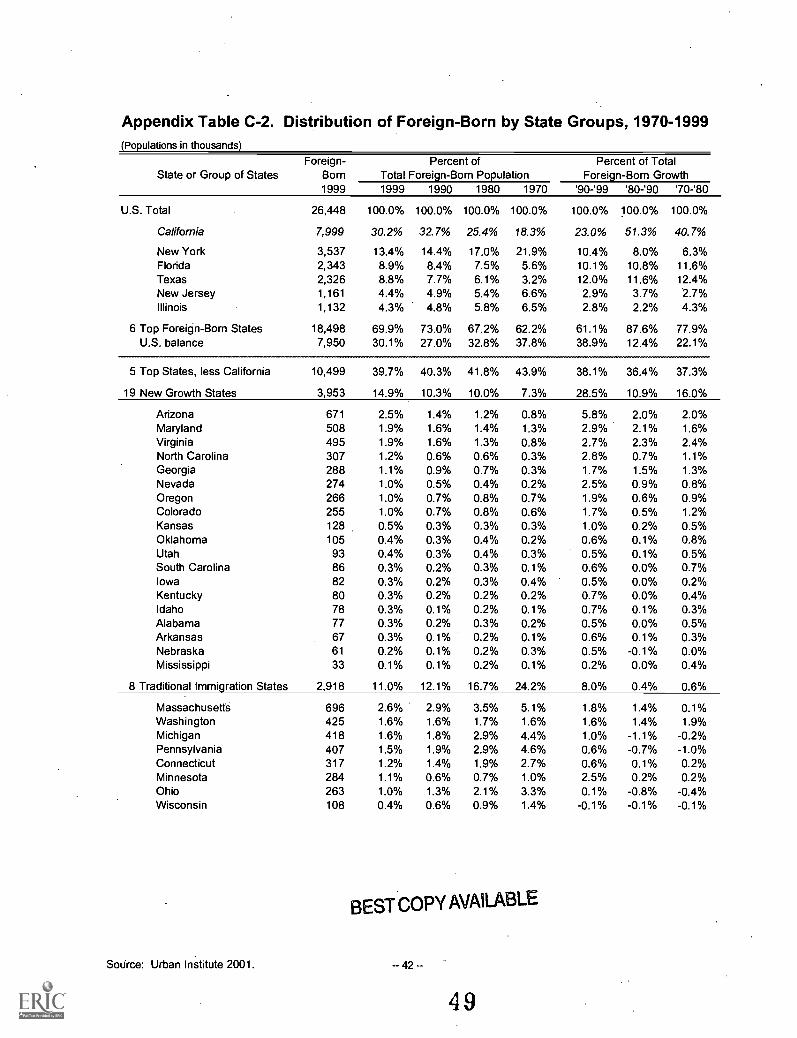
Appendix Table C-2. Distribution of Foreign-Born by State Groups, 1970-1999(Populations in thousands)
State or Group of StatesForeign-
BornPercent of
Total Foreign-Born PopulationPercent of Total
Foreign-Born Growth1999 1999 1990 1980 1970 '90-'99 '80-'90 '70-'80
U.S. Total 26,448 100.0% 100.0% 100.0% 100.0% 100.0% 100.0% 100.0%
California 7,999 30.2% 32.7% 25.4% 18.3% 23.0% 51.3% 40.7%
New York 3,537 13.4% 14.4% 17.0% 21.9% 10.4% 8.0% 6.3%Florida 2,343 8.9% 8.4% 7.5% 5.6% 10.1% 10.8% 11.6%Texas 2,326 8.8% 7.7% 6.1% 3.2% 12.0% 11.6% 12.4%New Jersey 1,161 4.4% 4.9% 5.4% 6.6% 2.9% 3.7% 2.7%Illinois 1,132 4.3% 4.8% 5.8% 6.5% 2.8% 2.2% 4.3%
6 Top Foreign-Born States 18,498 69.9% 73.0% 67.2% 62.2% 61.1% 87.6% 77.9%U.S. balance 7,950 30.1% 27.0% 32.8% 37.8% 38.9% 12.4% 22.1%
5 Top States, less California 10,499 39.7% 40.3% 41.8% 43.9% 38.1% 36.4% 37.3%
19 New Growth States 3,953 14.9% 10.3% 10.0% 7.3% 28.5% 10.9% 16.0%
Arizona 671 2.5% 1.4% 1.2% 0.8% 5.8% 2.0% 2.0%Maryland 508 1.9% 1.6% 1.4% 1.3% 2.9% 2.1% 1.6%Virginia 495 1.9% 1.6% 1.3% 0.8% 2.7% 2.3% 2.4%North Carolina 307 1.2% 0.6% 0.6% 0.3% 2.8% 0.7% 1.1%Georgia 288 1.1% 0.9% 0.7% 0.3% 1.7% 1.5% 1.3%Nevada 274 1.0% 0.5% 0.4% 0.2% 2.5% 0.9% 0.8%Oregon 266 1.0% 0.7% 0.8% 0.7% 1.9% 0.6% 0.9%Colorado 255 1.0% 0.7% 0.8% 0.6% 1.7% 0.5% 1.2%Kansas 128 0.5% 0.3% 0.3% 0.3% 1.0% 0.2% 0.5%Oklahoma 105 0.4% 0.3% 0.4% 0.2% 0.6% 0.1% 0.8%Utah 93 0.4% 0.3% 0.4% 0.3% 0.5% 0.1% 0.5%South Carolina 86 0.3% 0.2% 0.3% 0.1% 0.6% 0.0% 0.7%Iowa 82 0.3% 0.2% 0.3% 0.4% 0.5% 0.0% 0.2%Kentucky 80 0.3% 0.2% 0.2% 0.2% 0.7% 0.0% 0.4%Idaho 78 0.3% 0.1% 0.2% 0.1% 0.7% 0.1% 0.3%Alabama 77 0.3% 0.2% 0.3% 0.2% 0.5% 0.0% 0.5%Arkansas 67 0.3% 0.1% 0.2% 0.1% 0.6% 0.1% 0.3%Nebraska 61 0.2% 0.1% 0.2% 0.3% 0.5% -0.1% 0.0%Mississippi 33 0.1% 0.1% 0.2% 0.1% 0.2% 0.0% 0.4%
8 Traditional Immigration States 2,918 11.0% 12.1% 16.7% 24.2% 8.0% 0.4% 0.6%
Massachusetts 696 2.6% 2.9% 3.5% 5.1% 1.8% 1.4% 0.1%Washington 425 1.6% 1.6% 1.7% 1.6% 1.6% 1.4% 1.9%Michigan 418 1.6% 1.8% 2.9% 4.4% 1.0% -1.1% -0.2%Pennsylvania 407 1.5% 1.9% 2.9% 4.6% 0.6% -0.7% -1.0%Connecticut 317 1.2% 1.4% 1.9% 2.7% 0.6% 0.1% 0.2%Minnesota 284 1.1% 0.6% 0.7% 1.0% 2.5% 0.2% 0.2%Ohio 263 1.0% 1.3% 2.1% 3.3% 0.1% -0.8% -0.4%Wisconsin 108 0.4% 0.6% 0.9% 1.4% -0.1% -0.1% -0.1%
Source: Urban Institute 2001.
BEST COPYAVAILABLE
- 42 --
49
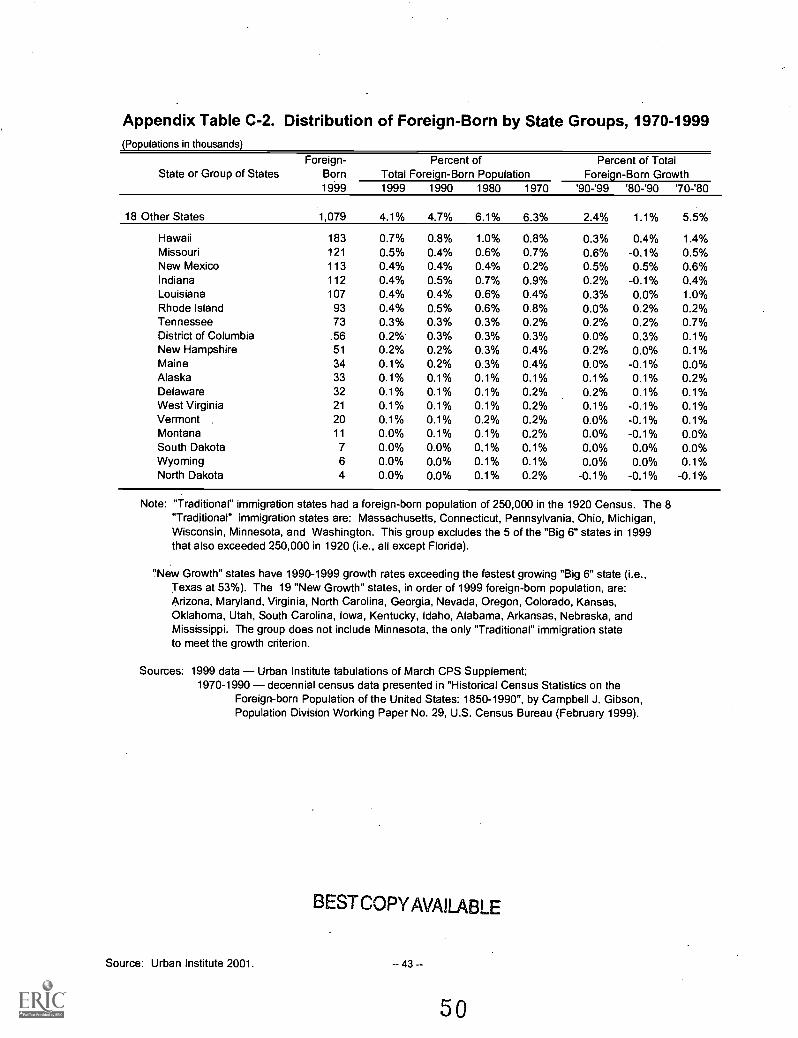
Appendix Table C-2. Distribution of Foreign-Born by State Groups, 1970-1999(Populations in thousands)
State or Group of StatesForeign-
BornPercent of
Total Foreign-Born PopulationPercent of Total
Foreign-Born Growth1999 1999 1990 1980 1970 '90-'99 '80-'90 '70-'80
18 Other States 1,079 4.1% 4.7% 6.1% 6.3% 2.4% 1.1% 5.5%
Hawaii 183 0.7% 0.8% 1.0% 0.8% 0.3% 0.4% 1.4%Missouri 121 0.5% 0.4% 0.6% 0.7% 0.6% -0.1% 0.5%New Mexico 113 0.4% 0.4% 0.4% 0.2% 0.5% 0.5% 0.6%Indiana 112 0.4% 0.5% 0.7% 0.9% 0.2% -0.1% 0.4%Louisiana 107 0.4% 0.4% 0.6% 0.4% 0.3% 0.0% 1.0%Rhode Island 93 0.4% 0.5% 0.6% 0.8% 0.0% 0.2% 0.2%Tennessee 73 0.3% 0.3% 0.3% 0.2% 0.2% 0.2% 0.7%District of Columbia .56 0.2%. 0.3% 0.3% 0.3% 0.0% 0.3% 0.1%New Hampshire 51 0.2% 0.2% 0.3% 0.4% 0.2% 0.0% 0.1%Maine 34 0.1% 0.2% 0.3% 0.4% 0.0% -0.1% 0.0%Alaska 33 0.1% 0.1% 0.1% 0.1% 0.1% 0.1% 0.2%Delaware 32 0.1% 0.1% 0.1% 0.2% 0.2% 0.1% 0.1%West Virginia 21 0.1% 0.1% 0.1% 0.2% 0.1% -0.1% 0.1%Vermont . 20 0.1% 0.1% 0.2% 0.2% 0.0% -0.1% 0.1%Montana 11 0.0% 0.1% 0.1% 0.2% 0.0% -0.1% 0.0%South Dakota 7 0.0% 0.0% 0.1% 0.1% 0.0% 0.0% 0.0%Wyoming 6 0.0% 0.0% 0.1% 0.1% 0.0% 0.0% 0.1%North Dakota 4 0.0% 0.0% 0.1% 0.2% -0.1% -0.1% -0.1%
Note: "Traditional" immigration states had a foreign-born population of 250,000 in the 1920 Census. The 8"Traditional" immigration states are: Massachusetts, Connecticut, Pennsylvania, Ohio, Michigan,Wisconsin, Minnesota, and Washington. This group excludes the 5 of the "Big 6" states in 1999that also exceeded 250,000 in 1920 (i.e., all except Florida).
"New Growth" states have 1990-1999 growth rates exceeding the fastest growing "Big 6" state (i.e.,Texas at 53%). The 19 "New Growth" states, in order of 1999 foreign-born population, are:Arizona, Maryland, Virginia, North Carolina, Georgia, Nevada, Oregon, Colorado, Kansas,Oklahoma, Utah, South Carolina, Iowa, Kentucky, Idaho, Alabama, Arkansas, Nebraska, andMississippi. The group does not include Minnesota, the only "Traditional" immigration stateto meet the growth criterion.
Sources: 1999 data - Urban Institute tabulations of March CPS Supplement;1970-1990 - decennial census data presented in "Historical Census Statistics on the
Foreign-born Population of the United States: 1850-1990", by Campbell J. Gibson,Population Division Working Paper No. 29, U.S. Census Bureau (February 1999).
BESTCOPYAVA1LABLE
Source: Urban Institute 2001. 43 --

Appendix Table C-3. Movement of Foreign-Born by State Groups, 1995-1999(Populations in thousands)
State or Group of StatesForeign-Born
Population, 1999Immigration from Abroad
1995-1999Internal Migration ofF-B (Net), 1995-99
No. Pct. No. Pct. Rate* No. Rate*
U.S. Total 26,448 100.0% 3,682 100.0% 15.0% 0 0.0%
California 7,999 30.2% 821 22.3% 9.9% -101 -1.2%
New York 3,537 13.4% 374 10.2% 11.8% -132 -4.2%Florida 2,343 8.9% 305 8.3% 14.7% 81 3.9%Texas 2,326 8.8% 298 8.1% 13.7% -52 -2.4%New Jersey 1,161 4.4% 154 4.2% 13.7% 10 0.9%Illinois 1,132 4.3% 160 4.4% 15.2% -18 -1.7%
6 Top Foreign-Born States 18,498 69.9% 2,111 57.3% 11.8% -213 -1.2%U.S. balance 7,950 30.1% 1,571 42.7% 23.7% 213 3.2%
5 Top States, less California 10,499 39.7% 1,291 35.1% 13.5% -111 -1.2%
19 New Growth States 3,953 14.9% 979 26.6% 34.6% 351 12.4%
Arizona 671 2.5% 140 3.8% 28.1% 62 12.4%Maryland 508 1.9% 153 4.1% 41.8% 49 13.3%Virginia 495 1.9% 87 2.4% 24.5% 125 35.3%North Carolina 307 1.2% 47 1.3% 26.7% 52 29.5%Georgia 288 1.1% 140 3.8% 52.5% 25 9.3%Nevada 274 1.0% 35 1.0% 20.5% 26 15.4%Oregon 266 1.0% 83 2.2% 39.1% -13 -6.3%Colorado 255 1.0% 85 2.3% 36.8% 35 15.0%Kansas 128 0.5% 36 1.0% 42.8% 3 3.2%Oklahoma 105 0.4% 22 0.6% 25.1% -14 -15.6%Utah 93 0.4% 26 0.7% 37.0% 19 26.3%South Carolina 86 0.3% 23 0.6% 52.4% -24 -55.2%Iowa 82 0.3% 27 0.7% 104.6% 4 16.2%Kentucky 80 0.3% 9 0.2% 30.2% 20 68.5%Idaho 78 0.3% 7 0.2% 15.3% 2 5.4%Alabama 77 0.3% 26 0.7% 36.3% -30 -40.9%Arkansas 67 0.3% 16 0.4% 39.6% 24 59.9%Nebraska 61 0.2% 9 0.3% 37.8% -4 -14.5%Mississippi 33 0.1% 9 0.2% 26.4% -9 -27.7%
8 Traditional Immigration States 2,918 11.0% 387 10.5% 14.0% 14 0.5%
Massachusetts 696 2.6% 79 2.1% 12.5% 14 2.3%Washington 425 1.6% 47 1.3% 12.4% 7 2.0%Michigan 418 1.6% 78 2.1% 19.0% 22 5.4%Pennsylvania 407 1.5% 42 1.1% 9.9% -53 -12.5%Connecticut 317 1.2% 32 0.9% 10.9% -4 -1.3%Minnesota 284 1.1% 55 1.5% 27.6% 44 22.2%Ohio 263 1.0% 39 1.1% 14.2% -2 -0.9%Wisconsin 108 0.4% 15 0.4% 9.5% -14 -9.1%
Source: Urban Institute 2001.
51
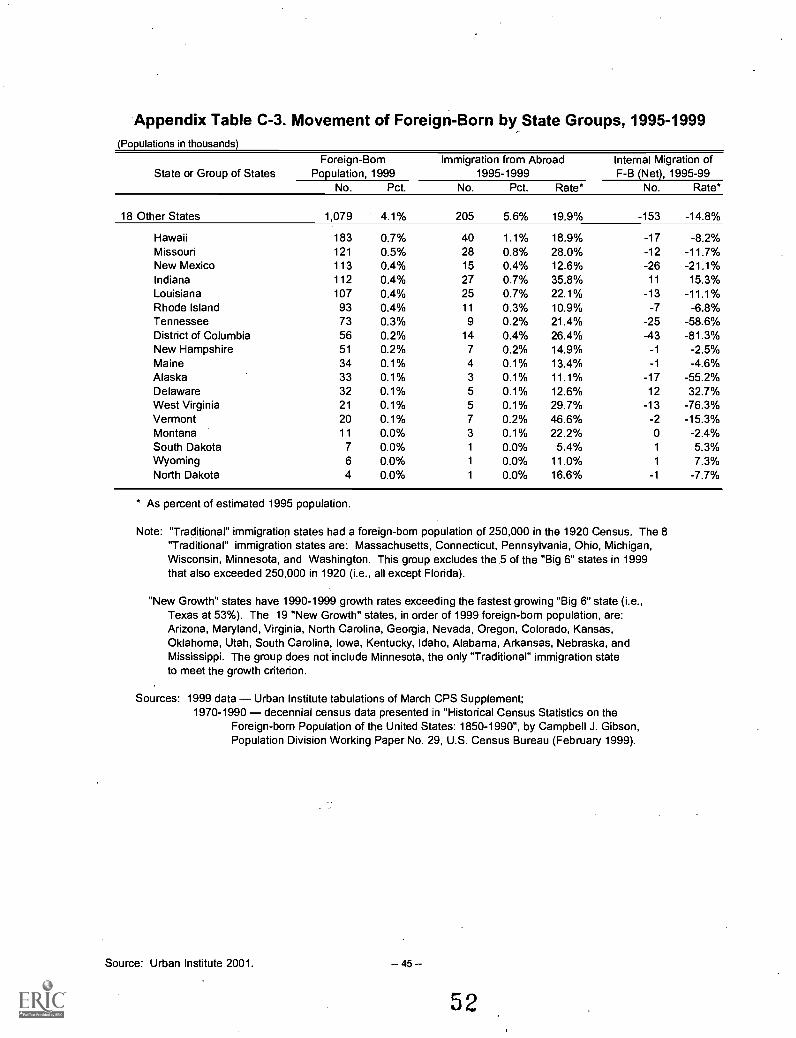
Appendix Table C-3. Movement of Foreign-Born by State Groups, 1995-1999(Populations in thousands)
State or Group of StatesForeign-Born
Population, 1999Immigration from Abroad
1995-1999Internal Migration ofF-B (Net), 1995-99
No. Pct. No. Pct. Rate* No. Rate*
18 Other States 1,079 4.1% 205 5.6% 19.9% -153 -14.8%
Hawaii 183 0.7% 40 1.1% 18.9% -17 -8.2%Missouri 121 0.5% 28 0.8% 28.0% -12 -11.7%New Mexico 113 0.4% 15 0.4% 12.6% -26 -21.1%Indiana 112 0.4% 27 0.7% 35.8% 11 15.3%Louisiana 107 0.4% 25 0.7% 22.1% -13 -11.1%Rhode Island 93 0.4% 11 0.3% 10.9% -7 -6.8%Tennessee 73 0.3% 9 0.2% 21.4% -25 -58.6%District of Columbia 56 0.2% 14 0.4% 26.4% -43 -81.3%New Hampshire 51 0.2% 7 0.2% 14.9% -1 -2.5%Maine 34 0.1% 4 0.1% 13.4% -1 -4.6%Alaska 33 0.1% 3 0.1% 11.1% -17 -55.2%Delaware 32 0.1% 5 0.1% 12.6% 12 32.7%West Virginia 21 0.1% 5 0.1% 29.7% -13 -76.3%Vermont 20 0.1% 7 0.2% 46.6% -2 -15.3%Montana 11 0.0% 3 0.1% 22.2% 0 -2.4%South Dakota 7 0.0% 1 0.0% 5.4% 1 5.3%Wyoming 6 0.0% 1 0.0% 11.0% 1 7.3%North Dakota 4 0.0% 1 0.0% 16.6% -1 -7.7%
* As percent of estimated 1995 population.
Note: "Traditional" immigration states had a foreign-born population of 250,000 in the 1920 Census. The 8"Traditional" immigration states are: Massachusetts, Connecticut, Pennsylvania, Ohio, Michigan,Wisconsin, Minnesota, and Washington. This group excludes the.5 of the "Big 6" states in 1999that also exceeded 250,000 in 1920 (i.e., all except Florida).
"New Growth" states have 1990-1999 growth rates exceeding the fastest growing "Big 6" state (i.e.,Texas at 53%). The 19 "New Growth" states, in order of 1999 foreign-born population, are:Arizona, Maryland, Virginia, North Carolina, Georgia, Nevada, Oregon, Colorado, Kansas,Oklahoma, Utah, South Carolina, Iowa, Kentucky, Idaho, Alabama, Arkansas, Nebraska, andMississippi. The group does not include Minnesota, the only "Traditional" immigration stateto meet the growth criterion.
Sources: 1999 data - Urban Institute tabulations of March CPS Supplement;1970-1990 - decennial census data presented in "Historical Census Statistics on the
Foreign-born Population of the United States: 1850-1990", by Campbell J. Gibson,Population Division Working Paper No. 29, U.S. Census Bureau (February 1999).
Source: Urban Institute 2001. 45
52

Appendix Table D-1. Mobility by Educational Attainment, Poverty Level, and Food Stamp Usage,by Nativity for California: 1995-1999, Based on March 1996-1999 CPS
(In thousands)
Native Foreign-BornMeasure and Stayed Immig. Immig. & In- Out- Stayed Immig. Immig. & In- Out-Category in from In- Out- Net In-mover Mover Mover in from In- Out- Net In-mover Mover Mover
Calif. Abroad Mover Mover Moves Pct. Pct. Rate Calif. Abroad Mover Mover Moves Pct. Pct. Rate
Educational AttainmentAges 25-64 11,151 80 825 964 -140 7.5% 6.9% -8.0% 5,391 428 160 227 -67 9.8% 2.9% -4.0%
<HS Grad 877 7 50 67 -18 6.1% 5.4% -7.1% 2,189 155 33 79 -46 7.9% 1.5% -3.5%HS Grad 2,898 9 215 283 -68 7.2% 6.9% -8.9% 1,070 69 22 61 -39 7.9% 2.0% -5.4%Some College 3,936 31 240 304 -65 6.4% 5.7% -7.2% 907 64 32 17 14 9.5% 3.4% -1.9%BA+ 3,440 33 320 310 11 9.3% 8.5% -8.3% 1,225 139 74 71 3 14.8% 5.7% -5.5%
% <HS Grad 8% 9% 6% 7% (x) (x) (x) (x) 41% 36% 21% 35% (x) (x) (x) (x)% BA+ 31% 41% 39% 32% (x) (x) (x) (x) 23% 33% 46% 31% (x) (x) (x) (x)
Poverty LevelAges 18-64 13,292 152 1,042 1,225 -184 8.2% 7.3% -8.4% 6,286 620 198 308 -110 11.5% 3.1% -4.7%
< 100% 1,379 33 119 183 -65 9.9% 7.9% -11.7% 1,263 322 40 103 -63 22.2% 3.0% -7.5%100-199% 1,767 50 176 270 -94 11.3% 9.0% -13.2% 1,746 118 47 56 -8 8.7% 2.6% -3.1%>200% 10,146 69 747 772 -25 7.4% 6.9% -7.1% 3,276 180 111 150 -39 8.2% 3.3% -4.4%
% <100% 10.4% 21.5% 11.4% 15.0% (x) (x) (x) (x) 20.1% 51.8% 20.0% 33.3% (x) (x) (x) (x)
Food Stamps Use in Household(Persons classified by nativity of household)
Ages 18+ 14,761 160 1,101 1,259 -159 7.9% 6.9% -7.9% 8,150 642 235 360 -125 9.7% 2.8% -4.2%
Food Stamps 806 8 39 130 -91 5.5% 4.6% -13.9% 678 61 22 38 -16 10.8% 3.1% -5.2%No Food Stamps 13,955 152 1,062 1,130 -68 8.0% 7.1% -7.5% 7,472 581 214 323 -109 9.6% 2.8% -4.1%
% Food Stamps 5.5% 5.1% 3.5% 10.3% (x) (x) (x) (x) 8.3% 9.5% 9.3% 10.4% (x) (x) (x) (x)
Labor Force
Males, Ages 18-64Total 6,692 83 511 609 -98 8.2% 7.1% -8.3% 3,204 387 105 159 -54 13.3% 3.2% -4.7%
Employed 5,219 39 398 424 -26 7.7% 7.1% -7.5% 2,602 223 78 132 -54 10.4% 2.9% -4.8%Unemployed 377 17 34 50 -15 12.0% 8.3% -11.6% 200 47 3 13 -10 20.1% 1.5% -6.0%Not in LF 1,041 13 39 106 -67 4.7% 3.6% -9.2% 387 116 24 14 10 26.6% 5.8% -3.4%
% in LF 84% 82% 92% 82% (x) (x) (x) (x) 88% 70% 77% 91% (x) (x) (x) (x)% Unemployed 7% 30% 8% 10% (x) (x) (x) (x) 7% 18% 4% 9% (x) (x) (x) (x)
Females, Ages 18-64Total 6,600 69 531 616 -86 8.3% 7.4% -8.5% 3,082 234 93 150 -57 9.6% 2.9% -4.6%
Employed 4,529 47 338 360 -21 7.8% 7.0% -7.4% 1,715 81 44 65 -21 6.8% 2.5% -3.7%Unemployed 260 2 35 42 -7 12.5% 11.9% -14.0% 143 13 6 14 -8 11.7% 3.8% -8.8%Not in LF 1,807 20 155 211 -56 8.8% 7.9% -10.5% 1,224 140 43 70 -28 13.0% 3.4% -5.4%
% in LF 73% 71% 71% 66% (x) (x) (x) (x) 60% 40% 54% 53% (x) (x) (x) (x)% Unemployed 5% 4% 9% 11% (x) (x) (x) (x) 8% 14% 11% 17% (x) (x) (x) (x)
Occupation, both sexes, ages 18-64Total 13,292 152 1,042 1,225 -184 8.2% 7.3% -8.4% 6,286 620 198 308 -110 11.5% 3.1% -4.7%
"White" Collar 7,090 69 594 557 37 8.6% 7.7% -7.3% 1,966 101 84 78 6 8.6% 4.1% -3.8%"Blue" Collar 3,332 33 222 349 -127 7.1% 6.3% -9.5% 2,707 261 47 144 -97 10.2% 1.7% -5.0%
Not in universe 2,871 50 225 318 -94 8.7% 7.3% -10:0% 1,612 259 67 87 -20 16.8% 4.0% -5.1%
Note: "Stayed in California" is an average of nonmovers and within state movers for the March 1996-1999 CPSs. Immigrants from abroad,in-movers, and out-movers are the total across the four CPSs. All data are from the question on residence one year ago.
BEST COPY AVAILABLE
Source: Urban Institute 2001. 46 -
5 3

Appendix Table D-2. Distribution by Educational Attainment, Poverty Level, and Food Stamp Usagewithin Mobility Categories by Nativity for California:
1995-1999, Based on March 1996-1999 CPS
Measure andCategory
Distribution within Mover Category
Stayedin
Calif.
NativeImmig.
from In-Abroad Mover
Out-Mover
Foreign-BomStayed Immig.
in from In-Calif. Abroad Mover
Out-Mover
Ratio of Native Rateto Foreign-Born
Immig. & In- Out-In-mover Mover Mover
Pct. Pct. Rate
Educational AttainmentAges 25-64 100.0% 100.0% 100.0% 100.0% 100.0% 100.0% 100.0% 100.0% 0.76 2.39 1.97
<HS Grad 7.9% 9.1% 6.0% 7.0% 40.6% 36.3% 20.6% 34.5% 0.77 3.61 2.06HS Grad 26.0% 11.1% 26.1% 29.3% 19.8% 16.2% 13.8% 26.8% 0.91 3.40 1.65Some College 35.3% 38.6% 29.0% 31.6% 16.8% 15.0% 19.7% 7.5% 0.67 1.71 3.88BA+ 30.9% 41.2% 38.8% 32.1% 22.7% 32.5% 45.9% 31.2% 0.63 1.50 1.51
Poverty LevelAges 18-64 100.0% 100.0% 100.0% 100.0% 100.0% 100.0% 100.0% 100.0% 0.72 2.38 1.80
<100% 10.4% 21.5% 11.4% 15.0% 20.1% 51.8% 20.0% 33.3% 0.44 2.61 1.56100-199% 13.3% 33.0% 16.9% 22.0% 27.8% 19.1% 23.8% 18.0% 1.31 3.44 4.28>200% 76.3% 45.6% 71.7% 63.0% 52.1% 29.1% 56.2% 48.7% 0.91 2.09 1.61
Food Stamps Use in Household(Persons classified by nativity of household)
Ages 18+ 100.0% 100.0% 100.0% 100.0% 100.0% 100.0% 100.0% 100.0% 0.81 2.47 1.86
Food Stamps 5.5% 5.1% 3.5% 10.3% 8.3% 9.5% 9.3% 10.4% 0.51 1.47 2.65No Food Stamps 94.5% 94.9% 96.5% 89.7% 91.7% 90.5% 90.7% 89.6% 0.83 2.55 1.81
Labor Force
Males, Ages 18-64Total 100.0% 100.0% 100.0% 100.0% 100.0% 100.0% 100.0% 100.0% 0.61 2.23 1.77
Employed 78.0% 47.5% 77.9% 69.7% 81.2% 57.7% 74.4% 83.0% 0.75 2.43 1.56Unemployed 5.6% 20.6% 6.7% 8.1% 6.2% 12.3% 2.8% 8.0% 0.60 5.74 1.94Not in LF 15.5% 15.2% 7.5% 17.3% 12.1% 30.0% 22.8% 8.6% 0.18 0.61 2.70
Females, Ages 18-64Total 100.0% 100.0% 100.0% 100.0% 100.0% 100.0% 100.0% 100.0% 0.87 2.54 1.84
Employed 68.6% 68.3% 63.8% 58.3% 55.7% 34.6% 47:6% 43.7% 1.15 2.76 2.00Unemployed 3.9% 3.1% 6.6% 6.9% 4.6% 5.6% 6.1% 9.2% 1.07 3.09 1.58Not in LF 27.4% 28.6% 29.1% 34.3% 39.7% 59.7% 46.2% 47.0% 0.68 2.32 1.92
Occupation, both sexes, ages 18-64Total 100.0% 100.0% 100.0% 100.0% 100.0% 100.0% 100.0% 100.0% 0.72 2.38 1.80
'White" Collar 53.3% 45.3% 57.1% 45.5% 31.3% 16.2% 42.3% 25.3% 1.00 1.89 1.91
"Blue" Collar 25.1% 21.8% 21.4% 28.5% 43.1% 42.0% 23.9% 46.6% 0.70 3.64 1.88
Not in universe 21.6% 32.9% 21.6% 26.0% 25.6% 41.7% 33.8% 28.1% 0.52 1.82 1.96
Note: "Stayed in California" is an average of nonmovers and within state movers for the March 1996-1999 CPSs.Immigrants from abroad, in-movers, and out-movers are the total across the four CPSs.
Source: Urban Institute 2001. 47 --
54

U.S. Department of EducationOffice of Educational Research and Improvement (OEM)
National Library of Education (NLE)Educational Resources Information Center (ERIC)
NOTICE
REPRODUCTION BASIS
IC
This document is covered by a signed "Reproduction Release(Blanket) form (on file within the ERIC system), encompassing allor classes of documents from its source organization and, therefore,does not require a "Specific Document" Release form.
This document is Federally-funded, or carries its own permission toreproduce, or is otherwise in the public domain and, therefore, maybe reproduced by ERIC without a signed Reproduction Release form(either "Specific Document" or "Blanket").
EFF-089 (9/97)