![Introduction · 4 Western Marsh Harrier Circus aeruginosus [Linnaeus 1758, Sweden]. [C.a. aeruginosus] Europe & Asia Minor E to upper R Yenisey & Mongolia (C Asia).Winters W & S Europe,](https://static.fdocuments.net/doc/165x107/5fc3be51c2ab4748c76e476f/introduction-4-western-marsh-harrier-circus-aeruginosus-linnaeus-1758-sweden.jpg)
REPRODUCTION OF THE MARSH HARRIER CIRCUS … Kiekendief6.pdf · 37 reproduction of the marsh...
14
37 REPRODUCTION OF THE MARSH HARRIER CIRCUS AERUGINOSUS IN RECENT LAND RECLAMATIONS IN THE NETHERLANDS C. DIJKSTRAl,2 & M. ZIJLSTRAI Dijkstra C. & M. Zijlstra 1997. Reproduction of the Marsh Harrier Circus aeruginosus in recent land reclamations in The Netherlands. Ardea 85: 37- 50. We studied temporal variation in reproductive performance of Marsh Har- riers Circus aeruginosus in two land reclamations in The Netherlands, i.e. South Flevoland and the Lauwersmeerpolder, embanked in 1968 and 1969 respectively. The number of breeding pairs in Flevoland rapidly increased to a maximum of 350 pairs (± 1 pair km- 2 ) in 1977, followed by a sharp de- cline in the 1980s due to large-scale cultivation. The same trend was ob- served in the Lauwersmeer, although colonization was retarded and peak densities were reached later. In both study areas mean clutch size as well as the number of fledglings per nest decreased in the course of the twenty years of study. Two factors were responsible for this decline in reproductive output: (1) decrease of food abundance in the course of the years, and (2) an increase of nest predation, mainly by the Red Fox Vulpes vulpes. Super- imposed on these long-term changes, annual fluctuations in density of the Common Vole Microtus arvalis had a considerable effect on the number of breeding pairs, as well as the fledgling production. Mean annual clutch size was associated positively, and laying date negatively, with the average an- nual temperature during the pre-laying phase. Our results indicate that the early stages of succession, during the first de- cade after reclamation, are characterized by high prey abundance (i.e. vole 'plagues') and low densities of ground predators, and offer favorable breeding conditions for Marsh Harriers. The simultaneous negative effects in recent years of less breeding habitat, decreased prey abundance and in- creased predation on reproductive output, exert pressure on these popula- tions. The intense nest predation (50% of all nests), as recorded in the Lau- wersmeer since 1990, may eventually cause local extinction in the absence of, relatively safe, inundated breeding habitat. Key words: Circus aeruginosus - reproduction - succession - predation - prey abundance - Vulpes vulpes - Microtus arvalis IMinistry of Transport and Public Works, Institute for Inland Water Man- agement and Waste Water Treatment (RIZA), P.O. Box 17, 8200 AA Lely- stad, The Netherlands; 2Address for correspondence: Zoological Labora- tory, University of Groningen, P.O. Box 14,9750 AA Haren, The Nether- lands; E-mail: [email protected]. INTRODUCTION The past three decades have witnessed substantial increases in numbers of many raptor species in W. Europe. These changes are probably attributable to the ban on organochlorine pesticides and laws against persecution (Bijleveld 1974, Newton 1979). For some raptor populations in The Nether- lands, there has simultaneously been a third factor of potential importance: several large scale land
Transcript of REPRODUCTION OF THE MARSH HARRIER CIRCUS … Kiekendief6.pdf · 37 reproduction of the marsh...
37
REPRODUCTION OF THE MARSH HARRIER CIRCUS
AERUGINOSUS IN RECENT LAND RECLAMATIONS IN THE
NETHERLANDS
C. DIJKSTRAl,2 & M. ZIJLSTRAI
Dijkstra C. & M. Zijlstra 1997. Reproduction of the Marsh Harrier Circusaeruginosus in recent land reclamations in The Netherlands. Ardea 85: 3750.
We studied temporal variation in reproductive performance of Marsh Harriers Circus aeruginosus in two land reclamations in The Netherlands, i.e.South Flevoland and the Lauwersmeerpolder, embanked in 1968 and 1969respectively. The number of breeding pairs in Flevoland rapidly increasedto a maximum of 350 pairs (± 1 pair km-2) in 1977, followed by a sharp decline in the 1980s due to large-scale cultivation. The same trend was observed in the Lauwersmeer, although colonization was retarded and peakdensities were reached later. In both study areas mean clutch size as well asthe number of fledglings per nest decreased in the course of the twentyyears of study. Two factors were responsible for this decline in reproductiveoutput: (1) decrease of food abundance in the course of the years, and (2)an increase of nest predation, mainly by the Red Fox Vulpes vulpes. Superimposed on these long-term changes, annual fluctuations in density of theCommon Vole Microtus arvalis had a considerable effect on the number ofbreeding pairs, as well as the fledgling production. Mean annual clutch sizewas associated positively, and laying date negatively, with the average annual temperature during the pre-laying phase.Our results indicate that the early stages of succession, during the first de
cade after reclamation, are characterized by high prey abundance (i.e. vole'plagues') and low densities of ground predators, and offer favorablebreeding conditions for Marsh Harriers. The simultaneous negative effectsin recent years of less breeding habitat, decreased prey abundance and increased predation on reproductive output, exert pressure on these populations. The intense nest predation (50% of all nests), as recorded in the Lauwersmeer since 1990, may eventually cause local extinction in the absenceof, relatively safe, inundated breeding habitat.
Key words: Circus aeruginosus - reproduction - succession - predation prey abundance - Vulpes vulpes - Microtus arvalis
IMinistry of Transport and Public Works, Institute for Inland Water Management and Waste Water Treatment (RIZA), P.O. Box 17, 8200 AA Lelystad, The Netherlands; 2Address for correspondence: Zoological Laboratory, University of Groningen, P.O. Box 14,9750 AA Haren, The Netherlands; E-mail: [email protected].
INTRODUCTION
The past three decades have witnessed substantialincreases in numbers of many raptor species in W.Europe. These changes are probably attributable
to the ban on organochlorine pesticides and laws
against persecution (Bijleveld 1974, Newton
1979). For some raptor populations in The Netherlands, there has simultaneously been a third factor
of potential importance: several large scale land

38 ARDEA 85(1), 1997
928782
year777267
o
Fig. 1. Development of land use in the polderSouth Flevoland after embankment and sowing ofreed in 1968.
200
100
STUDY AREAS AND METHODS
400
500
colonize the new areas more slowly. It is thus ofinterest to evaluate how these biotic factors haveaffected reproductive rates in the Marsh Harrier.
N
g300coQ}
m
Data on Marsh Harrier reproduction were collected in two polders in The Netherlands: SouthFlevoland (52°20'N, 05°20'E; 430 km2) was reclaimed from the fresh water lake IJsselmeer in1968, and the Lauwersmeerpolder (53°20'N,06°15'E; 91 km2) in 1969 from the Waddensea. InSouth Flevoland, reed was sown for soil-ripeningpurposes in the year after embankment, resultingin extensive suitable breeding habitat for MarshHarriers in 1970. During the following fifteen,years the polder was gradually brought into cultivation, except for c. 40 km2, (i.e. 9% of the totalarea) in the nature reserves Oostvaardersplassenand Lepelaarplassen (Fig. 1). During the first 5-10years of cultivation, extensive state-managed agriculture was carried out, before the ground wassold for private, intensive farming. Eventually53% (230 km2) of the polder was transformedinto agricultural land, and 21 % (90 km2) was forested. Another 17% (70 km2) was used for urban
reclamations in the 1960s. In earlier reclamations,e.g., in the Noordoostpolder, a 490 km2 polder reclaimed in 1940, it was noted that especially theMarsh Harrier Circus aeruginosus bred in highdensities for a number of years (Bakker 1954).Cultivation of the land caused this to be only atemporary settlement. With the creation of thepolders 'South Flevoland' (1968) and 'Lauwersmeer' (1969), it was decided to monitor raptorpopulations more closely, and study their responses to the changes in habitat. Because of rapid succession and change in land use, the poldersprovided a unique opportunity to study the responses of different bird species. In particular, toassess the extent to which marked populationfluctuations are attributable to, on the one hand,changes in reproductive output, and on the otherto numerical responses of the adult population interms of dispersal and survival. In the present paper, we evaluate thirteen years of data on reproduction of the Marsh Harrier in Flevoland, andeighteen years of data from the Lauwersmeerarea.
The Marsh Harrier lends itself in particular tothis analysis, since it is a bird adapted to breedingin high reed Phragmites australis vegetation,characteristic of young polders. Marsh Harrier (eproductive biology has been intensively studiedin more stable marshlands in Poland (Witkowski1989) and France (Bavoux et al. 1989), and thesedata will be used as a reference in our currentanalysis. The conspicious increase of the breedingpopulation in the Lauwersmeer has been reportedby Altenburg et al. (1987). In addition to reproductive parameters, we have collected and analysed data on one of the primary food items, theCommon Vole Microtus arvalis and on a dominant predator, the Red Fox Vulpes vulpes. It iswell known that one of the typical changes following embankment of new polders is a temporary outbreak of voles (Noordoostpolder: Bakker& van der Zweep 1949; East Flevoland: Cave1968; Lauwersmeer: Timmerman 1971; Volkerak:Dijkstra 1994). This may well be an influentialfactor in fluctuations of raptor populations. Predators (and food competitors) such as the Red Fox

Dijkstra & Zijlstra: MARSH HARRIER REPRODUCTION IN YOUNG POLDERS 39
development (Fig. 1).After reclamation of the Lauwersmeerpolder
(1969) from the Waddensea, a fresh water lake (±20 km2 , i.e. 22%) remained in the lowest centralpart of the area. The higher sandflats and formersalt-marshes fell permanently dry. In this polderno reed was sown and vegetation succession onthe former sandflats was slow, due to persistingsalinity (Joenje 1978). On the higher parts alongthe edge of the polder suitable breeding habitatfor Marsh Harriers emerged in the first years afterembankment (Altenburg et at. 1987), due to natural development of dense vegetation, dominatedby Atriptex prostata, Epitobium hirsutum andreed. After about ten years, reed gradually spreadover the former sandflats, thereby extending thepotential breeding habitat for Marsh Harriers (Altenburg et at. 1987). For a detailed description ofvegetation development and management in theLauwersmeer we refer to Beemster et at. (1989).In contrast with South Flevoland, no large-scalecultivation of the major breeding grounds occurred.
The number of Marsh Harrier nests was determined annually in both polders for the first 25years after reclamation (until 1994). Data on reproductive output were collected in South Flevoland from 1975 to 1987, and in the Lauwersmeerfrom 1977 to 1994. Nests were located by observing courtship behaviour, nest building and preydeliveries. A clutch was considered completed,when at two consecutive nest visits the samenumber of eggs was present. Laying date of thefirst egg was determined by back-calculation, assuming that the eggs were laid every other day.When the nest was found after the laying periodwe used the wing-length of the eldest nestling toestimate hatching date and subtracted 33 incubation days, to calculate the laying date of the firstegg of the clutch (Zijlstra et at. 1992). Reproductive success was recorded shortly before fledging,when the young were ringed. Prey items found onthe nests were counted and identified.
Common Vole abundance was estimated inthe Lauwersmeerpolder for the years 1981 to1992, by means of break-neck trapping, per-
formed six times per year (1981-1986) and thenthree times per year (March, July, September, in1987-1992). At every census, 500 traps, baitedwith carrot, were distributed over ten fixed plots(50 traps per plot). The traps were checked for thenext three days and then removed. This resultedin 500 (traps) x 3 (nights) = 1500 trapnights percensus (for details, see Dijkstra et at. 1988). Additional information on local vole densities wasavailable from other sources (Daan & Slopsema1978, Hoogenboom et at. 1984, Masman et at.1988, Dijkstra et at. 1990). Mean temperatures perlO-day interval, based on data from the five mainmeteorological stations in The Netherlands, werederived from the Royal Dutch Meteorological Institute (KNMI). In order to analyse annual variation in reproductive parameters in relation to weather, we used relative temperature, i.e. the difference between the actual temperature and the longterm average value (1961-1990), for the datesconcerned. The statistical package used for theanalyses was SX (version 4.0, NH AnalyticalSoftware Compo 1992). All tests were two-tailed,unless stated otherwise.
RESULTS
Marsh Harriers in The Netherlands: ringingdata
Quantitative data on annual variation in reproductive parameters of Marsh Harriers in TheNetherlands are lacking for the first half of the20th century, but there is some basic informationon the number of nestlings ringed. From 1935 until the early 1970s, the annual number of nestlingsringed averaged about 25 (Fig. 2A). Subsequently, the numbers sharply increased to around500 individuals annually. In total, 8285 nestlingswere ringed up until 1990. When eliminatinglong-term trends, by expressing the annual number ringed as a multiple of the 5-year runningmean (Fig. 2B), considerable variation betweenyears remained. In the early years this is obviously related to the small sample sizes, but also inrecent years, when consistently more than 300
40 ARDEA 85(1), 1997
0.8E-"
0.6 ~CI)
en0.4 ~
0.2
0.0
0.8E-"
0.6 ~CI)
en0.4 ~
0.2
® 1.2
1.0
90 9470 74 78 82 86year
0.0,.-'----:._--'-----'---'----'------'--,® 1.2
1.0
o'---,---"'''---''\'''''400 South Flevoland
100 Lauwersmeer
80
20
Q;~ 40:::Jc:
CI)
en())
c: 60
o
CI) 300enQ)c:
'0 200Q;.0E:::Jc: 100
700 ®600
"0 500())Cl.§ 400
g 300
200
100
0
2.0 ®
"0 1.5())Clc:.;::
ci1.0c:
())>'fJ~ 0.5
0.035 45 55 65 75 85 95
year
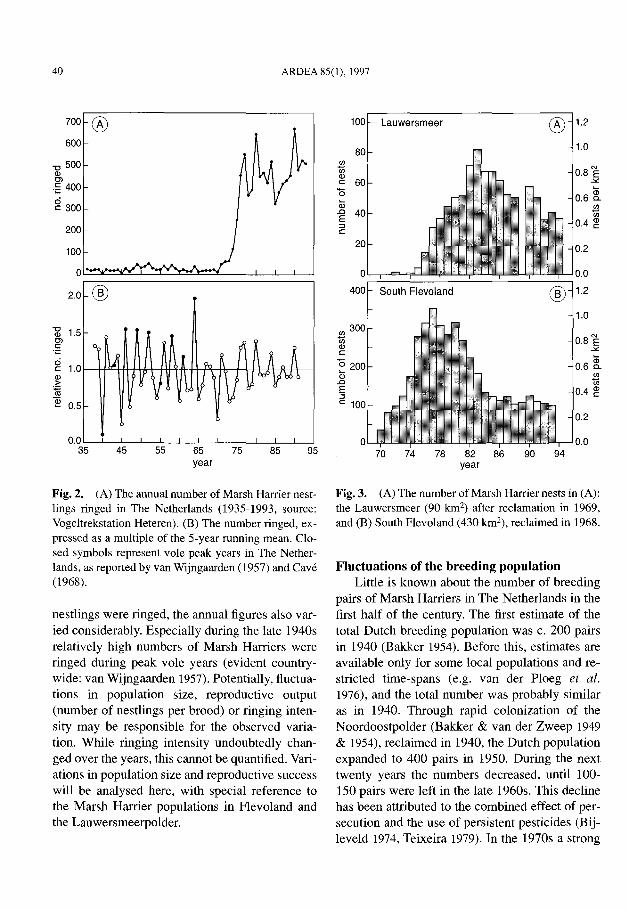
Fig. 2. (A) The annual number of Marsh Harrier nestlings ringed in The Netherlands (1935-1993, source:Vogeltrekstation Heteren). (B) The number ringed, expressed as a multiple of the 5-year running mean. Closed symbols represent vole peak years in The Netherlands, as reported by van Wijngaarden (1957) and Cave(1968).
nestlings were ringed, the annual figures also varied considerably. Especially during the late 1940srelatively high numbers of Marsh Harriers wereringed during peak vole years (evident countrywide: van Wijngaarden 1957). Potentially, fluctuations in population size, reproductive output(number of nestlings per brood) or ringing intensity may be responsible for the observed variation. While ringing intensity undoubtedly changed over the years, this cannot be quantified. Variations in population size and reproductive successwill be analysed here, with special reference tothe Marsh Harrier populations in Flevoland andthe Lauwersmeerpolder.
Fig. 3. (A) The number of Marsh Harrier nests in (A):the Lauwersmeer (90 km2) after reclamation in 1969,and (B) South Flevoland (430 km2), reclaimed in 1968.
Fluctuations of the breeding populationLittle is known about the number of breeding
pairs of Marsh Harriers in The Netherlands in thefirst half of the century. The first estimate of thetotal Dutch breeding population was c. 200 pairsin 1940 (Bakker 1954). Before this, estimates areavailable only for some local populations and restricted time-spans (e.g. van der Ploeg et al.1976), and the total number was probably similaras in 1940. Through rapid colonization of theNoordoostpolder (Bakker & van der Zweep 1949& 1954), reclaimed in 1940, the Dutch populationexpanded to 400 pairs in 1950. During the nexttwenty years the numbers decreased, until 100150 pairs were left in the late 1960s. This declinehas been attributed to the combined effect of persecution and the use of persistent pesticides (Bijleveld 1974, Teixeira 1979). In the 1970s a strong

Dijkstra & Zijlstra: MARSH HARRIER REPRODUCTION IN YOUNG POLDERS 41
increase in numbers occurred, to about 1000 pairsin 1980 (SOVON 1987). The population continued to expand in recent years: in 1992, approximately 1400 breeding pairs were estimated forThe Netherlands (Bijlsma 1993).
The new polders South Flevoland and theLauwersmeer, account for a large part of the population expansion (Teixeira 1979, Altenburg et at.1987). The reedbeds in South Flevoland (430km2) were colonized rapidly, and a maximum of350 pairs (0.81 pairs km-2) was reached in 1977(Fig. 3B), which was more than half the Dutchpopulation at that time. Although cultivation ofthe reedbeds was already in full progress by then(see Fig. 1), the numbers declined only since1981. After 1985 (125 nests), the rate of declinedecreased, resulting in about 100 nests in 1993,mainly concentrated in two nature reserves, Oostvaardersplassen and Lepelaarplassen (Fig. 3B).
In the Lauwersmeer it took longer before thearea was colonized (Fig. 3A, Altenburg et at.1987). Suitable breeding habitat developed moregradually, because of the high salinity of the soil(Joenje 1978). Peak numbers were reached in1983 (83 nests; 0.91 pairs km-2), 14 years afterreclamation. Subsequently the population declined steadily, although no large-scale cultivation has taken place. In 1994, ten years after thepeak, there were 38 nesting attempts (Fig. 3A). In1994 only 10% of the Dutch population was located in South Flevoland and Lauwersmeer, dueboth to the decline in those areas, and a simultaneous increase in other parts of the country, especially the Wadden Sea islands and the MeuseSchelde delta (Bijlsma 1993).
Food abundance and predationNew land reclamations are characterized by
colonization of a limited number of plant and animal species, with high densities caused by rapidgrowth and reproduction. Extremely high densities of the Common Vole, one of the most important prey species of wetland raptors (Glutz vonBlotzheim et at. 1971), are also typical of youngpolders (Cave 1968, Dijkstra 1994). In later yearsvegetation succession is slower and vole 'pla-
n. 34 96 147 70 93 89 61 64 58 66 30 46 45>- 50lDa.~ 40CiilDC::0
:S 30"ji:(J)
"* 20cco~ 10Q..oa.
o75 77 79 81 83 85 87
year
Fig. 4. The percentage of Marsh Harrier broods inF1evoland where fresh, as yet uneaten prey was presentat the nest when the nestlings were ringed. This percentage declined in the course of the thirteen years ofstudy: logistic regression: 0 deviance = 78.7, Fl,ll =44.65, P < 0.0001. Numbers indicate the number ofnests checked.
• 80
<D0
lD 70 "0E c(J) ro<D 60 (5
>$: lD::0
50 25 u::ro....J ..clD "5:S 40 20 c75c
ClD 30 15 ;;N
"0; C
c 20 10 .E0
§ <D10 5 ..0
::0 EQ..0 ::0Q.. 0 0 c
75 77 79 81 83 85 87 89 91 93year
Fig. 5. The number of Red Faxes in the Lauwersmeer(population size) and South Flevoland (the number reported as traffic victims or drowned in canals).
gues' were not recorded anymore in the naturallydeveloping parts of the study areas. Since theMarsh Harrier is not a typical vole specialist, it remains speculative whether the total potential preyabundance for this raptor indeed decreased with

42 ARDEA 85(1), 1997
60
50
Ol
~ 40:§(J)
30enQ)c'0 20;ft
10
o'--=7"=5----='77'::-::':79"""-'8::'-:1----=8"=3----='85=--8='=7"""-'8='=9----=9L1----='93=--9::':5,...--J
year
Fig. 6. Annual variation in failure of Marsh Harriernests in the Lauwersmeer and Flevoland from 19751995.
bite wounds. Sometimes predation by a fox wasactually observed, and remains of Marsh Harrierswere found at fox dens. Especially in the Lauwersmeer, harrier nests were vulnerable to groundpredators because the reedbeds are relatively dry.The situation is different in Flevoland, wherelarge inundated reedbeds are present in the twonature reserves. Since 1990, Marsh Harrier nestsin these reserves were sited exclusively at inundated spots (pers. obs.).
Parameters of reproductive successLong-term trends in breeding performanceFigure 7 gives an overview for both study areas ofthe average clutch size and number of fledglingsraised, during the study period. The averageclutch size was 4.59 eggs (SD = 1.0, n = 397) in
Fig. 7. Annual variation in clutch size and brood sizeat fledging in (A) the Lauwersmeer, and (B) Flevoland.
OL--L--l..._L---'-----'_--'-----'-_-L----'-_L---'----'75 77 79 81 83 85 87 89 91 93 95
year
®
®6 Lauwersmeer
O~========,==~6 South Flevoland
(J) 5OlOlQ)
o 4(J)
Olc'5,3"0Q)
;;::
Q; 2..cE:::JC
the age of the polders. Prey species may includebirds and their eggs, mammals, amphibians andfish (Schipper 1973a, Witkowski 1989, Clarke etat. 1993). However, the proportion of nests wherefresh, yet uneaten, prey was present when theyoung were ringed, decreased significantly overthe years (Fig. 4), suggesting worsening foodconditions.
Foxes colonized the polders during the seconddecade after embankment (Figs. 5A & B). Thisspecies is a competitor for food, and a predator ofMarsh Harriers. After the appearance of the fox inthe Lauwersmeer, colonies of ground-nesting species, such as gulls disappeared within two years,and the number of breeding ducks and waders decreased considerably (Beemster et at. 1989).
These species, their eggs and young were regularly preyed upon by Marsh Harriers in the earlyyears after embankment of the polders (Altenburget at. 1987). Furthermore, harrier nests were predated by foxes and occasionally adults were killed. The first foxes were observed in the Lauwersmeer in 1985, after which their numbers rapidlyincreased (Fig. 5A), while the annual number ofMarsh Harrier nesting attempts and nesting success declined (e.g. Fig. 3A, Fig. 6). In the majority of cases there was direct evidence for predation, such as broken eggshells or dead young with

Dijkstra & Zijlstra: MARSH HARRIER REPRODUCTION IN YOUNG POLDERS 43
the Lauwersmeer, and 4.68 eggs (SD = 0.99, n =590) in Flevoland (Mann-Whitney-U-test, z =1.226, N.S.). The most frequent clutch size wasfive (n =431, 43.6%, range 2-8). A slight but significant decrease in clutch size of about 0.5 eggoccurred over the study period in both polders(Figs. 7A & B, combined data: clutch size = 0.024 x years after embankment + 6.63; n = 987clutches, F],985 = 14.8, P < 0.001). The number offledglings per successful nest also decreasedslightly by about 0.3 fledgling over the study period (combined data: numbers fledged = -0.014 xyears after embankment + 4.30; n = 1260 broods,FU258 = 6.12, P < 0.05). The number of fledglings produced per egg in successful nests did notchange over the twenty years of study. However,the number of fledglings per nest (including failednests) decreased significantly, both in the Lauwersmeer (Fig. 7A, Y = -0.08x + 8.96, n = 642, F] 640
=45.2, P < 0.0001) and in Flevoland (Fig. 7B, Y=-0.04x + 5.62, n = 896, F) 894 = 6.42, P < 0.02).The strongest decline occ~rred in the Lauwersmeer (difference between slopes: F]]534 = 4.83,P < 0.05). '
Clutch initiation occurred over 81 days, from23rd March to 14th June (n = 1385 nests), Meanlaying date in the Lauwersmeer from 1977-1994was 30th April (day number counted from 1 January: 119.5 ± ILl, n = 553), and in Flevoland(1975-1988) four days earlier: 115.9 ± 10.7, n =826, Mann-Whitney-U-test, z = 5.89, P < 0.001).A similar difference was found in Kestrels Falcotinnunculus (Beukeboom et al. 1988). Onset oflaying became later in the course of the years (n =1379 nests, FI1376 =44.9, P < 0.001), in combination with a consistent difference in timing between the study areas throughout the years(FU376 = 15.3, P < 0.001).
The clutch size of many single-brooded species declines with laying date (Klomp 1970, Daanet al. 1989). In the Marsh Harrier there was a negative relationship both for the annual means of thevariables (annual mean clutch size =-0.032 x annual mean laying date + 8.44, n =20, F] ]8 =5.3,P < 0.05), and individual values combi~ed overall years and both areas (Fig. 8; clutch size = -
6n= 113 293 324 94 50 13
en 5 1 1110>
10>
1OJ
o 4en
10>
rc
r'5,3""0
1OJ
:;::::
rQi 2
r..c
rE::JC
®0
6
5
4OJN"w..c 3u"5u
2
®OL--L_...L----l_--'---_-'------'-_--'-----'
100 110 120 130 140 150 160laying date
Fig. 8. (A) Mean clutch size ± SD and brood size atfledging for lO-day clutch initiation intervals (all yearsand both areas combined). The numbers indicate thenumber of nests. (B) Linear regressions for individualyears of clutch size and laying date, for the Lauwersmeer population.
0.034 x laying date + 8.86; n = 903, F),90] =163.9, P < 0.001). This latter relationship differedbetween years in terms of the intercept (Fig. 8B;F]8883 =2.01, P < 0.01), but not the slope (year xlaying date interaction: F]8865 = 1.26, N.S.), anddid not differ between Fl~voland and Lauwersmeer (F] 882 = 1.32, N.S.). Apart from layingdate, appa~ently additional year-specific factor(s)impose an effect on the clutch size produced.
Annual fluctuations in breeding performanceWeather conditions influence thermoregulationcosts and may also influence the profitability of
44 ARDEA 85(1),1997
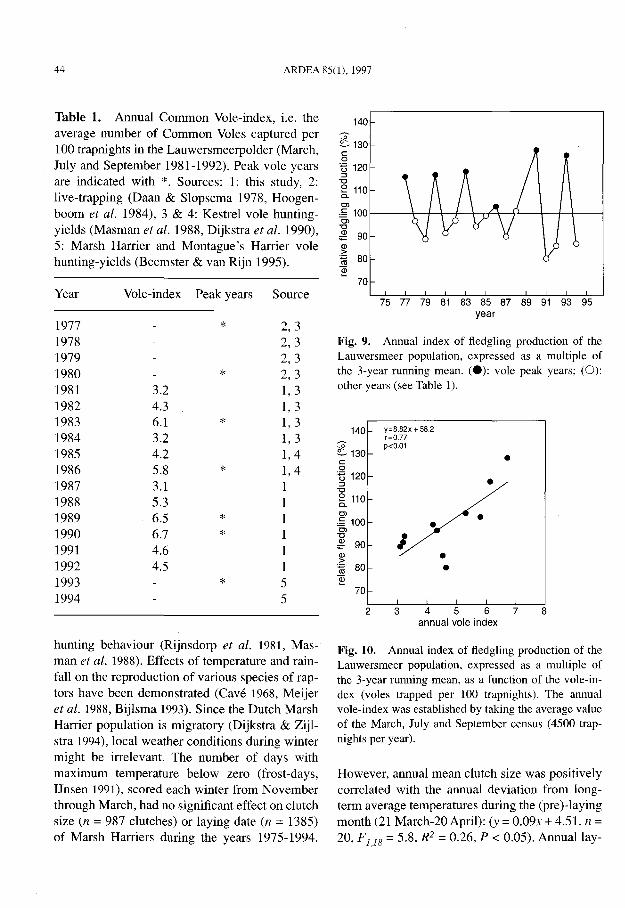
Table 1. Annual Common Vole-index, i.e. theaverage number of Common Voles captured per100 trapnights in the Lauwersmeerpo1der (March,July and September 1981-1992). Peak vole yearsare indicated with *. Sources: 1: this study, 2:live-trapping (Daan & Slopsema 1978, Hoogenboom et at. 1984), 3 & 4: Kestrel vole huntingyields (Masman et at. 1988, Dijkstra et at. 1990),5: Marsh Harrier and Montague's Harrier volehunting-yields (Beemster & van Rijn 1995).
140(;-
~ 130c:ot5 120::>"0
e 110Q.
Ol
,§ 100 !----+-+-+-+---+-rr--r---}-'----t----t--+-----jOl
"0
~ 90Q)
>~ 80~
Year
197719781979198019811982198319841985198619871988198919901991199219931994
Vole-index Peak years
*
*3.24.36.1 *3.24.25.8 *3.15.36.5 *6.7 *4.64.5
*
Source
2,32,32,32,31,31,31,31,31,41,411111155
70
75 77 79 81 83 85 87 89 91 93 95year
Fig. 9. Annual index of fledgling production of theLauwersmeer population, expressed as a multiple ofthe 3-year running mean. (e): vole peak years; (0):other years (see Table 1).
140 y=8.82x + 58.2r=O.77
£ 130p<0.01
c: •0t5 120 •::>"0
e 110Q.
Ol •,§ 100 •Ol"0 •Q)
90 ,;;:::Q) •.2:
80 •C;;~
70
2 3 4 5 6 7 8annual vole index
hunting behaviour (Rijnsdorp et at. 1981, Masman et at. 1988). Effects of temperature and rainfall on the reproduction of various species of raptors have been demonstrated (Cave 1968, Meijeret at. 1988, Bij1sma 1993). Since the Dutch MarshHarrier population is migratory (Dijkstra & Zij1stra 1994), local weather conditions during wintermight be irrelevant. The number of days withmaximum temperature below zero (frost-days,Unsen 1991), scored each winter from Novemberthrough March, had no significant effect on clutchsize (n =987 clutches) or laying date (n = 1385)of Marsh Harriers during the years 1975-1994.
Fig. 10. Annual index of fledgling production of theLauwersmeer population, expressed as a multiple ofthe 3-year running mean, as a function of the vole-index (voles trapped per 100 trapnights). The annualvole-index was established by taking the average valueof the March, July and September census (4500 trapnights per year).
However, annual mean clutch size was positivelycorrelated with the annual deviation from longterm average temperatures during the (pre)-layingmonth (21 March-20 April): (y =0.09x + 4.51, n =20, Fus =5.8, R2 =0.26, P < 0.05). Annua11ay-

Dijkstra & Zijlstra: MARSH HARRIER REPRODUCTION IN YOUNG POLDERS 45
Table 2. Mean clutch size (x), standard deviation (SD) and numbers (n), laying date and fledgling production of Marsh Harriers in the Lauwersmeer (1977-1994), during vole peak years and other years.The relative size of the Marsh Harrier breeding population in any year was calculated by expressing thenumber of nests as a multiple of the 3-year running mean, thereby controlling for the long-term trend inpopulation size (see Fig. 3). The same method was used to calculate relative fledgling production of thepopulation. Mann-Whitney-U-test.
Peak vole years other years
Reproductive parameters x SD n x SD n P
Clutch size 4.74 1.06 137 4.50 0.95 255 <0.05Laying date 119.90 11.50 204 119.50 10.80 338 N.S.no. fledglings per successful nest 3.19 1.01 187 3.02 1.01 298 N.S.no. fledglings per nest (all nests) 2.55 1.57 234 2.29 1.56 393 <0.05
Annual relative no. nests 1.07 0.04 6 0.97 0.06 11 < 0.01Annual relative no. fledglings per nest 1.11 0.09 6 0.95 0.08 11 < 0.01Annual relative total fledgling production 1.18 0.09 6 0.92 0.07 11 < 0.01
Table 3. Multiple regression analyses of individual clutch size in the Lauwersmeer population. In theanalysis given above, two variables were dropped from the model: years after embankment and temperature pre-laying month (R2 =0.20, n =358). In the analysis given below, laying date was excluded fromthe model (R2 =0.045, n =392).
independent variables coefficient F P
individual laying date -0.036 18.6 < 0.0001annual vole category +0.203 5.1 <0.05
annual vole category +0.294 7.1 < 0.01years after embankment -0.029 10.2 < 0.002temperature pre-laying month +0.037 5.9 <0.02
ing date was negatively associated with temperature during this time of year: (y = -0.57x + 119.7,n =20, F l18 =6.7, R2 =0.28, P < 0.02). No significant effect of rainfall (amount and duration) onlaying date and clutch size could be detected.
Food abundance has probably declined in ourstudy areas during the twenty five years after embankment (Fig. 4). Superimposed on these longterm changes, are annual differences in prey den-
sity. One of the prey species of Marsh Harriers isthe Common Vole. This species exhibits a 3-yearpopulation cycle, which is very pronounced athigh latitudes (Hansson & Henttonen 1988), andis also detectable in the temperate zone (vanWijngaarden 1957). Using data from the Lauwersmeer vole trapping census, and additional information from other sources, local vole peak yearscould be defined (Table 1). Clutch sizes during

46 ARDEA 85(1), 1997
vole peak: years in the Lauwersmeer were significantly larger than in the remaining years (Table2). However, in spite of the negative associationbetween clutch size and laying date, as shown before, mean laying date in vole peak: years was thesame as in other years (Table 2). This indicates adirect effect of annual vole abundance on clutchsize, independent of laying date. This result is inline with the year-specific relationship betweenclutch size and laying date (Fig. 8B). Given a certain laying date, the clutch size produced was higher in peak: vole years than in the remaining years.Also the number of fledglings per initiated clutchwas 0.26 nestlings higher on average in vole peak:years (Table 2).
In order to analyse the effect of annual fluctuations in vole abundance on the number of nesting attempts and total fledgling production wecorrected for the long term trends in these variables (Figs. 3A & 7A). For each year, the numbersof nesting attempts and fledglings produced wereexpressed as a multiple of their three year running-mean values. These relative estimates ofpopulation size and production were significantlyhigher in vole peak years (Table 2, Fig. 9). For thetwelve years when vole abundance was quantifiedin the trapping census (1981-1992, see Table 1),the relative annual fledgling production of the total population was positively associated with thevole index (Fig. 10).
Only for the Lauwersmeer vole abundance estimates were available for the years under study,and for this area a multiple regression analysis,explaining variation in clutch size and includingall independent variables mentioned thus far, wasperformed (Table 3). This analysis revealed significant independent effects of laying date (-) andvole abundance (+) on clutch size. The significance oftime since embankment (-) and temperature in the pre-laying period (+) on clutch size,was absent when laying date was included in themodel. Apparently these factors impose an effecton both clutch size and laying date, and have nodate-independent effect on clutch size, in contrastto annual vole abundance.
DISCUSSION
The breeding population of the Marsh Harrier inThe Netherlands expanded from 100-150 pairs inthe late 1960s to about 1400 pairs in 1992 (Teixeira 1979, Bijlsma 1993). Several factors mayhave allowed this tenfold increase in roughlytwenty years. First, the ban on persistent pesticides in Europe had a positive effect on reproductive output (Opdam et al. 1987, Witkowski 1989).These compounds caused direct mortality (Koeman et al. 1969), and, at sub-lethal levels, affectedhatchability of the eggs through shell-thinning,resulting in dramatic declines of population sizeof several raptor species after 1950 (Newton1979). A second mortality factor was severe human persecution (Bijleveld 1974, Newton 1979).During the 1960s and early 1970s, however, protective legislation of raptors was established inmany European countries, including France andSpain where previously many Marsh Harrierswere shot on migration (Dijkstra & Zijlstra 1994).Although the laws are still frequently violated,persecution has probably become less severe during the last two decades (McCulloch et al. 1992).For the Dutch Marsh Harrier population, a thirdfactor, analysed in this study, was the habitat expansion due to the reclamation of South Flevoland (1968) and the Lauwersmeerpolder (1969).
The South Flevoland population reached amaximum of 350 pairs, ten years after embankment (Fig. lA). At that time more than 50% of theDutch population was breeding in the new polders, and the recovery of the population on thetraditional breeding grounds was much slower(Teixeira 1979, Bijlsma 1993). A moderate increase also occurred in other W. European countries in the early seventies (Underhill-Day 1984,Jorgensen 1989). The high density of approximately one pair km-2 indicates the apparent attractiveness for Marsh Harriers of the young polders.Although reproductive performance during thefirst years of colonization may be relatively lowdue to settlement of unexperienced, subadultbreeders (Altenburg et ai. 1987), the most favourable circumstances for Marsh Harriers in the pol-
Dijkstra & Zijlstra: MARSH HARRIER REPRODUCTION IN YOUNG POLDERS 47
ders probably occurred during the first decade after colonization. During the 1980s the harrierpopulations in both polders declined considerably. Furthermore, clutch and brood size decreased significantly during the twenty years ofstudy, and laying dates became later. Clutch sizewas negatively associated with laying date andthere is strong evidence that later laying generallyreflects poorer conditions (Daan et al. 1989). Thisstrengthens the view that breeding conditions deteriorated with the age of the polders. Several factors were probably involved in these long termchanges. First, the area of suitable breeding habitat in South Flevoland decreased to only 10% ofthat available immediately after reclamation.During the 1980s, this probably limited the number of breeding pairs. Simultaneously, food availability was probably reduced, since fresh prey onthe nests became increasingly scarce over theyears (Fig. 4). This reflects the combined effect of(1) habitat succession accompanied by less pronounced 'outbursts' of prey species such as theCommon Vole (Dijkstra 1994), and (2) a reductionof potential hunting habitat for harriers, due to urban development, and growth of forest plantations (Fig. 1). Probably prey abundance was alsolower in intensively managed farmlands, compared with the preceeding cultivation stage, whentrenches with natural vegetation were available,at every ten meters distance. Hunting harriersshow strong preference for these elements in arable land (Underhill-Day 1984). In addition to therestriction of breeding habitat and less favourablefood circumstances, also nest predation had an increasing negative effect on reproductive successduring the 1980s. In both polders the number offoxes rapidly increased, accompanied by an increase in nest predation to 40-50% in the Lauwersmeer. These figures are attributable to the lack ofinundated reedbeds, in contrast with the nature reserves Oostvaardersplassen and Lepelaarplassenin South Flevoland. At locations where nests werefrequently predated in the Lauwersmeer, the number of nesting attempts dropped considerably(pers. obs.), resulting in a reduction of the localpopulation. Emigration was evidently involved,
because marked breeding birds were occasionallyrecorded nesting outside the Lauwersmeer in theyear after a nest failure, but not after a successfulbreeding attempt. During the 1990s the annualfledgling production in the Lauwersmeer variedfrom 1.3 to 2.1 fledglings per initiated clutch.These figures are low compared with the earlyyears of our study and other populations (Bock1979, Underhill-Day 1984, JOrgensen 1989, Witkowski 1989). In another population sufferinghigh predation pressure, a similar, low productionof 1.6 fledglings per nest was found (Bavoux etal. 1989).
Superimposed on these changes were annualfluctuations in local Common Vole densities,which had a considerable effect on the number ofbreeding pairs, as well as on fledgling production.Although the Marsh Harrier is generally regardedas a generalist (Schipper 1973b & 1978, Witkowski 1989), compared to vole specialists like theKestrel Falco tinnunculus and Short-eared OwlAsio fiammeus, voles were apparently of majorimportance for the demography of harriers in theyoung polders. Annual variation in weather alsoaffected Marsh Harrier reproduction: mean annual laying date was negatively correlated withthe average temperature during the period from21't March to 20th April. Clutch size was positively associated with temperature. During thismonth, most local breeding birds have returnedfrom their wintering grounds, and male-femaleprey deliveries occur in preparation for laying.Since the average temperature during this monthwas 5.8°C, and the years under study varied intemperature from O°C to 13.6°C, there could havebeen considerable annual variation in thermoregulation costs. The mechanism of this temperaturedependence is unknown but the allocation of energy to egg formation is apparently retarded under adverse temperature conditions. In the sedentary Dutch population of the Kestrel, winter severity affects subsequent timing of reproductionand clutch size (Cave 1968, Meijer et al. 1988).
Our results suggest that breeding conditionsfor Marsh Harriers have been particularly favorable during the period immediately after reclama-
48 ARDEA 85(1), 1997
tion of the polders, as soon as suitable breedinghabitat had developed. High food abundance andlow predation pressure were the main reasons forthe high reproductive output in the early years after embankment of the polders. It has been suggested that the general increase of the Marsh Harrier breeding populations was initiated by surplusproduction in Flevoland during the 1970s (e.g.Teixeira 1979, Meininger 1984, Underhill-Day1984). However, whether fledgling production inthese areas was high enough to explain the initialincrease in the local breeding population, and atthe same time accounted for increases elsewhere,can only be calculated when annual survival andthe age of first breeding are known. These life history parameters were assessed also within theframework of this study (c. Dijkstra unpubl.data). The results indicate that net immigration tothe polders has occurred during the first 5-7 yearsafter settlement, whereas substantial emigrationof former breeding birds and potential recruits hastaken place during the next decade. Frequent nestpredation in the Lauwersmeer in recent years caused reduced recruitment, which was insufficientto compensate adult annual mortality (C. Dijkstraunpubl. data). We anticipate that this populationwill be further reduced. Both, initial immigrationand recent emigration of harriers, illustrate adaptive responses to temporal variation in environmental circumstances. Furthermore, natural selection will favor individuals showing preference forindundated nest sites in the presence of groundpredators.
ACKNOWLEDGEMENTS
We thank the numerous people who were involved inacquiring the data presented here. Vogeltrekstation Heteren kindly provided us with the ringing data. SergeDaan and Mennobart van Eerden gave useful adviceduring all stages of this study. We also thank Rob Bijlsma, Kate Lessells and Ian Newton, who critically reviewed the manuscript and suggested many improvements.
REFERENCES
Altenburg W., I. Bruinenberg-Rinsma, P. Wildschut &M. Zijlstra 1987. Colonisation of a new area by theMarsh Harrier. Ardea 75: 213-220.
Bakker D. 1954. Enige onderzoekingen naar de ontwikkeling van de vogelbevolking in de Noordoostpolder. Rijkswaterstaat-IIsselmeergebied,c/o RIZA, P.O. Box 17, 8200 AA Lelystad.
Bakker D. & W. van der Zweep 1949. De veldmuizenplaag van de herfst 1948 in de Noordoostpolder.Rijkswaterstaat-IIsselmeergebied, c/o RIZA, P.O.Box 17, 8200 AA Lelystad.
Bavoux C., G. Bumeleau, A Leroux & P. NicolauGuillaumet 1989. Le Busard des roseaux Circusaeruginosus en Charente-Maritime (France). IIChronologie et parametres de la reproduction.Alauda 57: 247-262.
Beemster N., H.I. Drost & M.R. van Eerden 1989. Evaluatie van het beheer in het natuurgebied in hetLauwersmeer in de periode 1982-1987. Flevobericht 303, Rijkswaterstaat-IIsselmeergebied, c/oRIZA, P.O. Box 17,8200 AA Lelystad.
Beukeboom L., C. Dijkstra, S. Daan & T. Meijer 1988.Seasonality of clutch size determination in theKestrel Falco tinnunculus: An experimental approach. Omis Scand. 19: 41-48.
Bijleveld M. 1974. Birds of prey in Europe. MacmillanPress Ltd, London.
Bijlsma R.G. 1993. Ecologische atlas van de Nederlandse roofvogels. Schuyt & Co, Haarlem.
Bock W.E 1979. Zur Situation der Rohrweihe (Circusaeruginosus) in Schleswig-Holstein. I. Om. 120:416-430.
Cave AI. 1968. The breeding of the Kestrel, Falco tinnunculus L., in the reclaimed area Oostelijk Flevoland. Neth. I. Zoo!. 18: 313-407.
Clarke R., A. Bourgonje & H. Castelijns 1993. Food niches of sympatric Marsh Harriers Circus aeruginosus and Hen Harriers C. cyaneus on the Dutchcoast in winter. Ibis 135: 424-431.
Daan S. & S. Siopsema 1978. Short term rhythms inforaging behaviour ofthe Common Vole (Microtusarvalis). I. Compo Phys. 127: 215-227.
Daan S., C. Dijkstra, R.H. Drent & T. Meijer 1989.Food supply and the annual timing of avian reproduction. Acta XIX Congr. Int. Omitho!., Ottawa:392-407.
Dijkstra c., S. Daan, T. Meijer, AI. Cave & R.P.E.Foppen 1988. Daily and seasonal variations inbody mass of the Kestrel in relation to food availability and reproduction. Ardea 76: 127-140.
Dijkstra C., A Bult, S. Bijlsma, S. Daan, T. Meijer &M. Zijlstra 1990. Brood manipulations in the Kestrel Falco tinnunculus: effects on offspring and

Dijkstra & Zijlstra: MARSH HARRIER REPRODUCTION IN YOUNG POLDERS 49
parent survival. J. Anim. Ecol. 59: 269-285.Dijkstra e. 1994. Vole density in relation to vegetation
development in the Vo1kerak area after embankment. Report W-DWW-94-719. RijkswaterstaatDWW, P.O. Box 5044, 2600 GA Delft.
Dijkstra e. & M. Zij1stra 1994. Annual survival and migration of Dutch Marsh Harriers. Report DF 94-21LIO. Rijkswaterstaat-Usselmeergebied, c/o RIZA,P.O. Box 17, 8200 AA Lelystad.
Glutz von Blotzheim U.K., M. Bauer & E. Bezzel1971. Handbuch der Vogel Mitteleuropas, 4.Akademische Verlagsgesellschaft, Frankfurt amMain.
Hansson L. & H. Henttonen 1988. Rodent dynamics ascommunity processes. Trends Ecol. Evol. 3: 195200.
Hoogenboom 1., S. Daan, J. Dallinga & M. Schoenmakers 1984. Seasonal change in the daily timingof behaviour in the Common Vole, Microtus arvalis. Oeco1ogia 61: 18-31.
Joenje W. 1978. Plant colonisation and succession onembanked sandflats. Ph.D. thesis, RijksuniversiteitGroningen, Groningen.
Jorgensen H.E. 1989. Danmarks Rovfugle - en statusoversigt. 0ster Ulslev, Frederikshus.
Klomp H. 1970. The determination of clutch-size inbirds: a review. Ardea 58: 1-124.
Koeman J.H., J.A.J. Vink & J.J.M. de Goeij 1969. Causes of mortality in birds of prey and owls in TheNetherlands in the winter of 1968-1969. Ardea 57:67-76.
Masman D., S. Daan & e. Dijkstra 1988. Time allocation in the Kestrel Falco tinnunculus, and the principle of energy minimisation. J. Anim. Ecol. 57:411-432.
McCulloch M.N., G.M. Tucker & S.R. Baillie 1992.The hunting of migratory birds in Europe: a ringing recovery analysis. Ibis 134 Suppl. 1: 55-65.
Meijer T., S. Daan & e. Dijkstra 1988. Female condition and reproduction: effects of food manipulation in free-living and captive Kestrels. Ardea 76:141-154.
Meininger P.L. 1984. Bmine Kiekendief Circus aeruginosus als broedvogel in het Deltagebied in 197982. Limosa 57: 81-86.
Newton 1. 1979. Population ecology of raptors. Poyser,Berkhamsted.
Opdam P, J. Burgers & G. Miiskens 1987. Populationtrend, reproduction, and pesticides in Dutch Sparrowhawks following the ban on DDT. Ardea 75:205-212.
Rijnsdorp A.D., S. Daan & e. Dijkstra 1981. Huntingin the Kestrel, Falco tinnunculus, and the adaptivesIgnificance of daily habits. Oeco1ogia (Berl) 50:391-406.
Schipper W.J.A. 1973a. A comparison of prey selectionin sympatric harriers (Circus) in Western Europe.Gerfaut 63: 17-120.
Schipper W.J.A. 1973b. Over het voorkomen van kiekendieven in Flevo1and in 1971 en 1972. Limosa46: 67-71.
Schipper W.J.A. 1978. A comparison of breeding ecology in three European Harriers (Circus). Ardea 66:77-102.
SOVON 1987. Atlas van de Nederlandse Vogels. SOVON, Arnhem.
Teixeira R.M. 1979. Atlas van de Nederlandse broedvogels. Natuurmonumenten, 's-Grave1and.
Timmerman A. 1971. Zoogdieren en hun predatoren inhet nieuwe Lauwersmeergebied. De Levende Natuur 74: 90-95,116-120.
Underhill-Day J.e. 1984. Population and breedingbiology of Marsh Harriers in Britain since 1900. J.appl. Ecol. 21: 773-787.
Van der Ploeg D.T.E., W. de Jong, M.J. Swart, J.A. deVries, J.H.P. Westhof, A.G. Witteveen & B. vander Veen 1976. Voge1s in Friesland, 1. StichtingAvifauna Friesland/Fryske Akademy, Leeuwarden.
Van Wijngaarden A. 1957. The rise and disappearanceof continental vole plague zones in The Netherlands. Verslagen Landbouwkundige Onderzoekingen 63 (15): 1-21.
Witkowski J. 1989. Breeding biology and ecology ofthe Marsh Harrier Circus aeruginosus in the Barycz valley, Poland. Acta am. 25: 223-320.
Unsen F. 1991. Karaktergetallen van de winters vanaf1707. Zenit 18: 69-73.
Zijlstra M., S. Daan & J. Bminenberg-Rinsma 1992.Seasonal variation in the sex ratio of Marsh Harrier Circus aeruginosus broods. Funct. Ecol. 6:553-559.
SAMENVATTING
In deze studie werd de tempore1e variatie in broedprestaties van de Bmine Kiekendief onderzocht in de polders Zuid-Flevo1and (droogge1egd in 1968) en de Lauwersmeer (1969). Het aantal broedparen in Flevolandnam snel toe tot een maximum van 350 paren (± 1 paarkm-2) in 1977, gevo1gd door een sterke afname in de jaren tachtig. Een ze1fde verloop trad op in de Lauwersmeer, hoewe1 de ko1onisatie langer op zich 1iet wachten en de grootste dichtheid later werd bereikt (1983),waarschijn1ijk a1s gevo1g van een tragere successiedoor de zilte uitgangssituatie. In beide studiegebiedennamen de gemidde1de 1egse1grootte en het aanta1 uitge-
50 ARDEA 85(1), 1997
vlogen jongen per nest ai, gedurende de twee decenniana de kolonisatie. Drie factoren waren verantwoordelijk voor de afnemende broedprestaties: (1) een sterkereductie van het oppervlak potentieel broedbiotoop, alsgevolg van cultivatie in Flevoland, (2) een reductie inhet voedselaanbod in de loop der jaren, gei1lustreerddoor een steeds kleinere fractie nesten waar verse prooiwerd aangetroffen, en (3) een toename van predatie vaneieren en jongen, vooral als gevolg van kolonisatiedoor de Vos in de jaren tachtig. Het simultane effectvan deze factoren, resulteerde in een sterke reductievan de broedpopulaties van de Bruine Kiekendief inbeide polders. In de Oostvaardersplassen en de Lepe-
laarplassen broedt de soort sinds 1990 bijna exclusiefin ge"inundeerde rietvelden. Deze broedplaatsen zijn relatief veilig voor grondpredatoren en de aantal1enbroedvogels zijn hier stabiel. In de Lauwersmeer ontbreken grote opperv1aktes ge"inundeerd broedbiotoop.Door de intensieve nestpredatie in deze polder (± 50%van de nesten sinds 1990), is het broedsucces zodanig1aag dat de loka1e popu1atie zich in de toekomst nietkan handhaven zonder immigratie vanuit gezonde(bron)populaties.
Received: 12 March 1996, accepted: 26 November 1996Corresponding editor: Bruno 1. Ens


![Harrier [Crowood]](https://static.fdocuments.net/doc/165x107/577cd3b91a28ab9e789768ff/harrier-crowood.jpg)


