REPORT TO SHAREHOLDERS FOR THE FIRST QUARTER … · Group oz 70 861 71 211 – 99 190 kg 2 204 2...
12
KEY FEATURES • Headline earnings per share of 10.5 cents • Acquisition of a further 15% interest in the Elsburg JV • Commissioning of the first CIL circuit at ERGO’s plant on track to commence in December quarter • Commissioning of Top Star dump on track to commence in December quarter • Way Ahead Project production on track to commence in December quarter REVIEW OF OPERATIONS Quarter Quarter % Quarter Group Sep 2008 Jun 2008 Change Sep 2007 Gold production Continuing operations oz 70 861 71 211 – 89 157 kg 2 204 2 215 – 2 773 Discontinued operations oz – – – 10 033 kg – – – 311 Group oz 70 861 71 211 – 99 190 kg 2 204 2 215 – 3 084 Cash operating costs Continuing operations US$ per oz 755 689 (10) 584 ZAR per kg 188 967 173 034 (9) 133 673 Discontinued operations US$ per oz – – – 1 017 ZAR per kg – – – 233 707 Group US$ per oz 755 689 (10) 628 ZAR per kg 188 967 173 034 (9) 143 761 Gold price received US$ per oz 864 893 (3) 693 ZAR per kg 216 297 224 552 (4) 158 598 Capital expenditure US$ million 9.1 20.0 55 5.1 ZAR million 70.2 149.8 53 36.5 Average exchange rate ZAR:US$ 7.79 7.82 – 7.12 REPORT TO SHAREHOLDERS FOR THE FIRST QUARTER ENDED 30 September 2008 (Incorporated in the Republic of South Africa) Registration No. 1895/000926/06 JSE share code: DRD • ISIN: ZAE 000058723 Issuer code: DUSM • NASDAQ trading symbol: DROO (“DRDGOLD” or “the company”) GROUP RESULTS Gold production Dec 07 Mar 08 Jun 08 Sep 08 60 000 65 000 70 000 75 000 80 000 oz Gold production Cash operating margins US$/oz Dec 07 Mar 08 Jun 08 Sep 08 500 600 700 800 900 1 000 US$/oz Revenue Cash operating cost Cash operating margin R million Dec 07 Mar 08 Jun 08 Sep 08 300 350 400 450 500 550 R million Revenue Rm Cash operating cost
-
Upload
vuongkhanh -
Category
Documents
-
view
214 -
download
0
Transcript of REPORT TO SHAREHOLDERS FOR THE FIRST QUARTER … · Group oz 70 861 71 211 – 99 190 kg 2 204 2...

KEY FEATURES
• Headline earnings per share of 10.5 cents
• Acquisition of a further 15% interest in the Elsburg JV
• Commissioning of the first CIL circuit at ERGO’s plant on track to commence in December quarter
• Commissioning of Top Star dump on track to commence in December quarter
• Way Ahead Project production on track to commence in December quarter
REVIEW OF OPERATIONS
Quarter Quarter % QuarterGroup Sep 2008 Jun 2008 Change Sep 2007
Gold productionContinuing operations oz 70 861 71 211 – 89 157
kg 2 204 2 215 – 2 773
Discontinued operations oz – – – 10 033kg – – – 311
Group oz 70 861 71 211 – 99 190kg 2 204 2 215 – 3 084
Cash operating costsContinuing operations US$ per oz 755 689 (10) 584
ZAR per kg 188 967 173 034 (9) 133 673
Discontinued operations US$ per oz – – – 1 017ZAR per kg – – – 233 707
Group US$ per oz 755 689 (10) 628ZAR per kg 188 967 173 034 (9) 143 761
Gold price received US$ per oz 864 893 (3) 693ZAR per kg 216 297 224 552 (4) 158 598
Capital expenditure US$ million 9.1 20.0 55 5.1ZAR million 70.2 149.8 53 36.5
Average exchange rate ZAR:US$ 7.79 7.82 – 7.12
REPORT TO SHAREHOLDERS FOR THE
FIRST QUARTER ENDED
30 September 2008
(Incorporated in the Republic of South Africa)Registration No. 1895/000926/06JSE share code: DRD • ISIN: ZAE 000058723Issuer code: DUSM • NASDAQ trading symbol: DROO(“DRDGOLD” or “the company”)
GROUP RESULTS
Gold production
Dec 07 Mar 08 Jun 08 Sep 0860 000
65 000
70 000
75 000
80 000
oz
Gold production
Cash operating margins US$/oz
Dec 07 Mar 08 Jun 08 Sep 08500
600
700
800
900
1 000
US$
/oz
RevenueCash operating cost
Cash operating margin R million
Dec 07 Mar 08 Jun 08 Sep 08300
350
400
450
500
550
R m
illion
Revenue RmCash operating cost

STOCK
• SHAREHOLDER REPORT 2008 • DRDGOLD L IMITED2
Issued capital376 577 088 ordinary no par value shares5 000 000 cumulative preference sharesTotal ordinary no par value shares issued and committed: 392 507 207
Stock traded JSE NASDAQ
Average volume for the quarter per day (’000) 956 1 787% of issued stock traded (annualised) 66 124Price • High R6.40 US$0.803
• Low R3.37 US$0.396• Close R3.75 US$0.443
FORWARD-LOOKING STATEMENTSMany factors could cause the actual results, performance or achievementsto be materially different from any future results, performance orachievements that may be expressed or implied by such forward-lookingstatements, including, among others, adverse changes or uncertainties ingeneral economic conditions in the markets we serve, a drop in thegold price, a continuing strengthening of the Rand against the Dollar,regulatory developments adverse to DRDGOLD or difficulties inmaintaining necessary licences or other governmental approvals, changesin DRDGOLD’s competitive position, changes in business strategy, anymajor disruption in production at key facilities or adverse changes inforeign exchange rates and various other factors.
These risks include, without limitation, those described in the sectionentitled “Risk Factors” included in our annual report for the fiscal yearended 30 June 2007, which we filed with the United States Securities andExchange Commission on 14 December 2007 on Form 20-F. You shouldnot place undue reliance on these forward-looking statements, whichspeak only as of the date thereof. We do not undertake any obligationto publicly update or revise these forward-looking statements toreflect events or circumstances after the date of this report or to theoccurrence of unanticipated events.
OVERVIEWDear shareholder
Safety, health and environmentWith deep regret I must report the deaths of four employees in work-related incidents during this quarter. This marks a serious and bitterlydisappointing reversal to our track record of two successive fatality-freequarters.
At Blyvooruitzicht Gold Mining Company Limited (“Blyvoor”), rock drilloperators, Aron Maqoma and Velelo Mshuwywa died in rockfalls followingseismic events, the former on 16 August and the latter on 4 September.
At East Rand Proprietary Mines Limited (“ERPM”), timberman Pieter Jonkerand shaft assistant Fernando Vate were asphyxiated in a shaft conveyanceon 19 September while on their way to conduct routine water levelmeasurements underground at the mine’s South West Vertical (“SWV”)shaft.
Performance in respect of the other key safety indicators was mixed.ERPM and Crown Gold Recoveries (Pty) Limited (“Crown”) reportedimprovements in their dressing station injury rates while Blyvoorreported a 13% regression. ERPM and Blyvoor reported improvementsin their lost time injury frequency rates, but Crown’s performanceremained unchanged. Blyvoor reported a slight improvement in itsreportable injury frequency rate while ERPM and Crown both reportedsubstantial regressions.
An analysis of accident agencies, or causes, during the quarter showedthat the two largest were fires (22%) and non-seismicity related falls ofground. These, and the other 28 agencies identified, are all underinvestigation in order to identify and implement more stringentpreventative measures.
Preparations continued during the quarter for the roll-out of acompany-wide behaviour-based safety initiative during December 2008.The first phase of internal consultant training has been completed and the second phase is scheduled for completion by the end ofOctober 2008.
Occupational hygiene came under the spotlight during the quarter.A company-level occupational hygiene post has been created and filledinternally and training of relevant personnel throughout the operationswill be conducted. On completion of a baseline risk assessment, thecompany’s Code of Practice will be revised and implemented.
The company spent a total of R7.6 million on environmental issuesduring the quarter – R1.3 million at Blyvoor, R0.8 million at ERPM andR5.5 million at Crown. At Blyvoor the largest cost factors were slimesclean-ups, rehabilitation and consultants’ fees; at ERPM the contributiontowards the operation’s environmental rehabilitation trust fund; and atCrown, site rehabilitation and vegetation.
As discussed in the previous letter to shareholders with regard to theWonderfonteinspruit issue, the company continues as an active memberof the Mining Interest Group, interfacing with interested and affectedparties.
CorporateOn 6 October 2008 we announced the cessation of pumping fromERPM’s SWV shaft, following the tragic events of 19 September 2008.Westated at the time that we would investigate, over the following twoweeks, the effect of this withdrawal on the rest of ERPM’s operations.
We have established that the rising water level of the CentralWitwatersrand Basin will, within the next two to three weeks, start toexert unsustainable pressure on the pumping capacity of ERPM’s soleproduction shaft, Far East Vertical (“FEV”) shaft. Pumps from this shaftdisplace water resulting from 2 100 tonnes of ice transported under-ground from surface daily to cool the shaft’s underground workingsthrough a series of underground plugs into the Central WitwatersrandBasin against an ever rising head.
Without being able to continue to supply ice to the undergroundworkings, we will be unable to maintain underground temperatures towithin regulated limits, and may have no other option for the timebeing than to suspend drilling and blasting operations. We will have toinvestigate what possibilities there may be to resume drilling and blastingat a later stage but it would seem that the necessary upgrade to FEVShaft’s pumping capability could be both costly and lengthy.
We are currently in discussions with labour, surrounding mines and therelevant government departments to consider these circumstances andhow to best manage the consequences.
During the quarter, we took forward our surface retreatment ambitionswith the announcement of our acquisition from Mintails South Africa(Pty) Limited of a further 15% interest in the Elsburg Gold Mining JointVenture (“Elsburg JV”), taking to 65% our interest in this pivotal componentof the first phase of the Ergo Joint Venture (“Ergo JV”). We have, inaddition, a conditional option to acquire a further 11% in Elsburg JV.
DRDGOLD closing share price
Dec 07 Mar 08 Jun 08 Sep 080
5
10

• SHAREHOLDER REPORT 2008 • DRDGOLD L IMITED 3
Construction of the first phase of Ergo has progressed extremely well.Commissioning of the first carbon in leach circuit at the Brakpan plantwill begin during the December quarter, with production from theBenoni Tailings Dam ramping up to 600 000 tonnes per month until Aprilnext year, and then to 1.2 million tonnes per month from the ElburgTailings Complex thereafter.
ProductionTotal gold production for the quarter was virtually unchanged at 70 861ounces, an 11% increase in production at Crown offsetting the impact ofproduction declines of 7% and 2% at Blyvoor and ERPM respectively.
At Blyvoor, lower production resulted mainly from the loss of 15 productiondays due to Section 54 closures imposed by the Department of Mineralsand Energy and days of mourning called by the National Union ofMineworkers. These followed the two fatalities detailed under Safety,Healthand Environment above.
At ERPM, lower surface gold production, a result of a decline in theaverage surface yield, was the primary contributor to lower total goldproduction.
FinancialTotal revenue was 4% lower at R476.7 million, reflecting a 4% declinein the average gold price received to R216 297/kg.After accounting forcash operating costs, which were 9% higher at R416.5 million, operatingprofit was 55% lower at R57.2 million. An impairment of R47.6 millionrelating to the restructuring of ERPM’s underground operations wasrecorded, income tax of R15.6 million paid and a net loss of R8.8 millionrecorded compared with the previous quarter’s net profit of R44.5 million.
Looking aheadA range of events in the quarter under review caused your company’sboard and senior management to engage in some serious introspection.At a macro level, of course, the turmoil brewing in global economies formonths has bubbled to the surface. While this appears to have beengood for gold so far, time will tell whether jittery investors flock to themetal as a safe haven with the same, or greater, alacrity as in the past.The South African economy, relatively speaking, has borne up remarkablywell thus far to the global furore, but we are facing some politicaluncertainty.
Our introspection, prompted by these events, indicated clearly to us thatthis is no time for ‘heroics’ in a business such as ours; indeed, it is a timefor careful consideration of all of the dynamics – those which are in ourpower to manage as well as those that are not – and to plan a rationaland economical course ahead that will deliver positive results and value-add.
We envisage such a course for the next 12 months, which will have thefollowing three focus areas:o risk management;o cost control; and o margin management.
We expect our actions in respect of ERPM, the Elsburg JV and the ErgoJV to impact positively and quickly on costs and returns. Moving ahead,we envisage further steps to achieve a lower-risk, lower-cost, betterreturn profile, gaining as much leverage as we can from our long-established track record in surface retreatment.
John SayersChief Executive Officer
23 October 2008

CONDENSED CONSOLIDATED STATEMENT OF COMPREHENSIVE INCOME
• SHAREHOLDER REPORT 2008 • DRDGOLD L IMITED4
Quarter Quarter QuarterSep 2008 Jun 2008 Sep 2007
Rm Rm RmUnaudited Audited Unaudited
Continuing operationsGold and silver revenue 476.7 495.4 433.0Net operating costs (419.5) (368.5) (371.3)
Cash operating costs (416.5) (383.2) (370.7)Movement in gold in process (3.0) 14.7 (0.6)
Operating profit 57.2 126.9 61.7Depreciation (17.0) (11.0) (19.7)Movement in provision for environmental rehabilitation (12.1) (16.0) (4.7)Retrenchment costs (0.9) (5.1) (1.1)
Gross profit from operating activities 27.2 94.8 36.2Impairments (47.6) (63.9) –Administration expenses and general costs (6.1) (19.1) (22.8)Share-based payments (1.1) (5.9) 0.5Care and maintenance costs (2.8) (7.6) (2.5)Financial liabilities measured at amortised cost 7.3 (88.5) –(Loss)/profit on sale of assets and investments (1.6) (0.9) 12.0Finance income 32.9 35.1 (2.3)Finance expenses and unwinding of provisions (2.7) 4.0 (8.4)
Profit/(loss) before taxation 5.5 (52.0) 12.7Income tax (15.6) 3.8 –Deferred tax 1.3 81.6 –
(Loss)/profit after taxation (8.8) 33.4 12.7
Discontinued operationsLoss for the period from discontinued operations – (0.5) (56.6)Profit on sale of assets and investments – 12.6 1 008.0Impairment from discontinued operations – (1.0) –
Net (loss)/profit for the period (8.8) 44.5 964.1
Attributable to:Ordinary shareholders of the company 3.1 40.2 757.1Minority interest (11.9) 4.3 207.0
(8.8) 44.5 964.1
Headline earnings/(loss) per share – cents– From continuing operations 10.5 19.3 0.2– From total operations 10.5 19.3 (11.7)
Basic earnings per share – cents– From continuing operations 0.8 8.9 3.4– From total operations 0.8 10.7 201.8
Diluted headline earnings/(loss) per share – cents 10.5 19.3 (11.7)Diluted basic earnings per share – cents 0.8 10.7 201.8
Calculated on the weighted average ordinary shares issued of: 376 573 381 376 536 319 375 196 329
The condensed consolidated financial statements below are prepared in accordance with International Financial ReportingStandards (“IFRS”).

CONDENSED CONSOLIDATED STATEMENT OF FINANCIAL POSITION
• SHAREHOLDER REPORT 2008 • DRDGOLD L IMITED 5
As at As at As at30 Sep 2008 30 Jun 2008 30 Sep 2007
Rm Rm RmUnaudited Audited Unaudited
AssetsProperty, plant and equipment 821.2 815.6 627.0Non-current investments and other assets 65.3 65.3 59.8Environmental rehabilitation trust funds 116.0 110.8 79.2Deferred tax 82.8 81.6 –Current assets 1 036.6 1 189.2 1 177.0
Inventories 67.4 62.9 58.2Trade and other receivables 145.2 240.5 58.9Cash and cash equivalents 809.0 846.1 425.4 Assets classified as held for sale 15.0 39.7 634.5
2 121.9 2 262.5 1 943.0
Equity and liabilitiesEquity 1 240.7 1 305.5 1 251.8
Shareholders’ equity 1 191.4 1 244.3 1 073.8 Minority shareholders’ interest 49.3 61.2 178.0
Long-term liabilities 120.8 125.7 49.2 Post-retirement and other employee benefits 23.4 22.7 20.9 Provision for environmental rehabilitation 394.9 381.3 279.8Current liabilities 342.1 427.3 341.3
Trade and other payables 270.3 387.4 250.8 Short-term liabilities 34.2 39.9 –Dividends to ordinary shareholders 37.6 – –Liabilities classified as held for sale – – 90.5
2 121.9 2 262.5 1 943.0
• SHAREHOLDER REPORT 2008 • DRDGOLD L IMITED6
CONDENSED CONSOLIDATED STATEMENT OF CHANGES IN EQUITY
Quarter Quarter QuarterSep 2008 Jun 2008 Sep 2007
Rm Rm RmUnaudited Audited Unaudited
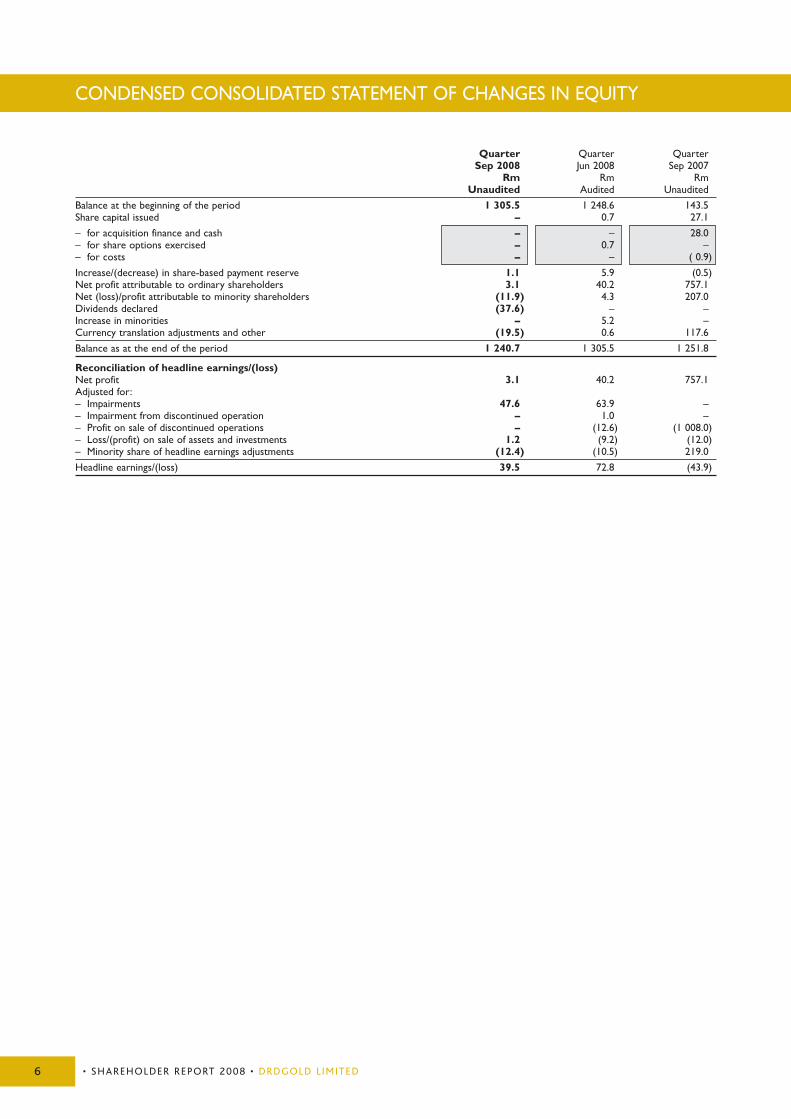
Balance at the beginning of the period 1 305.5 1 248.6 143.5Share capital issued – 0.7 27.1
– for acquisition finance and cash – – 28.0– for share options exercised – 0.7 –– for costs – – ( 0.9)
Increase/(decrease) in share-based payment reserve 1.1 5.9 (0.5)Net profit attributable to ordinary shareholders 3.1 40.2 757.1Net (loss)/profit attributable to minority shareholders (11.9) 4.3 207.0Dividends declared (37.6) – –Increase in minorities – 5.2 –Currency translation adjustments and other (19.5) 0.6 117.6
Balance as at the end of the period 1 240.7 1 305.5 1 251.8
Reconciliation of headline earnings/(loss)Net profit 3.1 40.2 757.1Adjusted for:– Impairments 47.6 63.9 –– Impairment from discontinued operation – 1.0 –– Profit on sale of discontinued operations – (12.6) (1 008.0)– Loss/(profit) on sale of assets and investments 1.2 (9.2) (12.0)– Minority share of headline earnings adjustments (12.4) (10.5) 219.0
Headline earnings/(loss) 39.5 72.8 (43.9)

• SHAREHOLDER REPORT 2008 • DRDGOLD L IMITED 7
CONDENSED CONSOLIDATED STATEMENT OF CASH FLOWS
Quarter Quarter QuarterSep 2008 Jun 2008 Sep 2007
Rm Rm RmUnaudited Reviewed Unaudited
Net cash in/(out)flow from operations 25.3 238.1 (309.7)Net cash (out)/inflow from investing activities (46.4) (150.5) 1 870.4 Net cash (out)/inflow from financing activities (2.6) 26.0 (1 059.6)
(Decrease)/increase in cash and cash equivalents (23.7) 113.6 501.1 Translation adjustment (13.4) 1.0 258.5 Opening cash and cash equivalents 846.1 731.5 137.7
Closing cash and cash equivalents 809.0 846.1 897.3
Cash classified as assets held for sale included in the closing balance – – 471.9
Reconciliation of net cash in/(out)flow from operationsProfit/(loss) before tax 5.5 (52.0) 12.7 Net operating loss from discontinued operations – (0.5) (56.6)
5.5 (52.5) (43.9)Adjusted for:Movement in gold in process 3.0 (14.7) 0.6Depreciation and impairments 64.6 74.9 19.7Movement in provision for environmental rehabilitation 12.1 16.0 4.7Share-based payments 1.1 5.9 (0.5)(Profit)/loss on derivative financial instruments (7.3) 88.5 –Loss/(profit) on sale of assets and investments 1.6 0.9 (12.0)Finance expenses and unwinding of provisions (1.6) (7.0) 3.9Growth in Environmental Trust Funds (3.5) (2.5) (1.8)Other non-cash items 0.9 (20.4) 17.5 Taxation paid – (11.8) (23.3)Working capital changes (51.1) 160.8 (274.6)
Net cash in/(out)flow from operations 25.3 238.1 (309.7)
South African operations
Quarter Quarter % QuarterBlyvoor Sep 2008 Jun 2008 Change Sep 2007
Ore milledUnderground t’000 154 174 (11) 194Surface t’000 884 980 (10) 856Total t’000 1 038 1 154 (10) 1 050
YieldUnderground g/t 4.65 4.44 5 5.03Surface g/t 0.32 0.31 3 0.31Total g/t 0.96 0.93 3 1.18
Gold producedUnderground oz 23 020 24 852 (7) 31 347
kg 716 773 (7) 975Surface oz 9 034 9 709 (7) 8 488
kg 281 302 (7) 264Total oz 32 054 34 561 (7) 39 835
kg 997 1 075 (7) 1 239 Cash operating costs
Underground US$ per oz 934 816 (15) 667ZAR per kg 233 929 204 344 (14) 152 673
ZAR per tonne 1 088 908 (20) 767Surface US$ per oz 451 379 (19) 406
ZAR per kg 112 836 94 927 (19) 92 992ZAR per tonne 36 29 (24) 29
Total US$ per oz 798 694 (15) 611ZAR per kg 199 799 173 606 (15) 139 956
ZAR per tonne 192 162 (19) 165Cash operating profit US$ million 2.1 7.0 (70) 2.8
ZAR million 16.7 53.1 (69) 20.0Capital expenditure (net) US$ million 2.2 3.7 41 1.9
ZAR million 17.4 28.6 39 13.7
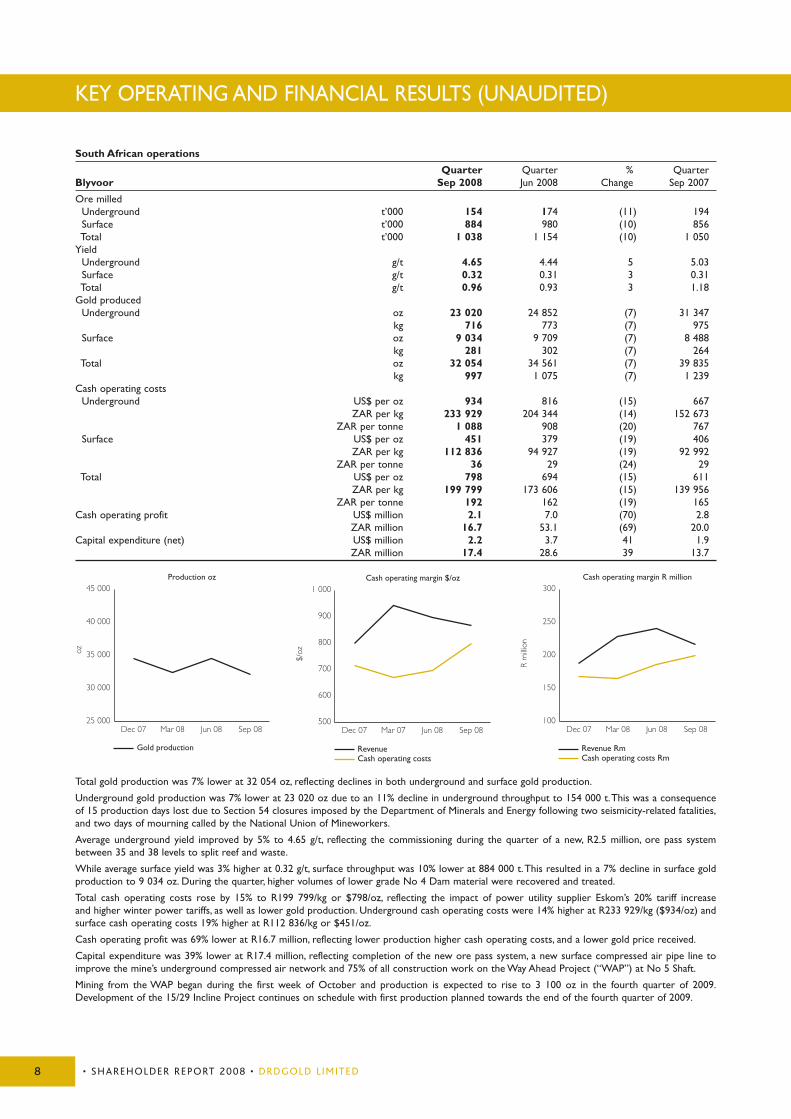
Total gold production was 7% lower at 32 054 oz, reflecting declines in both underground and surface gold production.
Underground gold production was 7% lower at 23 020 oz due to an 11% decline in underground throughput to 154 000 t.This was a consequenceof 15 production days lost due to Section 54 closures imposed by the Department of Minerals and Energy following two seismicity-related fatalities,and two days of mourning called by the National Union of Mineworkers.
Average underground yield improved by 5% to 4.65 g/t, reflecting the commissioning during the quarter of a new, R2.5 million, ore pass systembetween 35 and 38 levels to split reef and waste.
While average surface yield was 3% higher at 0.32 g/t, surface throughput was 10% lower at 884 000 t.This resulted in a 7% decline in surface goldproduction to 9 034 oz. During the quarter, higher volumes of lower grade No 4 Dam material were recovered and treated.
Total cash operating costs rose by 15% to R199 799/kg or $798/oz, reflecting the impact of power utility supplier Eskom’s 20% tariff increaseand higher winter power tariffs, as well as lower gold production. Underground cash operating costs were 14% higher at R233 929/kg ($934/oz) andsurface cash operating costs 19% higher at R112 836/kg or $451/oz.
Cash operating profit was 69% lower at R16.7 million, reflecting lower production higher cash operating costs, and a lower gold price received.
Capital expenditure was 39% lower at R17.4 million, reflecting completion of the new ore pass system, a new surface compressed air pipe line toimprove the mine’s underground compressed air network and 75% of all construction work on the Way Ahead Project (“WAP”) at No 5 Shaft.
Mining from the WAP began during the first week of October and production is expected to rise to 3 100 oz in the fourth quarter of 2009.Development of the 15/29 Incline Project continues on schedule with first production planned towards the end of the fourth quarter of 2009.
• SHAREHOLDER REPORT 2008 • DRDGOLD L IMITED8
KEY OPERATING AND FINANCIAL RESULTS (UNAUDITED)
Cash operating margin $/oz
RevenueCash operating costs
Dec 07 Mar 07 Jun 08 Sep 08500
600
700
800
900
1 000
$/oz
Cash operating margin R million
Revenue RmCash operating costs Rm
Dec 07 Mar 08 Jun 08 Sep 08100
150
200
250
300
R m
illion
Production oz
Dec 07 Mar 08 Jun 08 Sep 0825 000
30 000
35 000
40 000
45 000
oz
Gold production

• SHAREHOLDER REPORT 2008 • DRDGOLD L IMITED 9
Quarter Quarter % QuarterCrown Sep 2008 Jun 2008 Change Sep 2007Ore milled t’000 2 066 2 031 2 2 147Yield g/t 0.36 0.33 9 0.35Gold produced oz 23 985 21 573 11 24 371
kg 746 671 11 758Cash operating costs US$ per oz 544 529 (3) 515
ZAR per kg 136 075 133 159 (2) 117 825ZAR per tonne 49 44 (11) 42
Cash operating profit US$ million 7.7 8.0 (4) 4.1ZAR million 60.0 61.4 (2) 29.3
Capital expenditure (net) US$ million 1.6 4.9 67 0.2ZAR million 12.2 35.9 66 1.5
Gold production increased by 11% to 23 985 oz, reflecting a 2% increase in throughput to 2 066 000 t and a 9% increase in the average yield to 0.36 g/t,the latter due to the recovery of higher grade material from the Mennells site and of higher grade remnants from the CMR and Robertson Deep sites.Cash operating costs were 2% higher at R136 075/kg. Cash operating profit was 2% lower at R60.0 million, a consequence of higher cash operatingcosts and a lower gold price received.Capital expenditure was 66% lower at R12.2 million, reflecting disbursement of the bulk of the costs of preparing the Top Star dump, south ofJohannesburg Central Business District, for mining.In August, the Department of Minerals and Energy granted the company a licence to mine the Top Star dump and construction of the requiredinfrastructure is approximately 90% complete. Commissioning is expected to begin early in November and the rate of recovery to have reached100 000 tpm by the end of November, half of the planned full recovery rate.
Quarter Quarter % QuarterERPM Sep 2008 Jun 2008 Change Sep 2007Ore milled
Underground t’000 64 68 (6) 85Surface t’000 379 358 6 506Total t’000 443 426 4 591
YieldUnderground g/t 5.30 5.00 6 6.47Surface g/t 0.32 0.36 (11) 0.45Total g/t 1.04 1.10 (5) 1.31
Gold producedUnderground oz 10 899 10 930 – 17 684
kg 339 340 – 550Surface oz 3 923 4 147 (5) 7 267
kg 122 129 (5) 226Total oz 14 822 15 077 (2) 24 951
kg 461 469 (2) 776Cash operating costs
Underground US$ per oz 1 062 966 (10) 647ZAR per kg 265 794 243 865 (9) 148 145
ZAR per tonne 1 408 1 219 (16) 955Surface US$ per oz 840 750 (12) 512
ZAR per kg 210 385 189 000 (11) 117 159ZAR per tonne 68 68 – 52
Total US$ per oz 1 003 907 (11) 608ZAR per kg 251 130 228 774 (10) 139 121
ZAR per tonne 261 252 (4) 183Cash operating (loss)/profit US$ million (2.1) (0.4) (425) 1.8
ZAR million (16.5) (2.3) (617) 13.0Capital expenditure (net) US$ million 0.6 1.2 50 0.9
ZAR million 4.3 9.1 53 6.2
Production oz
Dec 07 Mar 08 Jun 08 Sep 0818 000
20 000
22 000
24 000
oz
Gold production
Cash operating margin $/oz
RevenueCash operating costs
Dec 07 Mar 08 Jun 08 Sep 08400
500
600
700
800
900
1 000
$/oz
Cash operating margin R million
Revenue RmCash operating costs Rm
Dec 07 Mar 08 Jun 08 Sep 0875
100
125
150
175
200
R m
illion

• SHAREHOLDER REPORT 2008 • DRDGOLD L IMITED10
KEY OPERATING AND FINANCIAL RESULTS (UNAUDITED)
The previously reported restructuring of ERPM’s underground operations to reverse a worsening pattern of unprofitable mining was complete
Total gold production was 2% lower at 14 822 oz, reflecting lower surface gold production.
Underground gold production was virtually unchanged at 10 899 oz.Although underground throughput was 6% lower due to the residual impact ofthe previous quarter’s restructuring, the average underground yield improved by 6% to 5.30 g/t, reflecting the elimination of the unprofitable 73 and74 longwalls.
While surface throughput increased by 6% to 379 000 t, the average surface yield declined by 11% to 0.32 g/t, reflecting the recovery of lower gradematerial from the Cason dump’s southern face. Consequently, surface gold production was 5% lower at 3 923 oz.
Total cash operating costs increased by 10% to R251 130/kg, a consequence of lower production, as well as power utility Eskom’s 20% tariff increaseand higher winter tariffs.Underground cash operating costs were 9% higher at R265 794/kg and surface cash operating costs 11% higher at R210 385/kg.
The cash operating loss for the quarter increased to R16.5 million from R2.3 million, reflecting lower production, higher cash operating costs and alower gold price received.
Capital expenditure was 53% lower at R4.3 million.
Exploration and prospectingERPMERPM mining lease areaDuring the quarter drilling was confined to cover (71 East 2) and structure (73 West X/C N). Currently a hole is being drilled at 70 E FW drive todetermine the parting between the Composite Reef and the Jeppestown Shales footwall.The core will be used to determine the rock strengths ofthe shale horizon, which is in closer proximity to the mining horizon than initially thought.
Extension 1A geological report to accompany the Turgis Consulting’s decline feasibility study is in the process of being finalised. A revised structure plan forExtension 1 has been produced, utilising geophysical information and historical Sallies data.An unconformity between the Jeppestown Shales and theComposite Reef has been identified which results in a narrowing of their middling towards the east and north.
Extension 2An agreement has been drawn up between DRDGOLD and AngloGold Ashanti Limited (“AngloGold”) where a data exchange will take place betweenthe two companies. AngloGold will provide access to the Sallies exploration borehole core and copies of the logging and reports in exchange forsampling data and reports from Blyvoor.
BlyvoorFor the quarter three prospect holes intersected the Carbon Leader Reef in the following areas 38 31 fault block, 35 32 X/C N and 38 34, assayingat 219 cmgt, 894 cmgt and 642 cmgt respectively. Main Reef was intersected in two holes 38 34 (522 cmgt) and 38 33 X/C N (awaiting assay). Coverdrilling in 38 21 FW Dr W in the South West block, intersected methane.
The assay results of phase 2 of the drilling of Blyvoor No 7 slimes dam were received and averaged 0.247 g/t.The average grade of the phase 1 and2 drilling equates to 0.279 g/t.The recovery percentages of the remainder of the operations slimes dams are in the process of being determined todevelop a strategy for the surface operations going forward.
Crown and ErgoExploration activity continues to be confined to the ERGO JV, with in excess of 10 300 m of augering having been conducted for exploration andmetallurgical test work to date.
During the quarter, drilling was completed at the Brakpan,Van Dyk and Grootvlei complexes. Exploration is currently in progress at Marievale, thefinal complex to be explored in the initial exploration programme. Additional drilling, in the form of cased holes, is scheduled in areas whereconventional drilling was not possible.
The outstanding assay results for Homestead and Rooikraal were received during the quarter. In addition, partial assay results were returned forBrakpan and Van Dyk.The Homestead and Rooikraal results are similar to those obtained for the other current Crown deposition complexes andare in line with initial estimates, with the exception of lower uranium values. Similarly the initial Brakpan results indicate a lower uranium grade thananticipated, whilst Van Dyk’s initial assays show a close correlation with the initial estimate.The lower uranium grade reported for the larger complexesmay be as a result of the drilling pattern (ie close proximity to the sides), which requires verification.
All relevant technical information pertaining to the complexes is forwarded to Coffey Mining (formerly RSG Global), for the generation of CompetentPerson’s Reports (“CPRs”). During the quarter a SAMREC-compliant gold, uranium and sulphur resource for the Elsburg JV was declared.
A draft CPR pertaining to the ERGO phase 1 gold reserve (Elsburg and Benoni) has also been received and is currently under review.The final CPRfor the GMTS, Homestead and Mooifontein complexes has been delayed due to survey problems associated with the insertion of historical boreholesinto the geological model.The report is expected to be finalised during October.
Production oz
Gold production
Dec 07 Mar 08 Jun 08 Sep 0813 000
15 000
17 000
19 000
21 000
23 000
oz
Cash operating margin $/oz
RevenueCash operating costs
Dec 07 Mar 08 Jun 08 Sep 08550600650700750800850900950
1 0001 0501 1001 1501 200
$/oz
Cash operating margin Rmillion
Revenue RmCash operating costs Rm
Dec 07 Mar 08 Jun 08 Sep 0850
60
70
80
90
100
110
120
130
140
150
R m
illion

• SHAREHOLDER REPORT 2008 • DRDGOLD L IMITED 11
Discontinued operations – Emperor Mines LimitedQuarter Quarter % Quarter
Tolukuma Sep 2008 Jun 2008 Change Sep 2007
Ore milled t’000 – – – 45Yield g/t – – – 6.91Gold produced oz – – – 10 033
kg – – – 311Cash operating costs US$ per oz – – – 1 017
ZAR per kg – – – 233 707ZAR per tonne – – – 1 615
Cash operating loss US$ million – – – (0.9)ZAR million – – – (6.5)
Capital expenditure (net) US$ million – – – 2.1ZAR million – – – 15.0
Continuing OperationsTotal Mine
R000 unless otherwise stated Crown ERPM Blyvoor OperationsTotal cash costs 109 130 121 793 212 802 443 725Movement in gold in process 1 243 1 991 (6 245) (3 011)Less: Production taxes, rehabilitation and other 5 111 3 035 3 162 11 308Less: Retrenchment costs – 858 – 858Less: Corporate and general administration costs 3 750 4 120 4 195 12 065Cash operating costs 101 512 115 771 199 200 416 483Gold produced – kgs 746 461 997 2 204Total cash operating costs – R/kg 136 075 251 130 199 799 188 967Total cash operating costs – US$/oz 544 1 003 798 755
CASH OPERATING COSTS RECONCILIATION

DIRECTORS(*British) (**Australian) (***American)
Executives:JWC Sayers (Chief Executive Officer)
DJ Pretorius (Chief Executive Officer Designate)
CC Barnes (Chief Financial Officer)
Non-executive:J Turk***
Company Secretary:TJ Gwebu
Independent non-executives:GC Campbell* (Non-Executive Chairman)
D Blackmur** (Senior Non-Executive Director)
RP Hume
EA Jeneker
For further information, contact John Sayers at:
Tel: (+27-11) 219-8700
Fax: (+27-11) 476-2637
website: http://www.drdgold.com
Ebsco House 4299 Pendoring Avenue, Blackheath
Randburg, South Africa
PO Box 390, Maraisburg, 1700, South Africa