Report to Rapport au: Finance and Economic Development ... · Comité des transports: le 30 juin...
178
1 Report to Rapport au: Finance and Economic Development Committee Comité des finances et du développement économique 2 June 2015 / 2 juin 2015 and Council et au Conseil 8 July 2015 / 8 juillet 2015 Submitted on May 26, 2015 Soumis le 26 mai 2015 Submitted by Soumis par: Kent Kirkpatrick, City Manager / directeur municipal Contact Person Personne ressource: Steve Box, Director, Corporate Programs and Business Services / directeur, Programmes municipaux et Services opérationnels, City Manager’s Office / Bureau du directeur municipal 613-580-2424, ext/poste 24200, [email protected] Ward: CITY WIDE / À L'ÉCHELLE DE LA VILLE File Number: ACS2015-CMR-OCM-0016 SUBJECT: Proposed 2015-2018 Term of Council Priorities OBJET: Les priorités proposées pour le mandat du Conseil 2015-2018 REPORT RECOMMENDATIONS 1. That the Finance and Economic Development Committee receive and refer the Proposed 2015-2018 Term of Council Priorities Report with the associated appendices to the Standing Committees of Council, Information Technology Sub-Committee and Transit Commission for their consideration of Appendix A, as follows:
Transcript of Report to Rapport au: Finance and Economic Development ... · Comité des transports: le 30 juin...

1
Report to
Rapport au:
Finance and Economic Development Committee
Comité des finances et du développement économique
2 June 2015 / 2 juin 2015
and Council
et au Conseil
8 July 2015 / 8 juillet 2015
Submitted on May 26, 2015
Soumis le 26 mai 2015
Submitted by
Soumis par:
Kent Kirkpatrick, City Manager / directeur municipal
Contact Person
Personne ressource:
Steve Box, Director, Corporate Programs and Business Services / directeur,
Programmes municipaux et Services opérationnels, City Manager’s Office / Bureau du
directeur municipal
613-580-2424, ext/poste 24200, [email protected]
Ward: CITY WIDE / À L'ÉCHELLE DE
LA VILLE
File Number: ACS2015-CMR-OCM-0016
SUBJECT: Proposed 2015-2018 Term of Council Priorities
OBJET: Les priorités proposées pour le mandat du Conseil 2015-2018
REPORT RECOMMENDATIONS
1. That the Finance and Economic Development Committee receive and refer the
Proposed 2015-2018 Term of Council Priorities Report with the associated
appendices to the Standing Committees of Council, Information Technology
Sub-Committee and Transit Commission for their consideration of Appendix
A, as follows:

2
Agricultural and Rural Affairs Committee: June 5, 2015, to consider Section
3;
Planning Committee: June 9, 2015, to consider Section 4;
Environment Committee: June 16, 2015, to consider Section 5;
Transit Commission: June 17, 2015, to consider Section 6;
Community and Protective Services Committee: June 18, 2015, to consider
Section 7;
Information Technology Sub-Committee: June 25, 2015, to consider
Section 2;
Finance and Economic Development Committee: June 29, 2015, to consider
Section 1; and
Transportation Committee: June 30, 2015, to consider Section 8.
2. That, at its meeting of July 8, 2015, City Council:
a. Receive the 2011-2014 City Balanced Scorecard Results Summary,
outlined in Appendix B.
b. Approve the proposed Term of Council Priorities as outlined in
Appendix A, including as follows:
i. The Strategy Map and seven Term of Council priorities as
outlined on p. 4-5;
ii. The Strategic Initiatives and the associated performance
measures as outlined throughout Appendix A;
iii. The Standing Committee, IT Sub-Committee and Transit
Commission oversight, as outlined on p. 6-9; and
iv. The allocation for 2015 for the approved Strategic Initiatives and
that the proposed spending for approved Strategic Initiatives for
years 2016-2018 be included for consideration in each of those
draft budgets.
c. Direct staff to prepare a 2015-2018 City Strategic Plan and City Balanced
Scorecard based on the approved Term of Council Priorities.
RECOMMANDATIONS DU RAPPORT
1. Que le Comité des finances et du développement économique reçoive le
rapport sur les priorités proposées pour le mandat du Conseil 2015-2018 et les
annexes connexes et les transmette aux comités permanents du Conseil, au
Sous-comité de la technologie de l’information et à la Commission du
transport en commun, qui devront examiner l’annexe A de la façon suivante :

3
Comité de l’agriculture et des affaires rurales: le 5 juin 2015, Section- 3;
Comité de l’urbanisme: le 9 juin 2015, Section- 4;
Comité de l’environnement: le 16 juin 2015, Section- 5;
Commission du transport en commun: le 17 juin 2015, Section- 6;
Comité des services communautaires et de protection: le 18 juin 2015,
Section- 7;
Sous-comité de la technologie de l’information: le 25 juin 2015, Section- 2;
Comité des finances et du développement économique: le 29 juin 2015,
Section- 1;
Comité des transports: le 30 juin 2015, Section- 8.
2. Que le Conseil, lors de sa réunion du 8, juillet 2015 :
a. Reçoive le sommaire des résultats du bulletin de rendement équilibré
2011-2014 de la Ville, figurant à l’annexe B;
b. Approuve les priorités proposées pour le mandat du Conseil figurant à
l’annexe A, dont :
i. Le schéma stratégique de la Ville d’Ottawa et les sept priorités
pour le mandat du Conseil, aux pages 4 et 5;
ii. Les initiatives stratégiques et les mesures de rendement
connexes énoncées à l’annexe A;
iii. La responsabilité de surveillance des comités permanents, du
Sous-comité de la technologie de l’information et de la
Commission du transport en commun, indiquée aux pages 6 à 9;
iv. Les fonds alloués en 2015 pour les initiatives stratégiques
approuvées et les fonds proposés pour ces initiatives pour 2016-
à 2018, lesquels seront inclus aux fins d’examen dans les
provisoires de ces années.
c. Demande au personnel de préparer le Plan stratégique de la Ville et le
bulletin de rendement équilibré pour 2015-2018 en se fondant sur les
priorités approuvées pour le mandat du Conseil.
BACKGROUND
The Corporate Planning Framework
In keeping with Council’s focus on accountability, transparency and sound business
practices, the Corporate Planning Framework (CPF) (ACS2011-COS-ODP-0007) was
approved by Council on May 25, 2011. The adopted framework strengthens
accountability at all levels and the alignment of the planning and budget process, and

4
addresses previous Auditor General recommendations. As part of the 2014-2018
Council Governance Review (ACS2014-CMR-CCB-0062) Council enhanced the
process and directed that consultation with Advisory Committees be strengthened.
The Corporate Planning Framework reflects leading best practice approaches and
methods designed to support the Mayor and Council, through the Standing Committees
and the Transit Commission and senior management, to make the City a more strategy
driven organization.
The corporate planning process supports the establishment of a set of strategic
priorities that Council plans to achieve during this term. Strategic priorities provide clear
strategic direction from Council for staff regarding what is expected to be accomplished
in the term.
The Corporate Planning Framework directed that senior management work with the
Mayor and the Standing Committee and Transit Commission Chairs and Vice-Chairs to
develop proposed strategic priorities for Committee and Council consideration. Council
also directed the inclusion of a City Balanced Scorecard in the City Strategic Plan (CSP)
to strengthen how the City governs Council’s priorities and measures progress on them.
Term of Council priorities are presented visually through the strategy map, which
provides the tools for integrating priorities, programs and services for what Council
wishes the City to achieve over the Term of Council. The strategy map is a visual tool
which endeavours to link strategic planning with performance measurement by linking
strategic objective statements and the measures and targets that are captured in the
City’s Balanced Scorecard.
The purpose of identifying Term of Council priorities is to ensure management and
operations focus on advancing these priorities when making decisions and delivering
services. The mandates directed by Council for City programs and services and the
directions contained in the adoption of the annual capital and operating budgets remain
and are informed by Council’s priorities for the term.
Once approved, the Term of Council Priorities form the 2015-2018 City Strategic Plan
and Balanced Scorecard. The City Balanced Scorecard will track the progress of
performance against the City Strategic Plan, and act as the basis for strategy review
discussions on advancing Council’s priorities by senior management.
The City strategy will then be cascaded to departments through the development of
departmental strategic plans and balanced scorecards. The Council-approved Term of
Council Priorities will inform the departmental strategic priorities, to provide alignment
and linkages to the City Strategic Plan and City Balanced Scorecard.

5
Governance, Roles and Responsibilities
The Mayor, Standing Committees and the Transit Commission have an oversight role
with respect to Term of Council priorities. This Standing Committee and Transit
Commission oversight enables Council to effectively set priorities for the Term of
Council and monitor performance of programs and services and provide the appropriate
direction to staff.
The following descriptions highlight the main roles and responsibilities of Standing
Committees, Transit Commission, Advisory Committees and staff in relation to the Term
of Council Priorities. The proposed oversight mandate for each Standing Committee
and the Transit Commission with respect to the proposed Term of Council strategic
objectives and initiatives is identified in Appendix A.
1. Mayor, Standing Committee and Transit Commission Chairs and Vice-Chairs
The Mayor, Standing Committee and Transit Commission Chairs and Vice-Chairs
identify the proposed strategic priorities, objectives, initiatives along with their related
resource impacts (budget and FTEs) and performance measures, as well as the
Standing Committee and Transit Commission oversight responsibilities that pertain to
their respective mandates. Where oversight responsibility for a strategic initiative or
objective appears to belong to more than one Standing Committee, through the priority
setting process, a lead Standing Committee has been identified to assume
responsibility. The lead Standing Committee Chair will determine when items should be
referred to other Standing Committees, in consultation with other Standing Committee
Chairs, as per the governance report and the respective adopted Committee mandates.
Should the focus of a strategic initiative change over the term of Council, the strategic
initiative could be re-aligned with another Standing Committee whose mandate better
aligns with the initiative’s new focus.
2. Standing Committees and Transit Commission
Standing Committees and the Transit Commission review the proposed strategic
priorities, objectives and initiatives and forward any amendments to Council through
motions identified at Standing Committees and the Transit Commission. This allows for
a more comprehensive discussion of all priorities at Council.
Once the priorities are approved, Standing Committees and the Transit Commission
monitor performance and provide direction to staff. Progress is reported to Council
twice over the Term through the City Balanced Scorecard report, and through reports
related to strategic initiatives provided by staff through the Legislative Agenda process
throughout the Term of Council.

6
3. Staff
Staff receives direction from Council, Standing Committees and the Transit Commission
regarding priorities and related strategic objectives and strategic initiatives. Staff fulfills
the Term of Council Priorities through the implementation of strategic initiatives, and
reports back on progress using the associated measures in the City Balanced
Scorecard. Senior management monitors progress against objectives through the
review of semi-annual City Balanced Scorecard reports and associated senior
management strategy review meetings.
4. Advisory Committees
The Advisory Committees review and provide input to the proposed Term of Council
Priorities. As outlined in the 2014-2018 Council Governance Review (ACS2014-CMR-
CCB-0062), approved by Council on December 3, 2014, the Advisory Committees are
informed of the City’s process and timelines for the development and Council approval
of the proposed 2015-2018 Term of Council Priorities, and are invited to provide input
during the development phase. They also have the opportunity to provide input on the
proposed priorities through the Standing Committee and Transit Commission review.
External Boards
The Corporate Planning Framework adopted by Council in 2011 includes recognition of
the connection between the Term of Council Priorities and the priorities of four external
boards, namely the Ottawa Police Services Board, the Ottawa Public Library Board, the
Ottawa Community Housing Board and the Ottawa Board of Health, and acknowledges
that each board has its own independent governance structure and planning process.
To ensure alignment with the City Strategic Plan, the four boards were informed of the
process and timelines for the development and Council approval of the 2015-2018 Term
of Council Priorities. The boards were asked to use the proposed priorities to inform
their own respective planning activities and to update Council as appropriate on how
their plans align with the proposed 2015-2018 Term of Council Priorities. There is one
strategic initiative from the Ottawa Public Library, related to the development of a
Central Library, which has been incorporated into the proposed Term of Council
Priorities as a strategic initiative. This project, however, and the funding associated with
it are subject to Council approval when brought forward by the Ottawa Public Library
Board at a future date.
2011-2014 City Balanced Scorecard Results Summary

7
Since the approval of the 2011-2014 Term of Council Priorities in July 2011, the City
has executed the strategic initiatives in the 2011-2014 City Strategic Plan. Progress has
been monitored regularly by senior management through City Balanced Scorecard
reports and regular strategy review sessions. Council was formally updated on mid-term
progress in 2013 through the City Balanced Scorecard Report (ACS2013-CMR-OCM-
0005) and the full end-of-term results are appended to this report.
Appendix B contains the 2011-2014 City Balanced Scorecard Results Summary, which
is the final report to Council and the public on the execution of the strategic initiatives,
objectives and priorities in the 2011-2014 City Strategic Plan. Results are based on
performance data through to the end of 2014.
DISCUSSION
The purpose of this report is to accurately reflect Council’s identified strategic priorities
for the 2015-2018 term of Council. Once approved, it will form the basis of the 2015-
2018 City Strategic Plan and Balanced Scorecard.
This report:
1. Provides Proposed Term of Council Priorities for Consideration:
The Mayor, the Chairs and Vice-Chairs of the Standing Committees, including the
Information Technology Sub-Committee, and the Transit Commission, and
Councillors worked together to develop a set of proposed strategic priorities that
represent the highest level expression of what the Council wishes the City to achieve
over the term of Council. These proposed priorities, contained in Appendix A, are
made tangible through the strategic objectives and initiatives (which include budget
allocations and performance measures) that define what will be achieved and how it
will be achieved during this term.
2. Seeks Public Input and Council Consideration and Approval:
The vision and the constituents and stakeholders remain as Council adopted them in
the 2011-2014 Term of Council priorities report. The City’s long-term strategic vision
is grounded in the Framing our Future plan, which was a large scale planning
initiative with significant public engagement. Between 2008 and 2011 extensive
public consultation was undertaken in partnership with the National Capital
Commission (NCC) and the City of Gatineau to develop long-term sustainability
goals for the National Capital region. This type of initiative is typically undertaken
every 8 to 10 years. The result of this initiative was the Framing our Future report
which was adopted by Council in 2012. The long-term sustainability goals outlined in

8
the proposed Term of Council Priorities are directly aligned with the Framing Our
Future report.
This long-term vision is also reflected in the Council adopted master plans which use
the long-term priorities and goals generated through consultation as a guiding
principle. The previous Council adopted the Transportation Master Plan, City Official
Plan, Infrastructure Master Plan, Long-Range Financial Plan, the Ten Year Housing
and Homelessness Plan, Environmental Strategy and the Renewed Action Plan for
Arts, Culture and Heritage. These plans were developed through extensive
community consultation and the directions contained in these plans are directly
reflected in a majority of the identified proposed objectives and associated initiatives
before Council for consideration.
The Advisory Committees were also engaged in reviewing and providing input to the
proposed Term of Council Priorities. The Advisory Committees were provided with a
presentation for review and discussion in their April meetings by the management
from Environmental Services, Parks, Recreation and Cultural Services, and
Corporate Programs and Business Services. They will also have the opportunity to
provide input on the proposed priorities through the Standing Committee and Transit
Commission review.
Standing Committees and the Transit Commission will receive public delegations
and discuss, review and consider the proposed strategic priorities, strategic
objectives, strategic initiatives and performance measures.
Priority Setting Approach
The Chairs and Vice-Chairs of the Standing Committees, including the Information
Technology Sub-Committee, and the Transit Commission, the Mayor, and Councillors
worked with management to develop the proposed Term of Council Priorities. In doing
so, they took into account several important stakeholder perspectives and
considerations including:
Constituents: Community priorities that were identified through the 2014 electoral
platforms.
Direction from Previous Council: Received through the Legislative Agenda
process.
Previous City Strategic Plan: Strategic initiatives identified in the 2011-2014 City
Strategic Plan that have remaining phases before being fully completed. This
includes the completion of the O-Train’s Confederation Line Light Rail Transit
projects, the Ottawa Art Gallery Expansion and Arts Court Redevelopment, the

9
Ten-Year Housing and Homelessness Plan, the Ottawa River Action Plan
(ORAP), among others.
Employees: Staff input was obtained through the results of an employee survey.
Federation of Canadian Municipalities (FCM): Information on initiatives, programs
and policy matters that fall within the federal jurisdiction and are of interest to
municipalities were obtained through FCM.
Proposed Strategic Priorities
Once adopted the Term of Council Priorities Report defines what the City will
accomplish over the 2015-2018 term. The draft before Council for consideration
includes seven (7) strategic priorities; 21 strategic objectives, which articulate what the
Council is seeking to achieve; and 63 related strategic initiatives, which are the concrete
actions, tactical programs and services, that will advance Council’s objectives and
strategic priorities. The strategic initiatives are aligned with the mandates of the
Standing Committees, including the Information Technology Sub-Committee, and
Transit Commission. The report outlines the oversight responsibilities, as well as the
budget requirements associated with the implementation, of the strategic initiatives.
Also included are the performance measures within the City Balanced Scorecard that
form the basis of performance reports to senior management and Council.
Together, the Mayor, Chairs, Vice-Chairs, Councillors, and management developed the
proposed strategic priorities that outline what will be accomplished during the 2015-
2018 Term of Council. These proposed strategic priorities are:
Economic Prosperity: Use Ottawa’s unique combination of recreational, social,
cultural and business assets, and natural environment and physical infrastructure
to attract enterprises, visitors and new residents, while at the same time
developing and retaining local firms and talent.
Transportation and Mobility: Meet the current and future transportation needs of
residents and visitors through Phase 1 and Phase 2 of the Transportation Master
Plan, including ensuring the City’s transit services are reliable and financially
sustainable. Continued focus on improving mobility during the Light Rail Transit
implementation, and support for alternative transportation methods including
cycling and walking, as well as transit.
Sustainable Environmental Services: To provide sustainable environmental
services that balance protection of our natural resources and support the planned
growth of the city with the duty to ensure fiscal sustainability and meet legislative
requirements in the delivery of municipal services.

10
Healthy and Caring Communities: Help all residents and visitors enjoy a good
quality of life and a sense of community well-being by providing healthy, safe,
secure, accessible and inclusive places and services.
Service Excellence: Improve client satisfaction with the delivery of municipal
services by measurably strengthening the culture of service excellence at the
City, by improving the efficiency of City operations and by creating positive client
experiences.
Governance, Planning and Decision-Making: Achieve measurable improvement
in residents’ level of trust in how the City is governed and managed, apply a
sustainability lens to decision-making, and create a governance model that
compares well to best-in-class cities around the world.
Financial Sustainability: Practice prudent fiscal management of existing
resources, and make sound long-term choices that allow City programs and
services to be sustainable.
These strategic priorities have been further translated into a set of executable strategic
objectives to give further clarity and meaning to the priority, and are supported by
related strategic initiatives and performance measures. The fully articulated priorities,
objectives, initiatives, measures and oversight responsibilities are contained in
Appendix A to this report.
The proposed 2015-2018 Term of Council Priorities provide for a balanced City
Strategic Plan that accounts for the needs of urban, suburban and rural communities,
and spans the city. While this balanced approach is considered throughout the
proposed priorities, it is particularly evident through certain strategic initiatives. For
example, the Transportation Master Plan Phase 1 projects for roads, cycling and
pedestrians (as outlined in Appendix C to this report) span the city, and involve
improvement projects in most wards.
The Transportation and Mobility Priority includes the continued investment in large scale
infrastructure projects in roads and transit, including Light Rail Transit, to improve
transportation for all residents, travelling into and out of the downtown core, from rural
and suburban areas. Extensive investment was made in rural and suburban roads
during the last term and this remains the case in the identified roads, cycling and
pedestrian infrastructure initiatives contained in the proposed 2015-2018 Term of
Council Priorities.
Focus must also continue on promoting and supporting cycling and walking as safe
alternative mobility choices, through improvements to cycling and pedestrian

11
infrastructure, with the intent to make Ottawa’s roads safer for all drivers, cyclists and
walkers. The Community Pathways and Connections Program projects for example will
make it easier, safer and more convenient for residents in all neighbourhoods, to travel
within their own communities, and throughout the city. The projects are focused on
improving pathway connections, including better access to transit and community
facilities, via walking, cycling and other active modes of transportation. A list of the
specific pathways proposed for improvements under this strategic initiative is outlined in
Appendix D to this report.
Link to Long Range Financial Plan and Budget:
Considering that the Term of Council Priorities are finalized after adoption of the 2015
budget, an envelope for all new operating strategic initiatives funded from the Provincial
upload was established within the 2015 budget document, and the annual capital
envelope for Council’s strategic initiatives was identified in both the 2015 budget and
the Tax Supported Long Range Financial Plan.
Proposed allocations of funds associated with the proposed strategic initiatives are
contained in Appendix A. For those initiatives that are proposed to receive 2015 base
operating funds, those amounts have been included into subsequent years’ operating
budgets.
Where a proposed initiative receives one-time operating funds, those one-time
operating amounts are not carried forward to subsequent years and are not reflected in
subsequent years’ budgets.
Allocation of these funds is being established through this Term of Council priority-
setting process.
The resource impacts (budget and FTEs) for strategic initiatives that support the
priorities and objectives contained in this report, once endorsed by Council, will be
considered in the 2016 through 2018 budget processes. The 2016 budget is expected
to be tabled at Committee and Council in the fall of 2015.
The strategic initiative for the Central Library in this Proposed 2015-2018 Term of
Council Priorities Report is pending Council approval, and has no existing financial
commitment identified. The Ottawa Public Library is currently developing a business
case exploring options for the Central Library, and will report back to Council, outside of
this process.

12
RURAL IMPLICATIONS
The rural implications of implementing the recommendations set out in this report are
identified in the strategic initiatives in the Proposed 2015-2018 Term of Council
Priorities.
CONSULTATION
The Proposed 2015-2018 Term of Council Priorities Report was developed
collaboratively with: direction and input from the Mayor, Standing Committee, including
the Information Technology Sub-Committee, and Transit Commission Chairs and Vice-
Chairs, and Councillors; direction from Executive Committee; and, input from senior
management. Presentations to all Advisory Committees were undertaken in April of this
year. Input received through public delegations at Transit Commission and Standing
Committees will also inform the 2015-2018 Term of Council Priorities and City Strategic
Plan.
COMMENTS BY THE WARD COUNCILLOR(S)
This item is citywide.
ADVISORY COMMITTEE(S) COMMENTS
Advisory Committees are invited to provide input through delegations at Transit
Commission and Standing Committees.
LEGAL IMPLICATIONS
There are no legal impediments to implementing the recommendations in the report.
RISK MANAGEMENT IMPLICATIONS
There are no risk management implications with respect to implementing the
recommendations as set out in this report.
ASSET MANAGEMENT IMPLICATIONS
Any implications related to the impact on the City’s physical assets within the individual
strategic initiatives in this report will be addressed through the Transit Commission and
Standing Committees when receiving reports related to these projects.
FINANCIAL IMPLICATIONS
There are no additional financial implications associated with the approval of this report.
The budget requirements to implement the strategic initiatives outlined in the proposed

13
Term of Council Priorities were included in the 2015 operating and capital budget and
forecast approved by Council on March 11, 2015. In addition funds from the Capital
Adjustment & Project Close Report has identified funding for the Term of Council
Priorities.
ACCESSIBILITY IMPACTS
There are no accessibility implications with respect to implementing the
recommendations set out in this report.
ENVIRONMENTAL IMPLICATIONS
Any implications related to the impact on the city’s environment within the individual
strategic initiatives in this report will be addressed through the Transit Commission and
Standing Committees when receiving reports related to these projects.
TECHNOLOGY IMPLICATIONS
Where there are technical implications and requirements in the fulfillment and execution
of these initiatives, Information Technology Services will work with the business, either
in a technical consulting capacity, or as a service provider depending on the business
requirements.
TERM OF COUNCIL PRIORITIES
This report and the supporting documentation directly relate to the Term of Council
Priorities. The report contains proposed Term of Council Priorities for the 2015-2018
term of Council.
The strategic priorities, strategic objectives and strategic initiatives stated in Appendix A
to this report will replace those in the 2011-2014 City Strategic Plan. Once the 2015-
2018 Term of Council Priorities are endorsed, reports to Council will have to
demonstrate their alignment to the 2015-2018 Term of Council Priorities and Objectives.
SUPPORTING DOCUMENTATION
Appendix A: Proposed 2015-2018 Term of Council Priorities
Appendix B: 2011-2014 City Balanced Scorecard Results Summary
Appendix C: Transportation Master Plan Phase 1 Projects during the 2015-2018 Term
of Council
Appendix D: Community Connectivity Projects (2015-2018)

14
DISPOSITION
The Corporate Programs and Business Services department will implement the decision
of Committee and Council and report back to Council. Subsequent to Council’s
adoption of its 2015-2018 Term of Council Priorities and the production of the 2015-
2018 City Strategic Plan the plan is updated to reflect the decisions of Council
throughout the term obtained through the Legislative Agenda process. Technical
amendments to the 2015-2018 City Strategic Plan are made by the Corporate Programs
and Business Services department as required and Council is updated on those
amendments through regular reporting.

Appendix A
Proposed 2015-2018 Term of Council Priorities

Legend
Page 1 of 126
Lead Departments Standing Committees / Transit Commission and Sub-Committees
CC – Corporate Communications ARAC – Agriculture and Rural Affairs Committee CPBS – Corporate Programs and Business Services CPSC – Community and Protective Services Committee CSS – Community and Social Services EC – Environment Committee EDI – Economic Development and Innovation FEDC – Finance and Economic Development Committee EPS – Emergency and Protective Services ITSC – Information Technology Sub-Committee ESD – Environmental Services PC – Planning Standing Committee FIN – Finance TC – Transit Commission HR – Human Resources TRC – Transportation Standing Committee ISD – Infrastructure Services ITS – Information Technology Services OCT – OC Transpo/Transit Services OPL – Ottawa Public Library PGM – Planning and Growth Management PRC – Parks, Recreation and Cultural Services PW – Public Works REPDO – Real Estate Partnerships and Development Office RIO – Rail Implementation Office SO – ServiceOttawa
Lead Dept = Lead Department
SC = Standing Committee

Appendix A
Proposed 2015-2018 Term of Council Priorities Proposed Term of Council Priorities Overview
This report contains an overview of the proposed 2015-2018 Term of Council Priorities. This Appendix is structured so that the objectives and initiatives of the proposed Term of Council Priorities are aligned in accordance with the Council adopted mandates of Standing Committees and the Transit Commission (refer to the Index on page 10 of this Appendix). The material presented includes the following:
· Strategic priorities: The proposed strategic priorities for the Term of Council. These are the areas of focus for the City’s term of Council; · Strategic objectives: The outcomes that are expected to be achieved to advance the respective strategic priorities; · Strategic initiatives and their related resource impacts (budget and Full-Time-Equivalents). The programs or projects that will be achieved during this term
of Council to advance the strategic objectives. The associated metrics and targets are also provided; these will form the balanced scorecard; and · Performance measures: The performance measures with targets for each strategic objective and strategic initiative.
Note that where a Standing Committee or the Transit Commission is proposed to have oversight over a strategic initiative but not its associated strategic objective, this strategic objective and its associated performance measure(s) is provided for ease of reference.
Strategic Planning Approach Council has adopted a strategic planning approach that links their priorities to the operational programs and services delivered to residents. The methodology uses two key tools – the strategy map and balanced scorecard – to link planning with performance measurement and to the financial resources required to deliver programs and services.
The strategic planning process is based on the Kaplan-Norton balanced scorecard, which incorporates four perspectives into the planning and measurement process:
1. Constituents and Stakeholders: identifies the City’s main clients and key programs and services the City wants to enhance. 2. Process: addresses internal processes and how to improve them in order to consistently meet clients’ needs.
Page 2 of 126

3. People: addresses the resources, skills, training and support to ensure staff effectiveness. 4. Budget: addresses the resources required to achieve the Council’s goals.
The strategy map is a visual depiction of the Council’s strategic priorities and strategic objectives. The balanced scorecard is used to measure the outcome of the objectives identified in the plan. Together, these tools capture a series of cause-and-effect relationships that integrate strategic planning and operations for City departments with the goal of achieving Council’s priorities.
City Strategy Map The strategy map depicts how the Term of Council vision, long-term sustainability goals, priorities and objectives are linked. The balanced scorecard is the framework that is used to communicate how the organization plans to achieve its strategic goals. What is outlined for Council consideration are seven strategic priorities and 21 strategic objectives, each defined in terms of what will be accomplished with associated initiatives, or tactical programs and projects, that will advance the objectives. The objectives and initiatives will be measured and have targets that will be reported using the balanced scorecard.
How to Read the Strategy Map The top of the strategy map (the roof) on page 3 depicts 12 long-term sustainability goals developed through extensive community consultation in partnership with the National Capital Commission and the Ville de Gatineau and adopted by Council in 2012.
Immediately below the roof is the Term of Council vision: “Over the next four years, the City of Ottawa will increase the public’s confidence in City government and improve resident, enterprise and visitor satisfaction with City services.”
Underneath the Term of Council vision are three constituent/ stakeholder groups – residents, enterprises and visitors – who are the main focus of the City Strategic Plan.
Along the left wall are the perspectives of the balanced scorecard. The perspectives are intended to be read from the bottom up, illustrating how each perspective builds its success on the one below.
The seven Term of Council Priorities appear in the four lowest levels of the house. Each priority is associated with a series of strategic objectives (e.g. EP1, SE1, GP3, etc.).
Page 3 of 126

Strategy Map of Proposed 2015-2018 Term of Council Priorities
Page 4 of 126
Link to Note 1

Proposed 2015 – 2018 Term of Council Priorities
The proposed Term of Council Priorities are as follows:
· Economic Prosperity (EP): Use Ottawa’s unique combination of recreational, social, cultural and business assets, and natural environment and physical infrastructure to attract enterprises, visitors and new residents, while at the same time developing and retaining local firms and talent.
· Transportation and Mobility (TM): Meet the current and future transportation needs of residents and visitors through Phase 1 and Phase 2 of the Transportation Master Plan, including ensuring the City’s transit services are reliable and financially sustainable. Continued focus on improving mobility during the LRT implementation, and support for alternative transportation methods including cycling and walking, as well as transit.
· Sustainable Environmental Services (ES): To provide sustainable environmental services that balance protection of our natural resources and support the planned growth of the city with the duty to ensure fiscal sustainability and meet legislative requirements in the delivery of municipal services.
· Healthy and Caring Communities (HC): Help all residents and visitors enjoy a good quality of life and a sense of community well-being by providing healthy, safe, secure, accessible and inclusive places and services.
· Service Excellence (SE): Improve client satisfaction with the delivery of municipal services by measurably strengthening the culture of service excellence at the City, by improving the efficiency of City operations and by creating positive client experiences.
· Governance, Planning and Decision-Making (GP): Achieve measurable improvement in residents’ level of trust in how the City is governed and managed, apply a sustainability lens to decision-making, and create a governance model that compares well to best-in-class cities around the world.
· Financial Sustainability (FS): Practice prudent fiscal management of existing resources, and make sound long-term choices that allow City programs and services to be sustainable.
Page 5 of 126

Overview of Proposed 2015-2018 Term of Council Priorities
Page 6 of 126
Priority Strategic Objectives (Lead Dept/SC) Strategic Initiatives Lead Dept SC
Economic Prosperity
EP1 – Promote Ottawa (EDI/FEDC) 1 Ottawa 2017 Celebrations EDI FEDC
EP2 – Support growth of local economy (EDI/FEDC) 2 Renew and Implement Economic Development Strategy
3 ByWard and Parkdale Market/Sparks Street Mall Renewal
EDI
PGM
FEDC
FEDC
Transportation and Mobility
TM1 – Build a world class environmentally sustainable light rail transit system (RIO/TRC)
4 Completion of the O-Train’s Confederation Line Light Rail Transit Projects
5 Light Rail Transit Stage 2 Readiness
RIO
Stage 2 Office
FEDC
FEDC/TRC
TM2 – Provide and promote infrastructure to support safe mobility choices (PGM/TRC)
6 Transportation Master Plan Phase 1 Road Projects (2015-2018)
7 Transportation Master Plan Phase 1 Cycling Projects (2015-2018)
8 Transportation Master Plan Phase 1 Pedestrian Projects (2015-2018)
PGM
PGM
PGM
TRC/ARAC
TRC
TRC
TM3 – Integrate the rapid transit and transit priority network into the community (PGM/TRC)
9 Community Pathways and Connections Program
10 Rideau Street Streetscaping
11 Queen Street Streetscaping
PGM
PGM
RIO
TRC
PC
TRC
TM4 – Improve safety for all road users (PW/TRC)
12 Downtown Ottawa Truck Tunnel Feasibility Study
13 Cycling Safety Improvement Program (CSIP)
14 Winter Improvements for Cyclists
15 Traffic, Pedestrian and Road Safety Enhancements
PGM
PW
PW
PW
TRC
TRC
TRC
TRC/ARAC
TM5 – Ensure reliable and safe transit services (OCT/TC)
16 Making the O-Train’s Confederation Line an integrated part of the OC Transpo system
OCT TC

Page 7 of 126
Priority Strategic Objectives (Lead Dept/SC) Strategic Initiatives Lead Dept SC
Sustainable Environmental Services
ES1 – Support an environmentally sustainable Ottawa (ESD/EC)
17 Combined Sewage Storage Tunnel (CSST)
18 Water Environment Strategy Phase 2
19 Increase Forest Cover
20 Air Quality and Climate Change Management Plan
21 Stormwater Management (SWM) Retrofit Master Plan
22 Renewable Energy Strategy
23 Bayview Yards Environmental and Geotechnical Development Assessment
ISD
ESD
PW
ESD
PGM
ESD
REPDO
EC
EC/ARAC
EC/ARAC
EC
EC/ARAC
EC
FEDC
ES2 – Reduce long-term costs through planned investment and staging of diversion and conservation strategies (PW/EC)
24 Waste Diversion in Parks, Buildings and Grounds Services Operations
25 Energy Management and Investment Strategy (2015-2019)
26 Large Diameter Watermain Program
PW
PW
ESD
EC
EC
EC
Healthy and Caring Communities
HC1 – Advance equity and inclusion for the city’s diverse population (CSS/CPSC)
27 Service Enhancements - Accessibility Barrier Removal Program
28 Creating an Accessible City for All
29 Inclusive Community Initiative
30 Community and Social Services Partnership Capital Funding
ISD
CPBS
CSS
CSS
FEDC
FEDC
CPSC
CPSC

Page 8 of 126
Priority Strategic Objectives (Lead Dept/SC) Strategic Initiatives Lead Dept SC
Healthy and Caring Communities (continued)
HC2 – Revitalize recreation services (PRC/CPSC)
31 Modernization of Recreation Services
32 Revise Parks, Recreation and Cultural Services Facility Allocation Policy
33 Develop a Sport Strategy
34 Recreation Major/Minor Capital Partnership
35 Parks and Recreation Facility Upgrades
36 Community Rinks
37 Targeted Low-income Recreation Subsidies
PRC
PRC
PRC
PRC
PRC
PRC
PRC
CPSC
CPSC
CPSC
CPSC
CPSC
CPSC
CPSC
HC3 – Create new affordable housing options (CSS/CPSC)
38 Ten Year Housing and Homelessness Plan
39 Neighbourhood Revitalization and Redevelopment Program
CSS
PGM
CPSC
PC
HC4 – Support Arts, Heritage, and Culture (PRC/CPSC)
40 Ottawa Art Gallery Expansion and Arts Court Redevelopment
41 Implementation of the Renewed Action Plan for Arts, Heritage and Culture
42 Heritage Reference List
43 Central Library Development*
ISD
PRC
PGM
OPL
FEDC
CPSC
PC
Council
HC5 – Develop a Taxi Strategy (EPS/CPSC) 44 Taxi Regulation Review EPS CPSC
Service Excellence
SE1 – Improve the client experience through established service expectations (SO/FEDC) 45 Client Centric Service Improvement SO FEDC
*The Central Library Development Strategic Initiative will come forward to Council through the Ottawa Public Library Board per existing governance Terms of Reference. The Central Library Development Strategic Initiative definition is: Develop
an inclusive, dynamic Central Library enabling creation and learning. The performance measure for the initiative is: Complete major project milestones for the development of the Central Library identified for this Term of Council: conclusion of RFP and Council approval by Q4 2016; award contract by Q4 2017; and initiate phase 1 of construction by Q1 2018.
Page 9 of 126
Priority Strategic Objectives (Lead Dept/SC) Strategic Initiatives Lead Dept SC
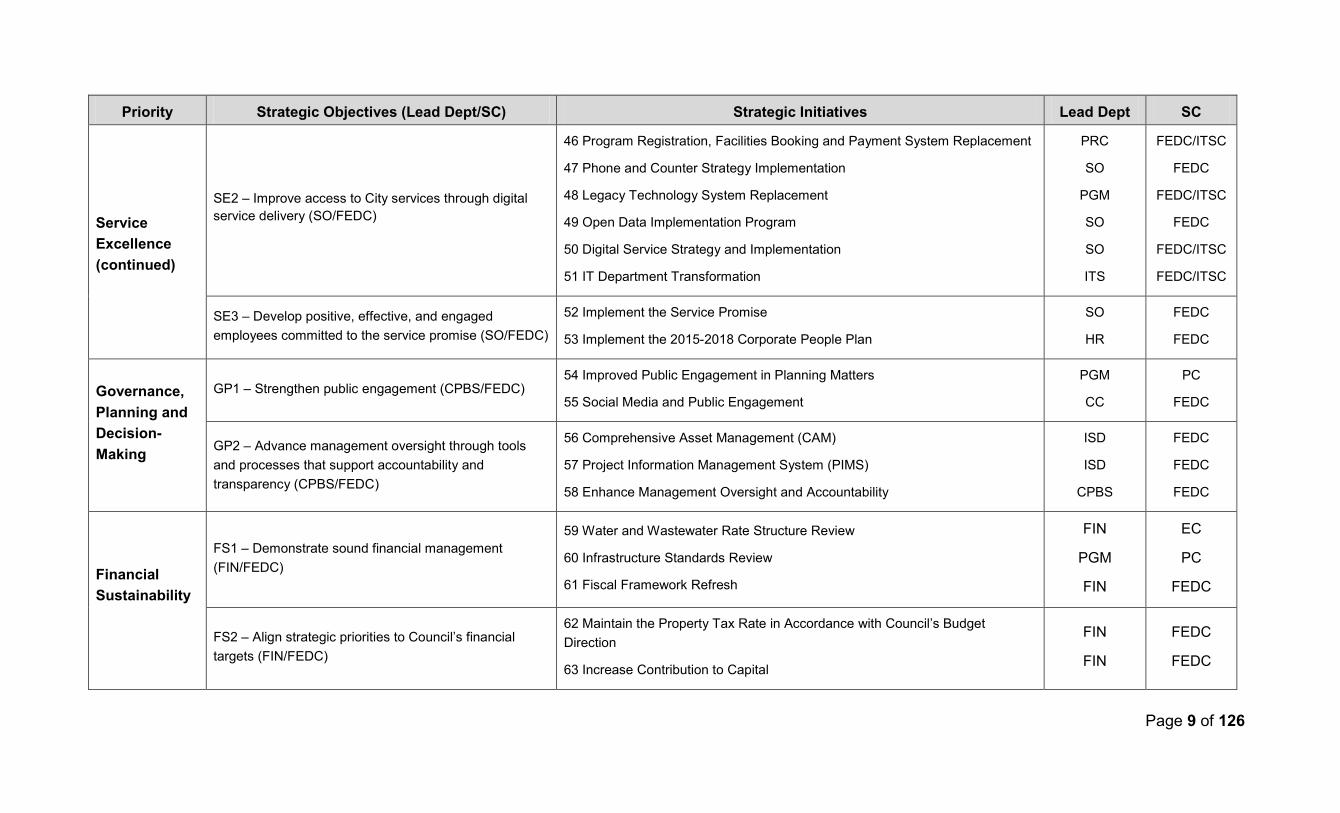
Service Excellence (continued)
SE2 – Improve access to City services through digital service delivery (SO/FEDC)
46 Program Registration, Facilities Booking and Payment System Replacement
47 Phone and Counter Strategy Implementation
48 Legacy Technology System Replacement
49 Open Data Implementation Program
50 Digital Service Strategy and Implementation
51 IT Department Transformation
PRC
SO
PGM
SO
SO
ITS
FEDC/ITSC
FEDC
FEDC/ITSC
FEDC
FEDC/ITSC
FEDC/ITSC
SE3 – Develop positive, effective, and engaged employees committed to the service promise (SO/FEDC)
52 Implement the Service Promise
53 Implement the 2015-2018 Corporate People Plan
SO
HR
FEDC
FEDC
Governance, Planning and Decision-Making
GP1 – Strengthen public engagement (CPBS/FEDC) 54 Improved Public Engagement in Planning Matters
55 Social Media and Public Engagement
PGM
CC
PC
FEDC
GP2 – Advance management oversight through tools and processes that support accountability and transparency (CPBS/FEDC)
56 Comprehensive Asset Management (CAM)
57 Project Information Management System (PIMS)
58 Enhance Management Oversight and Accountability
ISD
ISD
CPBS
FEDC
FEDC
FEDC
Financial Sustainability
FS1 – Demonstrate sound financial management (FIN/FEDC)
59 Water and Wastewater Rate Structure Review
60 Infrastructure Standards Review
61 Fiscal Framework Refresh
FIN
PGM
FIN
EC
PC
FEDC
FS2 – Align strategic priorities to Council’s financial targets (FIN/FEDC)
62 Maintain the Property Tax Rate in Accordance with Council’s Budget Direction
63 Increase Contribution to Capital
FIN
FIN
FEDC
FEDC

Index for Standing Committee/Transit Commission Oversight
The proposed 2015-2018 Term of Council Priorities are presented in the following sections, according to the Standing Committee proposed for oversight of the strategic objectives and strategic initiatives.
Section 1: Finance and Economic Development Committee (FEDC): Pages 12 – 47
Section 2: Information Technology Sub-Committee (ITSC): Pages 48 – 53
Section 3: Agriculture and Rural Affairs Committee (ARAC): Pages 54 – 63
Section 4: Planning Committee (PC): Pages 64 – 77
Section 5: Environment Committee (EC): Pages 78 – 91
Section 6: Transit Commission (TC) : Pages 92 – 97
Section 7: Community and Protective Services Committee (CPSC): Pages 98 – 111
Section 8: Transportation Committee (TRC): Pages 112 – 125
Page 10 of 126

Page 11 of 126

Section 1: Finance and Economic Development Committee (FEDC) pages 12 to 47
Page 12 of 126

Page 13 of 126

Section 1: Finance and Economic Development Committee (FEDC) The material in this section outlines the proposed strategic objectives and associated performance measures followed by the associated strategic initiatives. Where a Standing Committee or the Transit Commission is proposed to have oversight over a strategic initiative but not its associated strategic objective, this strategic objective and its associated performance measure(s) is provided for ease of reference.
Strategic Priority – Economic Prosperity (EP)
FEDC Oversight over both Strategic Objectives and the three Strategic Initiatives under this Priority
Strategic Objective: EP1 – Promote Ottawa
Promote Ottawa as a key destination for tourism, major culture and sporting events, business investment, and entrepreneurship and innovation.
Lead Department: EDI
SC Oversight: FEDC
Strategic Objective Performance Measure(s)
EP1-A: Maintain an average hotel occupancy rate of 65%, every six months from 2015 to 2018.
EP1-B: Increase the number of major events won by the City to 5 per year.
EP1-C: Attract and engage with 20 inbound trade delegations, each year from 2015 to 2018.
Page 14 of 126

Strategic Initiatives with Performance Measures
Page 15 of 126
Strategic Objective and Initiative Lead Dept. SC Oversight Performance Measure(s):
EP1 – Promote Ottawa
1 – Ottawa 2017 Celebrations
Canada will celebrate its 150th anniversary in 2017. This year provides a unique occasion to promote Ottawa not only as a great tourist destination, but also as an important global business hub. It is a chance to direct City efforts to increase tourism and economic development opportunities leading up to and beyond 2017 by globally showcasing the best of Ottawa and building a brand to carry forward. During the Ottawa 2017 celebrations ward-based activities will occur with several major events and activities including planting Canadian Native Maple trees in special locations and/or sesquicentennial groves in each of the city’s 23 wards.
EDI FEDC
1-A: Secure 100% of external funding ($20 million) by Q4 2015.
1-B: Produce, co-produce, or facilitate a minimum of 10 new major offerings for Ottawa 2017.
1-C: Implement a minimum of 2 Ottawa 2017 events in each ward, by Q4 2017.
1-D: Deploy a pageantry program in a minimum of 200 businesses and/or public venues by Q1 2016.

Strategic Objective: EP2 – Support growth of local economy
Support the growth of the local economy by ensuring that businesses and entrepreneurs have the access to economic development programs, services, tools, and infrastructure that encourage and facilitate business start-up, expansion and job creation. Lead Department: EDI SC Oversight: FEDC
Strategic Objective Performance Measure(s) EP2-A: Communicate with 50 businesses to discuss the City's economic development programs and services, every six months from 2015 to 2018. EP2-B: Enroll 3 companies in the Technology Pilot Program every year from 2016 to 2018.
Strategic Initiatives with Performance Measures
Page 16 of 126
Strategic Objective and Initiative Lead Dept. SC Oversight Performance Measure(s):
EP2 – Support growth of local economy
2 – Renew and Implement Economic Development Strategy
Update the City’s Economic Development Strategy so that economic development programs and initiatives build on the successes of the previous strategy and continues to align with current economic trends and opportunities. Initiatives within the strategy will include increased support for Invest Ottawa, Events Ottawa, and Business Improvement Areas, as well as Talent Attraction, an Innovation Pilot Program and the development of a House of Sport.
EDI FEDC
2-A: Implement 25% of the Economic Development Strategy each year from 2015 to 2018.
2-B: Lease 50% of Innovation Centre space by Q3 2015 and lease remaining 50% of space by Q3 2016.
2-C: Implement 80% of the initiatives identified in Invest Ottawa’s annual operating plan (2015-2018).
2-D: Complete 100% of the following activities annually throughout the term of Council:
· Provide the Ottawa Council of Business Improvement Areas (OCOBIA) with a quarterly summary of joint activities, support and consultation
· Participate in regular outcome-oriented joint meetings involving OCOBIA and required City staff
· Conduct an annual partnership satisfaction review of BIAs.

Page 17 of 126
Strategic Objective and Initiative Lead Dept. SC Oversight Performance Measure(s):
EP2 – Support growth of local economy
3 – ByWard and Parkdale Market / Sparks Street Mall Renewal
This initiative is designed to fulfill the Council-approved revitalization vision for the future of the ByWard and Parkdale Markets as well as the governance review of the Sparks Street Business Improvement Area (BIA) and Mall Authority (MA). It will lead to a new governance structure created for the ByWard Market and Parkdale Market areas with a strong mandate to act in an entrepreneurial manner. The project will include a concept plan for future investments in infrastructure improvements including the ByWard Market Building, investments in low-cost streetscaping solutions that will allow the City to take advantage of place making opportunities in the short and long term, and address concerns that the zoning regulations for bars and nightclubs are not being followed in the area. The governance review of the Sparks Street BIA and MA will ensure that the powers and duties of the BIA and Mall Authority align with Council’s intention for these boards as well as aim to ensure that the current and future needs of Sparks Street are addressed.
PGM FEDC
3-A: Implement 100% of the Council directed governance model for ByWard and Parkdale Market by Q1 2017.
3-B: Implement 100% of the Council directed governance model for the Sparks Street Mall by Q4 2015.

Strategic Initiatives – Specific Needs per Project ($000s).
Legend: WIP = Work in Progress, C = Capital, O = Operating, FTEs (P) = Full Time Employees (Permanent), CB = Already reported in capital budget,
R = Source of funding is the Rate Budget, DC = Development charges not included
Page 18 of 126
Strategic Initiative Lead Dept.
SC Oversight
2014 Existing WIP (C)
($000s)
2015 (C)
($000s)
2016 (C)
($000s)
2017 (C)
($000s)
2018
(C) ($000s)
2014 Base
Funding
($000s)
2015
(O) ($000s)
2016
(O) ($000s)
2017
(O) ($000s)
2018
(O) ($000s)
FTEs (P)
1 – Ottawa 2017 Celebrations
EDI FEDC 200 1,600 2,000 2,345 0
2 – Renew and Implement Economic Development Strategy
EDI FEDC 500 2,500 3,970 3,570 3,570 3,570
3 – ByWard and Parkdale Market / Sparks Street Mall Renewal
PGM FEDC 150 350 0 0 500 0 0

Strategic Priority – Transportation and Mobility (TM)
FEDC Oversight over the two Strategic Initiatives under this Priority, under Objective TM1 (Oversight TRC)
Strategic Objective: TM1 – Build a world class environmentally sustainable light rail transit system
Implement a financially, operationally and environmentally sustainable light rail transit system that efficiently connects all areas of the city in 2018 and beyond.
Lead Department: RIO
SC Oversight: TRC
Strategic Objective Performance Measure(s)
TM1-A: Implement 100% of the initiatives required to prepare the City for the O-Train’s Confederation Line by May 2018 and Stage 2 readiness.
Strategic Initiatives with Performance Measures
Page 19 of 126
Strategic Objective and Initiative Lead Dept. SC Oversight Performance Measure(s):
TM1 – Build a world class environmentally sustainable light rail transit system
4 - Completion of the O-Train’s Confederation Line Light Rail Transit Projects
Completion of Phase 1 of the Confederation Line projects.
RIO FEDC
4-A: Complete 100% of Stage One of the Confederation Line project by May 2018.

Page 20 of 126
Strategic Objective and Initiative Lead Dept. SC Oversight Performance Measure(s):
TM1 – Build a world class environmentally sustainable light rail transit system
5 – Light Rail Transit Stage 2 Readiness
Complete Environmental Assessments for Stage 2 Light Rail Transit (LRT) and stewarding the Federal and Provincial application process. The Environmental Assessments include: Western Corridor LRT (Tunney's Pasture to Baseline), West LRT Extension (Lincoln Fields to Bayshore), O-Train’s Trillium Line extension to Riverside South, and the East LRT from Blair Station to Trim Road. This will support the need as identified in the Transportation Master Plan approved by Council in November of 2013.
Stage 2 Office
FEDC / TRC
5-A: Progress toward completion of three Environmental Assessments to 70% by end of 2015 and 100% by Q3 2016.

Strategic Initiatives – Specific Needs per Project ($000s).
Legend: WIP = Work in Progress, C = Capital, O = Operating, FTEs (P) = Full Time Employees (Permanent), CB = Already reported in capital budget,
R = Source of funding is the Rate Budget, DC = Development charges not included
Page 21 of 126
Strategic Initiative Lead Dept.
SC Oversight
2014 Existing WIP (C)
($000s)
2015 (C)
($000s)
2016 (C)
($000s)
2017 (C)
($000s)
2018
(C)
($000s)
2014 Base
Funding
($000s)
2015 (O)
($000s)
2016 (O)
($000s)
2017 (O)
($000s)
2018 (O)
($000s)
FTEs (P)
4 – Completion of the O-Train’s Confederation Line Light Rail Transit Projects
RIO FEDC 1,734
5 – Light Rail Transit Stage 2 Readiness
Stage 2
Office
FEDC / TRC
3,275 1,000
CB 4,000
CB 51,000
CB 201,000 CB 872 200 200 200 200

Strategic Priority – Sustainable Environmental Services (ES)
FEDC Oversight over one Strategic Initiative under this Priority, under Objective ES1 (Oversight EC)
Strategic Objective: ES1 – Support an environmentally sustainable Ottawa
Implement priority projects that protect property, land, air and water for city residents.
Lead Department: ESD
SC Oversight: EC
Strategic Objective Performance Measure(s)
ES1-A: Maintain the number of Water Quality Index good to excellent ratings annually at 75% of monitored locations on Ottawa’s major rivers. (Ottawa, Rideau and Mississippi).
ES1-B: No net increase in corporate per capita Greenhouse Gas (GHG) emissions between 2012 and 2016.
ES1-C: Maintain a 2:1 ratio (or greater) between trees planted and trees removed annually.
Page 22 of 126

Strategic Initiatives with Performance Measures
Page 23 of 126
Strategic Objective and Initiative Lead Dept. SC Oversight Performance Measure(s):
ES1 – Support an environmentally sustainable Ottawa
23 – Bayview Yards Environmental and Geotechnical Development Assessment
A Geotechnical Investigation and Phase II Environmental Assessment are required to be undertaken for the development concept for the Bayview Station Community Design Plan (CDP) which will identify whether amendments to the current Bayview CDP are required to facilitate development on this key City-owned site adjacent to the Bayview LRT Station at the intersection of the Confederation and Trillium Transit Lines.
REPDO FEDC
23-A: Complete 100% of the project by Q4 2018.

Strategic Initiatives – Specific Needs per Project ($000s).
Legend: WIP = Work in Progress, C = Capital, O = Operating, FTEs (P) = Full Time Employees (Permanent), CB = Already reported in capital budget,
R = Source of funding is the Rate Budget, DC = Development charges not included
Page 24 of 126
Strategic Initiative Lead Dept.
SC Oversight
2014 Existing WIP (C)
($000s)
2015
(C) ($000s)
2016
(C) ($000s)
2017
(C) ($000s)
2018
(C) ($000s)
2014 Base Funding ($000s)
2015 (O)
($000s)
2016
(O) ($000s)
2017 (O)
($000s)
2018 (O)
($000s)
FTEs (P)
23 – Bayview Yards Environmental and Geotechnical Development Assessment
REPDO FEDC 400 400 400 400

Strategic Priority – Healthy and Caring Communities (HC)
FEDC Oversight over three Strategic Initiatives total under this Priority
Two Strategic Initiatives under Objective HC1 (Oversight CPSC)
Strategic Objective: HC1 – Advance equity and inclusion for the city’s diverse population
Advance equity and inclusion for the city’s diverse population by effectively planning and implementing changes to infrastructure development and service delivery.
Lead Department: CSS
SC Oversight: CPSC
Strategic Objective Performance Measure(s)
HC1-A: Increase the percentage of employees (starting in 2016) who are advancing equity and inclusion in their work in the categories specified in the Equity and Inclusion Lens, by 5% each year by the end of 2018. The baseline for the percentage of employees will be developed in 2015.
Page 25 of 126

Strategic Initiatives with Performance Measures
Page 26 of 126
Strategic Objective and Initiative Lead Dept. SC Oversight Performance Measure(s):
HC1 – Advance equity and inclusion for the city’s diverse population
27 – Service Enhancements - Accessibility Barrier Removal Program
This initiative will reduce the number of accessibility barriers making the City’s built environment more accessible each year. It will also improve the ability to communicate with the public regarding the level of accessibility at the various City’s facilities.
ISD FEDC
27-A: Develop a Facility Accessibility Rating Framework to inform the public of the level of facility accessibility. Complete 50% of the framework by Q4 2015 and 100% by Q4 2016.
27-B: Complete delivery of the annual Accessibility Barrier Removal Program for existing buildings, parks, and barrier removals by 15% in Q4 2015, 50% in Q4 2016, 75% in Q4 2017, and 100% in Q4 2018.

Page 27 of 126
Strategic Objective and Initiative Lead Dept. SC Oversight Performance Measure(s):
HC1 – Advance equity and inclusion for the city’s diverse population
28 – Creating an Accessible City for All
Working within the Provincial legislation, this initiative ensures the City complies with and maintains existing Accessibility For Ontarian's with Disability Act (AODA) requirements and new legislated requirements in the areas of the built environment, access to web information, and employment in addition to identified non-legislated initiatives. CPBS FEDC
28-A: Deliver Web Content Accessibility Guidelines (WCAG) Compliance training to 100% of staff identified by Q4 2015; Deliver Accessible Office suite documents training to 100% of staff identified by the end of Q1 2016.
28-B: Audit 10% of new PDF documents posted on a City of Ottawa website in 2015; Audit 10% in 2016; Audit 15% in 2017; Audit 15% in 2018.
28-C: Maintain 80% compliance to the accessible design standards for annual construction purchase order reviews in SAP.
28-D: Implement one communications strategy per year focused on increasing manager awareness of the accommodations available to candidates and employees with disabilities.

FEDC Oversight over one Strategic Initiative under Objective HC4 (Oversight CPSC)
Strategic Objective: HC4 – Support Arts, Heritage, and Culture
Support local arts, heritage and culture by completing the Ottawa Art Gallery Expansion and Arts Court Redevelopment project, identifying and preserving Ottawa’s distinct heritage resources, and through funding to cultural facility community partners.
Lead Department: PRC
SC Oversight: CPSC
Strategic Objective Performance Measure(s)
HC4-A: Implement the milestones listed below.
· Complete the Arts Court redevelopment by Q1 2018 · Complete development of new Heritage Reference List with online accessibility by end of 2018 · Achieve 80% of recommended cultural facility operating funding (Renewed Action Plan for Arts, Heritage and Culture) by end of 2018, and 33% of
community cultural facility capital funding by end of 2018.
Page 28 of 126

Strategic Initiatives with Performance Measures
Page 29 of 126
Strategic Objective and Initiative Lead Dept. SC Oversight Performance Measure(s):
HC4 – Support Arts, Heritage, and Culture
40 – Ottawa Art Gallery Expansion and Arts Court Redevelopment
Expansion and redevelopment are required to meet the needs of the Ottawa Art Gallery (OAG) and Arts Court, Ottawa's centre for local arts organizations, whose programming has become severely restricted due to limited and inaccessible space, and the age and condition of the heritage building in which it is housed.
ISD FEDC
40-A: Complete the Ottawa Art Gallery (OAG) expansion and Arts Court redevelopment by 25% in Q4 2015, 50% in Q4 2016 and 100% in Q1 2018.

Strategic Initiatives – Specific Needs per Project ($000s)
Legend: WIP = Work in Progress, C = Capital, O = Operating, FTEs (P) = Full Time Employees (Permanent), CB = Already reported in capital budget,
R = Source of funding is the Rate Budget, DC = Development charges not included
Page 30 of 126
Strategic Initiative Lead Dept.
SC Oversight
2014 Existing WIP (C)
($000s)
2015 (C)
($000s)
2016 (C)
($000s)
2017 (C)
($000s)
2018 (C)
($000s)
2014 Base
Funding
($000s)
2015 (O)
($000s)
2016 (O)
($000s)
2017 (O)
($000s)
2018 (O)
($000s)
FTEs (P)
27 – Service Enhancements - Accessibility Barrier Removal Program
ISD FEDC 2,000 2,500 3,000 3,500
28 – Creating an Accessible City for All
CPBS FEDC 100 0 0 0 100 100 100 100 1
40 – Ottawa Art Gallery Expansion and Arts Court Redevelopment
ISD FEDC 1,600 1,600 1,600 2,135 2,135

Strategic Priority – Service Excellence (SE)
FEDC Oversight over the three Strategic Objectives and the nine Strategic Initiatives under this Priority
Strategic Objective: SE1 – Improve the client experience through established service expectations
Continuously improve the client experience by establishing, communicating and measuring the achievement of service expectations.
Lead Department: SO
SC Oversight: FEDC
Strategic Objective Performance Measure(s)
SE1-A: 100% of departments are reporting on a standardized corporate client experience measurement framework that focuses on improving the client experience with City services by Q4 2018.
Strategic Initiatives with Performance Measures
Page 31 of 126
Strategic Objective and Initiative Lead Dept. SC Oversight Performance Measure(s):
SE1 – Improve the client experience through established service expectations
45 – Client Centric Service Improvement
Continuously improve the client experience by establishing, communicating and measuring the achievement of service expectations.
SO FEDC
45-A: Improvement in the overall quality assurance rating of the client experience (reliability/responsive/caring) in the three areas of focus by Q4 2018.

Strategic Objective: SE2 – Improve access to City services through digital service delivery
Improve access to City services, and efficiency and effectiveness of delivery, by transforming the organization’s processes and technologies to meet the increasing client demand for digital service delivery (e.g., online, mobile, social media, etc.).
Lead Department: SO
SC Oversight: FEDC
Strategic Objective Performance Measure(s)
SE2-A: Increase in the number of transactions on the web each year from 2015 to 2018.
Strategic Initiatives with Performance Measures
Page 32 of 126
Strategic Objective and Initiative Lead Dept. SC Oversight Performance Measure(s):
SE2 – Improve access to City services through digital service delivery
46 – Program Registration, Facilities Booking and Payment System Replacement
The CLASS booking registration system is approaching end-of-life and the vendor is moving to a new web-based product. The move will shift maintenance, responsibility, cost, and risk for PCI compliance to the vendor plus enhance service to residents.
PRC FEDC/ITSC
46-A: Complete 100% assessment and documentation of the end-to-end business needs in support of a common registration, booking and payment experience for City programs and services by Q2 2016.
46-B: Complete 100% procurement of a new registration, booking and payment solution with an executed vendor contract by Q2 2018.

Page 33 of 126
Strategic Objective and Initiative Lead Dept. SC Oversight Performance Measure(s):
SE2 – Improve access to City services through digital service delivery
47 – Phone and Counter Strategy Implementation
The Phone and Counter Strategy Implementation project will implement the enterprise phone and counter strategy (development currently in progress) to optimize the client experience and make more efficient use of client resources to realize cost savings through a tiered service model.
SO FEDC
47-A: Complete 100% of the business case by the end of 2015.
47-B: 100% of the Phone & Counter Strategy implemented, based on the approved business case timeline.
SE2 – Improve access to City services through digital service delivery
48 – Legacy Technology System Replacement
To implement a new technology solution that will replace the use of the legacy MAP system specifically for processing PGM planning applications, construction and related permits, encroachment permits, mobile and enforcement applications and Committee of Adjustment applications.
PGM FEDC/ITSC
48-A: Number of application types available on line.
48-B: Number of self-serve application submissions.

Page 34 of 126
Strategic Objective and Initiative Lead Dept. SC Oversight Performance Measure(s):
SE2 – Improve access to City services through digital service delivery
49 – Open Data Implementation Program
Continue to expand Ottawa's data sharing program.
SO FEDC
49-A: Increase the percentage of open data sets available to the public by 10% annually during this Term of Council.
SE2 –Improve access to City services through digital service delivery
50 – Digital Service Strategy and Implementation
The Digital Service Strategy and Implementation will articulate the long term digital service vision for the City; define the steps to achieve it; and begin implementing priorities to improve the client experience when accessing City services.
SO FEDC/ITSC
50-A: Develop 100% of the Strategy (including public consultation) by Q1 2016.
50-B: Implement 100% of the projects identified and approved by Council for implementation within this Term of Council in support of the Digital Strategy by Q4 2018.
SE2 – Improve access to City services through digital service delivery
51 – IT Department Transformation
Transform the role of IT to become a core support and strategic enabler of service transformation based on the service excellence plan.
ITS FEDC/ITSC
51-A: Develop and implement 100% of the IT Department Transformation in a staged delivery with all the components implemented by the end of 2018.
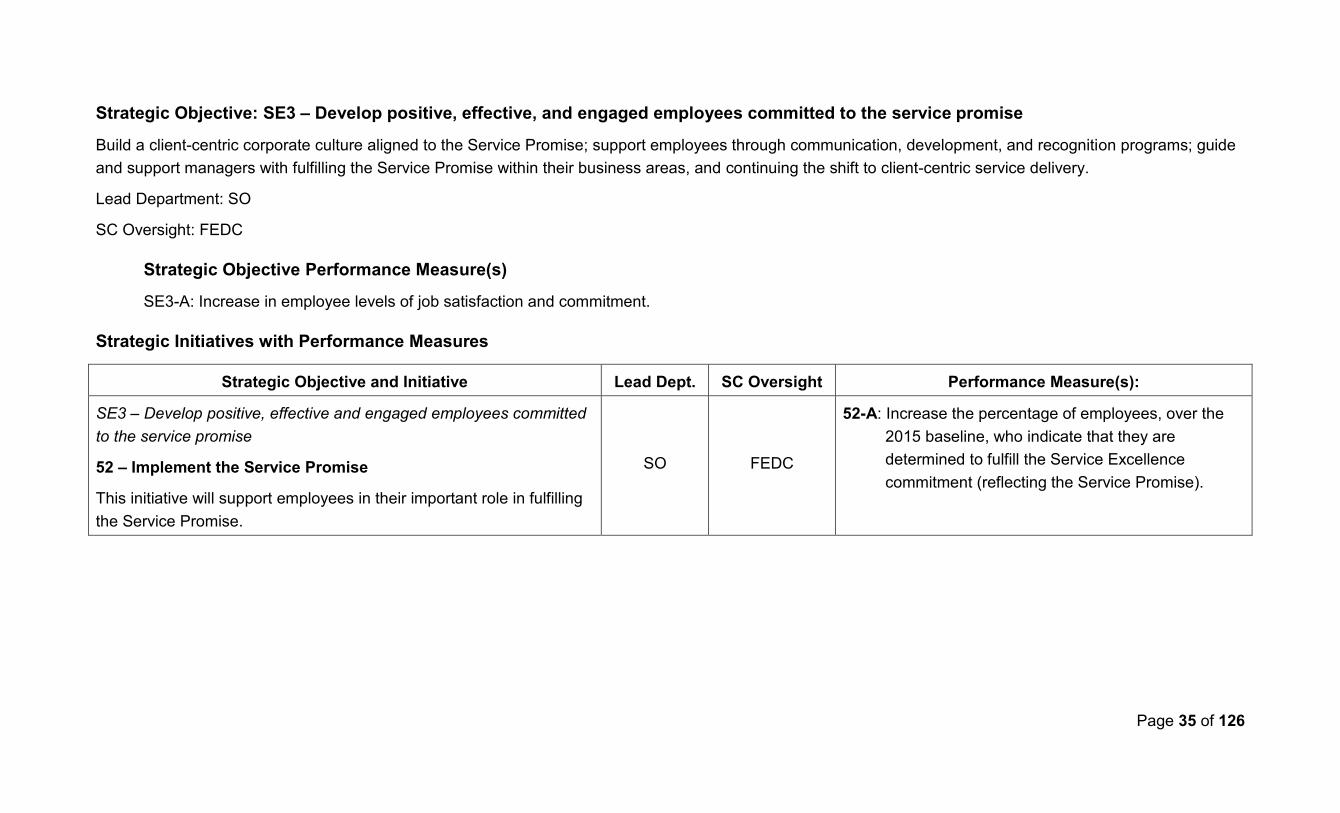
Strategic Objective: SE3 – Develop positive, effective, and engaged employees committed to the service promise
Build a client-centric corporate culture aligned to the Service Promise; support employees through communication, development, and recognition programs; guide and support managers with fulfilling the Service Promise within their business areas, and continuing the shift to client-centric service delivery.
Lead Department: SO
SC Oversight: FEDC
Strategic Objective Performance Measure(s)
SE3-A: Increase in employee levels of job satisfaction and commitment.
Strategic Initiatives with Performance Measures
Page 35 of 126
Strategic Objective and Initiative Lead Dept. SC Oversight Performance Measure(s):
SE3 – Develop positive, effective and engaged employees committed to the service promise
52 – Implement the Service Promise
This initiative will support employees in their important role in fulfilling the Service Promise.
SO FEDC
52-A: Increase the percentage of employees, over the 2015 baseline, who indicate that they are determined to fulfill the Service Excellence commitment (reflecting the Service Promise).

Page 36 of 126
Strategic Objective and Initiative Lead Dept. SC Oversight Performance Measure(s):
SE3 – Develop positive, effective and engaged employees committed to the service promise
53 – Implement the 2015-2018 Corporate People Plan
The Corporate People Plan is a 4-year corporate-wide strategy and action plan, which aligns our people strategies with the corporation's vision and long-term business strategies. The People Plan is a roadmap that guides human resources decisions and investments. This strategic initiative will focus specifically on the following components of the Corporate People Plan: maintaining an up-to-date leadership succession plan and increasing the readiness of the successor pool; updating Corporate/Departmental Diversity Plans to advance the diversity of the workforce and create a respectful, inclusive workplace; creating a roadmap to improve workplace psychological wellbeing; and, enhancing the Performance Development Program to enable expectation/goal setting, ongoing timely feedback, and tracking of completed performance reviews.
HR FEDC
53-A: Increase the proportion of critical positions with successors who are ready within one year to 50% by Q4 2015, 55% by Q4 2016, 60% by Q4 2017 and 65% by Q4 2018.
53-B: Increase the workforce representation of the four diversity groups relative to their availability in the labour market, in accordance with the following targets: · Visible Minorities: Increase by 3% during 2015 to
2018 (from 7% to 10%) · Aboriginal Peoples: Increase by 0.5% during 2015
to 2018 (from 1.5% to 2%) · People with disabilities: Increase by 1% during
2015 to 2018 (from 2.34% to 3.34%) · Women: Maintain overall representation equal to
market availability 53-C: Advance the development of the Psychologically
Healthy Workplace Roadmap, 25% by Q2 2015, and 100% by Q4 2015.
53-D: Total number of in scope employees that have an ICA completed using the on-line PDP tool targeting 80% by Q4 2017 excluding employees on an 18-month performance cycle (roll out of ICA online starts in Q2 2015 through to Q4 2016).

Strategic Initiatives – Specific Needs per Project ($000s)
Legend: WIP = Work in Progress, C = Capital, O = Operating, FTEs (P) = Full Time Employees (Permanent), CB = Already reported in capital budget,
R = Source of funding is the Rate Budget, DC = Development charges not included
Page 37 of 126
Strategic Initiative Lead Dept.
SC Oversight
2014 Existing WIP (C)
($000s)
2015 (C)
($000s)
2016 (C)
($000s)
2017 (C)
($000s)
2018 (C)
($000s)
2014 Base
Funding
($000s)
2015 (O)
($000s)
2016 (O)
($000s)
2017 (O)
($000s)
2018 (O)
($000s)
FTEs (P)
45 – Client Centric Service Improvement
SO FEDC
46 – Program Registration, Facilities Booking and Payment System Replacement
PRC FEDC/ITSC 730 1,300 1,300 1,870 1,870
47 – Phone and Counter Strategy Implementation
SO FEDC 0 800 800 800
48 – Legacy Technology System Replacement
PGM FEDC/ITSC 930 0 0 1,400 1,400

Page 38 of 126
Strategic Initiative Lead Dept.
SC Oversight
2014 Existing WIP (C)
($000s)
2015 (C)
($000s)
2016 (C)
($000s)
2017 (C)
($000s)
2018 (C)
($000s)
2014 Base
Funding
($000s)
2015 (O)
($000s)
2016 (O)
($000s)
2017 (O)
($000s)
2018 (O)
($000s)
FTEs (P)
49 – Open Data Implementation Program
SO FEDC 87 87 87 87 87
50 – Digital Service Strategy and Implementation
SO FEDC/ITSC 400 400 400
51 – IT Department Transformation
ITS FEDC/ITSC
52 – Implement the Service Promise
SO FEDC
53 – Implement the 2015-2018 Corporate People Plan
HR FEDC 800 800 800 800 800

Strategic Priority – Governance, Planning and Decision-Making (GP)
FEDC Oversight over both Strategic Objectives and four Strategic Initiatives under this Priority
Strategic Objective: GP1 – Strengthen public engagement
Ensure business practices are democratic, engaging, and visible by encouraging citizens to participate in decision-making and community life through public engagement opportunities.
Lead Department: CPBS
SC Oversight: FEDC
Strategic Objective Performance Measure(s)
GP1-A: Increase the number of participants in Corporate public engagement activities annually.
Strategic Initiatives with Performance Measures
Page 39 of 126
Strategic Objective and Initiative Lead Dept. SC Oversight Performance Measure(s):
GP1 – Strengthen public engagement
55 – Social Media and Public Engagement
Within the context of a global shift to accessing information online, the City of Ottawa will continue to harness technology by communicating directly with residents through social media channels. Specifically, social media will be used to promote public engagement opportunities to encourage citizens to participate in decision-making and community life.
CC FEDC
55-A: Increase use of social media to promote public engagement activities.

Strategic Objective: GP2 – Advance management oversight through tools and processes that support accountability and transparency
Continued implementation of new tools and practices for project management, business cases, procurement, and contract management oversight.
Lead Department: CPBS
SC Oversight: FEDC
Strategic Objective Performance Measure(s)
GP2-A: Evaluate 100% of applicable construction and consultant contracts per year. GP2-B: Train 100 project managers in the use of the Project Management framework per year.
Strategic Initiatives with Performance Measures
Page 40 of 126
Strategic Objective and Initiative Lead Dept. SC Oversight Performance Measure(s):
GP2 – Advance management oversight through tools and processes that support accountability and transparency
56 – Comprehensive Asset Management (CAM)
Building on the CAM Program accomplishments to date, this initiative will focus on improving infrastructure asset planning and decision-making processes that will support efficient and effective delivery of services.
ISD FEDC
56-A: Complete service-based asset management plans (20 in total) by end of Q4 2018.
56-B: Implement the Capital Investment Prioritization and Project Value Assessment processes by end of Q3 2015.
56-C: Develop an Integrated Asset Planning Framework by end of Q1 2016.

Page 41 of 126
Strategic Objective and Initiative Lead Dept. SC Oversight Performance Measure(s):
GP2 – Advance management oversight through tools and processes that support accountability and transparency
57 – Project Information Management System (PIMS)
The implementation of the Project Information Management System (PIMS) will enhance capital project delivery, monitoring and reporting.
ISD FEDC
57-A: Implement 100% of Project Information Management Systems (PIMS) project milestones by end of Q1 2017.
GP2 – Advance management oversight through tools and processes that support accountability and transparency
58 – Enhance Management Oversight and Accountability
Advance management oversight and accountability through four key projects that will: improve procurement and contract management practices; introduce enhanced standards for tracking and reporting complaints; enhance and ensure compliance with project management and business case practices; and, improve management accountability reporting.
Projects under this SI:
1. Vendor Performance Management (VPM).
2. Enhanced Regulatory Complaints.
3. Project Management and Business Case.
4. Management Accountability Reporting.
CPBS FEDC
58-A: Implement 100% of the project milestones within this initiative by Q4 2016: · Review of Phase 1 of VPM by Q1 2016. · Achieve the service standard for
acknowledgement of complaints within 3 business days a minimum of 85% of the time.
· Train 100% of designated project leads on the Corporate Business Case methodology by the end of Q4 2015.
· Complete a review of changes in Management Accountability Reporting by Q4 2016.

Strategic Initiatives – Specific Needs per Project ($000s)
Legend: WIP = Work in Progress, C = Capital, O = Operating, FTEs (P) = Full Time Employees (Permanent), CB = Already reported in capital budget,
R = Source of funding is the Rate Budget, DC = Development charges not included
Page 42 of 126
Strategic Initiative Lead Dept.
SC Oversight
2014 Existing WIP (C)
($000s)
2015 (C)
($000s)
2016 (C)
($000s)
2017 (C)
($000s)
2018 (C)
($000s)
2014 Base
Funding
($000s)
2015 (O)
($000s)
2016 (O)
($000s)
2017 (O)
($000s)
2018 (O) ($000s)
FTEs (P)
55 – Social Media and Public Engagement
CC FEDC 77 77 77 77 77 1
56 – Comprehensive Asset Management (CAM)
ISD FEDC 408 50 100 50 0
57 – Project Information Management System (PIMS)
ISD FEDC 1,440 0 0 0 0
58 – Enhance Management Oversight and Accountability
CPBS FEDC

Strategic Priority – Financial Sustainability (FS)
FEDC Oversight over both Strategic Objectives and three Strategic Initiatives under this Priority
Strategic Objective: FS1 – Demonstrate sound financial management
Ensure long-range planning directs the spending of tax payers’ dollars.
Lead Department: FIN
SC Oversight: FEDC
Strategic Objective Performance Measure(s)
FS1-A: Complete update of the Long-Range Financial Plans within the Term of Council.
FS1-B: Maintain established level of liquidity quarterly.
FS1-C: Maintain the percentage of overall surplus or deficit compared to total operating expenditure budget at 0, annually.
Strategic Initiatives with Performance Measures
Page 43 of 126
Strategic Objective and Initiative Lead Dept. SC Oversight Performance Measure(s):
FS1 – Demonstrate sound financial management
61 – Fiscal Framework Refresh
Review and update of the City's 2007 Fiscal Framework. The update aligns the Framework to the updated Long-Range Financial Plan and will include the development of measures of financial condition and performance for the municipality with the objective to enhance financial sustainability.
FIN FEDC
61-A: Complete 100% of the Fiscal Framework Update by Q4 2016.

Strategic Objective: FS2 – Align strategic priorities to Council’s financial targets
Maintain stable and predictable property tax levels while implementing Council's strategic priorities.
Lead Department: FIN
SC Oversight: FEDC
Strategic Objective Performance Measure(s)
FS2-A: Adopt annual budgets that meet targets set by Council.
FS2-B: Maintain annually tax supported debt service costs within the limit approved by Council as part of the Long Range Financial Plan (LRFP).
FS2-C: Maintain annually rate support debt service costs within the limit approved by Council as part of the Long Range Financial Plan (LRFP).
Strategic Initiatives with Performance Measures
Page 44 of 126
Strategic Objective and Initiative Lead Dept. SC Oversight Performance Measure(s):
FS2 – Align strategic priorities to Council’s financial targets
62 – Maintain the Property Tax Rate in Accordance with Council’s Budget Direction
Maintain stable and predictable tax rates that are affordable to residents and allow the City to address strategic priorities.
FIN FEDC
62-A: Tax rate Increase.

Page 45 of 126
Strategic Objective and Initiative Lead Dept. SC Oversight Performance Measure(s):
FS2 – Align strategic priorities to Council’s financial targets
63 – Increase Contribution to Capital
To implement a strategy to address the asset renewal funding gap identified in the Long Range Financial Plan IV in order to maintain the City’s assets in a good state of repair.
FIN FEDC
63-A: Capital Funding increase.

Strategic Initiatives – Specific Needs per Project ($000s)
Legend: WIP = Work in Progress, C = Capital, O = Operating, FTEs (P) = Full Time Employees (Permanent), CB = Already reported in capital budget,
R = Source of funding is the Rate Budget, DC = Development charges not included
Page 46 of 126
Strategic Initiative Lead Dept.
SC Oversight
2014 Existing WIP (C)
($000s)
2015 (C)
($000s)
2016 (C)
($000s)
2017 (C)
($000s)
2018 (C)
($000s)
2014 Base
Funding
($000s)
2015 (O)
($000s)
2016 (O)
($000s)
2017 (O)
($000s)
2018 (O)
($000s)
FTEs (P)
61 – Fiscal Framework Refresh
FIN FEDC
62 – Maintain the Property Tax Rate in Accordance with Council’s Budget Direction
FIN FEDC
63 – Increase Contribution to Capital
FIN FEDC 0 0 3,590 11,025

Page 47 of 126

Section 2: Information Technology Sub-Committee (ITSC) pages 48 to 53
Page 48 of 126

Page 49 of 126

Section 2: Information Technology Sub-Committee (ITSC) The material in this section outlines the proposed strategic objectives and associated performance measures followed by the associated strategic initiatives. Where a Standing Committee or the Transit Commission is proposed to have oversight over a strategic initiative but not its associated strategic objective, this strategic objective and its associated performance measure(s) is provided for ease of reference.
Strategic Priority – Service Excellence (SE)
ITSC Oversight shared with FEDC over four Strategic Initiatives under this Priority under Objective SE2 (Oversight FEDC)
Strategic Objective: SE2 – Improve access to City services through digital service delivery
Improve access to City services, and efficiency and effectiveness of delivery, by transforming the organization’s processes and technologies to meet the increasing client demand for digital service delivery (e.g., online, mobile, social media, etc.).
Lead Department: SO
SC Oversight: FEDC
Strategic Objective Performance Measure(s)
SE2-A: Increase in the number of transactions on the web each year from 2015 to 2018.
Page 50 of 126

Strategic Initiatives with Performance Measures
Page 51 of 126
Strategic Objective and Initiative Lead Dept. SC Oversight Performance Measure(s):
SE2 – Improve access to City services through digital service delivery
46 – Program Registration, Facilities Booking and Payment System Replacement
The CLASS booking registration system is approaching end-of-life and the vendor is moving to a new web-based product. The move will shift maintenance, responsibility, cost, and risk for PCI compliance to the vendor plus enhance service to residents.
PRC FEDC/ITSC
46-A: Complete 100% assessment and documentation of the end-to-end business needs in support of a common registration, booking and payment experience for City programs and services by Q2 2016.
46-B: Complete 100% procurement of a new registration, booking and payment solution with an executed vendor contract by Q2 2018.
SE2 – Improve access to City services through digital service delivery
48 – Legacy Technology System Replacement
To implement a new technology solution that will replace the use of the legacy MAP system specifically for processing PGM planning applications, construction and related permits, encroachment permits, mobile and enforcement applications and Committee of Adjustment applications.
PGM FEDC/ITSC
48-A: Number of application types available on line.
48-B: Number of self-serve application submissions.

Page 52 of 126
Strategic Objective and Initiative Lead Dept. SC Oversight Performance Measure(s):
SE2 –Improve access to City services through digital service delivery
50 – Digital Service Strategy and Implementation
The Digital Service Strategy and Implementation will articulate the long term digital service vision for the City; define the steps to achieve it; and begin implementing priorities to improve the client experience when accessing City services.
SO FEDC/ITSC
50-A: Develop 100% of the Strategy (including public consultation) by Q1 2016.
50-B: Implement 100% of the projects identified and approved by Council for implementation within this Term of Council in support of the Digital Strategy by Q4 2018.
SE2 – Improve access to City services through digital service delivery
51 – IT Department Transformation
Transform the role of IT to become a core support and strategic enabler of service transformation based on the service excellence plan.
ITS FEDC/ITSC
51-A: Develop and implement 100% of the IT Department Transformation in a staged delivery with all the components implemented by the end of 2018.

Strategic Initiatives – Specific Needs per Project ($000s)
Legend: WIP = Work in Progress, C = Capital, O = Operating, FTEs (P) = Full Time Employees (Permanent), CB = Already reported in capital budget,
R = Source of funding is the Rate Budget, DC = Development charges not included
Page 53 of 126
Strategic Initiative Lead Dept.
SC Oversight
2014 Existing WIP (C)
($000s)
2015 (C)
($000s)
2016 (C)
($000s)
2017 (C)
($000s)
2018 (C)
($000s)
2014 Base
Funding
($000s)
2015 (O)
($000s)
2016 (O)
($000s)
2017 (O)
($000s)
2018 (O)
($000s)
FTEs (P)
46 – Program Registration, Facilities Booking and Payment System Replacement
PRC FEDC/ITSC 730 1,300 1,300 1,870 1,870
48 – Legacy Technology System Replacement
PGM FEDC/ITSC 930 0 0 1,400 1,400
50 – Digital Service Strategy and Implementation
SO FEDC/ITSC 400 400 400
51 – IT Department Transformation
ITS FEDC/ITSC

Section 3: Agriculture and Rural Affairs Committee (ARAC) pages 54 to 63
Page 54 of 126

Page 55 of 126

Section 3: Agriculture and Rural Affairs Committee (ARAC) The material in this section outlines the proposed strategic objectives and associated performance measures followed by the associated strategic initiatives. Where a Standing Committee or the Transit Commission is proposed to have oversight over a strategic initiative but not its associated strategic objective, this strategic objective and its associated performance measure(s) is provided for ease of reference.
Strategic Priority – Transportation and Mobility (TM)
ARAC Oversight shared with TRC over two Strategic Initiatives under this Priority
One Strategic Initiative under Objective TM2 (Oversight TRC)
Strategic Objective: TM2 – Provide and promote infrastructure to support safe mobility choices
Improve and promote mobility choices through initiatives, as outlined in Phase 1 of the Transportation Master Plan, to increase the safety and viability of all modes of travel, including cycling and walking.
Lead Department: PGM
SC Oversight: TRC
Strategic Objective Performance Measure(s)
TM2-A: Implement 100% of the initiatives aligned with Phase 1 of the Transportation Master Plan by the end of 2018.
Page 56 of 126

Strategic Initiatives with Performance Measures
Page 57 of 126
Strategic Objective and Initiative Lead Dept. SC Oversight Performance Measure(s):
TM2 – Provide and promote infrastructure to support safe mobility choices
6 – Transportation Master Plan Phase 1 Road Projects (2015-2018)
Progress in completing all road network improvement projects identified in Phase 1 of the Transportation Master Plan (TMP).
PGM TRC/
ARAC
6-A: Complete 75 percent of built Phase 1 TMP road projects by Q4 2018.
One Strategic Initiative under Objective TM4 (Oversight TRC)
Strategic Objective: TM4 – Improve safety for all road users
Foster a safer environment for all road users including cyclists and motorcyclists, motorists and pedestrians by developing and implementing safety enhancements and improvements. Further gains in safety will be made by influencing resident awareness and behaviors through Safer Roads public education efforts.
Lead Department: PW
SC Oversight: TRC
Strategic Objective Performance Measure(s)
TM4-A: Implement 100% of the initiatives aligned with improving roads safety by the end of 2018.

Strategic Initiatives with Performance Measures
Page 58 of 126
Strategic Objective and Initiative Lead Dept. SC Oversight Performance Measure(s):
TM4 – Improve safety for all road users
15 – Traffic, Pedestrian and Road Safety Enhancements
To enhance pedestrian safety, mobility and resident engagement within the City of Ottawa through the development and implementation of pedestrian countdown signals and roadway modifications and improvement initiatives for all residents. This would also include traffic calming measures, identified for each Ward, such as flexible posts and speed display boards. PW
TRC/
ARAC
15-A: i) Increase the percentage of signalized intersections with accessible pedestrian signals (APS) to 70% by Q4 2018.
ii) Increase the percentage of signalized intersections with pedestrian countdown signals (PCS) to 100% by Q4 2018.
15-B: Enhance pedestrian safety and mobility at one stand-alone intersection per year.
15-C: i) Develop a Traffic Calming Measures Implementation Plan in each Ward (in consultation with each Ward Councillor).
ii) Implement 100% of the work identified in each Ward's Implementation Plan per year.
15-D: Install 5 red light traffic cameras per year.

Strategic Initiatives – Specific Needs per Project ($000s)
Legend: WIP = Work in Progress, C = Capital, O = Operating, FTEs (P) = Full Time Employees (Permanent), CB = Already reported in capital budget,
R = Source of funding is the Rate Budget, DC = Development charges not included
Page 59 of 126
Strategic Initiative Lead Dept.
SC Oversight
2014 Existing WIP (C)
($000s)
2015 (C)
($000s)
2016 (C)
($000s)
2017 (C)
($000s)
2018
(C)
($000s)
2014 Base
Funding
($000s)
2015 (O)
($000s)
2016 (O)
($000s)
2017 (O)
($000s)
2018 (O)
($000s)
FTEs (P)
6 – Transportation Master Plan Phase 1 Road Projects (2015-2018)
PGM TRC/
ARAC
1,757 DC, CB
823 DC,
CB 2,200
DC, CB 2,265 DC,
CB
15 – Traffic, Pedestrian and Road Safety Enhancements
PW TRC/
ARAC 2,800 2,800 2,800 2,800 100 100 100 100

Strategic Priority – Sustainable Environmental Services (ES)
ARAC Oversight shared with EC over three Strategic Initiatives under this Priority, under Objective ES1 (Oversight EC)
Strategic Objective: ES1 – Support an environmentally sustainable Ottawa
Implement priority projects that protect property, land, air and water for city residents.
Lead Department: ESD
SC Oversight: EC
Strategic Objective Performance Measure(s)
ES1-A: Maintain the number of Water Quality Index good to excellent ratings annually at 75% of monitored locations on Ottawa’s major rivers (Ottawa, Rideau, and Mississippi)
ES1-B: No net increase in corporate per capita Greenhouse Gas (GHG) emissions between 2012 and 2016.
ES1-C: Maintain a 2:1 ratio (or greater) between trees planted and trees removed annually.
Strategic Initiatives with Performance Measures
Page 60 of 126
Strategic Objective and Initiative Lead Dept. SC Oversight Performance Measure(s):
ES1 – Support an environmentally sustainable Ottawa
18 – Water Environment Strategy Phase 2
Develop the Water Environment Strategy (WES) Phase 2 and, pending Council approval, begin implementation. WES-2 will include long term goals, an action plan, and inter-agency coordinating framework, building on the Council approved Phase 1 and input from the 2014 Water Roundtable.
ESD EC/
ARAC
18-A: Complete the first annual water quality data report by Q4 2016.
18-B: Make Baseline Water Quality monitoring data available through the City’s Open Data initiative by 2015.

Page 61 of 126
Strategic Objective and Initiative Lead Dept. SC Oversight Performance Measure(s):
ES1 – Support an environmentally sustainable Ottawa
19 – Increase Forest Cover
Initiatives for protecting and increasing forest cover include tree planting in the urban, suburban and rural areas, and rehabilitation of parks and green spaces by partnering with Ecology Ottawa in order to have 1 million trees planted. As well, the Emerald Ash Borer (EAB) Woodlot Management Strategy focuses on the rehabilitation of 993 parks and 187 municipal nature features in the management of a wood-boring beetle, the Emerald Ash Borer.
PW EC/
ARAC
19-A: Achieve the City’s tree planting target of 125,000 trees per year.
ES1 – Support an environmentally sustainable Ottawa
21 – Stormwater Management (SWM) Retrofit Master Plan
Develop a city-wide Storm Water Management retrofit master plan to improve water quality, reduce runoff and improve stream health in older urban areas that developed before current SWM requirements were in place.
PGM EC/
ARAC
21-A: Complete 100% of the Eastern Subwatersheds SWM Retrofit Study by the end of 2015.
21-B: Complete 85% of City-wide SWM Retrofit Master Plan by end of 2018.

Strategic Initiatives – Specific Needs per Project ($000s)
Legend: WIP = Work in Progress, C = Capital, O = Operating, FTEs (P) = Full Time Employees (Permanent), CB = Already reported in capital budget,
R = Source of funding is the Rate Budget, DC = Development charges not included
Page 62 of 126
Strategic Initiative Lead Dept.
SC Oversight
2014 Existing WIP (C)
($000s)
2015
(C)
($000s)
2016
(C)
($000s)
2017
(C)
($000s)
2018
(C)
($000s)
2014 Base
Funding
($000s)
2015 (O)
($000s)
2016 (O)
($000s)
2017 (O)
($000s)
2018 (O)
($000s)
FTEs (P)
18 – Water Environment Strategy Phase 2
ESD EC/
ARAC 760R 1,000R,CB 1,000R,CB 1,000R,CB 1,000R,CB
19 – Increase Forest Cover PW
EC/
ARAC 5,480 5,605 5,605 5,605 5,605
21 – Stormwater Management (SWM) Retrofit Master Plan
PGM EC/
ARAC 360R,CB 684R,CB 702R,CB 719R,CB

Page 63 of 126

Section 4: Planning Committee (PC) pages 64 to 77
Page 64 of 126

Page 65 of 126

Section 4: Planning Committee (PC) The material in this section outlines the proposed strategic objectives and associated performance measures followed by the associated strategic initiatives. Where a Standing Committee or the Transit Commission is proposed to have oversight over a strategic initiative but not its associated strategic objective, this strategic objective and its associated performance measure(s) is provided for ease of reference.
Strategic Priority – Transportation and Mobility (TM)
PC Oversight over one Strategic Initiative under this Priority, under Objective TM3 (Oversight TRC)
Strategic Objective: TM3 – Integrate the rapid transit and transit priority network into the community
Integrate the rapid transit and transit priority network into the community, through initiatives that accommodate increased pedestrian activity expected as a result of the LRT Project, and to promote pathway and community connectivity.
Lead Department: PGM
SC Oversight: TRC
Strategic Objective Performance Measure(s)
TM3-A: Increase or maintain the number of cyclists who cycle to transit (bikes parked at stations) annually during the Term of Council.
Page 66 of 126

Strategic Initiatives with Performance Measures
Page 67 of 126
Strategic Objective and Initiative Lead Dept. SC Oversight Performance Measure(s):
TM3 – Integrate the rapid transit and transit priority network into the community
10 – Rideau Street Streetscaping
Improvements for Rideau Street (Sussex Drive to Dalhousie Street) and Nicholas Street (Rideau Street to Besserer Street) consistent with the Rideau/Arts Precinct Public Realm Plan, to improve the pedestrian environment and accommodate increased pedestrian activity expected as a result of the LRT project and the Rideau Centre Expansion.
PGM PC
10-A: Complete 100% of improvements to Rideau Street and Nicholas Street by end of year 2017.
Strategic Initiatives – Specific Needs per Project ($000s)
Legend: WIP = Work in Progress, C = Capital, O = Operating, FTEs (P) = Full Time Employees (Permanent), CB = Already reported in capital budget,
R = Source of funding is the Rate Budget, DC = Development charges not included
Strategic Initiative Lead Dept.
SC Oversight
2014 Existing WIP (C)
($000s)
2015
(C) ($000s)
2016 (C)
($000s)
2017 (C)
($000s)
2018 (C)
($000s)
2014 Base Funding
($000s)
2015 (O)
($000s)
2016 (O)
($000s)
2017 (O)
($000s)
2018 (O)
($000s)
FTEs (P)
10 – Rideau Street Streetscaping
PGM PC 4,500

Strategic Priority – Healthy and Caring Communities (HC)
PC Oversight over two Strategic Initiatives under this Priority, one under Objective HC3 and one under HC4 (Both Oversight CPSC)
Strategic Objective: HC3 – Create new affordable housing options
Ensuring access to, and availability of, a range of housing options to meet the needs of our vulnerable residents for today and tomorrow. As the city continues to grow and prosper, a comprehensive plan is required to create thriving communities where everyone has a home.
Lead Department: CSS
SC Oversight: CPSC
Strategic Objective Performance Measure(s)
HC3-A: Approve 150 new affordable housing units by Q4 2018.
HC3-B: Create 300 new housing subsidies by Q4 2018 (Rent Supplements and Housing Allowances).
Page 68 of 126

Strategic Initiatives with Performance Measures
Page 69 of 126
Strategic Objective and Initiative Lead Dept. SC Oversight Performance Measure(s):
HC3 – Create new affordable housing options
39 – Neighbourhood Revitalization and Redevelopment Program
Develop a Neighbourhood Revitalization and Redevelopment Program aimed at improving the health, vibrancy and liveability of low income neighbourhoods. Planning and Growth Management will engage stakeholders to develop this program based on specific criteria which should include opportunities for public/private partnerships, redevelopment of vacant lands and the potential to increase land values through zoning and to determine the preferred site.
PGM PC 39-A: Complete 100% of the project by Q4 2016.

Strategic Objective: HC4 – Support Arts, Heritage, and Culture
Support local arts, heritage and culture by completing the Ottawa Art Gallery Expansion and Arts Court Redevelopment project, identifying and preserving Ottawa’s distinct heritage resources and through funding to cultural facility community partners.
Lead Department: PRC
SC Oversight: CPSC
Strategic Objective Performance Measure(s)
HC4-A: Implement the milestones listed below.
· Complete the Arts Court redevelopment by Q1 2018 · Complete development of new Heritage Reference List with online accessibility by end of 2018 · Achieve 80% of recommended cultural facility operating funding (Renewed Action Plan for Arts, Heritage and Culture) by end of 2018, and 33% of
community cultural facility capital funding by end of 2018.
Page 70 of 126

Strategic Initiatives with Performance Measures
Page 71 of 126
Strategic Objective and Initiative Lead Dept. SC Oversight Performance Measure(s):
HC4 – Support Arts, Heritage, and Culture
42 – Heritage Reference List
Research and prepare an updated Heritage Reference List (HRL) that would provide staff, the development community, community associations and the general public with a better indication of the City’s heritage resources. The List will assist in the management of these resources, and will be available online. Planning and Growth Management will also undertake Heritage Conservation District Studies with the participation of local communities. These studies will determine whether the reviewed area or parts thereof have cultural heritage value and are worthy of designation under Part V of the Ontario Heritage Act.
PGM PC
42-A: Complete 100% of new Heritage Reference List and make it accessible online by Q4 2016 for inside the greenbelt and 100% by Q4 2018 for outside the greenbelt.
42-B: Complete 100% of the identified local community Heritage Conservation District Studies by the end of 2018.

Strategic Initiatives – Specific Needs per Project ($000s)
Legend: WIP = Work in Progress, C = Capital, O = Operating, FTEs (P) = Full Time Employees (Permanent), CB = Already reported in capital budget,
R = Source of funding is the Rate Budget, DC = Development charges not included
Page 72 of 126
Strategic Initiative Lead Dept.
SC Oversight
2014 Existing WIP (C)
($000s)
2015 (C)
($000s)
2016 (C)
($000s)
2017 (C)
($000s)
2018 (C)
($000s)
2014 Base
Funding
($000s)
2015 (O)
($000s)
2016 (O)
($000s)
2017 (O)
($000s)
2018 (O)
($000s)
FTEs (P)
39 – Neighbourhood Revitalization and Redevelopment Program
PGM PC 250
42 – Heritage Reference List PGM PC 144 144 144 144 144

Strategic Priority – Governance, Planning and Decision-Making (GP)
PC Oversight over one Strategic Initiative under this Priority, one under Objective GP1 (Oversight FEDC)
Strategic Objective: GP1 – Strengthen public engagement
Ensure business practices are democratic, engaging, and visible by encouraging citizens to participate in decision-making and community life through public engagement opportunities.
Lead Department: CPBS
SC Oversight: FEDC
Strategic Objective Performance Measure(s)
GP1-A: Increase the number of participants in Corporate public engagement activities annually.
Strategic Initiatives with Performance Measures
Page 73 of 126
Strategic Objective and Initiative Lead Dept. SC Oversight Performance Measure(s):
GP1 – Strengthen public engagement
54 – Improved Public Engagement in Planning Matters
Integrated program to refresh the approach and tactics applied to public engagement in planning matters as a result of the adoption of the new corporate Public Engagement Guidelines initiative and community and political interest in improving the dialogue and outcomes.
PGM PC
54-A: Increase the percentage of eligible development applications that have a completed public engagement strategy to 50% by 2018 over 2015 results.
54-B: Increase the public’s evaluation of the public engagement process by 30% over 2015 baseline results within the term of Council.

Strategic Initiatives – Specific Needs per Project ($000s)
Legend: WIP = Work in Progress, C = Capital, O = Operating, FTEs (P) = Full Time Employees (Permanent), CB = Already reported in capital budget,
R = Source of funding is the Rate Budget, DC = Development charges not included
Page 74 of 126
Strategic Initiative Lead Dept.
SC Oversight
2014 Existing WIP (C)
($000s)
2015 (C)
($000s)
2016 (C)
($000s)
2017 (C)
($000s)
2018 (C)
($000s)
2014 Base Funding
($000s)
2015 (O)
($000s)
2016 (O)
($000s)
2017 (O)
($000s)
2018 (O)
($000s)
FTEs (P)
54 – Improved Public Engagement in Planning Matters
PGM PC 150 150 150 150

Strategic Priority – Financial Sustainability (FS)
PC Oversight over one Strategic Initiative under this Priority, one under Objective FS1 (Oversight FEDC)
Strategic Objective: FS1 – Demonstrate sound financial management
Ensure long range planning directs the spending of tax payers’ dollars.
Lead Department: FIN
SC Oversight: FEDC
Strategic Objective Performance Measure(s)
FS1-A: Complete update of the Long Range Financial Plans within the Term of Council.
FS1-B: Maintain established level of liquidity quarterly.
FS1-C: Maintain the percentage of overall surplus or deficit compared to total operating expenditure budget at 0, annually.
Page 75 of 126

Strategic Initiatives with Performance Measures
Page 76 of 126
Strategic Objective and Initiative Lead Dept. SC Oversight Performance Measure(s):
FS1 – Demonstrate sound financial management
60 – Infrastructure Standards Review
A review of the standards that the City has established for the construction of infrastructure was identified by the Development Charges Sponsor Group during the review of the Development Charges (DC) By-law. This will respond to concerns identified related to the affordability of standards used in the approval of development applications, and city-initiated capital projects by undertaking a comprehensive review of all service standards, including an analysis of construction and infrastructure standards as well as lifecycle and maintenance costs.
PGM PC
60-A: Develop 100% of new infrastructure standards by the end of 2018.

Strategic Initiatives – Specific Needs per Project ($000s)
Legend: WIP = Work in Progress, C = Capital, O = Operating, FTEs (P) = Full Time Employees (Permanent), CB = Already reported in capital budget,
R = Source of funding is the Rate Budget, DC = Development charges not included
Page 77 of 126
Strategic Initiative Lead Dept.
SC Oversight
2014 Existing WIP (C) ($000s)
2015 (C)
($000s)
2016 (C)
($000s)
2017 (C)
($000s)
2018 (C)
($000s)
2014 Base Funding ($000s)
2015 (O)
($000s)
2016 (O)
($000s)
2017 (O)
($000s)
2018 (O)
($000s)
FTEs (P)
60 – Infrastructure Standards Review
PGM PC 250 250 250

Section 5: Environment Committee (EC) pages 78 to 91
Page 78 of 126

Page 79 of 126

Section 5: Environment Committee (EC) The material in this section outlines the proposed strategic objectives and associated performance measures followed by the associated strategic initiatives. Where a Standing Committee or the Transit Commission is proposed to have oversight over a strategic initiative but not its associated strategic objective, this strategic objective and its associated performance measure(s) is provided for ease of reference.
Strategic Priority – Sustainable Environmental Services (ES)
EC Oversight over both Strategic Objectives and nine Strategic Initiatives under this Priority
Strategic Objective: ES1 – Support an environmentally sustainable Ottawa
Implement priority projects that protect property, land, air and water for city residents.
Lead Department: ESD
SC Oversight: EC
Strategic Objective Performance Measure(s)
ES1-A: Maintain the number of Water Quality Index good to excellent ratings annually at 75% of monitored locations on Ottawa’s major rivers (Ottawa, Rideau, and Mississippi).
ES1-B: No net increase in corporate per capita Greenhouse Gas (GHG) emissions between 2012 and 2016.
ES1-C: Maintain a 2:1 ratio (or greater) between trees planted and trees removed annually.
Page 80 of 126

Strategic Initiatives with Performance Measures
Page 81 of 126
Strategic Objective and Initiative Lead Dept. SC Oversight Performance Measure(s):
ES1 – Support an environmentally sustainable Ottawa
17 – Combined Sewage Storage Tunnel (CSST)
As part of the Ottawa River Action Plan (ORAP), design and construct a Combined Sewage Storage Tunnel (CSST) to reduce combined sewer overflows (CSOs) to the Ottawa River.
ISD EC
17-A: Finalize the detailed design and contract documents for the Combined Sewage Storage Tunnel by end of 2015.
17-B: Complete 100% of the construction of the Combined Sewage Storage Tunnel (CSST) by end of 2018.
ES1 – Support an environmentally sustainable Ottawa
18 – Water Environment Strategy Phase 2
Develop the Water Environment Strategy (WES) Phase 2 and, pending Council approval, begin implementation. WES-2 will include long term goals, an action plan, and inter-agency coordinating framework, building on the Council approved Phase 1 and input from the 2014 Water Roundtable.
ESD EC/
ARAC
18-A: Complete the first annual water quality data report by Q4 2016.
18-B: Make Baseline Water Quality monitoring data available through the City’s Open Data initiative by 2015.

Page 82 of 126
Strategic Objective and Initiative Lead Dept. SC Oversight Performance Measure(s):
ES1 – Support an environmentally sustainable Ottawa
19 – Increase Forest Cover
Initiatives for protecting and increasing forest cover include tree planting in the urban, suburban and rural areas, and rehabilitation of parks and green spaces by partnering with Ecology Ottawa in order to have 1 million trees planted. As well, the Emerald Ash Borer (EAB) Woodlot Management Strategy focuses on the rehabilitation of 993 parks and 187 municipal nature features in the management of a wood-boring beetle, the Emerald Ash Borer.
PW EC/
ARAC
19-A: Achieve the City’s tree planting target of 125,000 trees per year.

Page 83 of 126
Strategic Objective and Initiative Lead Dept. SC Oversight Performance Measure(s):
ES1 – Support an environmentally sustainable Ottawa
20 – Air Quality and Climate Change Management Plan
The Air Quality and Climate Change Management Plan (AQCCMP) sets out a Green House Gas (GHG) emission reduction target, goals and objectives, and encompasses a variety of projects and initiatives to be implemented by the City over the next five years to achieve more efficient and renewable municipal operations, as well as working with community partners to reduce air pollution and make Ottawa more resilient. A number of the strategic initiatives in the 2015-2018 City Strategic Plan, representing investments of close to $1.8B, will contribute to the progress of the AQCCMP, including: the Energy Management and Investment Strategy (2015-2019), the Increase Forest Cover initiative; Completion of the O-Train’s Confederation Line Light Rail Transit Projects; Water Environment Strategy Phase 2; the Stormwater Management Retrofit Master Plan; Transportation Master Plan Cycling and Pedestrian projects; Community Pathways and Connections Program; and Cycling safety and winter improvements programs. Other actions falling within the AQCCMP strategic initiative include the Green Municipal Fleet Plan, Electric Vehicle Charging Stations Pilot, Green Building Policy, Emergency Energy Plan, Subwatershed Planning, and Source Water Protection Plans, among others.
ESD EC
20-A: Decrease the municipal fleet’s total litres of fuel consumed per 100 kilometres for the municipal fleet, by 3% by the end of 2015; 4% by the end of 2016, 5% by the end of 2017 and 6% by the end of 2018.
20-B: Decrease in kilowatt hours per square meter (ekWh/m2) purchased at City facilities by 2.67% (from 2014 values) by the end of Q4 2018.

Page 84 of 126
Strategic Objective and Initiative Lead Dept. SC Oversight Performance Measure(s):
ES1 – Support an environmentally sustainable Ottawa
21 – Stormwater Management (SWM) Retrofit Master Plan
Develop a city-wide Storm Water Management retrofit master plan to improve water quality, reduce runoff and improve stream health in older urban areas that developed before current SWM requirements were in place.
PGM EC/
ARAC
21-A: Complete 100% of the Eastern Subwatersheds SWM Retrofit Study by the end of 2015.
21-B: Complete 85% of City-wide SWM Retrofit Master Plan by end of 2018.
ES1 – Support an environmentally sustainable Ottawa
22 – Renewable Energy Strategy
Complete a baseline analysis of energy supply and demand within the City of Ottawa and assess options, in collaboration with community partners, for all such partners to advance energy conservation, energy efficiency and renewable energy generation within their respective areas of control/influence.
ESD EC
22-A: Complete 100% of the project by Q4 2017.

Strategic Objective: ES2 – Reduce long-term costs through planned investment and staging of diversion and conservation strategies
Demonstrate sustainability and fiscal responsibility in planning, maintaining, and renewing utility services and assets through City-led actions and municipal partnerships.
Lead Department: PW
SC Oversight: EC
Strategic Objective Performance Measure(s)
ES2-A: Reduce the electrical consumption of the City's streetlighting network by 29M kWh by the end of Q4 2018.
Strategic Initiatives with Performance Measures
Page 85 of 126
Strategic Objective and Initiative Lead Dept. SC Oversight Performance Measure(s):
ES2 – Reduce long-term costs through planned investment and staging of diversion and conservation strategies
24 – Waste Diversion in Parks, Buildings and Grounds Services Operations
Since 2009, the Parks, Buildings and Grounds Services branch have implemented many successful waste management programs within their operations. With established diversion programs in place, the focus will now be on enhancing diversion and participation rates.
PW EC 24-A: Increase diversion rates in small-scale curb-side City facilities to: 40% by Q4 2015; 45% by Q4 2016; 50% by Q4 2017 and 55% by Q4 2018.

Page 86 of 126
Strategic Objective and Initiative Lead Dept. SC Oversight Performance Measure(s):
ES2 – Reduce long-term costs through planned investment and staging of diversion and conservation strategies
25 –Energy Management and Investment Strategy (2015-2019)
The 2015-2019 Energy Management and Investment Strategy will build on the momentum and successes of the 2010-2014 Smart Energy Program. The goal of the program is to manage the City's increasing growth and demand for energy through the implementation of various energy conservation measures including the installation of LED street lighting.
PW EC 25-A: Increase the number of streetlights converted to energy efficient LED technology by 15,000 per year.
25-B: Reduce maintenance costs per converted streetlight fixtures by 50%.
ES2 – Reduce long-term costs through planned investment and staging of diversion and conservation strategies
26 – Large Diameter Watermain Program
The City of Ottawa will assess the condition of the 220 km of large diameter (610 mm and greater) watermains in the City in order to identify and manage the risks associated with transmission main failures by completing the Condition Assessment Program as directed by Council.
ESD EC 26-A: Complete condition assessment of 5 km of Transmission main (>610mm) per year.
26-B: Repair / replace 100% of pipe sections and appurtenances identified annually through the Condition Assessment Program to be below acceptable risk of failure.

Strategic Initiatives – Specific Needs per Project ($000s)
Legend: WIP = Work in Progress, C = Capital, O = Operating, FTEs (P) = Full Time Employees (Permanent), CB = Already reported in capital budget,
R = Source of funding is the Rate Budget, DC = Development charges not included
Page 87 of 126
Strategic Initiative Lead Dept.
SC Oversight
2014 Existing WIP (C)
($000s)
2015 (C)
($000s)
2016 (C)
($000s)
2017 (C)
($000s)
2018 (C) ($000s)
2014 Base
Funding
($000s)
2015
(O)
($000s)
2016
(O)
($000s)
2017 (O)
($000s)
2018 (O)
($000s)
FTEs (P)
17 – Combined Sewage Storage Tunnel (CSST)
ISD EC 89,744R 11,800R,CB 0 0 11,800R,CB
18 – Water Environment Strategy Phase 2 ESD
EC/
ARAC 760R 1,000R,CB 1,000R,CB 1,000R,CB 1,000R,CB
19 – Increase Forest Cover PW
EC/
ARAC 5,480 5,605 5,605 5,605 5,605
20 – Air Quality and Climate Change Management Plan
ESD EC 500 500 500 250 250 250 250

Page 88 of 126
Strategic Initiative Lead Dept.
SC Oversight
2014 Existing WIP (C)
($000s)
2015 (C)
($000s)
2016 (C)
($000s)
2017 (C)
($000s)
2018 (C)($000s)
2014 Base
Funding
($000s)
2015
(O)
($000s)
2016
(O)
($000s)
2017 (O)
($000s)
2018 (O)
($000s)
FTEs (P)
21 – Stormwater Management (SWM) Retrofit Master Plan
PGM EC/
ARAC 360R,CB 684R,CB 702R,CB 719R,CB
22 – Renewable Energy Strategy ESD EC 100 100 100 100 100
24 – Waste Diversion in Parks, Buildings and Grounds Services Operations
PW EC 24 24 24 24 24
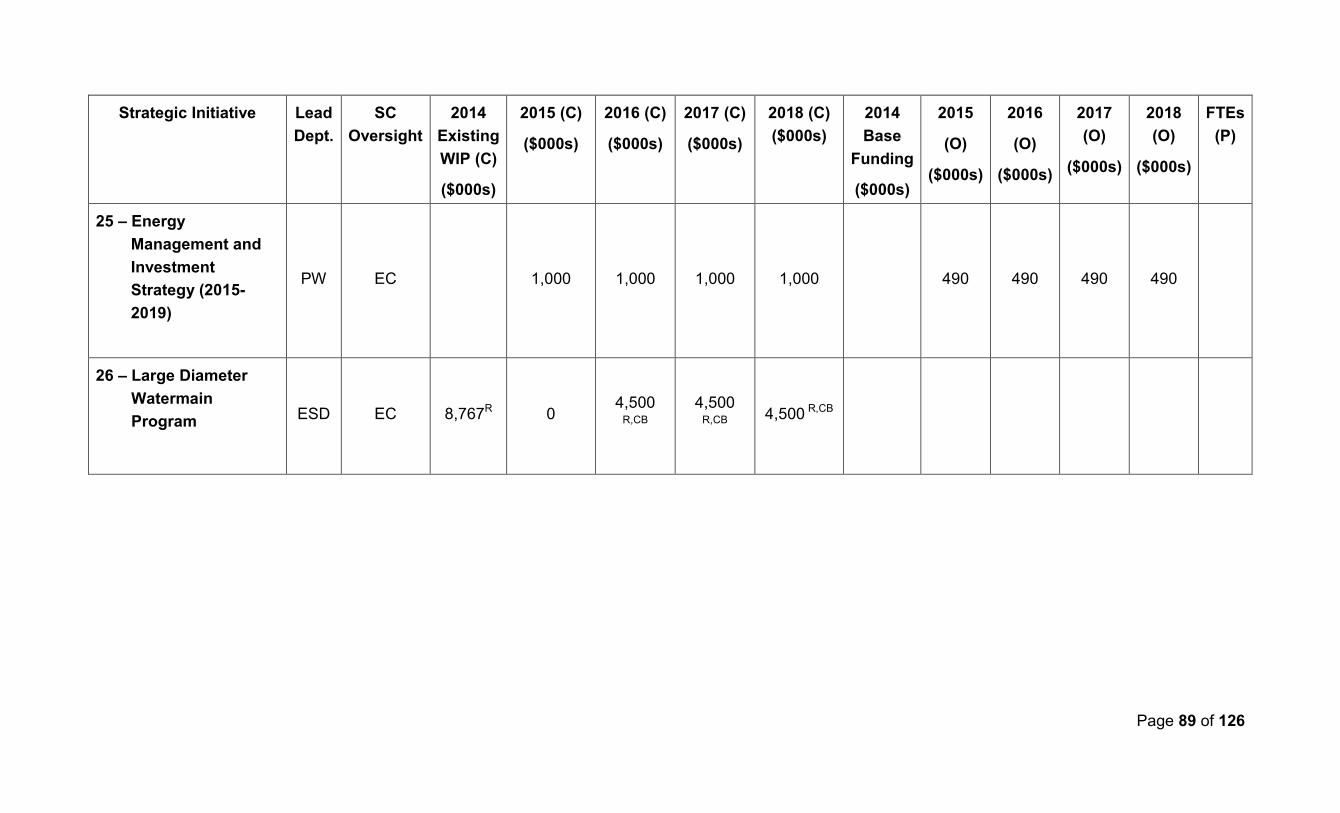
Page 89 of 126
Strategic Initiative Lead Dept.
SC Oversight
2014 Existing WIP (C)
($000s)
2015 (C)
($000s)
2016 (C)
($000s)
2017 (C)
($000s)
2018 (C)($000s)
2014 Base
Funding
($000s)
2015
(O)
($000s)
2016
(O)
($000s)
2017 (O)
($000s)
2018 (O)
($000s)
FTEs (P)
25 – Energy Management and Investment Strategy (2015-2019)
PW EC 1,000 1,000 1,000 1,000 490 490 490 490
26 – Large Diameter Watermain Program ESD EC 8,767R 0
4,500 R,CB
4,500
R,CB 4,500 R,CB

Strategic Priority – Financial Sustainability (FS)
EC Oversight over one Strategic Initiative under this Priority, Objective FS1 (Oversight FEDC)
Strategic Objective: FS1 – Demonstrate sound financial management
Ensure long-range planning directs the spending of tax payers’ dollars.
Lead Department: FIN
SC Oversight: FEDC
Strategic Objective Performance Measure(s)
FS1-A: Complete update of the Long-Range Financial Plans within the Term of Council.
FS1-B: Maintain established level of liquidity quarterly.
FS1-C: Maintain the percentage of overall surplus or deficit compared to total operating expenditure budget at 0, annually.
Strategic Initiatives with Performance Measures
Page 90 of 126
Strategic Objective and Initiative Lead Dept. SC Oversight Performance Measure(s):
FS1 – Demonstrate sound financial management
59 – Water and Wastewater Rate Structure Review
Review and update the water and wastewater rate structure in order to provide adequate funding to support operations and infrastructure needs. This review is required in order to ensure we meet goals established in the City's Long-Range Financial Plan (LRFP) and Infrastructure Master Plan.
FIN EC
59-A: Complete Water and Wastewater Rate Review by end of Q1 2016.

Strategic Initiatives – Specific Needs per Project ($000s)
Legend: WIP = Work in Progress, C = Capital, O = Operating, FTEs (P) = Full Time Employees (Permanent), CB = Already reported in capital budget,
R = Source of funding is the Rate Budget, DC = Development charges not included
Page 91 of 126
Strategic Initiative Lead Dept.
SC Oversight
2014 Existing WIP (C)
($000s)
2015 (C)
($000s)
2016 (C)
($000s)
2017 (C)
($000s)
2018
(C)
($000s)
2014 Base
Funding
($000s)
2015
(O)
($000s)
2016
(O)
($000s)
2017 (O)
($000s)
2018 (O)
($000s)
FTEs (P)
59 – Water and Wastewater Rate Structure Review
FIN EC 354R 0 0 0 0

Section 6: Transit Commission (TC) pages 92 to 97
Page 92 of 126

Page 93 of 126

Section 6: Transit Commission (TC) The material in this section outlines the proposed strategic objectives and associated performance measures followed by the associated strategic initiatives. Where a Standing Committee or the Transit Commission is proposed to have oversight over a strategic initiative but not its associated strategic objective, this strategic objective and its associated performance measure(s) is provided for ease of reference.
Strategic Priority – Transportation and Mobility (TM)
TC Oversight over one Strategic Objective and one Strategic Initiative under this Priority
Strategic Objective: TM5 – Ensure reliable and safe transit services
Meet the current and future transit needs of residents and visitors by ensuring the City Transit services are reliable and safe.
Lead Department: OCT
SC Oversight: TC
Strategic Objective Performance Measure(s)
TM5-A: Maintain or increase customers’ and residents’ confidence rating of 71% in OC Transpo, through to the end of 2018.
TM5-B: Maintain or increase OC Transpo's safety and security rating at 7.4, through to the end of 2018.
TM5-C: Maintain sufficient service capacity standards at 100% to carry all transit customers, through to the end of 2018.
Page 94 of 126

Strategic Initiatives with Performance Measures
Page 95 of 126
Strategic Objective and Initiative Lead Dept. SC Oversight Performance Measure(s):
TM5 – Ensure reliable and safe transit services
16 – Making the O-Train’s Confederation Line an integrated part of the OC Transpo system
Integrate the new light rail transit service into OC Transpo operations ensuring that the resulting multi-modal service is safe, efficient, and reliable. Important factors include regulation, customer experience, employee engagement, labour relations, and operational processes.
OCT TC
16-A: Complete 100% of the multimodal transformation program projects by the end of Q3 2018.
16-B: Have a Regulatory Monitoring and Compliance Officer in place by the end of Q3 2017.
16-C: Implement 100% of the Fare Control System on the Trillium Line by the end of Q2 2017.
16-D: Reduce 50% of the OC Transpo buses traveling through the downtown core by September 2018.

Strategic Initiatives – Specific Needs per Project ($000s)
Legend: WIP = Work in Progress, C = Capital, O = Operating, FTEs (P) = Full Time Employees (Permanent), CB = Already reported in capital budget,
R = Source of funding is the Rate Budget, DC = Development charges not included
Page 96 of 126
Strategic Initiative Lead Dept.
SC Oversight
2014 Existing WIP (C)
($000s)
2015
(C)
($000s)
2016 (C)
($000s)
2017
(C)
($000s)
2018
(C)
($000s)
2014 Base
Funding
($000s)
2015
(O)
($000s)
2016
(O)
($000s)
2017 (O)
($000s)
2018 (O)
($000s)
FTEs (P)
16 – Making the O-Train’s Confederation Line an integrated part of the OC Transpo system
OCT TC 37,010
CB 2,715
CB 3,005
CB 2,500
CB

Page 97 of 126

Section 7: Community and Protective Services Committee (CPSC) pages 98 to 111
Page 98 of 126

Page 99 of 126

Section 7: Community and Protective Services Committee (CPSC) The material in this section outlines the proposed strategic objectives and associated performance measures followed by the associated strategic initiatives. Where a Standing Committee or the Transit Commission is proposed to have oversight over a strategic initiative but not its associated strategic objective, this strategic objective and its associated performance measure(s) is provided for ease of reference.
Strategic Priority – Healthy and Caring Communities (HC)
CPSC Oversight over five Strategic Objectives and twelve Strategic Initiatives under this Priority
Strategic Objective: HC1 – Advance equity and inclusion for the city’s diverse population
Advance equity and inclusion for the city’s diverse population by effectively planning and implementing changes to infrastructure development and service delivery.
Lead Department: CSS
SC Oversight: CPSC
Strategic Objective Performance Measure(s)
HC1-A: Increase the percentage of employees (starting in 2016) who are advancing equity and inclusion in their work in the categories specified in the Equity and Inclusion Lens, by 5% each year by the end of 2018. The baseline for the percentage of employees will be developed in 2015.
Page 100 of 126

Strategic Initiatives with Performance Measures
Page 101 of 126
Strategic Objective and Initiative Lead Dept. SC Oversight Performance Measure(s):
HC1 – Advance equity and inclusion for the city’s diverse population
29 – Inclusive Community Initiative
The Inclusive Community Initiative responds to the changing needs of the diverse population. This initiative encompasses an Employer Strategy, the Older Adult Plan, the Youth Action Plan, the Municipal Immigration Strategy, the Equity and Inclusion Lens initiative, and the Aboriginal Service Strategy.
CSS CPSC
29-A: Implement 5% in 2015, 20% in 2016, 20% in 2017 and 35% in 2018 of the actions in the five (5) action plans (Older Adult Plan, Youth Action Plan, Municipal Immigration Strategy, Employer Strategy and the Aboriginal Service Strategy).
29-B: Increase the percentage of trained employees (starting in 2016) who report using the Equity and Inclusion Lens in their daily work within one year of training by 5% each year by the end of 2018. The baseline for the percentage of employees will be developed in 2015.
HC1 – Advance equity and inclusion for the city’s diverse population
30 – Community and Social Services Partnership Capital Funding
City contribution (25% of eligible expenses) to major capital requirements of social service and community organizations providing services on behalf of the City to low income residents.
CSS CPSC
30-A: Allocate 25% of total funds annually during the term of Council.

Strategic Objective: HC2 – Revitalize recreation services
Provide accessible, inclusive, and quality recreation services that respond to demographic trends in population and activity.
Lead Department: PRC
SC Oversight: CPSC
Strategic Objective Performance Measure(s)
HC2-A: Increase consistency among identified registered recreation activities by 10% by Q4 2015, 15% by Q4 2016, and 20% by Q1 2018.
Strategic Initiatives with Performance Measures
Page 102 of 126
Strategic Objective and Initiative Lead Dept. SC Oversight Performance Measure(s):
HC2 – Revitalize recreation services
31 – Modernization of Recreation Services
Parks, Recreation and Cultural Services will review and revise a strategy relating to capital construction, resulting in a ten-year building program. The department will also develop additional event programming at prime locations, leading to increased community engagement.
PRC CPSC
31-A: Complete 20% of the Recreation Infrastructure Standards and Strategy by Q4 2015, 40% by Q4 2016, 75% by Q4 2017, and 100% by Q4 2018.
31-B: Increase the number of Event Central-fostered activities occurring at Lansdowne Park and City Hall to 175 activities in 2015, 185 in 2016 and 200 in 2017. In 2018, reduce the number of activities to 185.

Page 103 of 126
Strategic Objective and Initiative Lead Dept. SC Oversight Performance Measure(s):
HC2 – Revitalize recreation services
32 – Revise Parks, Recreation and Cultural Services Facility Allocation Policy
Parks, Recreation and Cultural Services will review and revise its Facility Allocation Policy for ice time and sports fields.
PRC CPSC
32-A: Increase the progress made in revising the Facility Allocation Policy to 50% by Q2 2015, 75% by Q3 2015, and 100% by Q4 2015.
HC2 – Revitalize recreation services
33 – Develop a Sport Strategy
Develop guidelines for a ‘sports for all’ service delivery system that would include everything from programs to infrastructure use to community partnerships. The new balanced service delivery model would include the City, other levels of government, schools and the private sector.
PRC CPSC
33-A: Increase the progress made in preparing a Municipal Sports Strategy to 50% by the end of Q2 2015 and 100% by Q4 2015.
HC2 – Revitalize recreation services
34 – Recreation Major/ Minor Capital Partnership
City contribution to major and minor capital requirements of community and recreation organizations providing services on behalf of the City.
PRC CPSC
34-A: Leverage a minimum $1.25 of community investment for every $1.00 contributed by the City in minor and major capital partnerships, every year, from 2015 through 2018.

Page 104 of 126
Strategic Objective and Initiative Lead Dept. SC Oversight Performance Measure(s):
HC2 – Revitalize recreation services
35 – Parks and Recreation Facility Upgrades
Upgrades to Parks and Recreation facilities, including field houses and splash pads.
PRC CPSC
35-A: Increase progress made in implementing Parks and Recreation facility upgrades to 25% in 2015, 50% in 2016, 75% in 2017 and 100% in 2018.
HC2 – Revitalize recreation services
36 – Community Rinks
Parks, Recreation and Cultural Services support more than 230 outdoor rinks each year. The rinks are operated in conjunction with community groups and volunteers. Increased funding will assist the communities’ capacity to operate the rinks.
PRC CPSC
36-A: Increase support to community groups for the operation of outdoor rinks by 10% each year from 2015 to 2018 over the base year.
HC2 – Revitalize recreation services
37 – Targeted Low-Income Recreation Subsidies
Target subsidies to strengthen youth participation in recreation selected locations.
PRC CPSC
37-A: Increase participation, over 2015 baseline, by 50% in 2016 and maintain for 2017 and 2018.
37-B: Increase hours of programming, over 2015 baseline, by 50% in 2016, and maintain for 2017 and 2018.

Strategic Objective: HC3 – Create new affordable housing options
Ensuring access to, and availability of, a range of housing options to meet the needs of our vulnerable residents for today and tomorrow. As the city continues to grow and prosper, a comprehensive plan is required to create thriving communities where everyone has a home.
Lead Department: CSS
SC Oversight: CPSC
Strategic Objective Performance Measure(s) HC3-A: Approve 150 new affordable housing units by Q4 2018.
HC3-B: Create 300 new housing subsidies by Q4 2018 (Rent Supplements and Housing Allowances).
Strategic Initiatives with Performance Measures
Page 105 of 126
Strategic Objective and Initiative Lead Dept. SC Oversight Performance Measure(s):
HC3 – Create new affordable housing options
38 – Ten Year Housing and Homelessness Plan
In September 2013, City Council approved a ten year housing and homelessness plan which focuses on three key priorities: ensuring everyone has a home; ensuring people get the support they need; and working together.
CSS CPSC
38-A: Decrease the annual average number of families who stayed in motels by 30% by the end of Q4 2018
38-B: Decrease the cost of emergency shelter response by 20% by Q4 2018 and reinvest all savings in housing and supports.

Strategic Objective: HC4 – Support Arts, Heritage, and Culture
Support local arts, heritage and culture by completing the Ottawa Art Gallery Expansion and Arts Court Redevelopment project, identifying and preserving Ottawa’s distinct heritage resources and through funding to cultural facility community partners.
Lead Department: PRC
SC Oversight: CPSC
Strategic Objective Performance Measure(s)
HC4-A: Implement the milestones listed below.
· Complete the Arts Court redevelopment by Q1 2018 · Complete development of new Heritage Reference List with online accessibility by end of 2018 · Achieve 80% of recommended cultural facility operating funding (Renewed Action Plan for Arts, Heritage and Culture) by end of 2018, and 33% of
community cultural facility capital funding by end of 2018.
Page 106 of 126

Strategic Initiatives with Performance Measures
Page 107 of 126
Strategic Objective and Initiative Lead Dept. SC Oversight Performance Measure(s):
HC4 – Support Arts, Heritage, and Culture
41 – Implementation of Renewed Action Plan for Arts, Heritage and Culture
Support maintenance, improvement and development of local community cultural facilities as per action number two of the Council-approved Renewed Action Plan for Arts, Heritage and Culture (2013-2018); and provide funding to community cultural partners that manage, administer and program new and newly expanded cultural facilities as per action number three of the Renewed Action Plan. The Renewed Action Plan includes support for La Nouvelle Scène and other actions that contribute to cultural, economic, social and environmental pillars while supporting the health and well-being of Ottawa's local cultural sector.
PRC CPSC
41-A: Allocate community cultural facility capital funding commitments of $250K per year 2015 to 2018 in support of action number two of the Council-approved Renewed Action Plan for Arts and Heritage and Culture.
41-B: Achieve 50% of the investment recommended as cultural facility operating funding in action number three of the Council-approved Renewed Action Plan for Arts, Heritage and Culture by the end of 2015; achieve 60% by the end of 2016, 70% by the end of 2017 and 80% by the end of 2018.

Strategic Objective: HC5 – Develop a Taxi Strategy
To promote public safety, accessibility, and consumer protection within the taxi industry.
Lead Department: EPS
SC Oversight: CPSC
Strategic Objective Performance Measure(s)
HC5-A: Increase the progress made in completing a Taxi Strategy to 100% by Q1 2016.
Strategic Initiatives with Performance Measures
Page 108 of 126
Strategic Objective and Initiative Lead Dept. SC Oversight Performance Measure(s):
HC5 – Develop a Taxi Strategy
44 – Taxi Regulation Review
A comprehensive review of the Taxi By-law and limousine regulations necessary to respond to Council directives and the recent increase in illegal taxi services being provided through the use of technological platforms and other service delivery models.
EPS CPSC
44-A: Increase the progress made in the assessment of current taxi and limousine regulations, and a comparison to best practices, to 100% by Q1 2016.
44-B: Increase the progress made in the completion of stakeholder consultation on new taxi and limousine regulations, to 100% by Q1 2016.

Strategic Initiatives – Specific Needs per Project ($000s)
Legend: WIP = Work in Progress, C = Capital, O = Operating, FTEs (P) = Full Time Employees (Permanent), CB = Already reported in capital budget,
R = Source of funding is the Rate Budget, DC = Development charges not included
Page 109 of 126
Strategic Initiative Lead Dept.
SC Oversight
2014 Existing WIP (C)
($000s)
2015 (C)
($000s)
2016 (C)
($000s)
2017 (C)
($000s)
2018 (C)
($000s)
2014 Base
Funding
($000s)
2015
(O)
($000s)
2016
(O)
($000s)
2017 (O)
($000s)
2018 (O)
($000s)
FTEs (P)
29 – Inclusive Community Initiative
CSS CPSC 500 525 525 525 525
30 – Community and Social Services Partnership Capital Funding
CSS CPSC 300 300 300 300
31 – Modernization of Recreation Services
PRC CPSC 25 25 25 25
32 – Revise Parks, Recreation and Cultural Services Facility Allocation Policy
PRC CPSC
33 – Develop a Sport Strategy
PRC CPSC

Page 110 of 126
Strategic Initiative Lead Dept.
SC Oversight
2014 Existing WIP (C)
($000s)
2015 (C)
($000s)
2016 (C)
($000s)
2017 (C)
($000s)
2018 (C)
($000s)
2014 Base
Funding
($000s)
2015
(O)
($000s)
2016
(O)
($000s)
2017 (O)
($000s)
2018 (O)
($000s)
FTEs (P)
34 – Recreation Major/ Minor Capital Partnership
PRC CPSC 1,030 1,030 1,030 1,030
35 – Parks and Recreation Facility Upgrades
PRC CPSC 880 2,000 2,000 2,000
36 – Community Rinks PRC CPSC 80 80 80 80
37 – Targeted Low-Income Recreation Subsidies
PRC CPSC 50 50 50 50
38 – Ten Year Housing and Homelessness Plan
CSS CPSC 14,000 16,000 16,000 16,000 16,000
41 – Implementation of the Renewed Action Plan for Arts, Heritage and Culture
PRC CPSC 1,000 1,106 1,106 1,106 1,106
44 – Taxi Regulation Review
EPS CPSC 225 75 0 0

Page 111 of 126

Section 8: Transportation Committee (TRC) pages 112 to 125
Page 112 of 126

Page 113 of 126

Section 8: Transportation Committee (TRC) The material in this section outlines the proposed strategic objectives and associated performance measures followed by the associated strategic initiatives. Where a Standing Committee or the Transit Commission is proposed to have oversight over a strategic initiative but not its associated strategic objective, this strategic objective and its associated performance measure(s) is provided for ease of reference.
Strategic Priority – Transportation and Mobility (TM)
TRC Oversight over four Strategic Objectives and ten Strategic Initiatives under this Priority
Strategic Objective: TM1 – Build a world class environmentally sustainable light rail transit system
Implement a financially, operationally and environmentally sustainable light rail transit system that efficiently connects all areas of the city in 2018 and beyond.
Lead Department: RIO
SC Oversight: TRC
Strategic Objective Performance Measure(s)
TM1-A: Implement 100% of the initiatives required to prepare the City for the O-Train’s Confederation Line by May 2018 and Stage 2 readiness.
Page 114 of 126

Strategic Initiatives with Performance Measures
Page 115 of 126
Strategic Objective and Initiative Lead Dept. SC Oversight Performance Measure(s):
TM1 – Build a world class environmentally sustainable light rail transit system
5 – Light Rail Transit Stage 2 Readiness
Completing Environmental Assessments for Stage 2 Light Rail Transit and stewarding the Federal and Provincial application process. The Environmental Assessments include: Western Corridor LRT (Tunney's Pasture to Baseline), West LRT Extension (Lincoln Fields to Bayshore), O-Train’s Trillium Line extension to Riverside South, and the East LRT from Blair Station to Trim Road. This will support the need as identified in the Transportation Master Plan approved by Council in November of 2013.
Stage 2 Office
FEDC/
TRC
5-A: Progress toward completion of three Environmental Assessments to 70% by end of 2015 and 100% by Q3 2016.

Strategic Objective: TM2 – Provide and promote infrastructure to support safe mobility choices
Improve and promote mobility choices through initiatives, as outlined in Phase 1 of the Transportation Master Plan, to increase the safety and viability of all modes of travel, including cycling and walking.
Lead Department: PGM
SC Oversight: TRC
Strategic Objective Performance Measure(s)
TM2-A: Implement 100% of the initiatives aligned with Phase 1 of the Transportation Master Plan by the end of 2018.
Strategic Initiatives with Performance Measures
Page 116 of 126
Strategic Objective and Initiative Lead Dept. SC Oversight Performance Measure(s):
TM2 – Provide and promote infrastructure to support safe mobility choices
6 – Transportation Master Plan Phase 1 Road Projects (2015-2018)
Progress in completing all road network improvement projects identified in Phase 1 of the Transportation Master Plan (TMP).
PGM TRC/
ARAC
6-A: Complete 75 percent of built Phase 1 TMP road projects by Q4 2018.

Page 117 of 126
Strategic Objective and Initiative Lead Dept. SC Oversight Performance Measure(s):
TM2 – Provide and promote infrastructure to support safe mobility choices
7 – Transportation Master Plan Phase 1 Cycling Projects (2015-2018)
Progress in completing identified Cycling network improvement projects in Phase 1 of the Transportation Master Plan (TMP).
PGM TRC
7-A: Complete 100 percent of the identified built Phase 1 TMP Cycling projects by Q4 2018.
TM2 – Provide and promote infrastructure to support safe mobility choices
8 – Transportation Master Plan Phase 1 Pedestrian Projects (2015-2018)
Progress in completing the identified pedestrian network improvement projects in Phase 1 of the Transportation Master Plan (TMP).
PGM TRC
8-A: Complete 100 percent of the identified built Phase 1 TMP Pedestrian projects by Q4 2018.

Strategic Objective: TM3 – Integrate the rapid transit and transit priority network into the community
Integrate the rapid transit and transit priority network into the community, through initiatives that accommodate increased pedestrian activity expected as a result of the LRT Project, and to promote pathway and community connectivity.
Lead Department: PGM
SC Oversight: TRC
Strategic Objective Performance Measure(s)
TM3-A: Increase or maintain the number of cyclists who cycle to transit (bikes parked at stations) annually during the Term of Council.
Strategic Initiatives with Performance Measures
Page 118 of 126
Strategic Objective and Initiative Lead Dept. SC Oversight Performance Measure(s):
TM3 – Integrate the rapid transit and transit priority network into the community
9 – Community Pathways and Connections Program
To promote pathway and community connectivity to support safer, more convenient, and comfortable access to transit and community facilities via walking, cycling and other active modes of transportation.
PGM TRC
9-A: Achieve 70% of project/ km in construction phase of new facilities within 2 years of initial funding for each particular project.

Page 119 of 126
Strategic Objective and Initiative Lead Dept. SC Oversight Performance Measure(s):
TM3 – Integrate the rapid transit and transit priority network into the community
11 – Queen Street Streetscaping
Enhancements for Queen Street to improve the pedestrian environment and accommodate increased pedestrian activity expected as a result of the Confederation Line project.
RIO TRC
11-A: Complete 100% of the Queen Street Streetscaping enhancements by December 2017.

Strategic Objective: TM4 – Improve safety for all road users
Foster a safer environment for all road users including cyclists and motorcyclists, motorists and pedestrians by developing and implementing safety enhancements and improvements. Further gains in safety will be made by influencing resident awareness and behaviors through Safer Roads public education efforts.
Lead Department: PW
SC Oversight: TRC
Strategic Objective Performance Measure(s)
TM4-A: Implement 100% of the initiatives aligned with improving roads safety by the end of 2018.
Strategic Initiatives with Performance Measures
Page 120 of 126
Strategic Objective and Initiative Lead Dept. SC Oversight Performance Measure(s):
TM4 – Improve safety for all road users
12 – Downtown Ottawa Truck Tunnel Feasibility Study
To examine the feasibility of constructing a downtown truck tunnel, linking the Macdonald-Cartier Bridge and Nicholas Street/Highway 417. This initiative will be cost-shared 50% with the Ministry of Transportation.
PGM TRC
12-A: Increase the completion of the study to 100% and present findings to Transportation Committee in Q1 2016.
TM4 – Improve safety for all road users
13 – Cycling Safety Improvement Program (CSIP)
The Cycling Safety Improvement Program (CSIP) is a customized process that combines traffic engineering, observed behaviours, and risk mitigation measures to enable road safety improvements to benefit cyclists at 10 locations per year.
PW TRC
13-A: Complete 10 cycling safety enhancements/upgrades per year.

Page 121 of 126
Strategic Objective and Initiative Lead Dept. SC Oversight Performance Measure(s):
TM4 – Improve safety for all road users
14 – Winter Improvements for Cyclists
Winter maintenance improvements are identified for a 40 km winter cycling network centered on the downtown core. Winter maintenance proposals identified in the 2013 Council-approved Cycling and Pedestrian Plans are the source of the initiative’s work plan; work is slated to begin winter 2015/2016.
PW TRC
14-A: Maintain the winter cycling network (according to 2003 Council approved Maintenance Quality Standards) for 100% of identified winter events per year.
14-B: Develop 100% of the Cycling Network Patrol Program by Q4 2017.
TM4 – Improve safety for all road users
15 – Traffic, Pedestrian and Road Safety Enhancements
To enhance pedestrian safety, mobility and resident engagement within the City of Ottawa through the development and implementation of pedestrian countdown signals and roadway modifications and improvement initiatives for all residents. This would also include traffic calming measures, identified for each Ward, such as flexible posts and speed display boards. PW
TRC/
ARAC
15-A: i) Increase the percentage of signalized intersections with accessible pedestrian signals (APS) to 70% by Q4 2018.
ii) Increase the percentage of signalized intersections with pedestrian countdown signals (PCS) to 100% by Q4 2018.
15-B: Enhance pedestrian safety and mobility at one stand-alone intersection per year.
15-C: i) Develop a Traffic Calming Measures Implementation Plan in each Ward (in consultation with each Ward Councillor).
ii) Implement 100% of the work identified in each Ward's Implementation Plan per year.
15-D: Install 5 red light traffic cameras per year.

Strategic Initiatives – Specific Needs per Project ($000s)
Legend: WIP = Work in Progress, C = Capital, O = Operating, FTEs (P) = Full Time Employees (Permanent), CB = Already reported in capital budget,
R = Source of funding is the Rate Budget, DC = Development charges not included
Page 122 of 126
Strategic Initiative Lead Dept.
SC Oversight
2014 Existing WIP (C)
($000s)
2015 (C)
($000s)
2016 (C)
($000s)
2017 (C)
($000s)
2018
(C)
($000s)
2014 Base
Funding
($000s)
2015
(O)
($000s)
2016
(O)
($000s)
2017 (O)
($000s)
2018 (O)
($000s)
FTEs (P)
5 – Light Rail Transit Stage 2 Readiness
Stage 2
Office
FEDC/ TRC
3,275 1,000 CB 4,000
CB 51,000
CB 201,000
CB 872 200 200 200 200
6 – Transportation Master Plan Phase 1 Road Projects (2015-2018)
PGM TRC/ ARAC
1,757DC,
CB 823 DC,
CB 2,200
DC, CB 2,265 DC,
CB
7 – Transportation Master Plan Phase 1 Cycling Projects (2015-2018)
PGM TRC 2,040 DC 2,040
DC 2,040
DC 2,040 DC
8 – Transportation Master Plan Phase 1 Pedestrian Projects (2015-2018)
PGM TRC 1,125 DC 1,125
DC 1,125
DC 1,125 DC

Page 123 of 126
Strategic Initiative Lead Dept.
SC Oversight
2014 Existing WIP (C)
($000s)
2015 (C)
($000s)
2016 (C)
($000s)
2017 (C)
($000s)
2018
(C)
($000s)
2014 Base
Funding
($000s)
2015
(O)
($000s)
2016
(O)
($000s)
2017 (O)
($000s)
2018 (O)
($000s)
FTEs (P)
9 – Community Pathways and Connections Program
PGM TRC 2,975 1,610 4,140 2,875
11 – Queen Street Streetscaping
RIO TRC 8,400 6,450 950 0
12 – Downtown Ottawa Truck Tunnel Feasibility Study
PGM TRC 750 0 0 0 0
13 – Cycling Safety Improvement Program (CSIP)
PW TRC 105 105 105 105 155 155 155 155 155
14 – Winter Improvements for Cyclists
PW TRC 200 200 200 200
15 – Traffic, Pedestrian and Road Safety Enhancements
PW TRC/ ARAC
2,800 2,800 2,800 2,800 100 100 100 100

Note 1
This is an illustration of the City of Ottawa’s Strategy Map, depicted as a house (page 4 of this document).
The roof of the house displays the City of Ottawa's 12 Long-Term Sustainability Goals. Note that the name of the ‘Energy’ long-term sustainability goal has been updated to ‘Renewable Energy’.
Underneath the roof is the Term of Council Vision.
The levels under the Term of Council Vision represent the balanced scorecard perspectives. Listed from top to bottom, they are:
· Constituents and Stakeholders · Services and Programs · Process and People
Process
· Budget
Each perspective except the first is associated with one of the seven Term of Council Priorities and its objectives.
The “Constituents and Stakeholders” perspective is associated with three objectives for three types of constituents and stakeholders:
· Residents: Objective C1 – “Contribute to the improvement of my quality of life” · Enterprises: Objective C2 – “Enable the achievement of our short and long term success” · Visitors: Objective C3 – “Provide a compelling, vibrant destination”
The “Services and Programs” perspective is associated with four Term of Council Priorities and their objectives:
· Economic Prosperity Priority: Objective EP1 – Promote Ottawa; EP2 – Support growth of local economy · Transportation & Mobility Priority: Objective TM1 – Build a world-class environmentally sustainable light rail transit system; TM2 – Provide and promote
infrastructure to support safe mobility choices; TM3 – Integrate the rapid transit and transit priority network into the community; TM4 – Improve safety for all road users; TM5 – Ensure reliable and safe transit services
Page 124 of 126

· Sustainable Environmental Services Priority: Objective ES1 – Support an environmentally sustainable Ottawa; ES2 – Reduce long-term costs through planned investment and staging of diversion and conservation strategies
· Healthy & Caring Communities Priority: Objective HC1 – Advance equity and inclusion for the city’s diverse population; HC2 – Revitalize recreation services; HC3 – Create new affordable housing options; HC4 – Support Arts, Heritage and Culture; HC5 – Develop a Taxi Strategy
The “Process and People” perspective is associated with two Term of Council Priorities and associated objectives:
· Service Excellence Priority: Objective SE1 – Improve the client experience through established service expectations; SE2 –Improve access to City services through digital service delivery ; SE3 – Develop positive, effective, and engaged employees committed to the service promise
· Governance, Planning & Decision-Making Priority: Objective GP1 – Strengthen public engagement; GP2 – Advance management oversight through tools and processes that support accountability and transparency
The “Budget” perspective is associated with one Term of Council Priority and its objectives:
· Financial Sustainability Priority: Objective FS1 – Demonstrate sound financial management; FS2 – Align strategic priorities to Council’s financial targets
Page 125 of 126

Appendix B
2011-2014 City Balanced Scorecard Results Summary
This is the final report to Council on the results of the 2011-2014 City Balanced Scorecard.
Its purpose is to report to Council and the public on the final results of the performance measures for the strategic objectives and initiatives in the 2011-2014 City Strategic Plan.

2011-2014 City Balanced Scorecard Results Summary Economic Prosperity • Events Ottawa, a partnership between the City of Ottawa and Ottawa Tourism, achieved its target of increasing the number of major events won by the City to
5 per year. Since its inception, Events Ottawa has secured 30 events; 16 have taken place and fourteen will take place over the next four years. • Council enacted by-laws to designate two Community Improvements Programs (CIP) areas; an Orléans CIP designed to create new knowledge-based jobs in
the Orléans community and a Carling Avenue CIP intended to stimulate urban renewal for the portion of Carling Avenue between Greenbank Road and Bayshore Drive. Uptake and interest in the Orléans CIP has been positive with three formal applications received, one of which was approved by Council in March 2014.
• The Capital Investment Track Program guides strategic investments through all aspects of City interface, including planning approvals, infrastructure needs, and operating permits. Since 2014, six companies have been enrolled in the program, surpassing the target of four.
• The Economic Development and Innovation (EDI) department has been successful during 2014 in completing initiatives related to the creation of the Innovation Centre at Bayview Yards. This includes securing a $15 million funding agreement from the Province of Ontario. An application was also made to the Federal Government for $19.9 million for programming. The Innovation Centre is on target for opening in 2016.
• The City’s goal is to make Ottawa the epicentre of Canada’s 150th anniversary celebrations in 2017. The Mayor's 2017 Task Force was developed to take the lead on all 150th Anniversary-related initiatives undertaken by the City. The City has developed a comprehensive business plan and has already secured more than 30 conferences, including the 2017 national and provincial conferences of municipal leaders, the Tim Hortons Roar of the Rings and the Canadian Video Games Awards for 2017. There is also great public interest in a Grey Cup and a Winter Classic NHL game at Lansdowne that same year. Throughout the Term of Council, the Economic Development and Innovation (EDI) department fulfilled 100 per cent of its work plan for Sesquicentennial initiatives as per the Department’s annual work program.
• Since the restructuring of the Ottawa Centre for Regional Innovation (OCRI) as Invest Ottawa, Invest Ottawa has been successful in delivering a one-stop shop dedicated to economic development programs and initiatives in the areas of entrepreneurship, business incubation, commercialization, targeted sector development, investment attraction, business retention and expansion and global trade development. Since 2013, Invest Ottawa has facilitated the creation of 2,742 jobs and assisted 308 companies in growing globally. Investments attracted to Ottawa have totalled $202.5 million and 44 missions have take place to foreign markets. In terms of entrepreneurship and incubation services, 12,625 people have attended Invest Ottawa’s entrepreneurship workshops, approximately 21,043 advisory hours were provided and 602 start-up portfolios were engaged.
• The service inventory of City programs and services available to immigrants was completed on time by Q4 2012. In 2012, the City of Ottawa Immigration Network was struck and the City hosted the first ever Ottawa Immigrant Entrepreneurship Awards. In 2013 Council approved the City of Ottawa Municipal Immigration Strategy, and the target of increasing the number of implemented actions of this Strategy to 70 per cent by the end of 2014 was met.
Transportation and Mobility • The Ottawa Light Rail Transit (OLRT) project successfully achieved 100 per cent of its key project milestones by February 2013. Other achievements seen in
2014 were work on widening Highway 417, the O-Train expansion, the Coventry multi-use pathway bridge, Belfast Yard and the connector tunnel, and the completion of the Queen Street watermain replacement. Mining of the 2.5 kilometre tunnel for the Confederation Line project is proceeding on time and on budget.
1

2011-2014 City Balanced Scorecard Results Summary • The target of completing 100 percent of the Western Light Rail Transit (LRT) Corridor Environment Assessment study by Q1 2013 was not achieved. However,
75 percent completion had been achieved by the end of 2013. The study was deferred to address Ottawa LRT timing and priorities and to undertake a more detailed, Council-approved, review of corridor options for the Western LRT line. Council selected the Richmond Underground Corridor for the Western LRT in July 2013. Approval of the Transportation Master Plan in late 2013 increased the scope of this initiative, adding the Western LRT extension to include light rail from Lincoln Fields to Bayshore Station. The City will be able to move forward with LRT construction after the environmental assessments for the original section (Bayview to Baseline) and new extension are completed. In November 2014, a 100-day Working Group was launched so that the National Capital Commission (NCC) and the City of Ottawa could focus on solutions for the segment between Dominion and Cleary Stations. The study remains on schedule to be completed for the proposed new target to complete the Environmental Assessment process and documentation is Q2 2015.
• The target to increase the percentage of Ottawa intersections equipped with audible signals to 55 per cent of the 1,114 signalized intersections in 2012 was exceeded, with an actual result of 59 per cent in 2012 and 68 per cent in 2014.
• In 2014 the City tendered 95 per cent of scheduled Ottawa on the Move construction programs related to the integrated road, sewer and water program, road resurfacing, cycling infrastructure, sidewalks, and bridges and structures, exceeding its goal of 85 per cent.
• The City completed 90 per cent of project milestones for the O-Train service expansion in 2014, just short of its target to complete 100 per cent. The $59 million O-Train expansion project was delayed during this reporting period. Implementation of the Centralized Traffic Control system and all required testing continued through the end of 2014 and into Q1 2015. The expanded service began on March 2, 2015 with four trains operating simultaneously providing increased capacity. While some service interruptions were experienced during the week of the launch, the system is now operating reliably and headways and trip times continue to improve.
• The bus route optimization savings initiative was completed, with annual savings of $19.5 million starting in 2011 achieved. • The effort to increase customer connections with OC Transpo made through social media channels continues to offer great opportunities. Customer Twitter
connections increased in 2014 by 87%. This is attributed to active attention and interaction with customers. • A comprehensive Employee Engagement Strategy for OC Transpo was launched in Q3 2012, ahead of the Q4 target. • At the close of 2014, OC Transpo ridership reached 97.1 million trips, which was slightly lower than 2013. When compared to the total hours of service
planned in 2014, the overall Ridership per Revenue Service hour fell to 54.8. This is still an increase of 3.3 per cent from the 53 riders set in 2010, however is below the original target of 61. The City’s original goal was to demonstrate a more sustainable transit service by increasing the number of passengers per ‘in-service’ hour from 53 to 61 by the end of 2014. This target however, did not anticipate Ottawa’s weak economic growth in Ottawa. Attaining this target in a slow economy, largely the result of downsizing in federal public administration, would have required a reduction in service levels, which was not the direction of the Transit Commission or City Council. Quarterly ridership levels increased slightly in the final six months of 2014 compared to 2013 levels, for the first time since 2012.
• The Double-decker integration initiative was completed on schedule in 2013 and generated an increase in seating capacity compared to an articulated bus. As targeted, the proportion of seats available to customers increased from 79 per cent to 91 per cent by Q2 2013 on trips equipped with double-decker buses.
• In 2013, the number of trips made by transit decreased by 3.2 per cent, below the annual target of 2.2 per cent. The total ridership for 2014 declined slightly from 2013 with a 0.7% decrease year over year to finish at 97.1 Million trips. The ridership in the last two quarters of 2014 showed modest increases over the same quarters in 2013, the first increases in over two years.
2

2011-2014 City Balanced Scorecard Results Summary • As measured by automated counters deployed inside the greenbelt, cycling trips increased by 3.1 per cent between May 2013 and November 2014. The
compound annual indicator growth over the 2011-2014 Term of Council is 4.5 per cent per year - greater than the overall target of 3.5 per cent for this initiative. Data on the number of trips made by walking will not be available until the next Origin-Destination survey. The exact timing for this survey is to be determined.
• In 2013, the City achieved its goal of completing eight Transit-Oriented Development (TOD) studies one year ahead of schedule. In 2013, the final four TOD studies were completed, and the supporting Official Plan and Zoning By-law amendments were approved by Council in January 2014.
• The Cycling Safety Improvement Program is intended to identify problem intersections, make recommendations for improvements, and propose a process for continuous improvement of cycling safety. Seven cycling safety enhancements and/or upgrades were completed in 2014, nine in 2013 and ten were completed in 2012. In 2015, the outstanding 4 enhancements/upgrades initiated in 2014 will be completed.
• Against a target of 10 per cent annual Cycling in the City e-newsletter readership, the actual annual increases of 9 per cent (2012), 23 per cent (2013) and 38 per cent (2014) were recorded. Over the 2011 - 2014 Term of Council there was an 85 per cent increase in readership.
• The Travel and Mobility web portal was launched in Q2 2013. The Travel and Mobility page on Ottawa.ca brings together all the resources that citizens would need to get around the city. However, use of the Travel and Mobility page has remained constant at 24,000 hits over 2014. The reason for this result is due to search engines that take them directly to one of the many subpages - like Carpooling, Construction, Cycling, Road Closures and Traffic Reports and are skipping the main page.
• The Downtown Moves study was completed early in 2013. Following the approval of the study, the first strategic action in the study – the functional design of Queen Street – was implemented starting in Q3 2013.
Environmental Stewardship • The target to start 100 per cent of the projects identified in the Ottawa River Action Plan (ORAP) by the end of 2015 was completed two years ahead of
schedule in 2013. All 17 projects, aimed at improving the quality of the Ottawa River, have been started and eight projects are completed. One of these, the Real Time Control Project, has significantly reduced the volume of combined sewage overflows to the Ottawa River, and it was awarded the 2012 Project of the Year by the Ontario Public Works Association. Several shorter term ORAP projects remain ongoing and are expected to be complete in 2015, while the longer term projects will remain ongoing beyond 2015. The Combined Sewage Storage Tunnel (CSST) project is a keystone project of the Ottawa River Action Plan that will take the City beyond provincial targets for the capture and treatment of combined sewer flows.The City secured Federal and Provincial funding for the CSST project in 2014 and 2015.
• By the end of 2013, the City had increased the percentage of Ottawa households within 400 meters of protected urban green space to 100 per cent, surpassing the target of 90 per cent.
• The City met its 2013 goal of maintaining the percentage of area covered by forest canopy at 30 per cent for the city as a whole (rural, urban and suburban areas) and 20 percent for urban and suburban areas. In 2013, forest canopy was approximately 31 per cent for the city as a whole and 20 per cent for urban and suburban areas. An updated assessment of forest cover is awaiting delivery of the 2014 aerial photography and land cover mapping in Q2 2015.
• The target to increase the percentage of rivers and streams in Ottawa that are monitored and reported against Canadian Council of Ministers of the Environment (CCME) water quality objectives to 80 per cent by the end of 2014 was achieved in 2012.
3

2011-2014 City Balanced Scorecard Results Summary • Over the 2011-2014 Term of Council, on average 110,714 trees were planted annually, surpassing the overall target. All through the Term, the City focused on
replacing trees lost to the Emerald Ash Borer, continued to increase forest cover in the urban and suburban neighbourhoods, and implemented rural reforestation plantings in partnership with local conversation authorities.
• The target of increasing the percentage of new urban dwelling units provided through intensification to an average of 38 per cent per year was exceeded in 2014, with a result of 54 per cent.
• On May 28, 2014, Ottawa City Council approved an updated Air Quality and Climate Change Management Plan (AQCCMP) as the Environmental Action of the Year (EAY).
• The 2013 target of completing 100 per cent of the Municipal Waste Management Plan deliverables was met. The City of Ottawa initiated development of its 30-year Municipal Waste Management Plan in the summer of 2011. With the tabling of the Source Separated Organics (SSO) audit and the resultant SSO program review, Phase 2 and 3 are deferred until the program review is completed.
• Over the last half of 2014, the number of applications with a completed green checklist has been steady at 10 per cent of all site plan applications. Market forces directly impact on whether-or-not an applicant is willing to invest in green features. Residential and mixed-use applications in the urban core are more likely to incorporate green features in their buildings as part of an environmentally-friendly lifestyle and selling feature.
• The City successfully conveyed information related to solid waste service level changes to more than 93 per cent of home owners, renters, and businesses by the end of 2012 through the initial distribution wave via Canada Post. The remaining 7 per cent were delivered via City staff or through direct mailings.
• The percentage of residential waste diverted via the curbside collection program increased by 7 per cent over the term of council from 43.7 per cent in 2011 (prior to the service level change) to 51 per cent in 2014. Continued and consistent outreach, advertising, and education must be delivered to residents to ensure program compliance and effectiveness, and so that residents place their material in the correct bin to maximize diversion.
• The goal of ensuring that 100 per cent of eligible City facilities have access to recycling bins by the end of 2014 was achieved in Q4 2012, two years ahead of schedule.
• In 2011, Council committed to updating the current Term of Council priorities, allocating $750,000 annually for environmental actions. An Environmental Strategy Status report was provided to Committee/Council in May 2014. The report highlighted successful environmental initiatives that had been done during the 2010-2014 Term of Council such as the Ottawa River Action Plan, updates to the OP, Transportation Master Plan (including Pedestrian and Cycling Plans) and more.
• The City increased the percentage of Urban Natural Areas identified for protection to 100 per cent by the end of 2013, meeting the target. • Ninety-seven per cent of the Environmental Quality Wastewater Management System (EQWMS) action items addressing Priority A risks were completed by the
end of 2014. The remaining 3 per cent is currently being addressed, and will likely be completed by 2017 due to construction lead times. • The target of decreasing the number of major non-conformances per annual Environmental Quality Management System (EQMS) internal audit to fewer than
50 per year was achieved. In 2014, six wastewater processes were audited for conformance to the EQMS with zero major non-conformances at year-end. • The target under the Drinking Water Quality Management System (DWQMS) initiative to decrease the number of major non-conformances to fewer than five
per annual audit was achieved, with an actual result of zero. • The City invested 100 per cent of the $32 million allocated to the West End Flooding Action Plan by the end of 2014.
4

2011-2014 City Balanced Scorecard Results Summary • The City completed 35 per cent of the Stormwater Management Retrofit Master Plan by Q4 2014, below the target of 70 per cent. Public consultation was
undertaken for the Eastern Subwatersheds Stormwater Management Retrofit Study in 2014. This initiative will continue into the next Term of Council. • The City increased the percentage of the natural water systems inventoried and assessed by 12 per cent by the end of 2014, surpassing the overall goal of 10
per cent. Increasing the inventory and assessment of creeks within the City greatly improves the City's understanding of these natural water systems, which leads to more informed decision making.
• The City met its goal of establishing a risk assessment approach and providing recommendations for stormwater management by the end of 2012. The key benefits the Wet Weather Infrastructure Management Plan provides are: flood prevention, capacity for growth, and pollution control.
• The target of completing 100 per cent of the Subwatershed Plans and Environmental Management Plan deliverables by 2014 has not been met. The Mud Creek Subwatershed Study is now targeted for completion in Q2 2015 and Jock Reach 2 is targeted for completion in Q4 2015. Competing priorities, changes to scope and staff turnover all contributed caused to the delay. Over the Term of Council, PGM completed the following subwatershed studies and environmental management plans: the Cardinal Creek Subwatershed Study; the Urban Expansion Study Area 11 Environmental Studies; the O'Keefe Drain Environmental Management Plan; and the East Urban Community Environmental Management Plan.
Healthy and Caring Communities • The Lansdowne redevelopment is a public-private investment in a revitalized stadium, underground parking garage, retail area and new 18-acre urban park.
Lansdowne has been transformed into a modern, urban destination sensitive to the area’s heritage and showcasing Council’s strategic priorities. The Lansdowne Urban Park Revitalization project proceeded as planned with substantial completion by the end of 2014.The Lansdowne Park Stadium and Parking Redevelopment project proceeded as planned with major construction activities on the public areas completed by the end of 2014, with some final landscaping and finishing work to be completed in spring 2015.
• The City achieved its 2013 target of completing the comprehensive Financial Sustainability Review in the area of Parks, Recreation and Cultural Services (PRCS). PRCS is in the process of a consistency review for services such as registered programs, memberships and admissions. The department will phase in its implementation beginning with Fall programming 2015.
• The total number of City of Ottawa staff trained in applying the Equity and Inclusion Lens in their daily work at the end of 2014 is 1,263 (including 114 managers), well above the 2014 target of 400 staff and 100 managers. By ensuring that relevant City staff are trained to use the Lens, the City will be able to better accommodate the needs of a diverse and aging population.
• All of Accessibility for Ontarians with Disabilities Act (AODA) regulations and associated timelines were met by the end of 2014. New AODA requirements and their associated timelines for 2015 and beyond remain ongoing.
• Since 2012, the City achieved its target of completing 100 per cent of Community Development Funding (CDF) contracted sustainability, evaluation and neighbourhood outcomes for the CDF for Priority Neighbourhoods initiative. In 2015, the City will continue with engagement activities across the 19 neighbourhoods, including Good Food markets, community gardens and community events.
• All of the 2014 funds from the Community and Social Services Partnership Capital Funding have been allocated, meeting the 2014 target. Council had committed to a total investment of $900,000 from 2012-2014 towards Partnership Capital Funding.
5

2011-2014 City Balanced Scorecard Results Summary • Mayor Jim Watson hosted the one-day Seniors Summit at City Hall on October 3, 2011. The event provided a forum for seniors to discuss issues important to
them as well as practical solutions with elected officials and staff from the City of Ottawa. Eighty-nine per cent of the 170 participants in the 2011 Seniors Summit reported that they were satisfied with the content of the Summit, surpassing the 2012 target of 80 per cent. The City's Older Adult Plan (OAP) was developed in 2012 and approved by Council on October 24, 2012, ahead of the year-end 2012 target. The Plan was the result of a very successful community engagement process involving more than 700 residents. It sets out a long-term vision and goals and includes 74 actions to be completed before the end of 2014. At the end of 2014, 82 per cent (61 out of 74 actions) of all Older Adult Plan actions were implemented, surpassing the target of 70 per cent. Another eight actions are expected to be completed by the end of Q2, 2015.
• The City completed accessibility audits on 94 per cent of major City facilities by the end of 2014, exceeding its goal of 90 per cent. The Program’s focus was to ensure that all major City facilities were audited by the end of 2014. Of approximately 1,217 City facilities (including park structures), 831 underwent a complete accessibility audit. A total of 53,476 barriers were identified, and 8,869 have been removed.
• The City of Ottawa Child Care Registry & Waitlist was fully implemented in June 2014. The wait list management system is part of the Child Care Modernization Framework, which was approved by Council on February 27, 2013 and responds to provincial requirements for child care modernization. There were 13,214 children on waitlist for a full fee space and 4,800 children on the waitlist pre-approved for a child care fee subsidy and waiting for a space to become available as of the end of 2014.
• In 2014, the City surpassed targeted participation levels for registered recreation programs with 220,493 people registered compared to the target of 212,993. The target was exceeded by 2.9 per cent. In 2014, the City surpassed targeted participation levels for senior-specific recreation programs, with 12,159 older adults registered compared to the target of 8,969. This represents an increase of 35.6 per cent (or 3,190 participants) over the baseline year.
• Minor and major recreation capital projects earned a Return on Investment (ROI) of 323 per cent in 2014, well above the target of 50 per cent. The Community Partnership Major and Minor Capital Program implements capital improvements to parks and recreation facilities on a cost-shared basis between the City and community groups.
• The Sens Rink of Dreams was completed in 2012. The refrigerated outdoor skating facility, which opened on January 25, 2012, is situated in Marion Dewar Plaza at Ottawa City Hall.
• The $14 Million Housing and Homelessness Investment Plan was approved by council in 2012. This facilitated a steady increase in the number of individuals receiving support from 355 in 2011 to 1,364 in 2014, almost double the target of 700.
• The overall target to increase the number of households granted the Ontario Disability Support Program (ODSP) by 600 (2011-2014) has been exceeded by 51 per cent. Since January 2011, 907 residents have been awarded ODSP through the ODSP Application Support Worker Program, representing a cumulative increase of $5.1 million for low-income residents in Ottawa.
• The Youth Futures Program gives youth from low-income families living in social housing or on social assistance an opportunity to participate in a unique program of leadership, paid employment and post-secondary mentorship. Since 2011, over 970 low-income youth have applied, 257 were accepted, and 252 have graduated from the program. Its success is a result of partnerships between the City of Ottawa, Ottawa Community Housing and the University of Ottawa with support from many additional partners including community groups, educational organizations and companies in the private sector.
6

2011-2014 City Balanced Scorecard Results Summary • In 2014, 57 units were approved for Phase I of Longfields, exceeding the 2014 target of 20 new affordable housing units. From 2011-2014, a total of 744 new
units were approved, completed or are under construction with priority given to supportive housing, accessibility and units for larger families with accessibility requirements. Of those units, 179 were earmarked for seniors, 186 for supportive housing and 379 were for individual households including families.
• Consistent with the recommendations in the Council-approved Ten Year Housing and Homelessness Plan, City staff achieved its objective of creating an interdepartmental committee in 2014. The group’s mandate is to provide the internal coordination required to implement the Plan’s objectives under three priorities including: everyone has a home, people get the support they need and working together.
• This social housing repairs plan initiative is part of the City’s Ten Year Housing and Homelessness Plan. Ottawa's social housing stock has an estimated value of $3 billion and provides homes for over 22,000 households. It is imperative that these publicly-funded assets be maintained in a good state of repair and that housing is safe and secure for residents. A report presented to Council in Q4, 2015 will outline the capital requirement shortfall along with recommendations as how best to address these needs. The original target of Q4, 2014 to present the report was not achieved due to longer than expected data verification period that will help to ensure integrity of the forecasting of the repair needs. Recognizing that there is a shortfall in funding for social housing capital repair, Council approved an innovative tax reform initiative in Q4 2014, which exempted Ottawa Community Housing from municipal and education taxes, resulting in an additional $3.1M base funding for capital repairs.
• After the first two years (2013 and 2014) of a six-year implementation period, the City has achieved 58 per cent of the Renewed Action Plan for Arts, Heritage and Culture's recommended base operating investment total, and is ahead of its target of 30 per cent.
• As of the end of 2014, 80 per cent of the planning phase of the Arts Court Redevelopment Project was completed. Accomplishments in 2014 included selection of the preferred proponent for the development rights at Arts Court. Negotiations to finalize the legal and project agreements also were initiated. This $34 million capital project will include a new and larger Ottawa Art Gallery (OAG); a new 250-seat multi-purpose and film screening room within the new OAG space; a new 120-seat black box theatre and four classrooms for the University of Ottawa; and repurposing of existing space to the major media arts partners.
Service Excellence • In 2013, the City completed the installation of the new meter reading system, under the Advanced Meter Infrastructure (AMI) project. All customers with
compatible meter readers have been updated to the new system. The AMI project has almost eliminated the need for City staff to take manual readings of water meters thereby reducing both the number of City vehicles on the road as well as operational costs. This project has reduced the percentage of customers receiving estimated water bills to 1.5 per cent by the end of 2014.
• The OpenData program has exceeded all performance targets for each of the years in the 2011-2014 term of Council. This has led to increased revenue, cost savings, improved access to services, and enhanced transparency and accountability. The number of OpenData sets per year reached 383 in 2014, above the target of 150.
• The time required to create the annual Access to Information and Privacy (ATIP) report was reduced by 80 per cent in 2013, surpassing the goal of 50 per cent by 2014.
• Between 2011 and 2014, the City of Ottawa saw rapid growth in the world of social media and developed the appropriate policies and guidelines to communicate compliance. The Corporate Communications Strategy, approved by senior management in Q1 2014, identified the need for a supporting framework for emerging technologies. The Social Media Enablement Framework was completed, including the rollout of Social Media Guidelines and a Social
7

2011-2014 City Balanced Scorecard Results Summary
Media Protocol. As part of the Strategy roll-out in 2014, social media guidelines were communicated to departments in order to address the issue of non-compliant social media accounts. An audit at the end of 2014 found an increase to a 85 per cent compliance, up from 25 per cent at the end of 2013.
• Service requests processed via all ServiceOttawa channels increased by 6 per cent in 2014, exceeding the target of five per cent. Specific accomplishments that helped contribute to the increase in service request volume through ServiceOttawa included deploying 3-1-1 technology at the Ben Franklin and Orléans Client Service Centres, to support the 3-1-1 contact centre during peak periods, and simplifying access to service requests through ottawa.ca.
• In 2014 11% of all service requests were processed by the web which is an increase over the 6% that were completed in 2013. Over the term of Council, ServiceOttawa transitioned 275 Service requests to the web and over the term of council over 90 000 service requests have been completed online.
• The 2014 Business Technology Plan was successfully completed in November 2013. It is the result of the new Information Technology (IT) Governance Model that was implemented in 2013. The plan prioritized the technology requests across the organization and clearly aligns to the City Strategic Plan.
• 2014 marked the close-out of the ServiceOttawa Projects. According to Finance, by the end of 2014 the SO program met its 2014 annual target of $4.924 million, generating a total of $40.4 million in savings and reducing the organization by 283.75 Full-Time-Equivalents.
• The OC Transpo iOS application was the first in Ottawa to incorporate real-time bus information by stop. iPhone users overwhelmingly accepted the OC Transpo - My Transit app, with over 77,000 app downloads in 2013, exceeding the target of 12,000 downloads by the end of 2014. Information requests across all platforms (Apple, BlackBerry, Android, SMS, and others) frequently exceeded 200,000 requests a day, and customer satisfaction levels with Transit technology rose sharply.
• Developers signed on for the OpenData Application Program Interface (API) key to access real-time bus data at more than twice the original projection. The target of 100 API keys approved by the end of 2014 was exceeded in 2013, with 291 approved. Developer community feedback has been very positive and the real-time bus data feed is the most popular OpenData source in Ottawa.
• The Presto distribution program achieved the target of providing 200,000 no-fee Presto cards to customers prior to the end of 2013, ahead of its 2014 target, including community and special purpose customers. The final distribution stage was the Ecopass to Presto migration which took place in August, September, and October followed by the end of the Ecopass program October 31.
• The Right-of-Way Activity Management System was completed in 2012. At the end of 2011, the City partnered with a vendor and piloted Envista software as the tool that would automate and enhance the Municipal Consent process. The software provides a number of benefits, including an integrated system for electronic circulation of drawings, tracking and reporting of information, requests for new project/permits and work planning. The software also enables real-time mapping of all construction in the City's Right-of-Way.
• The percentage of planning applications that are decided “on-time” increased to 81 per cent by the end of 2014, meeting the 2011-2014 Term of Council goal of 80 per cent.
• Enterprise Asset Management Program replaced the legacy work management system that was in use for over 15 years. The new system was successfully rolled out in March 2013. Fully integrated Maximo is the leading edge technology and first of its kind, asset management solution in Canada. Ottawa’s implementation is viewed as a pioneering effort in using technology for effective management of assets.
8

2011-2014 City Balanced Scorecard Results Summary Governance, Planning and Decision-Making • The City completed 100 per cent of the Accountability Framework recommendations, including a monthly disclosure of expenses, Gifts Registry, a Lobbyist
Registry and Lobbyist Code of Conduct (in effect since September 2012), and the addition of an Integrity Commissioner. • The target to decrease the number of times Council or Committee discussions went in-camera to fewer than 15 per year was reached, with only four in 2014.
The target for the number of confidential reports going to Committee and Council of fewer than 15 per year was reached, with a total of only one in 2014. • The time required to publish Committee and Council agendas on the City’s website was decreased by 95 per cent. There continues to be significant benefit
from reduced costs for printing, paper and overtime; improved processes for meetings; and better access to information for Council members, staff and the public.
• The 2010-2014 Mid-Term Governance Review report progressed as planned, and was approved by Council on February 13, 2013, as per the target. • The Public Engagement Strategy was completed in Q4 2013, later than the target of year-end 2012. Approved by Council in December 2013, the Strategy
establishes a common framework as well as common definitions and tools to help City departments conduct public engagement activities. At the end of 2014, an interdepartmental staff committee had been struck and an evaluation plan was developed. Staff training materials were completed, including staff guidelines and a toolkit. Presentations had also been made to all departmental management teams to discuss implementation as part of departmental practices.
• The target to complete 90 per cent of the Auditor General’s 2009 follow-up audit recommendations on corporate planning and performance management by the end of 2013 was met.
• Also, 100 per cent of the deliverables in the Corporate Planning Framework related to strategic planning were completed by the end of 2013, as per the target, and the target to complete 100 per cent of the deliverables in the Corporate Planning Framework related to performance measurement by the end of 2013 was met.
• The Comprehensive Asset Management Policy and Strategy was approved by Council and the State of the Asset Report (SOAR) was completed by Q4 2012. Council approved the adoption of a practice that will ensure that the City is making the level of investment required and applying the practices needed to keep the City's infrastructure in a state of good repair by applying a risk-based approach to investment decisions.
• Since 2012, the City completed 19 projects through the Better Neighbourhood Program (BNP) of the Neighbourhood Connection Office. In 2014, the original target of four was doubled.
• The goal of completing 80 per cent of Official Plan Review deliverables by the end of 2013 was exceeded, with 100 per cent completed with Council adoption of Official Plan Amendment (OPA) 150 in Q4 2013. Council approved the Official Plan, Transportation Master Plan (TMP), Infrastructure Master Plan, Pedestrian Plan and Cycling Plan on November 26, 2013, that will guide the City’s future land development and the growth of Ottawa’s transportation system.
• The target to increase the number of union complaints and/or grievances resolved without arbitration to more than 90 per cent annually was exceeded, at 98 per cent.
Employee Engagement • Much progress has been made on the strategic Employee Engagement priority as a whole. The City continues to strengthen workforce capacity by providing
employees with opportunities for professional growth and development resulting in a more positive and engaged workplace. Success in the Employee Engagement priority is demonstrated by the results in the 2013 Employee Engagement Survey. The Service and Accomplishment Score was 3.89, surpassing
9

2011-2014 City Balanced Scorecard Results Summary
the 3.86 target; the Career Growth and Development Score increased to 3.21 in 2013 compared to 3.17 in the 2011 survey, and above the target of 3.2; and the Recognition Score was 3.4, slightly surpassing the target increase of 3.39 percent and above the 3.3 survey score in 2011. The 2013 Employee Engagement Survey was completed between April and May 2013.
• The City of Ottawa was named one of Canada's Best Diversity Employers, one of Canada's Top 100 Employers, and one of the National Capital Region’s Top Employers in every year since 2012.
• The City achieved a 99.9 per cent retention rate in occupations that are considered difficult to fill or critical to operations in 2014, above the target of 95 per cent.
• At the end of Q4 2014, all 18 Departments had succession plans in place (successors identified and development plans activated) and are monitoring and updating their plans as required.
• Targets for participation in the Growing Leaders Program were met in 2011 and exceeded for the remaining Term of Council reporting periods. • As of December 2014 there were 89 co-op, internship and apprenticeship placements, below the 2012 target of 102. A key challenge is raising awareness
about the Co-Op Program and the benefits of hiring Co-Op students. This is being addressed by ongoing efforts to provide departments with information about this program.
• The City has made progress by increasing the representation of Visible Minorities from 5.77 per cent in 2011 to 7.05 per cent in 2014. Representation of Aboriginal Peoples and Persons with Disabilities is substantially unchanged over the Term of Council. There has been a marginal decrease in the representation of Women over the Term of Council. There has been a focus on summer students as part of our strategy and this has resulted in success showing increases in 3 groups: Visible Minorities, moving from 6.7 per cent in 2011 to 11.5 per cent in 2014, Persons with Disabilities, moving from 1.4 per cent in 2011 to 2.9 per cent in 2014, and Aboriginal Peoples moving from 1.0 in 2011 to 1.4 per cent in 2014. To further progress against this objective the City Manager established and Chairs a Diversity and Inclusion Management Working Group with managerial representatives from each department.
• Targets for staffing 90 per cent of full time continuing supervisory/management vacancies with internal candidates versus external were met in 2011 and exceeded for the remaining Term of Council reporting periods.
• The new Civic Institute of Professional Personnel (CIPP) Job Evaluation (JE) Plan was implemented in July 2014. For the Canadian Union of Public Employees (CUPE) 503 JE Plan, a Memorandum of Agreement regarding implementation was negotiated in Q4 2014 and the target implementation is 2016.
• The online Performance Development Program (PDP) tool project was delayed due to delays in the procurement process. A vendor was selected in Q1 2014 and the contract was in place in Q3 2014. Technical specifications and implementation strategy (including change management and training strategies) began in Q3 2014. The design was completed at the end of 2014 with a phased approach and release beginning in Q2 2015.
Financial Responsibility • The target to limit the percentage of annual average tax rate increase to no more than 2.5 per cent was met in 2011 and 2012, and in 2013 Council approved a
change to the target tax rate increase, reducing it from 2.5 to 2.0 per cent. The 2014 budget was approved with a 1.9 per cent average tax rate increase which met the target set by Council.
10
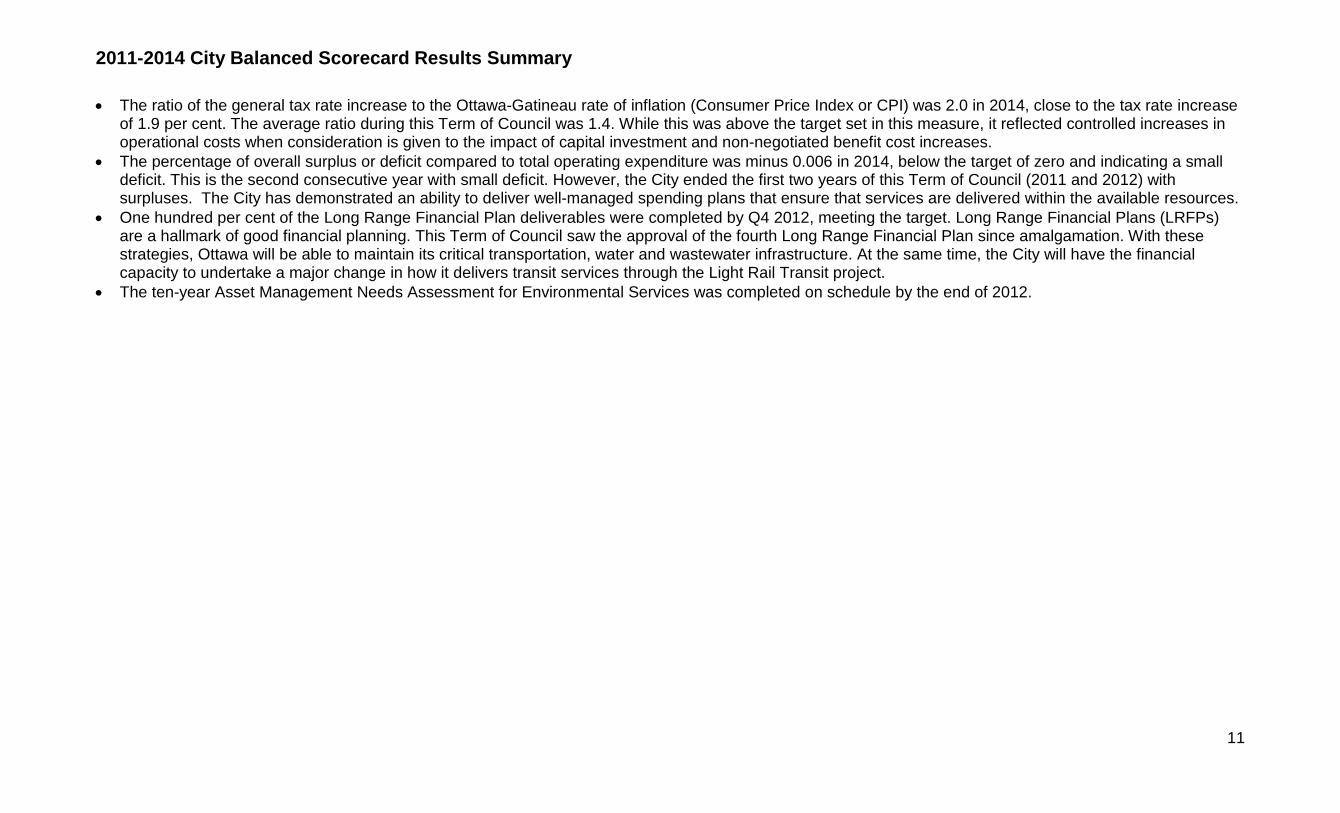
2011-2014 City Balanced Scorecard Results Summary • The ratio of the general tax rate increase to the Ottawa-Gatineau rate of inflation (Consumer Price Index or CPI) was 2.0 in 2014, close to the tax rate increase
of 1.9 per cent. The average ratio during this Term of Council was 1.4. While this was above the target set in this measure, it reflected controlled increases in operational costs when consideration is given to the impact of capital investment and non-negotiated benefit cost increases.
• The percentage of overall surplus or deficit compared to total operating expenditure was minus 0.006 in 2014, below the target of zero and indicating a small deficit. This is the second consecutive year with small deficit. However, the City ended the first two years of this Term of Council (2011 and 2012) with surpluses. The City has demonstrated an ability to deliver well-managed spending plans that ensure that services are delivered within the available resources.
• One hundred per cent of the Long Range Financial Plan deliverables were completed by Q4 2012, meeting the target. Long Range Financial Plans (LRFPs) are a hallmark of good financial planning. This Term of Council saw the approval of the fourth Long Range Financial Plan since amalgamation. With these strategies, Ottawa will be able to maintain its critical transportation, water and wastewater infrastructure. At the same time, the City will have the financial capacity to undertake a major change in how it delivers transit services through the Light Rail Transit project.
• The ten-year Asset Management Needs Assessment for Environmental Services was completed on schedule by the end of 2012.
11

Year-end 2014 Results for 2011-2014 City Balanced Scorecard
Legend
ITS - Information and Technology ServicesOCT - OC Transpo/Transit Services PGM - Planning and Growth ManagementPRC - Parks, Recreation and Cultural ServicesPW - Public WorksREPDO - Real Estate Partnership and Development OfficeRIO - Rail Implementation OfficeSO - ServiceOttawa
Year-
End
2014
Target
Year-
End
2014
Result
Economic ProsperityObjective: EP1 Promote Ottawa
GloballyEP1-A FEDC EDI Increase the number of major events won by the City to 5 per year. 5 5
Economic ProsperityObjective: EP1 Promote Ottawa
GloballyEP1-B FEDC EDI
Complete two Community Improvement Plans (CIPs) and receive at least 2 applicants for
these new programs by the end of 2014.1 For two CIPs2 2
Economic ProsperityObjective: EP1 Promote Ottawa
GloballyEP1-B FEDC EDI
Complete two Community Improvement Plans (CIPs) and receive at least 2 applicants for
these new programs by the end of 2014.1 For two applications2 3
Economic ProsperityObjective: EP1 Promote Ottawa
GloballyEP1-C FEDC EDI Enrol 4 companies in the Capital Investment Track Program by the end of 2014.2 4 6
Economic ProsperityObjective: EP1 Promote Ottawa
Globally
Initiative 1: Support celebrations of
Canada's 150th Anniversary1-A FEDC EDI
Fulfill 100% of Economic Development and Innovation (EDI)'s Sesquicentennial initiatives
as per the department's annual work program.3100% 100%
Economic ProsperityObjective: EP2 Effectively integrate
immigrantsEP2-A CPS CSS
Inventory 10% of the City programs and services available to immigrants by Q1 2012,
30% by Q2 2012, 60% by Q3 2012 and 100% by Q4 2012.
100%
(2012)
100%
(2012)
Economic ProsperityObjective: EP2 Effectively integrate
immigrants
Initiative 2: City of Ottawa Immigration
Strategy2-A CPS CSS
Complete 10% of the City programs and services available to immigrants by Q1 2012,
30% by Q2 2012, 60% by Q3 2012 and 100% by Q4 2012.
100%
(2012)
100%
(2012)
Economic ProsperityObjective: EP2 Effectively integrate
immigrants
Initiative 2: City of Ottawa Immigration
Strategy2-B CPS CSS
Increase the implemented actions of the City of Ottawa Municipal Immigration Strategy to
30% by the end of 2013 and 70% by the end of 2014.470% 70%
Economic ProsperityObjective: EP3 Support growth of
local economyEP3-A FEDC EDI
Complete EDI's initiatives related to the Innovation Centre, which consists of fulfilling the
following activities at the end of 2014: create a not-for-profit entity for the Innovation
Centre; recruit its board members; issue an RFP for a proponent to engage in renovating
and constructing the Centre; and, complete a business case for the Centre that is
approved by the Centre's funders.5
100% 100%
Economic ProsperityObjective: EP3 Support growth of
local economyEP3-B FEDC EDI
Economic Development and Innovation (EDI) meets 100% of the program objectives in its
annual work plan.6100% 100%
Economic ProsperityObjective: EP3 Support growth of
local economy
Initiative 3: Economic Development
Strategy3-A FEDC EDI
Implement 80% of the initiatives identified in Invest Ottawa’s annual operating plan (2012-
2014).80% 80%
Transportation and MobilityObjective: TM1 Ensure sustainable
transit servicesTM1-A TC OCT Increase total ridership per revenue service hour by 14% by the end of 2014 14% 3.3%
PC - Planning Standing Committee
TC - Transit Commission
TRC - Transportation Standing Committee
ND* = No data available at this time
Standing Committee/Transit Commission:
ARAC - Agriculture and Rural Affairs Standing Committee
CPSC - Community and Protective Services Standing Committee
EC - Environment Standing Committee
FEDC - Finance and Economic Development Committee
Measure Name
Results
Lead Departments:
CC - Corporate Communications
CCS - City Clerk and SolicitorCPBS - Corporate Programs and Business ServicesCSS - Community Social ServicesEDI - Economic Development and InnovationESD - Environmental Services
FIN - Finance
HR - Human Resources
ISD - Infratsructure Services
Department
Standing
Committee
Oversight
Measure
Number
InitiativeObjectivePriority
ND* = No data available at this time 12
No initiative: performance measure is for objective only
No initiative: performance measure is for objective only
No initiative: performance measure is for objective only
No initiative: performance measure is for objective only
No initiative: performance measure is for objective only
No initiative: performance measure is for objective only
No initiative: performance measure is for objective only
No initiative: performance measure is for objective only

Year-end 2014 Results for 2011-2014 City Balanced Scorecard
Year-
End
2014
Target
Year-
End
2014
Result
Measure Name
Results
Department
Standing
Committee
Oversight
Measure
Number
InitiativeObjectivePriority
Transportation and MobilityObjective: TM1 Ensure sustainable
transit services
Initiative 4: O-Train Service
Expansion4-A TC OCT Complete 100% of the key project milestones. 100% 90%
Transportation and MobilityObjective: TM1 Ensure sustainable
transit servicesInitiative 5: Double-decker Purchase 5-A TC OCT Increase the proportion of seats available to customers from 79% to 91% by Q2 2013.
91%
(Q2
2013)
91%
(Q2
2013)
Transportation and MobilityObjective: TM1 Ensure sustainable
transit services
Initiative 6: Route Optimization
Savings6-A TC OCT Increase productivity measure and achieve savings target ($19.5 M/year) $19.5 $19.5
Transportation and MobilityObjective: TM2 Maximize density in
and around transit stationsTM2-A PLC PGM
Complete 38% of the Transit-Oriented development studies by the end of 2012, 75% by
the end of 2013, and 100% by the end of 2014100%
100%
(2013)
Transportation and MobilityObjective: TM2 Maximize density in
and around transit stations
Initiative 7: Community Planning
Studies in Support of the Light Rail
Transit Project
7-A PLC PGMComplete the projects outlined in the Transit-Oriented development studies on time and
budget.100%
100%
(2013)
Transportation and Mobility
Objective: TM3 Provide
infrastructure to support mobility
choices
TM3-A TRC PGM
Increase the annual growth in the number of trips made by transit, cycling, and walking
over the 2011 baseline as follows: cycling: 3.5% per year, transit: 2.2% per year, walking:
1.5% per year. (Transit)
2.2% -0.6%
Transportation and Mobility
Objective: TM3 Provide
infrastructure to support mobility
choices
TM3-A TRC PGM
Increase the annual growth in the number of trips made by transit, cycling, and walking
over the 2011 baseline as follows: cycling: 3.5% per year, transit: 2.2% per year, walking:
1.5% per year. (Cycling)
3.5% 3.1%
Transportation and Mobility
Objective: TM3 Provide
infrastructure to support mobility
choices
TM3-A TRC PGM
Increase the annual growth in the number of trips made by transit, cycling, and walking
over the 2011 baseline as follows: cycling: 3.5% per year, transit: 2.2% per year, walking:
1.5% per year.7 (Walking)
1.5% ND
Transportation and Mobility
Objective: TM3 Provide
infrastructure to support mobility
choices
Initiative 8: Ottawa Light Rail Transit
(ORLT) Project8-A FEDC RIO
Complete 28% of the Ottawa Light Rail Transit (OLRT) key project milestones by the end
of Q1 2012, 57% by the end of Q2 2012, 71% by the end of Q3 2012 and 100% by the
end of Q4 2012.
100%
(Q4
2012)
100%
(Q1
2013)
Transportation and Mobility
Objective: TM3 Provide
infrastructure to support mobility
choices
Initiative 9: Western Light Rail Transit
Corridor Environmental Assessment9-A TRC PGM
Complete 66% of the Western Light Rail Transit Corridor Environmental Assessment
study by Q1 2012 and 100% by Q1 2013.
100%
(Q1
2013)
85%
Transportation and Mobility
Objective: TM3 Provide
infrastructure to support mobility
choices
Initiative 10: Cycling Safety Evaluation 10-A TRC PW Complete 10 cycling safety enhancements/upgrades per year. 10 7
Transportation and Mobility
Objective: TM3 Provide
infrastructure to support mobility
choices
Initiative 11: Ottawa on the Move 11-A TRC/ARAC ISD
Complete a minimum of 85% of each year’s scheduled construction program (2012-2014)
related to the integrated road, sewer and water program; road resurfacing; cycling
infrastructure; sidewalks; and, bridges and structures.
85% 95%
Transportation and Mobility
Objective: TM3 Provide
infrastructure to support mobility
choices
Initiative 12: Public Works Vehicular
and Pedestrian Safety and Mobility12-A TRC PW
Increase the percentage of pedestrian signalized intersections equipped with audible
signals to 55% in 2012.
55%
(2012)
59%
(2012)
ND* = No data available at this time 13
No initiative: performance measure is for objective only
No initiative: performance measure is for objective only
No initiative: performance measure is for objective only
No initiative: performance measure is for objective only

Year-end 2014 Results for 2011-2014 City Balanced Scorecard
Year-
End
2014
Target
Year-
End
2014
Result
Measure Name
Results
Department
Standing
Committee
Oversight
Measure
Number
InitiativeObjectivePriority
Transportation and MobilityObjective: TM4 Promote alternative
Mobility ChoicesTM4-A TRC PGM
Increase the percentage of population reached by the City's Transportation Demand
Management website (TravelWise) and the Cycling in the City e-newsletter by 10% (on a
year-over-year basis).
10% 38.1%
Transportation and MobilityObjective: TM4 Promote alternative
Mobility ChoicesInitiative 13: Downtown Moves Study 13-A TRC PGM
Complete 25% of the Downtown Moves study by the end of Q1 2012, 50% by the end of
Q2 2012, 75% by the end of Q3 2012 and 100% by the end of Q4 2012.
100%
(2012)
100%
(Q1
2013)
Transportation and MobilityObjective: TM4 Promote alternative
Mobility Choices
Initiative 14: Transportation Demand
Management Strategy and
Implementation
14-A TRC PGM Web portal operational by end of 2012. Y
(2012)
Y
(2013)
Transportation and MobilityObjective: TM4 Promote alternative
Mobility Choices
Initiative 14: Transportation Demand
Management Strategy and
Implementation
14-B TRC PGM Increase average monthly web portal usage by 10% annually in 2013 and 2014. 10% 10%
Transportation and MobilityObjective: TM4 Promote alternative
Mobility Choices
Initiative 15: OC Transpo Marketing
Revitalization and Employee
Engagement
15-A TC OCTIncrease customer connections made through social media channels by 10% per quarter,
on a year-over-year basis.
10%
(per
quarter)
18%
Transportation and MobilityObjective: TM4 Promote alternative
Mobility Choices
Initiative 15: OC Transpo Marketing
Revitalization and Employee
Engagement
15-B TC OCT Launch a comprehensive Employee Engagement Strategy by Q4, 2012.Y
(2012)
Y
(2012)
Environmental StewardshipObjective: ES1 Improve stormwater
managementES1-A ENV ES
Increase the percentage of natural water system inventoried and assessed by 1% by the
end of 2012, 3% by the end of 2013 and 10% by the end of 2014.10% 12%
Environmental StewardshipObjective: ES1 Improve stormwater
managementES1-B ENV ES Establish a risk assessment approach and provide recommendations by the end of 2012.
100%
(2012)
100%
(2012)
Environmental StewardshipObjective: ES1 Improve stormwater
management
Initiative 16: Subwatershed Studies
and Environmental Management16-A PLC/ ARAC PGM
Complete 100% of the Subwatershed Plans and Environmental Management Plan
deliverables in 2012, 2013 and 2014.100% 90%
Environmental StewardshipObjective: ES1 Improve stormwater
management
Initiative 16: Subwatershed Studies
and Environmental Management16-B PLC/ ARAC PGM
Increase or maintain the percentage of watercourses meeting recommended vegetated
buffer targets by 2014.8100% ND*
Environmental StewardshipObjective: ES1 Improve stormwater
managementInitiative 17: Stormwater Master Plan 17-A
ENV/
ARACPGM
Complete 25% of the Stormwater Retrofit Master Plan deliverables by Q4 2012, 40% by
Q4 2013 and 70% by Q4 2014.70% 35%
Environmental StewardshipObjective: ES1 Improve stormwater
management
Initiative 18: Ottawa River Action Plan
(ORAP)18-A ENV ES
Secure funding for the Combined Sewer Storage Tunnel project from municipal, provincial
and federal governments by Q4 2014.Y N
Environmental StewardshipObjective: ES1 Improve stormwater
management
Initiative 18: Ottawa River Action Plan
(ORAP)18-B ENV ES
Commence 60% of the projects identified in the Ottawa River Action Plan (ORAP) by the
end of 2012, 90% by the end of 2014 and 100% by the end of 2015. Contingent on
securing federal and provincial funding.
90%100%
(2013)
Environmental StewardshipObjective: ES1 Improve stormwater
management
Initiative 19: West End Flood
Mitigation19-A ENV ISD
Invest 60% of the $32M allocated to the West End Flooding Action Plan by the end of
2012, 90% by the end of 2013 and 100% by the end of 2014.100% 100%
ND* = No data available at this time 14
No initiative: performance measure is for objective only
No initiative: performance measure is for objective only
No initiative: performance measure is for objective only

Year-end 2014 Results for 2011-2014 City Balanced Scorecard
Year-
End
2014
Target
Year-
End
2014
Result
Measure Name
Results
Department
Standing
Committee
Oversight
Measure
Number
InitiativeObjectivePriority
Environmental StewardshipObjective: ES1 Improve stormwater
management
Initiative 20: Surface Water
Management20-A
ENV/
ARACES
Increase the percentage of rivers and streams in Ottawa that are monitored and reported
against Canadian Council of Ministers of the Environment (CCME) water quality objectives
to 40% by the end of 2012, 60% by the end of 2013 and 80% by the end of 2014.
80%80%
(2012)
Environmental StewardshipObjective: ES2 Enhance and
protect natural systemsES2-A ENV PGM
Increase the percentage of households within 400 metres of a protected urban
greenspace to 80% by the end of 2012, 90% by the end of 2013 and 100% by the end of
2014.
100%100%
(2013)
Environmental StewardshipObjective: ES2 Enhance and
protect natural systemsES2-B ENV PGM
Maintain a City-wide target for canopy cover at 30% and maintain an urban and suburban
area target of 20% canopy cover.9 (City Wide)30% ND*
Environmental StewardshipObjective: ES2 Enhance and
protect natural systemsES2-B ENV PGM
Maintain a City-wide target for canopy cover at 30% and maintain an urban and suburban
area target of 20% canopy cover.9 (Urban and Suburban)20% ND*
Environmental StewardshipObjective: ES2 Enhance and
protect natural systemsInitiative 21: Increase Forest Cover 21-A
ENV/
ARACPW
Increase the number of trees planted to 90,000 in 2012, 100,000 in 2013 and 110,000 in
2014.110,000 70,654
Environmental StewardshipObjective: ES2 Enhance and
protect natural systems
Initiative 22: Source Water Protection
Plan22-A PLC/ ARAC PGM
Increase the percentage of area within wellhead protection areas and intake protection
zones designated and zoned for Source Water Protection Land Uses to 75% by the end
of 2013 and 100% by the end of 2014.10
100% ND*
Environmental StewardshipObjective: ES2 Enhance and
protect natural systems
Initiative 22: Source Water Protection
Plan22-B PLC/ ARAC PGM
Increase the percentage of properties requiring Source Water Protection Risk
Management Plans that have approved plans to 75% by the end of 2013 and 100% by the
end of 2014.10
100% ND*
Environmental StewardshipObjective: ES2 Enhance and
protect natural systems
Initiative 23: Drinking Water Quality
Management System (DWQMS)23-A ENV ES Decrease the number of major non-conformances to fewer than 5 per annual audit. <5 0
Environmental StewardshipObjective: ES2 Enhance and
protect natural systems
Initiative 24: Environmental Quality
Wastewater Management System
(EQWMS)
24-AENV/
ARACES
Increase the percentage of Priority A risks addressed to 50% by the end of 2012, 75% by
the end of 2013 and 100% by the end of 2014.100% 97%
Environmental StewardshipObjective: ES2 Enhance and
protect natural systems
Initiative 24: Environmental Quality
Wastewater Management System
(EQWMS)
24-BENV/
ARACES
Decrease the number of major non-conformances per annual internal audits to fewer than
50 per year.<50 0
Environmental StewardshipObjective: ES2 Enhance and
protect natural systems
Initiative 25: Purchase Urban Natural
Features25-A ENV PGM
Increase the percentage of Urban Natural Areas identified for protection to 80% by the
end of 2012 and implement future percentage increases based on available funding and
conservation tools for 2013 and 2014.
80%
(2012)
100%
(2013)
Environmental StewardshipObjective: ES3 Reduce
environmental impactES3-A ENV PGM
Increase the percentage of new urban dwelling units provided through intensification to an
average of 38% per calendar year for 2012-2014.38% 54%
Environmental StewardshipObjective: ES3 Reduce
environmental impactES3-B ENV ES
Make progress on Environmental Action of the Year. (Target to rotate on an annual basis
to ensure that multiple areas of the environment are addressed and that annual priorities
are clear to residents; target to be imported from action plans in each area).
100% 100%
ND* = No data available at this time 15
No initiative: performance measure is for objective only
No initiative: performance measure is for objective only
No initiative: performance measure is for objective only
No initiative: performance measure is for objective only
No initiative: performance measure is for objective only

Year-end 2014 Results for 2011-2014 City Balanced Scorecard
Year-
End
2014
Target
Year-
End
2014
Result
Measure Name
Results
Department
Standing
Committee
Oversight
Measure
Number
InitiativeObjectivePriority
Environmental StewardshipObjective: ES3 Reduce
environmental impact
Initiative 26: Municipal Waste
Management Plan26-A ENV ES
Complete 100% of the Municipal Waste Management Plan deliverables by the end of
2013.
100%
(2013)
100%
(2013)
Environmental StewardshipObjective: ES3 Reduce
environmental impact
Initiative 27: Environmental Strategy
2012-201627-A ENV ES
Gain Council approval of the overarching Environmental Strategy 2012-2016 by the end
of Q3 2012. Work plans and activities to be completed under the Strategy will be brought
forward annually.
100%
(Q3
2012)
100%
(Q2)
Environmental StewardshipObjective: ES3 Reduce
environmental impact
Initiative 28: Green Building
Promotion Program28-A PLC PGM
Increase the number of approved planning applications that have used the green checklist
and made an improvement with a positive environmental benefit by 20% by the end of
2014 (over established baseline from pilot/first year).
20% 10%
Environmental StewardshipObjective: ES3 Reduce
environmental impact
Initiative 29: Implementation of New
Solid Waste Service Levels (2012-
2018)
29-A ENV ESInformation material related to the Solid Waste Service Level service level changes will be
conveyed to 100% of home owners, renters and businesses by the end of 2012.
100%
(2012)
93%
(2012)
Environmental StewardshipObjective: ES3 Reduce
environmental impact
Initiative 29: Implementation of New
Solid Waste Service Levels (2012-
2018)
29-B ENV ESIncrease the percentage of residential waste diverted via the curbside collection program
to 44% by the end of 2012, 50% by the end of 2013 and 52% by the end of 2014.52% 51%
Environmental StewardshipObjective: ES3 Reduce
environmental impact
Initiative 30: Diversion 2015 (2011-
2015) 30-A ENV/ARAC ES
Increase the percentage of program funds committed to Diversion 2015 to 20% by the
end of 2012, 50% by the end of 2013 and 75% by the end of 2014.75% 68%
Environmental StewardshipObjective: ES3 Reduce
environmental impact
Initiative 31: Waste Diversion at City
Facilities 31-A ENV PW
Ensure that 100% of eligible City buildings have access to recycling bins by the end of
2014.100%
100%
(2012)
Healthy and Caring
Communities
Objective: HC1 Achieve equity and
inclusion for an aging and diverse
population
HC1-A CPS CSS
Increase the number of staff trained in how to apply the Equity and Inclusion Lens in their
daily work to 400 staff and 100 managers by the end of 2014 as follows: 25% of the staff
target by the end of 2012, 50% of each target by the end of 2013, and 100% of each
target by the end of 2014.
100% 252%
Healthy and Caring
Communities
Objective: HC1 Achieve equity and
inclusion for an aging and diverse
population
HC1-B CPS CPBS
Complete 28% of the departmental deliverables to meet Accessibility for Ontarians with
Disabilities Act (AODA) regulations and associated timelines by the end of 2012, 85% by
the end of 2013 and 100% by the end of 2014.11
100% 100%
Healthy and Caring
Communities
Objective: HC1 Achieve equity and
inclusion for an aging and diverse
population
Initiative 32: Community Development
Funding for Priority Neighbourhoods32-A CPS CSS
Complete 30% of contracted sustainability, evaluation and neighbourhood outcomes by
the end of 2012, 60% by the end of 2013 and 100% by the end of 2014.12100% 100%
Healthy and Caring
Communities
Objective: HC1 Achieve equity and
inclusion for an aging and diverse
population
Initiative 33: Community and Social
Services Partnership Capital Funding33-A CPS CSS
Use capital partnership activity to ensure the funding available annually is allocated and
directly benefiting the community.100% 100%
Healthy and Caring
Communities
Objective: HC1 Achieve equity and
inclusion for an aging and diverse
population
Initiative 34: Seniors Summit and
Older Adult Plan34-A CPS CSS Obtain a satisfaction rating of at least 80% from participants in the Seniors Summit.
80%
(2012)
89%
(2012)
Healthy and Caring
Communities
Objective: HC1 Achieve equity and
inclusion for an aging and diverse
population
Initiative 34: Seniors Summit and
Older Adult Plan34-B CPS CSS Develop an Older Adult Action Plan by the end of 2012.
100%
(2012)
100%
(2012)
ND* = No data available at this time 16
No initiative: performance measure is for objective only
No initiative: performance measure is for objective only

Year-end 2014 Results for 2011-2014 City Balanced Scorecard
Year-
End
2014
Target
Year-
End
2014
Result
Measure Name
Results
Department
Standing
Committee
Oversight
Measure
Number
InitiativeObjectivePriority
Healthy and Caring
Communities
Objective: HC1 Achieve equity and
inclusion for an aging and diverse
population
Initiative 34: Seniors Summit and
Older Adult Plan34-C CPS CSS
Implement 70% of the recommendations with 2013 and 2014 timelines identified in the
Older Adult Action Plan.70% 82%
Healthy and Caring
Communities
Objective: HC1 Achieve equity and
inclusion for an aging and diverse
population
Initiative 35: Service Enhancements -
Accessibility Program35-A FEDC ISD Complete accessibility audits on 90% of all major City facilities by the end of 2014. 90% 94%
Healthy and Caring
Communities
Objective: HC1 Achieve equity and
inclusion for an aging and diverse
population
Initiative 77: Child Care Service Plan10 77-A CPS CSSComplete the implementation of a new wait list management system for child care fee
subsidy by the end of 2014.13100% 100%
Healthy and Caring
Communities
Objective: HC2 Improve parks and
recreationHC2-A CPS PRC Maintain 2011 participation levels in all registered recreation programs (2012-2014). 212,993 220,493
Healthy and Caring
Communities
Objective: HC2 Improve parks and
recreationHC2-B CPS PRC
Maintain 2011 participation levels in registered senior-specific recreation programs (2012-
2014).8,969 12,159
Healthy and Caring
Communities
Objective: HC2 Improve parks and
recreation
Initiative 36: Recreation Major/Minor
Capital Partnership36-A CPS PRC
Maintain a 50% return on investment (ROI) of City assets based on actual spending as
opposed to anticipated spending through 2014.50% 323%
Healthy and Caring
Communities
Objective: HC2 Improve parks and
recreation
Initiative 37: Lansdowne Stadium and
Parking Redevelopment 37-A FEDC ISD
Complete the Lansdowne Park Stadium and Parking construction within schedule and
budget. Proceeding subject to, and in accordance with, Council approvals. 93% 93%
Healthy and Caring
Communities
Objective: HC2 Improve parks and
recreation
Initiative 38: Lansdowne - Urban Park
Revitalization38-A FEDC ISD
Complete the Urban Park construction within schedule and budget. Proceeding subject to,
and in accordance with, Council approvals. 100% 100%
Healthy and Caring
Communities
Objective: HC2 Improve parks and
recreation
Initiative 39: Parks and Recreation
Master Plan39-A CPS PRC
Complete 100% of the comprehensive Financial Sustainability review by the end of 2013
and implement 100% of the initiatives derived from this review by the end of 2014.14100% 79%
Healthy and Caring
Communities
Objective: HC2 Improve parks and
recreationInitiative 40: Rink of Dreams 40-A CPS PRC Complete the construction of the Rink of Dreams in 2012.
100%
(2012)
100%
(2012)
Healthy and Caring
Communities
Objective: HC3 Improve social and
affordable housingHC3-A CPS CSS
Increase the number of individuals receiving supports to housing to 150 in 2011, 700 in
2012, 700 in 2013 and 700 in 2014.700 1,364
Healthy and Caring
Communities
Objective: HC3 Improve social and
affordable housing
Initiative 41: Housing and
Homelessness Investment Plan41-A CPS CSS
Increase the number of households granted the Ontario Disability Support Program
(ODSP) by 150 annually (2011 - 2014).150 160
Healthy and Caring
Communities
Objective: HC3 Improve social and
affordable housing
Initiative 41: Housing and
Homelessness Investment Plan41-B CPS CSS
Increase youth participation in the Youth Futures Program by 10 annually. (Total number
of participants will be 50 youth in 2011, 60 youth in 2012, 70 youth in 2013 and 80 youth in
2014).
80 76
Healthy and Caring
Communities
Objective: HC3 Improve social and
affordable housing
Initiative 41: Housing and
Homelessness Investment Plan41-C PLC CSS Start 90 new affordable housing units in 2012, 60 units in 2013 and 20 units in 2014. 20 57
Healthy and Caring
Communities
Objective: HC3 Improve social and
affordable housing
Initiative 78: Ten-Year Housing and
Homelessness Plan12
78-A CPS CSS Ensure an interdepartmental committee is operational by Q2 2014.15100%
(Q2)100%
ND* = No data available at this time 17
No initiative: performance measure is for objective only
No initiative: performance measure is for objective only
No initiative: performance measure is for objective only

Year-end 2014 Results for 2011-2014 City Balanced Scorecard
Year-
End
2014
Target
Year-
End
2014
Result
Measure Name
Results
Department
Standing
Committee
Oversight
Measure
Number
InitiativeObjectivePriority
Healthy and Caring
Communities
Objective: HC3 Improve social and
affordable housing
Initiative 78: Ten-Year Housing and
Homelessness Plan1278-B CPS CSS Develop a plan for social housing repairs by Q4 2014.15 100% 50%
Healthy and Caring
Communities
Objective: HC4 Improve arts and
heritageHC4-A CPS PRC
Maintain the municipal government funding per capita for arts and festivals above the
median with the six other large Canadian cities.Y N
Healthy and Caring
Communities
Objective: HC4 Improve arts and
heritage
Initiative 42: Ottawa Art Gallery
Expansion and Arts Court
Redevelopment Project
42-A CPS REPDO
Complete the Ottawa Art Gallery (OAG) expansion and Arts Court redevelopment within
schedule and budget. Proceeding subject to achieving funding and fundraising targets
and in accordance with Council approvals.
80% 80%
Healthy and Caring
Communities
Objective: HC4 Improve arts and
heritage
Initiative 43: Renewed Action Plan for
Arts, Heritage and Culture43-A CPS PRC
Complete 5% of the 6-year Renewed Action Plan for Arts, Heritage and Culture
recommendations by the end of 2012, 15% by the end of 2013 and 30% by the end of
2014.
30% 58%
Service Excellence
Objective: SE1 Ensure a positive
experience for every client
interaction
SE1-A FEDC SOIncrease the number of customers rating the City of Ottawa's services at 4 or 5 out of 5 by
5%.165% ND*
Service Excellence
Objective: SE1 Ensure a positive
experience for every client
interaction
Initiative 44: Social Media Enablement 44-A FEDC CCComplete 100% of the Social Media Enablement Framework deliverables by the end of
Q4 2012.
100%
(2012)
100%
(Q1
2013)
Service Excellence
Objective: SE1 Ensure a positive
experience for every client
interaction
Initiative 44: Social Media Enablement 44-B FEDC CCAchieve 100% of official social media accounts in compliance with related policies and
guidelines by end of 2012.
100%
(2012)85%
Service Excellence
Objective: SE1 Ensure a positive
experience for every client
interaction
45-A FEDC SOIncrease the percentage of service requests processed via all ServiceOttawa channels
(Web, 311 and Client Service Centre counters) by 5% in 2012, 2013, and 2014. 5% 6%
Service Excellence
Objective: SE1 Ensure a positive
experience for every client
interaction
45-B FEDC SOIncrease the delivery of service requests processed by the web by 10% in 2012, 20% in
2013, and 30% in 2014.30% 11%
Service Excellence
Objective: SE1 Ensure a positive
experience for every client
interaction
Initiative 46: Business Technology
Plan (old ServiceOttawa Technology
Roadmap)13
46-A FEDC ITS
Complete 100% of the development and preparation of the Business Technology Plan
document by Q4 annually. The 2014 Business Technology Plan was successfully
completed in November 2013.17
100% 100%
Service ExcellenceObjective: SE2 Improve operational
performanceSE2-A FEDC SO
Meet efficiency savings of $40.926M by 2014: $11.109M in 2012, $10.153M in 2013 and
$4.924M in 2014. The remaining savings were achieved in 2010: $4.07M and 2011:
$10.67M.18
$4.924 $4.924
Service ExcellenceObjective: SE2 Improve operational
performance
Initiative 47: ServiceOttawa Benefits
Realization Program47-A FEDC SO
Meet efficiency savings of $40.926M by 2014: $11.109M in 2012, $10.153M in 2013 and
$4.924M in 2014. The remaining savings were achieved in 2010: $4.07M and 2011:
$10.67M.18
$4.924 $4.924
Service ExcellenceObjective: SE2 Improve operational
performance
Initiative 48: Advanced Meter
Infrastructure48-A ENV ES
Increase the percentage of customers on the new meter reading system (AMI) to 90% by
the end of 2012 and 100% by the end of 2013.
100%
(2013)
100%
(Q2)
Service ExcellenceObjective: SE2 Improve operational
performance
Initiative 48: Advanced Meter
Infrastructure48-B ENV ES
Decrease the percentage of estimated water and sewer bills to 10% by the end of 2012,
2% by the end of 2013 and 1% by the end of 2014.1% 1.5%
Initiative 45: ServiceOttawa - Citizen
Centric Services Project
ND* = No data available at this time 18
No initiative: performance measure is for objective only
No initiative: performance measure is for objective only
No initiative: performance measure is for objective only

Year-end 2014 Results for 2011-2014 City Balanced Scorecard
Year-
End
2014
Target
Year-
End
2014
Result
Measure Name
Results
Department
Standing
Committee
Oversight
Measure
Number
InitiativeObjectivePriority
Service ExcellenceObjective: SE2 Improve operational
performance
Initiative 49: Development Review
Process Continuous Improvement49-A PLC PGM
Increase the percentage of planning applications that are decided "On-time" to 60% by the
end of 2011, 65% by the end of 2012, 75% by the end of 2013 and 80% by the end of
2014.
80% 81%
Service ExcellenceObjective: SE2 Improve operational
performanceInitiative 50: OpenData 50-A FEDC SO
Increase the number of OpenData sets per year from 52 in 2010 to 75 in 2011, 95 in
2012, 120 in 2013 and 150 in 2014. 150 383
Service ExcellenceObjective: SE2 Improve operational
performance
Initiative 51: Access to Information
Case Management System51-A FEDC CCS
Decrease the percentage of time to create the annual ATIP report by 25% in 2013 and
50% in 2014.50% 80%
Service ExcellenceObjective: SE2 Improve operational
performance
Initiative 52: Vote Tabulating Solution -
2014 Municipal Elections52-A FEDC CCS
Complete 25% of the Vote Tabulating Solution project by the end of 2012, 50% by the end
of 2013 and 100% by the end of 2014.100% 100%
Service ExcellenceObjective: SE2 Improve operational
performanceInitiative 53: Transit Technology 53-A TC OCT Achieve 12,000 Apple App downloads by the end of 2014. 12,000
77000
(2013)
Service ExcellenceObjective: SE2 Improve operational
performanceInitiative 53: Transit Technology 53-B TC OCT Achieve 100 API keys approved by the end of 2014. 100
291
(2013)
Service ExcellenceObjective: SE2 Improve operational
performanceInitiative 53: Transit Technology 53-C TC OCT Issue Presto Cards to more than 50% of OC Transpo customers by the end of 2014. 50%
50%
(2013)
Service ExcellenceObjective: SE2 Improve operational
performance
Initiative 54: Enterprise Asset
Management54-A ENV ES
Complete 75% of the Enterprise Asset Management (EAM) system for water and
wastewater assets by the end of Q1 2012, 85% by the end of Q2 2012 and 100% by the
end of Q4 2012.
100%
(2012)
100%
(Q1
2013)
Service ExcellenceObjective: SE2 Improve operational
performance
Initiative 55: Right-of-Way Activity
Management System55-A FEDC ISD
Complete 85% of the Right-of-Way (ROW) system by the end of 2012 and 100% by the
end of Q2 2013.
100%
(Q2
2013)
100%
(2012)
Governance, Planning and
Decision-Making
Objective: GP1 Improve the public's
confidence in and satisfaction with
the way Council works
GP1-A FEDC CCSDecrease the number of times Council/Committee discussions went in camera to fewer
than 15 per year.<15 4
Governance, Planning and
Decision-Making
Objective: GP1 Improve the public's
confidence in and satisfaction with
the way Council works
GP1-B FEDC CCSDecrease the number of confidential reports that go to Committee and Council to fewer
than 15 per year.<15 1
Governance, Planning and
Decision-Making
Objective: GP1 Improve the public's
confidence in and satisfaction with
the way Council works
Initiative 56: Council Agenda Building
Tool56-A FEDC CCS
Decrease the time required to publish Committee and Council agendas on the City's
website by 75% in 2012 and 100% in 2013.
100%
(2013)95%
Governance, Planning and
Decision-Making
Objective: GP1 Improve the public's
confidence in and satisfaction with
the way Council works
Initiative 57: Accountability
Framework57-A FEDC CCS Complete 100% of the Accountability Framework recommendations by the end of 2012.
100%
(2012)
100%
(2013)
ND* = No data available at this time 19
No initiative: performance measure is for objective only
No initiative: performance measure is for objective only

Year-end 2014 Results for 2011-2014 City Balanced Scorecard
Year-
End
2014
Target
Year-
End
2014
Result
Measure Name
Results
Department
Standing
Committee
Oversight
Measure
Number
InitiativeObjectivePriority
Governance, Planning and
Decision-Making
Objective: GP1 Improve the public's
confidence in and satisfaction with
the way Council works
Initiative 58: Mid-Term Governance
Review58-A FEDC CCS Report back to Council on the Mid-Term Governance Review by Q4 2012.
Y
(2012)
Y
(2013)
Governance, Planning and
Decision-Making
Objective: GP1 Improve the public's
confidence in and satisfaction with
the way Council works
Initiative 59: City of Ottawa Public
Engagement Strategies and Online
Consultation Tools
59-A FEDC CSSComplete 10% of the Public Engagement Strategy and Plan deliverables by Q1 2012,
40% by Q2 2012, 60% by Q3 2012 and 100% by Q4 2012.
100%
(2012)
100%
(2013)
Governance, Planning and
Decision-Making
Objective: GP2 Apply management
controls to achieve Council's
priorities
GP2-A FEDC CPBS
Complete 40% of the Auditor General Office's 2009 Audit recommendations on corporate
planning and performance management by the end of 2011, 80% by the end of 2012,
90% by the end of 2013 and 100% by the end of 2014.
100% 100%
Governance, Planning and
Decision-Making
Objective: GP2 Apply management
controls to achieve Council's
priorities
Initiative 60: Corporate Planning
Framework60-A FEDC CPBS
Complete 50% of the deliverables in the Corporate Planning Framework related to
strategic planning by the end of 2011, 80% by the end of 2012 and 100% by the end of
2013.
100%
(2013)
100%
(2013)
Governance, Planning and
Decision-Making
Objective: GP3 Make sustainable
choicesGP3-A ENV ES
Increase the number of reports presented to Council that are aligned to strategic objective
GP3 (“Make sustainable choices”) to 25% by the end of 2012, 50% by the end of 2013
and 95% by the end of 2014.19
95% ND*
Governance, Planning and
Decision-Making
Objective: GP3 Make sustainable
choices
Initiative 61: Comprehensive Asset
Management61-A FEDC ISD
Complete the Asset Management Policy/Strategy approved by Council and the State of
the Asset Report (SOAR) by Q4 2012.
100%
(2012)
100%
(2012)
Governance, Planning and
Decision-Making
Objective: GP3 Make sustainable
choices
Initiative 62: Rural and Urban
Opportunity Development62-A ENV/ARAC ES
Complete the Rural and Urban Opportunity Development project deliverables according to
plan.100% 20%
Governance, Planning and
Decision-Making
Objective: GP3 Make sustainable
choices
Initiative 63: Neighbourhood
Connection Office (NCO)63-B PLC PGM
Complete four neighbourhood projects in 2013 and 2014 through the Better
Neighbourhoods Program in the Neighbourhood Connection Office (NCO). 4 8
Governance, Planning and
Decision-Making
Objective: GP3 Make sustainable
choices
Initiative 64: Performance
Measurement64-A FEDC CPBS
Complete 75% of the Corporate Planning Framework deliverables related to performance
management by the end of 2012 and 100% by the end of 2013.
100%
(2013)
100%
(2013)
Governance, Planning and
Decision-Making
Objective: GP3 Make sustainable
choices
Initiative 65: Review of the Official
Plan, Transportation Master Plan and
Infrastructure Master Plan
65-A PLC PGMComplete 20% of the Official Plan Review deliverables by the end of 2012, 80% by the
end of 2013 and 100% by the end of 2014.100%
100%
(2013)
Governance, Planning and
Decision-Making
Objective: GP4 Improve overall
relations with City unionsGP4-A FEDC CCS
Increase the number of union complaints/grievances resolved without arbitration to more
than 90% annually.90% 98%
Governance, Planning and
Decision-Making
Objective: GP4 Improve overall
relations with City unions
Initiative 66: Enhance Labour
Relations and Collective Bargaining
Process
66-A FEDC CCSConclude 100% of the collective agreement negotiations within Council-approved
mandates and without work disruptions in 2012, 2013 and 2014.20 100% ND*
Employee EngagementObjective: EE1 Ensure leaders are
strong and effective EE1-A FEDC HR Complete the first three of four succession planning process steps by the end of 2013.21
100%
(2013)100%
ND* = No data available at this time 20
No initiative: performance measure is for objective only
No initiative: performance measure is for objective only
No initiative: performance measure is for objective only
No initiative: performance measure is for objective only

Year-end 2014 Results for 2011-2014 City Balanced Scorecard
Year-
End
2014
Target
Year-
End
2014
Result
Measure Name
Results
Department
Standing
Committee
Oversight
Measure
Number
InitiativeObjectivePriority
Employee EngagementObjective: EE1 Ensure leaders are
strong and effective Initiative 67: Leadership Development 67-A FEDC HR
Increase the number of Managers/Supervisors that participate in the Growing Leaders
program by 5% over three years, from a participation rate of 11% of
Managers/Supervisors to 16% (206 participants/graduates in 2011 to 312
participants/graduates in 2014).
16%21%
(2013)
Employee Engagement
Objective: EE2 Maintain a diverse,
high-performing, client-centric
workforce
EE2-A FEDC HR
Increase the number of internships, apprenticeships, and 4 month co-op work term
placements (feeder group of new talent) by 5% from ~ 97 to 102 placements annually by
the end of 2012.22
102
(2012)89
Employee Engagement
Objective: EE2 Maintain a diverse,
high-performing, client-centric
workforce
EE2-B FEDC HRMaintain or increase the percentage of representation of diverse group members relative
to their availability in the market based on census data. (Woman)49.1% 47.95%
Employee Engagement
Objective: EE2 Maintain a diverse,
high-performing, client-centric
workforce
EE2-B FEDC HRMaintain or increase the percentage of representation of diverse group members relative
to their availability in the market based on census data. (Visible Minorities)14.1% 7.05%
Employee Engagement
Objective: EE2 Maintain a diverse,
high-performing, client-centric
workforce
EE2-B FEDC HRMaintain or increase the percentage of representation of diverse group members relative
to their availability in the market based on census data. (Aboriginal Peoples)2.2% 1.44%
Employee Engagement
Objective: EE2 Maintain a diverse,
high-performing, client-centric
workforce
EE2-B FEDC HRMaintain or increase the percentage of representation of diverse group members relative
to their availability in the market based on census data. (Persons with Disabilities)5.0% 2.41%
Employee Engagement
Objective: EE2 Maintain a diverse,
high-performing, client-centric
workforce
Initiative 68: Recruitment/Outreach
Strategies and Assessment Tools68-A FEDC HR
Achieve a 95% retention rate in occupations that are considered difficult to fill or critical to
operations (2011 - 2014).95.0% 99.9%
Employee Engagement
Objective: EE3 Enable employees
to develop and contribute to their
fullest potential
EE3-A FEDC HRStaff 90% of full time continuing supervisory/management vacancies with internal
candidates versus external (2011 - 2014).90% 95%
Employee Engagement
Objective: EE3 Enable employees
to develop and contribute to their
fullest potential
Initiative 69: Employee Development 69-A FEDC HRIncrease the Career Growth & Development Score in the next Employee Engagement
Survey by 1%, from a score of 3.17 (2011 survey) to a score of 3.20.
3.2
(2013)
3.21
(2013)
Employee EngagementObjective: EE4 Build a positive,
productive and engaged workplaceEE4-A FEDC HR
Increase the Service and Accomplishment Score in the next Employee Engagement
Survey by 1%, from a score of 3.83 (2011 survey) to a score of 3.86.
3.86
(2013)
3.89
(2013)
Employee EngagementObjective: EE4 Build a positive,
productive and engaged workplace EE4-B FEDC HR
Increase the Recognition Score in the next Employee Engagement Survey by 3%, from a
score of 3.3 (2011 survey) to a score of 3.39.
3.39
(2013)
3.4
(2013)
Employee EngagementObjective: EE4 Build a positive,
productive and engaged workplace
Initiative 70: Automated Employee
Performance Development Program70-A FEDC HR
Complete 100% of the Automated Employee Performance Development Program
deliverables by the end of 2013.
100%
(2013)80%
Employee EngagementObjective: EE4 Build a positive,
productive and engaged workplace
Initiative 71: Unionized Staff Job
Evaluation Plan71-A FEDC HR
Complete 100% of Unionized Staff Job Evaluation Plan project deliverables by the end of
2014.100% 75%
ND* = No data available at this time 21
No initiative: performance measure is for objective only
No initiative: performance measure is for objective only
No initiative: performance measure is for objective only
No initiative: performance measure is for objective only
No initiative: performance measure is for objective only
No initiative: performance measure is for objective only
No initiative: performance measure is for objective only
No initiative: performance measure is for objective only

Year-end 2014 Results for 2011-2014 City Balanced Scorecard
Year-
End
2014
Target
Year-
End
2014
Result
Measure Name
Results
Department
Standing
Committee
Oversight
Measure
Number
InitiativeObjectivePriority
Financial Responsibility
Objective: FS1 Align strategic
priorities to Council’s tax and user
fee targets
FS1-A FEDC FINMaintain the ratio of the general tax rate increase to the Ottawa-Gatineau rate of inflation
(CPI) at 1 or lower each year.≤1.00 1.05
Financial Responsibility
Objective: FS1 Align strategic
priorities to Council’s tax and user
fee targets
FS1-B FEDC FINMaintain the percentage of overall surplus or deficit compared to total operating
expenditure budget at 0.230 -0.01
Financial Responsibility
Objective: FS1 Align strategic
priorities to Council’s tax and user
fee targets
Initiative 72: Update of Long Range
Financial Plan 72-A FEDC FIN
Complete 80% of the update of Long Range Financial Plan deliverables by Q2 2012 and
100% by Q4 2012.
100%
(2012)
100%
(2012)
Financial Responsibility
Objective: FS1 Align strategic
priorities to Council’s tax and user
fee targets
Initiative 73: Long Range Financial
Plan: Water & Sewer Rate (2011) 73-A ENV ES
Complete 100% of the update of the 10-year Asset Management Needs Assessment by
the end of 2012.
100%
(2012)
100%
(2012)
Financial ResponsibilityObjective: FS2 Maintain and
enhance the City’s financial positionFS2-A FEDC CPBS Maintain the percentage of annual tax increase at no more than 2.5%. <2.0 1.9
Financial ResponsibilityObjective: FS2 Maintain and
enhance the City’s financial position
Initiative 76: Securing Federal and
Provincial Funding Commitments76-A FEDC CPBS
Secure commitments for greater than 75% of Federal and Provincial funding allocations in
relation to funding requests.100%
ND* = No data available at this time 22
No initiative: performance measure is for objective only
No initiative: performance measure is for objective only
No initiative: performance measure is for objective only
100%

Endnotes: Explanations for unavailable data, and details of changes made to the 2011-2014 City Strategic Plan (since July 2013), including technical amendments, changes approved by Council through the Legislative Agenda, and other modifications as explained. 1. Changed performance measure EP1-B FROM: "Increase the number of hotel room nights booked by visitors in Ottawa by 2% (on a year-over-year basis)."
TO: "Complete two Community Improvement Plans (CIPs) and receive at least two applicants for these new programs by the end of 2014." Explanation: Data on the current measure does not exist exclusively for Ottawa, nor does the measure effectively reflect the City’s efforts in promoting Ottawa (i.e., many factors are outside of the City’s control). The approved by-laws for the Community Improvement Plans specifically note that applicants for these plans must not be simply moving jobs from one area of Ottawa to another in Ottawa (i.e. they have a national and global focus). Change was approved by Council in December 2013 (ACS-CMR-CMO-0018).
2. Changed performance measure EP1-C FROM: "Increase the number of international travellers visiting Ottawa by 2% per year (on a year-over-year basis)." TO: "Enrol four companies in the Capital Investment Track Program by the end of 2014." Explanation: The required data for the current performance measure is not collected by any organization in a manner that would reflect the City’s work in attracting international travellers. Also, statistics regarding international visitors from the Ottawa Airport Authority include domestic travellers, which misrepresents the number of people actually visiting Ottawa. This measure is also outside of the City’s direct control. The Capital Investment Track Program (CIT) is, however, within the purview of the City’s economic development programming. The CIT is used by Invest Ottawa as a tool to attract foreign direct investment. Change was approved by Council in December 2013 (ACS-CMR-CMO-0018).
3. Changed performance measure 1-A FROM: "Secure the federal and provincial funding for Canada's 150th Anniversary celebrations in Ottawa." TO: "Fulfill 100% of Economic Development and Innovation's (EDI’s) Sesquicentennial initiatives as per the department’s annual work program." Explanation: The current measure does not accurately reflect the City’s efforts in preparing for Canada’s 150th Anniversary celebration. Consequently, City-led objectives directly related to the Canada’s sesquicentennial are being proposed as outlined in the Department’s annual work plan. Change was approved by Council in December 2013 (ACS-CMR-CMO-0018).
4. Added new performance measure 2-B: Increase the implemented actions of the City of Ottawa Municipal Immigration Strategy to 30% by the end of 2013 and 70% by the end of 2014. Explanation: The target for the original Measure 2-A was completed at the end of 2012 as planned. However, the City of Ottawa Immigration Strategy initiative is ongoing, and this new measure will provide targets to track its progress.
5. Changed performance measure EP3-A FROM: "Increase the number of new business establishments in targeted industry sectors since 2011 by 2% (on a year-over-year basis)." TO: "Complete EDI’s initiatives related to the Innovation Centre, which consists of fulfilling the following activities at the end of 2014: create a not-for-profit entity for the Innovation Centre; recruit its board members; issue an RFP for a proponent to engage in renovating and constructing the Centre; and, complete a business case for the Centre that is approved by the Centre’s funders."
23

Endnotes: Explanations for unavailable data, and details of changes made to the 2011-2014 City Strategic Plan (since July 2013), including technical amendments, changes approved by Council through the Legislative Agenda, and other modifications as explained.
Explanation: For the current measure, the number of new business establishments in targeted industry sectors is not being tracked by any organization. These initiatives are measurable, within the City's control, and will support the growth of the local economy. Change was approved by Council in December 2013 (ACS-CMR-CMO-0018).
6. Changed performance measure EP3-B FROM: "Rank among the top 5 Canadian Census Metropolitan Areas (CMAs) for personal income per capita by 2014." TO: "Economic Development and Innovation (EDI) meets 100% of the program objectives in its annual work plan." Explanation: Although the current performance measure is a useful for monitoring Ottawa’s economic performance and the data is available, the City cannot directly control this variable. Consequently, Economic Development and Innovation's (EDI’s) annual work plan, which is designed to support the local economy, is being recommended as a new measure. Change was approved by Council in December 2013 (ACS-CMR-CMO-0018).
7. No available data for performance measure TM3-A (walking) "Increase the annual growth in the number of trips made by transit, cycling, and walking over the 2011 baseline as follows: cycling: 3.5% per year, transit: 2.2% per year, walking: 1.5% per year." Explanation: Data on the number of trips made by walking will not be available until the next Origin-Destination survey. The exact timing for this survey is to be determined.
8. No available data for performance measure 16-B "Increase or maintain the percentage of watercourses meeting recommended vegetated buffer targets by 2014." Explanation: A quantitative assessment of this measure will not be possible until after delivery of the 2014 aerial photography and land cover mapping in Q2 2015. As part of its three year cycle of aerial photography, the City partnered with the Province of Ontario on 2014 aerial photography. The delivery date for the final, processed data is March 31, 2015.
9. Changed performance ES2-B FROM: "Increase the percentage of urban, suburban and rural areas covered by forest canopy to 20% by the end of 2014." TO: "Maintain a Citywide target for canopy cover at 30% and maintain an urban and suburban area target of 20% canopy cover." Also, there is no available data for this performance measure. Explanation for change: The Planning and Growth Management (PGM) department recommended revision of the target to reflect the differences between the urban/suburban area and the rural area, consistent with the Official Plan. Explanation for missing data: An updated assessment of forest cover is awaiting delivery of the 2014 aerial photography and land cover mapping in Q2 2015. As part of its 3 year cycle of aerial photography, the City partnered with the Province of Ontario on 2014 aerial photography. The delivery date for the final, processed data is March 31, 2015.
10. No available data for performance measures 22-A and 22-B. (22-A: Increase the percentage of area within wellhead protection areas and intake protection zones designated and zoned for Source Water Protection Land Uses to 75% by the end of 2013 and 100% by the end of 2014. and 22-B: Increase the
24

Endnotes: Explanations for unavailable data, and details of changes made to the 2011-2014 City Strategic Plan (since July 2013), including technical amendments, changes approved by Council through the Legislative Agenda, and other modifications as explained.
percentage of properties requiring Source Water Protection Risk Management Plans that have approved plans to 75% by the end of 2013 and 100% by the end of 2014.) Explanation: No data is currently available for these measures since the Source Water Protection (SWP) Plans covering Ottawa were only approved by the Ontario Ministry of the Environment in late 2014. Staff are currently evaluating the Official Plan and Zoning By-law against the SWP Plans to determine what changes to policy and zoning may be required.
11. Changed performance measure HC1-B FROM: "Complete 28% of the departmental deliverables to meet Accessibility for Ontarians with Disabilities Act (AODA) regulations by the end of 2012, 85% by the end of 2013 and 100% by the end of 2014." TO: "Complete 28% of the departmental deliverables to meet Accessibility for Ontarians with Disabilities Act (AODA) regulations and associated timelines by the end of 2012, 85% by the end of 2013 and 100% by the end of 2014." Explanation: The Accessibility for Ontarians with Disabilities Act (AODA) added a new regulation on January 1, 2013: Design of Public Spaces Standards, which includes 44 additional clauses. The Province clarified the deadline for Regulation 14–Accessible websites and web content. Only new websites created after January 1, 2014 need to be compliant with WCAG 2.0 Level A. Departmental resources should be focused on training staff in how to make documents compliant moving forward. The amendment is being made to reflect these recent AODA regulation changes.
12. Changed performance measure 32-A FROM: "Complete 30% of the action plan recommendations for Community Development Funding for Priority Neighbourhoods by the end of 2012, 60% by the end of 2013 and 100% by the end of 2014." TO: “Complete 30% of contracted sustainability, evaluation and neighbourhood outcomes by the end of 2012, 60% by the end of 2013 and 100% by the end of 2014." Explanation: These changes will more accurately reflect the City's roles and the direction provided by Council. (Update on the Transition of Community Development Framework [CDF] and Allocation of Funds to South East Ottawa Community Health and Resource Centre, ACS2012-COS-CSS-0003, February 2012).
13. Added new strategic initiative 77. Child Care Service Plan, and new performance measure 77-A: Complete the implementation of a new wait list management system for child care fee subsidy by the end of 2014. Explanation: The Child Care Service Plan initiative and associated performance measure have been added to the 2011-2014 City Strategic Plan to align with Council approval of the Child Care Service Plan (Child Care Service Plan, ACS2014-COS-CSS-0001, February 26, 2014).
14. Changed performance measure 39-A FROM: "Complete 20% of the deliverables identified in the Parks and Recreation Master Plan by the end of 2012, 40% by the end of 2013 and 100% by the end of 2014." TO: “Complete 100% of the comprehensive Financial Sustainability review by the end of 2013 and implement 100% of the initiatives derived from this review by the end of 2014." Explanation: This revised performance measure reflects Parks, Recreation and Cultural Services (PRCS) current departmental priorities of Financial Sustainability.
25

Endnotes: Explanations for unavailable data, and details of changes made to the 2011-2014 City Strategic Plan (since July 2013), including technical amendments, changes approved by Council through the Legislative Agenda, and other modifications as explained. 15. Added new strategic initiative 78. Ten Year Housing and Homelessness Plan, and two new performance measures 78-A: Ensure an interdepartmental
committee is operational by Q2 2014, and 78-B: Develop a plan for social housing repairs by Q4 2014. Explanation: The Ten Year Housing and Homelessness Plan and associated performance measure have been added to the 2011-2014 City Strategic Plan to align with Council approval of the Ten Year Housing and Homelessness Plan (10 Year Housing and Homelessness Plan, ACS2013-COS-CSS-0009, September 25, 2013).
16. No available data for performance measure SE1-A: Increase the number of customers rating the City of Ottawa's services at 4 or 5 out of 5 by 5%. . Explanation: Data for the increase in number of customers rating the City of Ottawa’s services at 4 or 5 out of 5 was not available for 2014. Data for this measure will be available only after the external Citizen Satisfaction Survey planned for 2016.
17. Changed strategic initiative name and performance measure related to the Technology Roadmap. FROM: Strategic Initiative #46: ServiceOttawa - Technology Roadmap and performance measure 46-A: "Complete 33% of the overall annual project milestones of ServiceOttawa Technology Roadmap initiatives by the end of 2011, 56% by the end of 2012, 59% by the end of 2013 and 73% by the end of 2014." TO: Strategic Initiative #46: Business Technology Plan and performance measure 46-A: “Complete 100% of the development and preparation of the Business Technology Plan document by Q4 annually". Explanation: Strategic initiative #46 is being amended from the Technology Roadmap to the Business Technology Plan in order to align the 2011-2014 City Strategic Plan with the Business Technology Plan 2014, which was carried by Council on November 27, 2013 (ACS2013-COS-ITS-0003).
18. Changed performance measures SE2-A and 47-A FROM: Meet efficiency savings of $39.15M by 2014: $11.1M in 2012, $10.7M in 2013 and $4.19M in 2014. The remaining savings were achieved in 2010: $4.07M and 2011: $10.67M. TO: Meet efficiency savings of $40.9M by 2014: $11.1M in 2012, $10.15M in 2013 and $4.92M in 2014. The remaining savings were achieved in 2010: $4.07M and 2011: $10.67M. Explanation: The targets for the SE2 objective measure and 47-A initiative measure (both measures are the same) were changed in a report that went to FEDCO on November 5, 2013 (ACS2013-COS-SOD-0006).
19. No available data for performance measure GP3-A. Also, removed performance measure GP3-A: Increase the number of reports presented to Council that are aligned to strategic objective GP3 (“Make sustainable choices”) to 25% by the end of 2012, 50% by the end of 2013 and 95% by the end of 2014. Explanation: Reports to Committee and Council include a section called Term of Council Priorities, which references linkages to Council’s strategic objectives, one of which is “Make Sustainable Choices.” There is no available documentation that demonstrates how the 2012 figure of 33 per cent was obtained for performance measure GP3-A. The Office originally responsible for development, championing and monitoring of the metric no longer exists. Staff has revisited the methodology and refined a calculation that appears to support the original intent of the metric. Specifically, the formula measures the number of action reports to Council (cited as supporting Strategic Objective GP3) against the total number of reports to Council. This measure does not include information reports or administrative reports that have no policy intent. On the basis of that calculation, 2012 results identified 63 reports referencing support for GP3 against a total of 382 reports to Council yielding an alignment rate of 16.5 per cent. In 2013, 72 of 319 reports yielded an alignment rate of 22.6 per cent. The
26

Endnotes: Explanations for unavailable data, and details of changes made to the 2011-2014 City Strategic Plan (since July 2013), including technical amendments, changes approved by Council through the Legislative Agenda, and other modifications as explained.
formula has yielded poor results, likely attributable to ongoing misunderstanding of the metric and how it was to be reported. Given the misunderstanding of the metric since its inception, staff recommended that the performance measure be discontinued.
20. No available data for performance measure 66-A: Conclude 100% of the collective agreement negotiations within Council-approved mandates and without work disruptions in 2012, 2013 and 2014. Explanation: There were no work disruptions throughout the period of 2012-2014. In 2011, 100 per cent of outstanding collective agreements were successfully concluded. In 2012, collective bargaining commenced or continued with six unions and was concluded with five. A resolution of outstanding bargaining issues for the remaining unions (OPFFA and ATU Local 1760) was done through the interest arbitration process. In 2013 and 2014, the City was unable to reach new or renewal collective agreements within the mandates established by Council, though the majority of bargaining issues were resolved through negotiation. Economic increases predominated as the issue which could not be resolved in bargaining with most unions, with the result that a total of six collective agreements were referred to interest arbitration in order to obtain rulings on wage increases and other monetary items.
21. Changed performance measure EE1-A FROM: “Complete the first four of five succession planning process steps by the end of 2013.” TO: “Complete the first three of four succession planning process steps by the end of 2013.” Explanation: The Succession Planning Process has been refined to four steps, not five. A separate step to record competencies is not required because competencies are recorded on job descriptions and reviewed when successors are identified and assessed in Step 2.
22. Changed performance measure EE2-A FROM: "Increase the number of co-op placement, internship and apprenticeship positions (feeder group of new talent) by 5% from 90 positions to 95 positions by the end of 2012." TO: “Increase the total number of internships, apprenticeships, and four-month co-op work term placements (feeder group of new talent) by 5% from ~ 97 to 102 placements annually by the end of 2012.” Explanation: The revised measure is a more accurate reflection for this category as it measures the actual number of placements versus the number of positions that may not necessarily be filled.
23. Changed performance measure FS1-B FROM: “Maintain the ratio of projected total operating spending to total operating budget at 1.” TO: "Maintain the percentage of overall surplus or deficit compared to total operating expenditure budget at 0." Explanation: If the measure is calculated as first defined, we are not taking into consideration revenues, and as a result we show a deficit this year when in fact we ended the year with a surplus. A better measure is the percentage of the actual annual surplus or deficit compared to the total operating expenditure budget. The target would be zero and therefore in essence would be measuring the same intent.
27

Appendix C
Transportation Master Plan (TMP) Phase 1 Projects during the 2015-2018 Term of Council


Appendix C Transportation Master Plan (TMP) Phase 1 Projects during the 2015-2018 Term of Council
Legend: T = Transit, R = Road, C = Cycling, P = Pedestrian, Y = This project is included in the indicated plan
Note: Each project will have its own deliverables within the 2015-2018 Term of Council. For details regarding those deliverables, please contact the Planning and Growth Management Department.
1
Project Details T R C P Enhanced Paved Shoulder Pilot Project
Pilot project for a rural community: enhancement of a small section of paved shoulder to improve mobility for both cyclists and potentially pedestrians.
Y Y
Phase 1 City-wide Enhancements and Bike Parking
Various projects, city-wide. Y
Light Rail Transit Stage 2 – Environmental Assessments and Stage 2 Funding
Finalizing the environmental assessments and secure Stage 2 funding to expand the O-Train system, the City’s overall Light Rail Transit (LRT) network, farther to the east, west and south, specifically: - West to Bayshore Station (O-Train Confederation Line West Extension) and southwest to Baseline Station - East to Place d’Orléans Station (O-Train Confederation Line East Extension) - South to Riverside South at Bowesville (O-Train Trillium Line Extension)
Y
Brian Coburn Boulevard Extension
New two-lane road (ultimately four-lane) between Navan Road and Mer Bleue Road Y
Prescott-Russell Recreational Trail
Multi-Use Pathway - Connection to Cyrville Rd. Y
Mer Bleue Road Widen from two to four lanes between Brian Coburn Boulevard and Navan Road Y
Hope Side Road Complete the preliminary design work Y Greenbank Road Extension New four-lane road between Cambrian Road and Jockvale Road Y Barrhaven Railway Pathway Multi-Use Pathway - Conway-Valiant Tunnel to Highbury Park Dr. Y Longfields to Claridge Multi-Use Pathway Y Campeau Drive New four-lane road between Didsbury Road and Huntmar Drive Y

Appendix C Transportation Master Plan (TMP) Phase 1 Projects during the 2015-2018 Term of Council Legend: T = Transit, R = Road, C = Cycling, P = Pedestrian, Y = This project is included in the indicated plan
Note: Each project will have its own deliverables within the 2015-2018 Term of Council. For details regarding those deliverables, please contact the Planning and Growth Management Department. 2
Project Details T R C PEarl Grey Drive Underpass New underpass of Terry Fox Drive Y Teron Road New sidewalks between Campeau and Penfield Y March Road New sidewalks between Teron Rd and existing south sidewalk Y Varley Drive New sidewalks between Beaverbrook Rd and Carr Cres (inside) Y Halton Terrace New sidewalks between Flamborough Way and Newcastle Ave Y Klondike Road (March to Sandhill Road
New multi-use pathway along south side of road between March Road and Sandhill Road. Y Y
Dumaurier Avenue New sidewalks between Ramsey Cres and Pinecrest Rd Y Old Richmond/West Hunt Club Widen Old Richmond Road/ West Hunt Club Road from two to four
lanes between Hope Side and Highway 416 Y
Parkglen Drive New sidewalks between Woodroffe Ave and Withrow Ave Y Iris Street New sidewalks between Pinecrest Rd and Navaho Dr Y Norice to College Multi-Use Pathway Y Navaho Drive Bike Lanes Woodroffe Ave. to Baseline Rd. Y Nepean Trail Multi-Use Pathway and Shared Lanes Y Longfields to Claridge Multi-Use Pathway Y Hunt Club Neighbourhood Bikeway
Bike Lanes, Shared Use Lanes and Multi-use Pathway Y
Cyrville Road 1 New sidewalks between Startop and Labrie Y Cyrville Road 2 New sidewalks between east of Startop and Labrie Y Cyrville Road 3 New sidewalks between Cummings and Transitway Link Y Cyrville Road Bike Lanes or Paved Shoulders Meadowbrook Rd. to Ogilvie Rd. Y Cummings Avenue New sidewalks between Cyrville Rd and Ogilvie Rd and Y Shefford Road Multi-Use Pathway Y

Appendix C Transportation Master Plan (TMP) Phase 1 Projects during the 2015-2018 Term of Council Legend: T = Transit, R = Road, C = Cycling, P = Pedestrian, Y = This project is included in the indicated plan
Note: Each project will have its own deliverables within the 2015-2018 Term of Council. For details regarding those deliverables, please contact the Planning and Growth Management Department. 3
Project Details T R C PDonald St. - North River Rd. to Cummings Ave. and Cummings Ave. - Donald St. to Ogilvie Rd.
Shared Use Lanes
Y
St.Patrick St. and Murray St. - King Edward Ave. to Sussex Dr.
Shared Use Lanes Y
Beausoleil Dr. - York St. to Cobourg St.
Shared Use Lanes Y
Old St. Patrick St. - Beausoleil Dr. to Cobourg St.
Shared Use Lanes Y
Laurier Ave. Bike Lanes - Nicholas St. to Cumberland St. Y Lowertown - New Edinburgh Neighbourhood Bikeway
Shared Use Lane Y
Coventry Road Bike Lanes North Shopping Mall Entrance to St.Laurent Blvd. Y Mackenzie Avenue Cycle Track Segregated Bike Facility Y O'Connor Street Bikeway Segregated Bike Facility, Shared Use Lane, and Multi-Use Pathway Y Scott St./Albert St. - Holland Ave. to Bronson Ave.
Bike Lanes Y
Byron Avenue Improvements to Existing Multi-Use Pathway and Shared Lanes Island Park Dr. to Holland Ave. Y
Hogs Back Road to Sawmill Creek link
Multi-Use Pathway Y
Airport Parkway Widen from two to four lanes between Brookfield Road and Hunt Club Road Y
Glebe Neighbourhood Bikeway Shared Use Lanes and On-Street Bike Lanes Y Rideau River Western Pathway Multi-Use Pathway Y Alta Vista Hospital Link New road from Riverside Drive to Hospital Ring Road Y
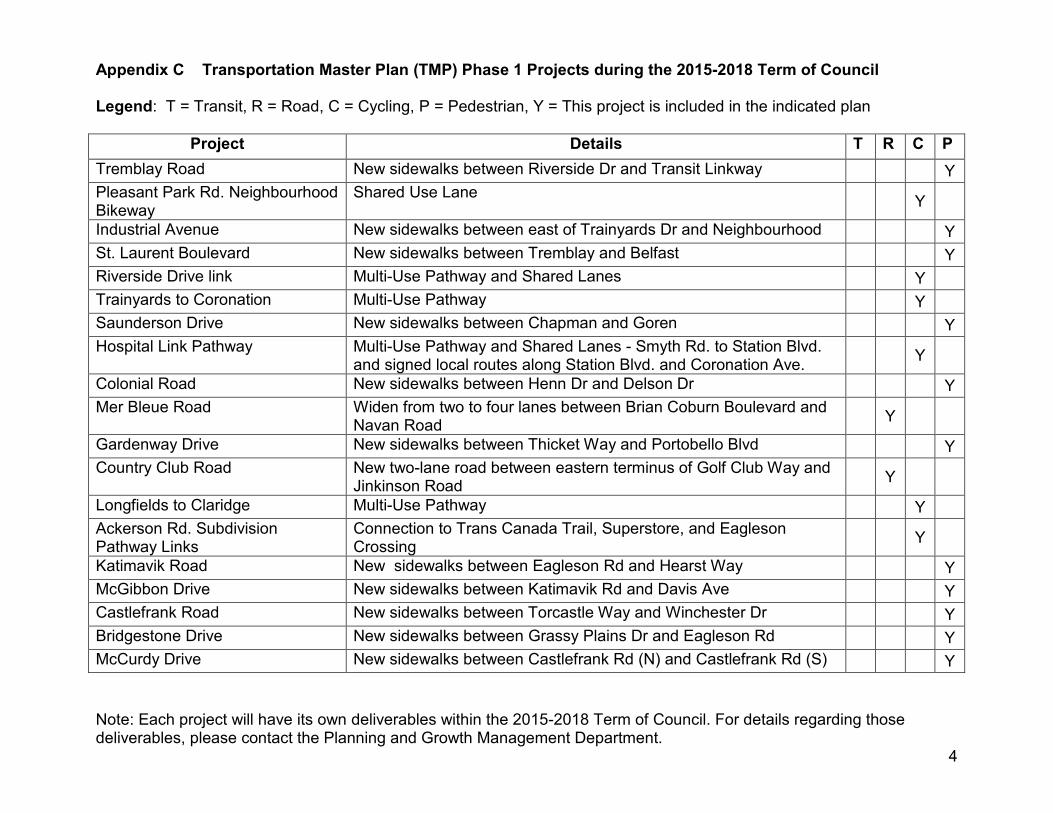
Appendix C Transportation Master Plan (TMP) Phase 1 Projects during the 2015-2018 Term of Council Legend: T = Transit, R = Road, C = Cycling, P = Pedestrian, Y = This project is included in the indicated plan
Note: Each project will have its own deliverables within the 2015-2018 Term of Council. For details regarding those deliverables, please contact the Planning and Growth Management Department. 4
Project Details T R C PTremblay Road New sidewalks between Riverside Dr and Transit Linkway Y Pleasant Park Rd. Neighbourhood Bikeway
Shared Use Lane Y
Industrial Avenue New sidewalks between east of Trainyards Dr and Neighbourhood Y St. Laurent Boulevard New sidewalks between Tremblay and Belfast Y Riverside Drive link Multi-Use Pathway and Shared Lanes Y Trainyards to Coronation Multi-Use Pathway Y Saunderson Drive New sidewalks between Chapman and Goren Y Hospital Link Pathway Multi-Use Pathway and Shared Lanes - Smyth Rd. to Station Blvd.
and signed local routes along Station Blvd. and Coronation Ave. Y
Colonial Road New sidewalks between Henn Dr and Delson Dr Y Mer Bleue Road Widen from two to four lanes between Brian Coburn Boulevard and
Navan Road Y
Gardenway Drive New sidewalks between Thicket Way and Portobello Blvd Y Country Club Road New two-lane road between eastern terminus of Golf Club Way and
Jinkinson Road Y
Longfields to Claridge Multi-Use Pathway Y Ackerson Rd. Subdivision Pathway Links
Connection to Trans Canada Trail, Superstore, and Eagleson Crossing Y
Katimavik Road New sidewalks between Eagleson Rd and Hearst Way Y McGibbon Drive New sidewalks between Katimavik Rd and Davis Ave Y Castlefrank Road New sidewalks between Torcastle Way and Winchester Dr Y Bridgestone Drive New sidewalks between Grassy Plains Dr and Eagleson Rd Y McCurdy Drive New sidewalks between Castlefrank Rd (N) and Castlefrank Rd (S) Y

Appendix D
Community Connectivity Projects (2015-2018)


Appendix D Community Connectivity Projects (2015-2018)
Legend: C = Cycling, including Multi-Use Pathways (MUP), P = Pedestrian, CC = Community Connectivity, Y = This project will be included in the indicated plans.
1
Project #2 Project C P
Y Y Y Y Y
CC1 Campeau Dr. Cycling and pedestrian safety enhancements (Teron Rd. N. to Kanata Ave.) CC2 Trans-Orléans Pathway CC3 Harthill to Halley Link (Harthill Way to Halley St.) CC4 Ogilvie Rd. MUP (Blair Rd. to Montreal Rd.) CC5 Crossing Enhancements: Queen Elizabeth Dr. at Commissioners park and Queen Elizabeth Pl.3;
Colonel By Dr. at the Corktown bridge Y Y
CC6 MacFarlane Rd. paved shoulders (Merivale Rd. to Deakin St.) Y CC7 Linkages and enhancements around Confederation Line stations (Bayview, Pimisi, and Cyrville) 1,2 Y Y CC8 Belfast/Trainyards corridor MUP (Coronation Ave. to Coventry Rd.) Y CC9 Coventry Rd. pedestrian/cycling bridge cycling link to Lola St. (along east side of Ball Park) Y
CC10 Osgoode Pathway to Manotick Link Y Y CC11 Trillium MUP link cycling improvements from Carling to Dow's Lake Y CC12 Cedarview Rd.to Holly Acres Rd. MUP improvements Y CC13 Wayfinding signage and promotion of cycling tourism, city-wide. Y
Note 1: This project includes the following sub-projects, which are also contingent on feasibility of integration with the Confederation Line LRT works now underway: Bayview Station – Bike tracks on both sides of Albert St. in vicinity of station. Pimisi Station – Pedestrian underpass widening to allow ride-through for cyclists, MUP to Empress Ave. south of the LRT Corridor, MUP from Lett St. to Empress Ave., and MUP from Pimisi Station to Preston St. at Albert St. along south side of LRT. Cyrville Station – Sidewalk upgrades west of station.
Note 2: The following projects are “below the line” and will be undertaken should sufficient funding remain after the items in Note 1 have been addressed:

Appendix D Community Connectivity Projects (2015-2018)
Bayview Station – MUP from Bayview Station to Bayview Road along south side of Albert, extend planned MUP north of LRT line to reach Scott/Albert intersection Pimisi Station – Bike tracks on Slater St. from Bronson Ave. to Empress Ave. Cyrville Station – MUP from station to Aviation Parkway St. Laurent Station – MUP or protected right-of-way for future MUP from station to Michael St. Blair Station – MUP or protected right-of-way for future MUP running approximately 750m east of station Lees Station – MUP link from Transitway at Lees Ave. to Robinson Ave.
Note 3: Project relies on joint funding agreement with the National Capital Commission (NCC).
2