
Report to Nottinghamshire County Health and Wellbeing Board
27
1 Report to Nottinghamshire County Health and Wellbeing Board 2 July 2014 Agenda Item: 10 REPORT OF DIRECTOR OF PUBLIC HEALTH Air Quality and Health: delivering longer, healthier lives in Nottinghamshire County Purpose of the Report 1. To advise the Board about the public health significance of good air quality and the adverse health impact of long term exposure to air pollution 2. To highlight the benefits achievable across a number of key public health priorities by joint stakeholder action on air quality, and the synergies associated with public health action on obesity, cardiovascular and respiratory health. 3. To request the Board to: a. endorse the inclusion of a chapter on air quality in the Joint Strategic Needs Assessment b. exercise oversight with Nottingham City Health and Wellbeing Board of the work of the Nottinghamshire Environmental Protection Working Group, by raising the profile of the health impacts of poor air quality, and securing partner engagement to the review and subsequent implementation of the Nottinghamshire Air Quality Improvement Strategy c. receive a draft of the Nottinghamshire Air Quality Improvement Strategy for review and comment at a future meeting. Information and Advice Summary 4. Recent national air pollution events have raised public awareness that air quality remains an important and relevant public health issue. 5. Long term exposure to air pollution is harmful at levels well below current air quality targets. The scientific evidence for the health impacts of air pollution has developed substantially in recent years. For many aspects of air pollution there is now a high degree of certainty about the scale and likely mechanisms for adverse impacts. 6. In Nottinghamshire County the main threat to health from poor air quality arises from anthropogenic particulate air pollution and gases.
Transcript of Report to Nottinghamshire County Health and Wellbeing Board
1
Report to Nottinghamshire County Health and Wellbeing Board
2 July 2014
Agenda Item: 10
REPORT OF DIRECTOR OF PUBLIC HEALTH
Air Quality and Health: delivering longer, healthier lives in Nottinghamshire County
Purpose of the Report 1. To advise the Board about the public health significance of good air quality and
the adverse health impact of long term exposure to air pollution
2. To highlight the benefits achievable across a number of key public health priorities by joint stakeholder action on air quality, and the synergies associated with public health action on obesity, cardiovascular and respiratory health.
3. To request the Board to:
a. endorse the inclusion of a chapter on air quality in the Joint Strategic Needs
Assessment
b. exercise oversight with Nottingham City Health and Wellbeing Board of the
work of the Nottinghamshire Environmental Protection Working Group, by
raising the profile of the health impacts of poor air quality, and securing
partner engagement to the review and subsequent implementation of the
Nottinghamshire Air Quality Improvement Strategy
c. receive a draft of the Nottinghamshire Air Quality Improvement Strategy for
review and comment at a future meeting.
Information and Advice Summary 4. Recent national air pollution events have raised public awareness that air quality
remains an important and relevant public health issue.
5. Long term exposure to air pollution is harmful at levels well below current air quality targets. The scientific evidence for the health impacts of air pollution has developed substantially in recent years. For many aspects of air pollution there is now a high degree of certainty about the scale and likely mechanisms for adverse impacts.
6. In Nottinghamshire County the main threat to health from poor air quality arises from anthropogenic particulate air pollution and gases.

2
7. For the population of Nottinghamshire County in 2010, the scale of impact on death rates of long term exposure to man-made particulate air pollution was equivalent to 430 deaths or a loss of 4270 life-years.
8. Air pollution disproportionately affects the health of the vulnerable and most deprived in society.
9. The Nottinghamshire Environmental Protection Working Group comprises officers from district councils and Nottingham City Council, each of which has statutory duties related to air quality management. The group is engaging partners to review the local Air Quality Improvement Strategy. A Joint Strategic Needs Assessment (JSNA) chapter is being developed which will support the review of the Air Quality Improvement Strategy.
10. A number of achievable actions have been identified which local authorities can take with their partners to improve air pollution and health.
11. The oversight and raised profile that the Nottinghamshire County and Nottingham City Health and Wellbeing Boards can provide would bring renewed focus to the collaborative working that is needed for the development of the Nottinghamshire Air Quality Improvement Strategy and for the realisation of improvements in public health.
Health Impacts of Air Pollution 12. The high air pollution event experienced across the UK in the spring of 2014
again raised public awareness that air quality remains an important and relevant public health issue.
13. In Nottinghamshire County the main air quality hazard arises from anthropogenic
fine particulate matter1 (which are small enough to float in air and are inhaled deep into the lungs) and gases (including NO2, SO2, O3 and some volatile compounds).
14. Much of this pollution comprises products of combustion or incomplete combustion (e.g. soot, benzene-based carcinogens) or friction (e.g. silica, heavy metals, rubber, bitumen). In urban areas, road transport is responsible for up to 70% of the harm associated with air pollution.
15. Evidence of the impacts of air quality on health has developed substantially over recent years. Since 2005 when current EU air pollution limits were set, the scientific understanding of the health effects of everyday air pollution has advanced with the publication of several thousand epidemiological, laboratory and toxicological studies. As a result, there is a high degree of certainty and precision about many of the population effects of even low levels of air pollution. For example:
1 Particulate matter are categorised according to their size in micrometres (thousandths of a
millimetre). Roughly speaking, PM2.5 are approximately 2.5 micrometres in diameter. To put this in context, consider that the breadth of an average human hair is in the order of 100 micrometres.
3
• Studies confirm that there is no safe level of exposure to particulate air pollution. It is toxic well below current EU & UK limits (REVIHAAP, 2013)
• Long term exposure to everyday air pollutants contributes to the development of cardiovascular disease, stroke, lung cancer, respiratory disease, and asthma
• The lower the levels of air pollution, the better the cardiovascular and respiratory health of the population will be, both long- and short-term (WHO Factsheet on outdoor air pollution)
• The impact of air quality on mortality is most closely associated with concentrations of ambient or background PM2.5. (HRAPIE, WHO, 2013). Reductions in population exposure to air pollution yield appreciable benefit in terms of increased life expectancy (COMEAP, 2010). Every 10 µg/m3
decrease in long term exposure of PM2.5 there is associated with an increase in life expectancy of about 7 months (Pope et al, 2009)
• Road transport is responsible for up to 70 per cent of air pollutants in urban areas (King’s Fund, 2013). It is frequently the most deprived in society who experience the greatest impact, through occupying housing closest to main transport routes. Many studies have shown excess health risks in proximity to roads (REVIHAAP, 2013)
• Improving air quality could have an enormous impact on health. The health impacts of air pollution are greater than the risks of passive smoking and transport accidents added together (Department of Health 2010).
16. Important conclusions to draw from this are that the health impacts of air pollution
make it a significant public health problem (irrespective of whether local air quality
targets are being met), and that there is good evidence for how air pollution
causes or contributes to disease processes which lead to premature deaths. The
burden of death and ill-health arising from this is experienced across the whole
population, but it falls disproportionately on those living in environments close to
main transport routes.
17. Public Health England has included an indicator in the Public Health Outcome
Framework relating to air quality. The indicator is a summary measure of the
impact on death rates of long term exposure to man-made particulate air pollution.
It can be expressed in different ways, which are described in detail in Appendix 1.
The indicator underlines the scale of the health impact and the fact that it is
modifiable.
18. Appendix 2 provides a map illustrating current levels of PM2.5 across
Nottinghamshire County and Nottingham City.
The role of Local Authorities
4
19. Nottinghamshire County Council and Nottingham City Council have renewed
responsibility for public health following the government’s 2012 health and social
care reforms and the creation of local Health and Wellbeing Boards to establish
and promote health priorities.
20. Historically local authorities had a major role in protecting public health from
introducing drainage, sanitation and clean water to reducing air pollution from
domestic fires and industrial activity. Local Authorities were instrumental in the
success of the Clean Air Acts that were introduced following the Great Smog of
London in 1952, which is estimated to have caused and brought forward the
deaths of over 12,000 people in London alone. Unlike the smogs of the 19th and
20th centuries, today’s air pollution is almost invisible, but remains deadly.
21. Unitary and lower tier local authorities have spent the last 15 years developing,
implementing and revising air quality strategies and air quality action plans to
reduce air pollution from these ‘invisible’ pollutants. Further essential reductions
in pollutants are proving difficult to achieve.
22. Appendix 3 identifies Local Air Quality Management objectives, and provides
maps of the Local Air Quality Management Areas in Nottinghamshire County and
Nottingham City.
Joint Action on Air Pollution 23. There are a range of evidence based and achievable actions which improve air
quality and health outcomes (e.g. The Kings Fund, 2013). Action can be taken at
a number of levels and, in some cases, overlaps significantly with those to
increase physical activity, decrease obesity and improve cardiovascular and
respiratory health. For example:
• Nearly 80 per cent of car trips under five miles could be replaced by walking, cycling or using public transport (Cabinet Office Strategy Unit 2009).
• Promote active travel among local authority staff, and work with major local employers across all sectors to do the same (King’s Fund, 2013).
• Improve street environments to prioritise place over cars by increasing perceptions of safety, quality of life and ‘walkability’ (King’s Fund, 2013).
• Inform susceptible individuals (the elderly, those with existing heart disease and respiratory disease) of the risks of air pollution, how to take avoiding action and how to use air pollution forecasts (American Heart Association)
• Organise ‘eco-driving’ training for taxi-drivers to encourage more fuel-efficient driving, and reduce idling at taxi ranks (Kilbane-Dawe, 2012)
• Replace boilers with the least polluting models (Kilbane-Dawe, 2012)
• Ensure that new buildings are air quality neutral (Kilbane-Dawe, 2012)

5
• Make full use of local authority powers to regulate types of traffic and traffic flows to ensure that they are fully contributing to public health strategies and goals (King’s Fund, 2013).
24. Prioritising action in this way delivers benefits across the agendas of local
authorities and clinical commissioners, and to the following Public Health and
NHS Outcome indicators.
Indicator (Framework)
Description
1.10 (PHOF) Rate of people killed and seriously injured on the roads, all ages, per 100,000 resident population
1.16 (PHOF) Percentage of people using outdoor space for exercise/health reasons
2.06i (PHOF) Percentage of children aged 4-5 classified as overweight or obese
2.06ii(PHOF) Percentage of children aged 10-11 classified as overweight or obese
2.12 (PHOF) Percentage of adults classified as overweight or obese
2.13i (PHOF) Percentage of adults achieving at least 150 minutes of physical activity per week in accordance with UK CMO recommended guidelines on physical activity
3.01 (PHOF) Fraction of all-cause adult mortality attributable to long-term exposure to current levels of anthropogenic particulate air pollution
3.06 (PHOF) Percentage of NHS organisations with a board approved sustainable development management plan
4.04i (PHOF) Age-standardised rate of mortality from all cardiovascular diseases (including heart disease and stroke) in persons less than 75 years of age per 100,000 population
4.07i (PHOF) Age-standardised rate of mortality from respiratory disease in persons less than 75 years per 100,000 population
2.3i and 2.3ii (NHS OF)
Reducing time spent in hospital by people with long-term conditions i Unplanned hospitalisation for chronic ambulatory care sensitive conditions (adults) ii Unplanned hospitalisation for asthma, diabetes and epilepsy in under 19s
25. Action on air quality is required at multiple levels including at district, city and
county level, and will build on work which is already taking place. Local
authorities work with developers and planners to ensure developments within their
area consider air quality and incorporate design features, mitigation or alternative
provision to reduce or minimise emissions that may affect air quality or climate
change. For example, work is ongoing in Mansfield to change district heating

6
boilers from coal to gas, and use ground-source heat-pump systems in some
blocks of flats which will reduce emissions. In Pleasley, working together with
planning colleagues, proposed new houses have been laid out on short side
streets so their gable ends are to the main road, to reduce the impact of NO2.
26. Nottinghamshire County Council, as the highway authority for most of
Nottinghamshire’s road network outside the Nottingham City boundary, has
identified and is implementing a range of measures to reduce emissions from
road transport throughout Nottinghamshire. These are reported in the Local
Transport Plan that is produced jointly with Nottingham City Council. An excerpt of
the range of activity underway is provided in Appendix 4 for Nottinghamshire
County and Nottingham City.
27. It must be noted however, that the measures detailed in the Local Transport Plans
will not be sufficient on their own to solve the air pollution/air quality challenge
faced in Nottinghamshire County.
28. Although regulatory activity does control polluting emissions, the collective
benefits of small changes in the actions, life and travel choices of individuals will
also have a significant impact on air pollution and on the health of those
individuals.
The role of the Health and Wellbeing Board
29. Prioritising action on air quality would significantly improve the public health
outcomes of people in Nottinghamshire County and Nottingham City. This
requires effective joint working across Nottingham City Council, Nottinghamshire
County Council and all district councils in Nottinghamshire. Departments including
environmental health, transport, housing, planning, and public health all have a
role to play.
30. The Nottinghamshire Environmental Protection Working Group (NEPWG) is about
to review the local Air Quality Improvement Strategy. The membership of NEPWG
includes representatives from Ashfield District Council, Bassetlaw District Council,
Broxtowe Borough Council, Gedling Borough Council, Mansfield District Council,
Newark and Sherwood District Council, Nottingham City Council, Rushcliffe
Borough Council. The NEPWG are seeking engagement from partners including
public health, transport and planning, at district, county and city levels. This joint
approach is critical to the long term success of the strategy and its
implementation. A JSNA chapter on Air Quality is being developed which will
support the review of the Air Quality Improvement Strategy.
31. The Health and Wellbeing Boards in both local authority areas are requested to
exercise oversight of the work of the NEPWG. This includes raising the profile of
7
the health impacts of air quality, and securing partner engagement to the review
of the Nottinghamshire Air Quality Improvement Strategy.
Reasons for Recommendations 32. Air quality is a significant determinant of health. Mortality associated with air
quality features in the Public Health Outcomes Framework.
33. Oversight by the Health and Wellbeing Board will bring additional momentum and
focus to the work of the Nottinghamshire Environmental Protection Working
Group and the local authority partners it represents.
Statutory and Policy Implications 34. This report has been compiled after consideration of implications in respect of
crime and disorder, finance, human resources, human rights, the NHS
Constitution (Public Health only), the public sector equality duty, safeguarding of
children and vulnerable adults, service users, sustainability and the environment
and ways of working and where such implications are material they are described
below. Appropriate consultation has been undertaken and advice sought on these
issues as required.
35. Actions to improve air quality are in line with the principles of sustainability and
will have long term benefits for the environment as well as positive impacts on
health and wellbeing.
RECOMMENDATION/S 1) To note the public health significance of good air quality and that the adverse
health impact on our residents of long term exposure to air pollution is modifiable.
2) To exercise shared oversight with the Nottingham City Health and Wellbeing
Board of the work of the Nottinghamshire Environmental Protection Working
Group, in order to raise the profile of the health impacts of air quality, and to
secure partner engagement to the review and subsequent implementation of
the Nottinghamshire Air Quality Improvement Strategy.
3) To endorse the inclusion of a chapter on air quality in the JSNA.
4) To receive a draft of the Nottinghamshire Air Quality Improvement Strategy for review and comment at a future meeting.
8
For any enquiries about this report please contact: Jonathan Gribbin, Consultant in Public Health, [email protected] Richard Taylor, Operations Manager: Pollution Control Team, on behalf of the Nottinghamshire Environmental Health Working Group, [email protected] Dawn Jenkin, Public Health Specialty Registrar, [email protected] Constitutional Comments (SG 20/06/14) 36. The proposals in this report fall within the remit of the Health and Wellbeing Board.
Financial Comments (KAS 11/06/14) 37. There are no financial implications contained within the report. Background Papers and Published Documents Except for previously published documents, which will be available elsewhere, the documents listed here will be available for inspection in accordance with Section 100D of the Local Government Act 1972. Buck, D. and Gregory, S. Improving the public’s health: A resource for local authorities , The King’s Fund 2013
Review of Evidence of the Health Aspects of Air Pollution (REVIHAAP) - Technical Report, World Health Organisation Office for Europe, 2013
Air Quality - Environmental Audit Committee Memorandum, Department of Health, 2010, Available at http://www.publications.parliament.uk/pa/cm200910/cmselect/cmenvaud/229/229we28.htm, accessed 02.05.2014
The Mortality Effects of Long-Term Exposure to Particulate Air Pollution in the United Kingdom, Committee on the Medical Effects of Air Pollutants (COMEAP)
C. Arden Pope III, Ph.D., Majid Ezzati, Ph.D., and Douglas W. Dockery, Sc.D. Fine-Particulate Air Pollution and Life Expectancy in the United States, New England Journal of Medicine, 2009;360:376-86.
Henschel, S. and Chan, G. Health risks of air pollution in Europe (HRAPIE): New emerging risks to health from air pollution – results from the survey of experts. WHO Regional Office for Europe, 2013.
9
Brook, R.D. et al. Particulate Matter Air Pollution and Cardiovascular Disease : An Update to the Scientific Statement From the American Heart Association, Journal of the American Heart Association, Circulation 2010, 121:2331-2378.
Gowers, A.M. et al. Estimating Local Mortality Burdens associated with Particulate Air Pollution, Public Health England, 2014
Kilbane-Dawe, I. 14 Cost Effective Actions to Cut Central London Air Pollution, Par Hill Research Ltd. Science, Environment and Policy Research. Available at http://www.rbkc.gov.uk/pdf/air_quality_cost_effective_actions_full_report.pdf, accessed 02.05.2014
Cabinet Office Strategy Unit, An Analysis of Urban Transport. 2009. Available at http://webarchive.nationalarchives.gov.uk/+/http:/www.cabinetoffice.gov.uk/media/308292/urbantransportanalysis.pdf, accessed 02.05.2014 Electoral Division(s) and Member(s) Affected
• ’All’
10
APPENDIX 1: Public Health Outcome Indicator 3.01 – explanation and derivation Public Health England has included an indicator in the Public Health Outcome Framework which is the “Fraction of mortality attributable to particulate air pollution”. It is a measure which relates to the impact of air pollution on death rates. In the Public Health Outcomes Framework it is expressed as the percentage of all adult deaths which scientific data indicate are attributable to long term exposure to man-made particulate air pollution. By this measure, in Nottinghamshire County, air pollution is responsible for 5.3% of all adult deaths. Another way of framing this evidence is to say that long term exposure to air pollution is responsible for 430 deaths in Nottinghamshire County. This is helpful for alerting people to the general scale of the problem, but obscures the fact the harmful effect of air pollution is actually experienced more widely than this. A further approach, still based on the same evidence, is to say that long term exposure to air pollution in Nottinghamshire County is responsible for the loss of 4270 life-years each year across the population. Framing the scale of impact in this way underpins the point that the burden of air pollution is experienced across the whole population (not just 430 individuals), i.e. there are many residents whose lives are shortened through long term exposure to air pollution. Derivation Recent research suggests that the effect of long-term exposure to air pollution on mortality is most closely associated with current background levels of particulate pollution (PM2.5). Public Health England, in their report “Estimating local mortality burdens associated with particulate air pollution”2 sets out the estimation of the impact of man-made particulate air pollution (PM2.5) on death rates and life-years lost, for local authorities across the UK. Attributable Fraction Definition: the proportion of deaths estimated as due to long-term exposure to anthropogenic particulate air pollution. Using research on the increased risk of mortality due to particulate air pollution, and the estimated background concentrations of man-made PM2.5 in local areas, this measure gives the percentage of all deaths for that area that are attributable to long-term exposure to current levels of man-made particulate air pollution. Attributable deaths Definition: long-term exposure to anthropogenic particulate air pollution is estimated to have an effect on mortality risks equivalent to the number of attributable deaths. We can quantify the impact of air pollution by considering the number of deaths that would occur in an area if air pollution were the sole cause of death. Measured in this
2 http://www.hpa.org.uk/Publications/Environment/PHECRCEReportSeries/PHECRCE010/

11
way, the impact on death rates is equivalent to 150 deaths in Nottingham City and 430 deaths in Nottinghamshire County in 2010. In reality, air pollution is likely to be a contributory factor to the deaths of a larger number of individuals exposed to the pollution over the long term, rather than being solely responsible for a death. Associated life-years lost Definition: the years of life lost to the population due to increased mortality risk attributable to long term exposure to particulate air pollution. Another way to quantify the impact is in terms of the total number of years of life that are lost across the local population each year through people dying early due to air pollution. This measure gives an estimate of how many more years of life would have been lived by the population if air pollution had not been present. For Nottinghamshire County there were an estimated 4,270 life years lost and for Nottingham City, an estimated 1,559 life years lost in 2010.

12
APPENDIX 2: 2014 PM2.5 Background Concentrations above the WHO limit value, Nottinghamshire County & Nottingham City.

13
APPENDIX 3: Local Air Quality Management The Environment Act 1995 Part IV introduced the requirement for a National Air Quality Strategy (NAQS) and the concept of Local Air Quality Management (LAQM). The Strategy has to include statements on “standards relating to the quality of air” and “objectives for the restriction of the levels at which particular substances are present in the air”. Section 82 of the Environment Act 1995 requires Local Authorities (District Councils and Unitary Authorities, but not County Councils) to review the air quality in their area and assess whether prescribed Air Quality Objectives (AQOs) will be achieved by the specified attainment dates for each pollutant of concern. The objectives are stated in the NAQS and enacted through the Air Quality (England) Regulations 2000 (as amended). Excerpt from the National Air Quality Objectives detailing the common
pollutants
Pollutant
Applies to
Objective
Concentration measured as
Date to be achieved by and
maintained thereafter
Nitrogen dioxide
UK
UK
200 µg/m3 not to be
exceeded more than 18 times a year
40 µg/m3
1 hour mean
annual mean
31 December 2005
31 December 2005
PM10 UK
UK
50 µg/m3 not to be
exceeded more than 35 times a year
40 µg/m3
24 hour mean
annual mean
31 December 2004
31st December 2004
PM2.5 UK (except
Scotland)
Scotland
25 µg/m3 (target)
12 µg/m3 (limit)
annual mean
annual mean
2020
2020
Sulphur dioxide
UK
UK
UK
125 µg/m3 not to be
exceeded more than 3 times a year
350 µg/m3 not to be
exceeded more than 24 times a year
266 µg/m3 not to be
exceeded more than 35 times a year
24 hr mean
1 hr mean
15 min mean
31 December 2004
31 December 2004
31 December 2005
14
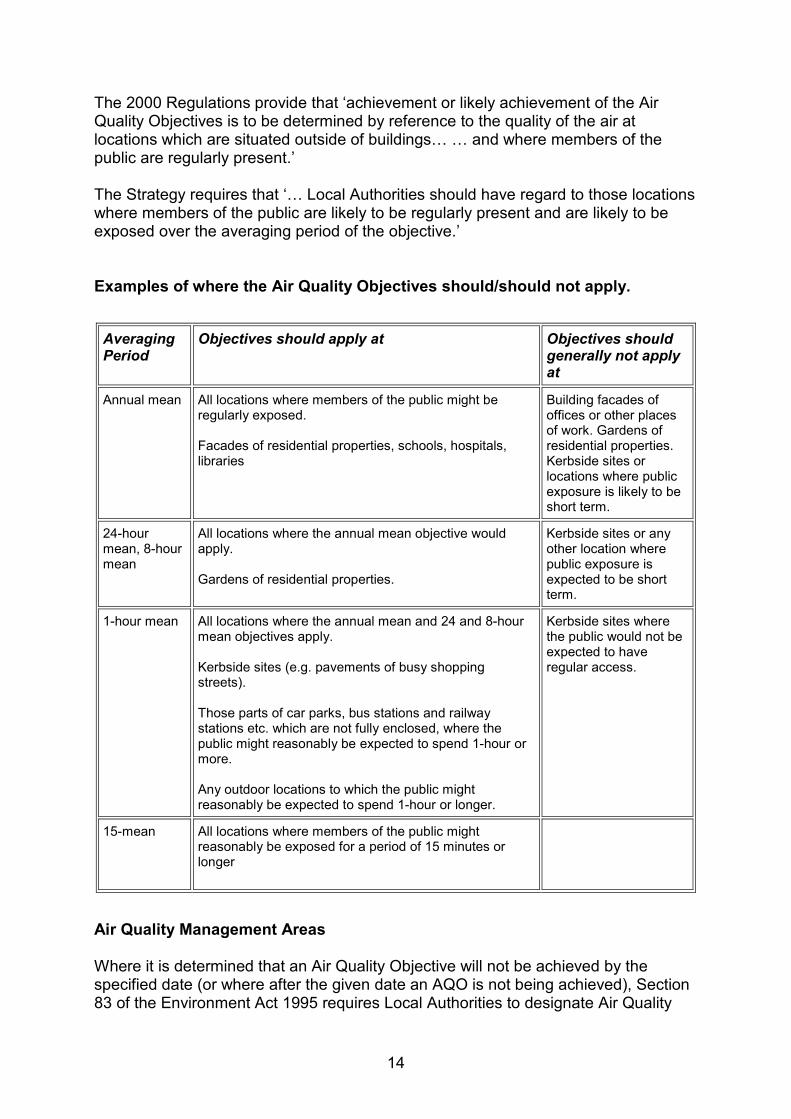
The 2000 Regulations provide that ‘achievement or likely achievement of the Air Quality Objectives is to be determined by reference to the quality of the air at locations which are situated outside of buildingsO O and where members of the public are regularly present.’ The Strategy requires that ‘O Local Authorities should have regard to those locations where members of the public are likely to be regularly present and are likely to be exposed over the averaging period of the objective.’ Examples of where the Air Quality Objectives should/should not apply.
Averaging Period
Objectives should apply at Objectives should generally not apply at
Annual mean All locations where members of the public might be regularly exposed. Facades of residential properties, schools, hospitals, libraries
Building facades of offices or other places of work. Gardens of residential properties. Kerbside sites or locations where public exposure is likely to be short term.
24-hour mean, 8-hour mean
All locations where the annual mean objective would apply. Gardens of residential properties.
Kerbside sites or any other location where public exposure is expected to be short term.
1-hour mean All locations where the annual mean and 24 and 8-hour mean objectives apply. Kerbside sites (e.g. pavements of busy shopping streets). Those parts of car parks, bus stations and railway stations etc. which are not fully enclosed, where the public might reasonably be expected to spend 1-hour or more. Any outdoor locations to which the public might reasonably be expected to spend 1-hour or longer.
Kerbside sites where the public would not be expected to have regular access.
15-mean All locations where members of the public might reasonably be exposed for a period of 15 minutes or longer
Air Quality Management Areas Where it is determined that an Air Quality Objective will not be achieved by the specified date (or where after the given date an AQO is not being achieved), Section 83 of the Environment Act 1995 requires Local Authorities to designate Air Quality

15
Management Areas (AQMAs) by order and; to formulate and publish corresponding Air Quality Action Plans (AQAPs). There are currently 10 designated Air Quality Management Areas in Nottinghamshire. All the areas arise due to nitrogen dioxide from road traffic and thus occur at the City and County’s major roads and junctions. Broxtowe Borough Council Air Quality Management Areas
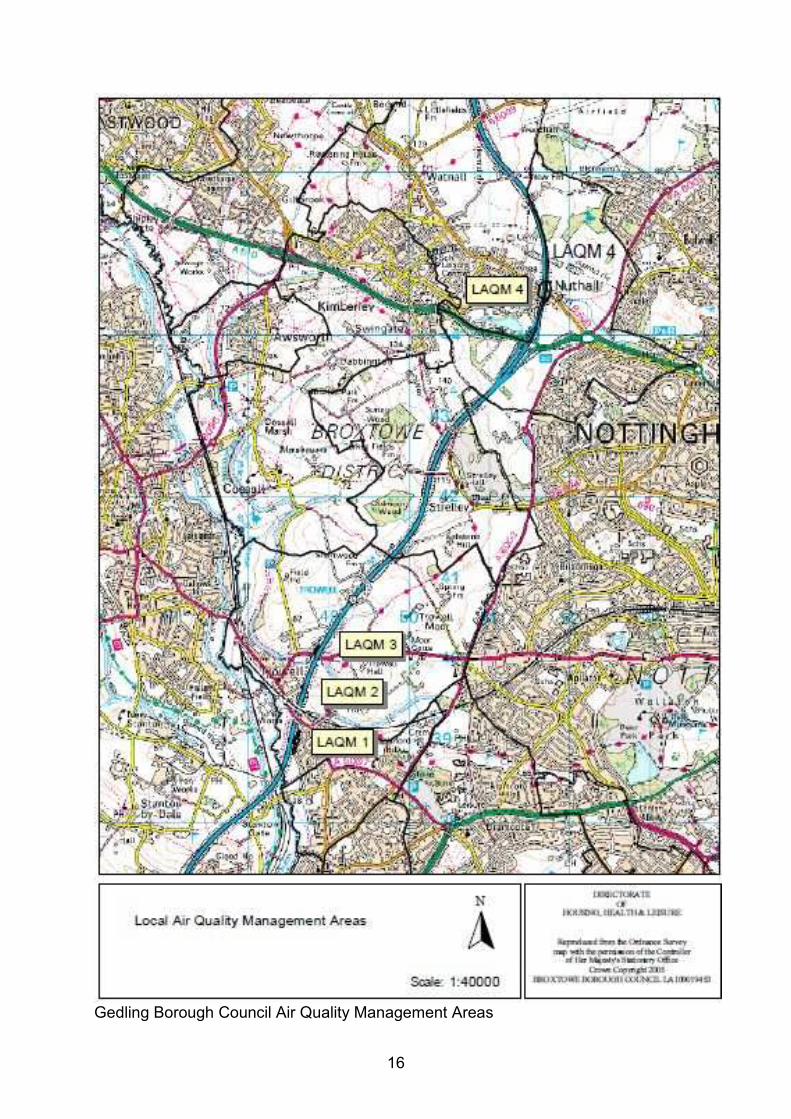
16
Gedling Borough Council Air Quality Management Areas
17
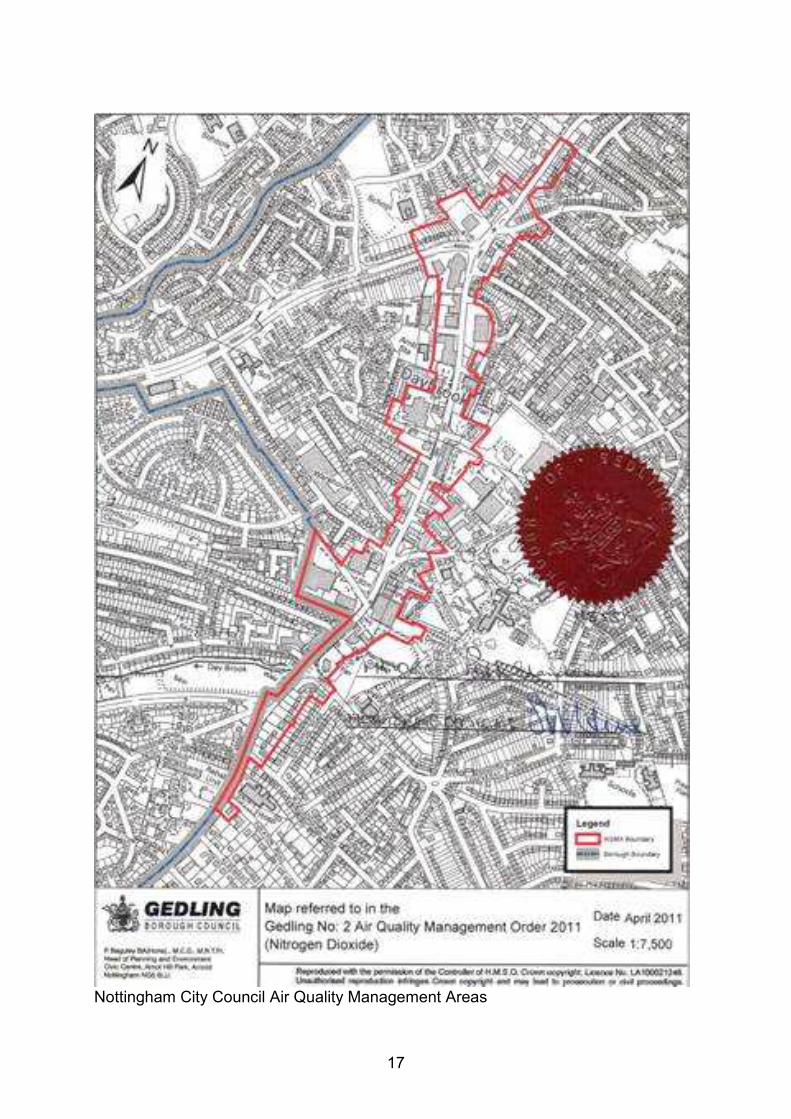
Nottingham City Council Air Quality Management Areas

18
Rushcliffe Borough Council Air Quality Management Areas (less Stragglethorpe jnctn)

19
Air Quality Action Plans
20
Throughout the LAQM Review and Assessment process, local road traffic has been identified as the major source of the measured/predicted exceedences of the nitrogen dioxide annual mean AQO. Consequently the Air Quality Action Plans (AQAP) have been incorporated into the Local Transport Plan (LTP). The aim of AQAP is to improve air quality and reduce areas of exceedence. It contains a description of measures to be taken and dates by which it is hoped they will be achieved. The AQAP relating to the current AQMAs were produced in June 2010 and are part of the current LTP – ‘Nottingham City Council’s Local Transport Plan 3: 2011 – 2026 Strategy’ (LTP 3). Nottingham City Council’s Local Transport Plan can be found at the following web address which also has links to associated documents and pages: www.nottinghamcity.gov.uk/transportstrategies Nottinghamshire County Council’s Local Transport Plan can be found at the following web address which also has links to associated documents and pages http://www.nottinghamshire.gov.uk/travelling/travel/plansstrategiesandtenders/local-transport-plan/ltp3/ Air Quality Strategy Whilst only four local authorities have declared Air Quality Management Areas, local authorities are keen to ensure that they work together in a co-ordinated manner to manage and, where possible, improve local air quality. Furthermore, government guidance recommends all local authorities whether or not they have any AQMAs within their area, to devise local air quality strategies to improve air quality and minimise the effects of global warming and climate change. With this in mind the emission inventory and results of a survey undertaken across Nottinghamshire of attitudes and what people and businesses might be prepared to do to improve air quality were used to help establish an air quality framework agreed by all the local authorities and partner organisations (the Environment Agency, the Health Protection Agency and Primary Care Trusts) in Nottinghamshire to ensure effective consultation and co-operation. Recent developments in the evidence and other technological advances, together with recent organisational changes to the former HPA and PCTs, mean that the strategy now requires revision. The current Nottinghamshire’s Air Quality Improvement Strategy ‘A breath of fresh air’ may be found in the download section at:- http://www.nottinghamcity.gov.uk/article/23015/Air-Quality

21

22
APPENDIX 4: Current Activities to address Air Quality, Incorporated into the Local Transport Plan Nottingham City: Current sustainable transport activities to improve Air Quality by supporting modal shift to sustainable alternatives: At a strategic level:
• Development of an integrated public transport network through the delivery
of NET Phase 2 providing Lines 2 and 3 of the tram with associated park
and ride due to open in late 2014 along the the south and south-west
corridors of the conurbation serving key destinations including NUHT QMC
campus, University of Nottingham and NG2 Business Park.
• Implementation of the UK’s first Workplace Parking Levy for businesses
with 11 or more parking spaces which encourages businesses and
commuters to adopt more sustainable travel options.
• Delivery of £15million Local Sustainable Transport Fund programme
across the Nottingham urban area
The Nottingham urban area Local Sustainable Transport Fund programme 2011/12 – 2014/15 comprises 4 areas of activity: A: Smartcard development and integrated ticketing: Establishment of a smartcard retail network across the conurbation is on track for completion in 2014 including a network of onstreet ticket vending machines located at NET stops, city centre bus stops, local centres and key locations across the conurbation along with a network of Payzone outlets at 175 shops and improved Kangaroo website. Also providing funding for half price travel deal for job seekers and access to college. B: Community Smarter Travel Hubs and liveable neighbourhoods: Community Smarter Travel Hubs offer new way of engaging with local people, community groups and businesses to promote travel options. A network of five Community Smarter Travel Hubs has been established with dedicated Travel Coordinators to directly engage with communities to respond to barriers to travel and providing advice on smarter choices, e.g. how to save money on travel, save time, get healthy, learn new skills including volunteering opportunities and gain employment. This project is a joint venture with Nottingham City Public Health part funding the Travel Coordinator posts. A programme of 20mph limits is being implemented across the City to create a network of low speed residential roads more conducive to walking and cycling along with safer routes to school schemes; C: Creating a low carbon transport network including WorkSmart sustainable travel business support programme through the GNTP Business Club services: EcoStars accreditation scheme (see below; investment in electric local ink buses (see below); cycle infrastructure development; Citycard Cycle Club (see below); and City Car Club (launched this month); D: Active Travel Partnerships to deliver a community-wide walking and cycling programme to encourage uptake of walking and cycling - see below. Specific transport projects which are directly improving air quality:
23
• Roll out of Ecostars programme with employers in the Nottingham urban
area to promote eco-driving and greener fleets, has supported over 50
organisations (LSTF funding)
• Electric link bus network – 8 currently in service, a further 20 buses to be
launched in June 2014. By end of 2015 will have 56 EVs in the locallink
fleet = largest electric bus fleet in Europe (LSTF, LTP, and Green Bus
Funding)
• Kick-starting investment in EV infrastructure by providing a network of EV
charging points at park and ride sites and rail station and working with the
Plugged in Midlands partnership to encourage employers to install EV
charging points at their worksites – (LTP and Plugged in Midlands funding)
Examples of Local Sustainable Transport Fund initiatives to increase active travel • Established a network of Citycard Cycle and Cycle Hubs: 12 Citycard cycle
hubs have been introduced at all Park and Ride sites, bus and rail stations
and key points across the city centre. Citycard holders can access these
secure own bike parking facilities for free using their Citycard. The Citycard
Cycle Hire scheme provides 400 hire bikes and docking stations providing
to promote sustainable travel for residents, commuters and tourists.
Improvements to the hire scheme using mobile phone bookings are now
being rolled out.
• Community-wide cycling programme to encourage uptake of cycling by
providing a programme of events, support, advice and training through
Smarter Travel Hubs, schools, colleges, universities workplaces including:
• free one to one and group cycle training;
• a programme of community rides;
• regular Cycle Centres providing a range of cycle services in
communities;
• high profile annual active travel events calendar (attended by over
12,000 people in 2013) including Light Night, Cycle Live, Milk race
and European Mobility Week;
• Bikeability, Lifecycle and active travel programmes in primary and
secondary schools; and
• continuation of the Ucycle programme in universities and FE
colleges.
Future activities – include delivery of Cycle City Ambition Plan including package of infrastructure improvements to deliver a transformational change in the way citizens are able to travel around the City by bike comprising:
• North – south and east - west cross city cycle corridors
• A network of cross city centre cycle routes
• Investment in off road routes through parks and green spaces
including River Leen corridor
• Investment in our neighbourhood cycle facilities
(This is subject to capital funding bid through the D2N2 Strategic Economic Plan)

24
A bid for £1.180 million has also been submitted to the Department for Transport for continuation of Local Sustainable Transport Fund activities working with communities and the business sector with a focus on access to employment for 2015/16 complemented by a £1million bid for capital funding for small-scale sustainable travel infrastructure through the D2N2 Local Enterprise Partnership. The outcome of these funding bids is expected in July 2014.
25
Nottinghamshire County Council: Highways Division Activity on Active Travel 1. Background The County Council Highways division undertakes a variety of programmes that encourage more healthy, active travel including an annual programme of ‘smarter choices’ activities as well as infrastructure improvements. These programmes aim to reduce congestion by encouraging people to travel sustainably through:
• Promotion of active and sustainable travel (e.g. production of
cycling leaflets and acting as a signpost to local, regional and
national walking and cycling travel planning websites)
• Travel planning (e.g. residential travel plans as part of new
developments, workplace and school travel plans)
• Grants for small scale capital projects for businesses that develop
voluntary travel plans
• Development control (e.g. working with planning authorities to
minimise the impacts of development and ensure that walking and
cycling facilities are provided)
• Infrastructure improvements to improve access to local services on
foot and bicycle (e.g. crossing facilities, footway improvements,
cycle routes and safety improvements to encourage walking and
cycling such as 20mph speed limits outside schools).
In addition to the above, in 2013/14 the County Council also set up two enhanced pilot programmes aimed at reducing congestion through encouraging more walking, cycling (and bus use) which are detailed below. 2. Enhanced targeted travel planning A programme of County Council funded personalised and workplace travel planning was undertaken during 2013/14. The objective of the travel planning was to reduce car use for short, local, journeys (up to five miles) by promoting awareness of sustainable travel options, such as walking, cycling and passenger transport. The travel planning was undertaken in the Mansfield, Sutton in Ashfield and Worksop areas. These locations were selected due to the fact that they have:
• High levels of people travelling short distances to work by car
• Congestion hotspots on the local road network
• Higher than average levels of obesity and poor health
• High frequency bus services
• Existing good pedestrian access to local services/workplaces
• Existing under-used cycle facilities.
2.1 Workplace travel planning Workplace travel planning was undertaken at ten business parks (encompassing over 200 businesses) in the Mansfield and Worksop areas. The project included meetings with management to ensure corporate ‘buy-in’ and established travel planning forums/clubs on each of the business parks to help ensure the work is sustained beyond the life of the initial project. Information on walking, cycling and bus facilities was provided to all staff; followed by travel clinics at each business park

26
delivering individually tailored travel advice, cycle maintenance sessions, the offer of training, and incentives such as subsidised bus tickets. Walking, cycling and bus infrastructure improvements on routes to the business parks have been identified and, where possible, will be delivered during 2014/15 to encourage sustainable journeys. Existing travel habits have been surveyed and post-project surveys will be undertaken later in 2014 which will be used to evaluate the success of the project. 2.2 Personalised travel planning Personalised travel planning was undertaken with approximately 12,000 households in the Mansfield Woodhouse, Sutton in Ashfield and Worksop areas (approximately 5,000 in Mansfield Woodhouse; 3,000 in Sutton in Ashfield; and 4,000 in Worksop). The project included introductory written information on the programme to all the households followed shortly by a visit from a travel advisor to discuss existing travel habits, the different travel options available (and their benefits) and to discuss what travel information on these options the household may like to receive. A tailored travel information pack with the requested details, along with travel incentives such as subsidised bus tickets, was then provided to each household. A full evaluation of the project was undertaken with participants including travel behaviour surveys before and after the programme was undertaken. Whilst the data is still being analysed the results show that the personalised travel planning was very successful in reducing single occupancy car trips on both work and shopping trips. Amongst those who participated:
• Single occupancy car journeys to work decreased by 18% (from
68% to 50% of all trips).
• Walking journeys to work increased by 2% (from 11% to 13% of all
trips)
• Cycling journeys to work increased by 3% (from 2% to 5% of all
trips)
• Bus journeys to work increased by 7% (from 6% to 13% of all trips)
• Train journeys to work increased by 1% (from 1% to 2% of all trips)
• Car sharing journeys to work increased by 6% (from 7% to 13% of
all trips)
At a more local level:
• In Mansfield Woodhouse walking journeys to work increased by 3%
but cycling journeys to work decreased by 1%
• In Sutton in Ashfield walking journeys to work increased by 2% and
cycling journeys to work increased by 5%
• In Worksop walking journeys to work increased by 4% and cycling
journeys to work increased by 7%.
2.3 Future programmes
27
Given the success of the programmes in reducing single occupancy car use it is planned to undertake personalised travel planning in the Gedling area (locations to be determined) during the 2014/15 financial year. This is to complement the work being undertaken to address the Air Quality Management Area along the A60 in Daybrook. A Local Sustainable Transport Fund (LSTF) bid has also been made to extend the personalised and workplace travel planning undertaken in Mansfield and Worksop to a further 40,000 households and approximately 29,000 employees. A decision on the bid will be made in July 2014 and if the bid is successful the programme would be delivered in 2015/16. 3. Smarter travel co-ordinators In 2012 the County Council submitted a successful joint Local Sustainable Transport Fund (LSTF) bid with Nottingham City Council for the Greater Nottingham area. The LSTF bid aims to improve the local economy whilst reducing carbon emissions (e.g. by reducing congestion and improving access to work by increasing the numbers of journeys made on foot, cycle and bus). The County Council has facilitated the employment of smarter travel co-ordinators in the Broxtowe and Gedling districts to support the Greater Nottingham LSTF activities by working with local communities to encourage more walking and cycling, particularly on work journeys. The co-ordinators brief includes the development and management of an annual programme of events and interventions, marketing campaigns, and developing a network of local volunteer smarter travel champions to help ensure the project is sustained in the longer term. The two posts are being funded from local developer contributions secured through the planning process. The Broxtowe co-ordinator is provisionally contracted for one year (with the possibility of extending it to March 2015 if Broxtowe Borough Council can secure additional funding), whilst the Gedling co-ordinator is contracted up to the end of March 2015. END OF APPENDICES


![Armes v Nottinghamshire County Council [2017] UKSC · PDF fileMichaelmas Term [2017] UKSC 60 On appeal from: [2015] EWCA Civ 1139 JUDGMENT Armes (Appellant) v Nottinghamshire County](https://static.fdocuments.net/doc/165x107/5a86a6f87f8b9a001c8d3470/armes-v-nottinghamshire-county-council-2017-uksc-term-2017-uksc-60-on-appeal.jpg)


