Report-race and ethnicity
17
1 Linda Robinson Race and Ethnicity-Task 3 By Linda Robinson Tutor: Sue Ball Humanies and Social Sciences Access to Higher Educaon Page
-
Upload
linda-robinson -
Category
Technology
-
view
767 -
download
1
Transcript of Report-race and ethnicity
1
Linda Robinson
Race and Ethnicity-Task 3
By Linda Robinson
Tutor: Sue Ball
Humanities and Social Sciences Access to Higher Education Page
2
Linda Robinson
Contents
1.Introduction Pg 3
2.Demographics Pg 3-4
3.Issues Pg 9
3.1 Ethnicity and Health Pg 9-10
3.2 Ethnicity and Education Pg 10
4.Explanations Pg 11-15
4.1 Ethnicity and Health Pg 11-13
4.2 Ethnicity and Education Pg 13-15
5.Bibliography Pg 16-17
Tables and Figures
Figure 1.0 Percentages of the composition of ethnic minorities in the UK Pg 5Figure 1.1- Change in ethnicity 2001-2011 Pg5Figure 1.2 -Percentage of ethnic minority pupils attaining 5 A-C GCSE’s Pg 6Figure 1.3 -Number of pupils permanently excluded from school in 2000-2001 Pg 6Figure 1.4 -Percentage of ethnic minorities reporting bad health Pg7Figure 1.5 -Percentage of working age employees earning less than £7 per hour Pg 7Figure 1.6 -Number of 16-20 year olds who are likely to go to prison; per 1000 Pg 8Figure 1.7 -Estimated annual prevalence of psychosis by gender Pg 8
1. IntroductionHumanities and Social Sciences Access to Higher Education Page
3
Linda Robinson
This report will attempt to investigate the life chances of different ethnic groups in the following areas; health and education. In order to do this the report I will first define ethnicity, explain the demographics of the U.K, I will also look at statistics and some possible explanations.Ethnicity or ethnic group is a socially defined category based on common culture or nationality. Ethnicity can, but does not have to, include common ancestry, appearance, cuisine, dressing style, heritage, history, language or dialect, religion, symbols, traditions, or other cultural factors. Ethnic identity is constantly reinforced through common characteristics which set the group apart from other groups.
2. DemographicsEngland and Wales has become more ethnically diverse with rising numbers of people identifying as belonging to a minority ethnic groups in 2011. Despite the White ethnic group decreasing in size; it is still the majority ethnic group that people identify with.Below are the different ethnic groups in the UK.
White;• English / Welsh / Scottish / Northern Irish / British • Irish • Gypsy or Irish Traveller • Any other White background
Mixed / Multiple ethnic groups;• White and Black Caribbean • White and Black African • White and Asian • Any other Mixed / Multiple ethnic backgrounds
Asian / Asian British;• Indian • Pakistani • Bangladeshi • Chinese • Any other Asian background
Black / African / Caribbean / Black British• African • Caribbean • Any other Black / African / Caribbean background
Other ethnic group• Arab • Any other ethnic group
According to the 2011 census; 37% of Londoners are born in foreign country.
Humanities and Social Sciences Access to Higher Education Page
4
Linda Robinson
The figure is 5% for north-east. 13% of the population in England and Wales born outside UK. Just over half of these arrived in last 10 years. India, Poland and Pakistan were the top three countries were foreign UK residents in England
and Wales originate. 7.4% of people in England and Wales hold non-UK passports. White ethnic group is down five points to 86%. Whites in London are 59.8%. 80% in England and Wales are white British, down seven points. In London white British figure is 45%, down from 58% in 2001. Other ethnic groups in England and Wales: Asian (Pakistani, Indian, Bangladeshi, other) 6.8%
(2001: 4.4%), black 3.4% (2001: 2.2%), Chinese 0.7% (2001: 0.4%), Arab 0.4% (2001: not listed), other 0.6% (2001: 0.4%).
2.2% in England and Wales are mixed race (up from 1.27% in 2001). 12% of households had partners or household members of different ethnic groups, three points
up from 2001. 27% have degree-level qualifications; 23% have no qualifications. (www.guardian.co.uk)
From the above information is it clear that most cities in the UK are demographically diverse and the ethnic variety is increasing. Additionally, nearly of half of London does not identify as British and nearly 40% of Londoners were not born in the UK.
Figure 1.0 Percentages of the composition of ethnic minorities in the UK
Humanities and Social Sciences Access to Higher Education Page
5
Linda Robinson
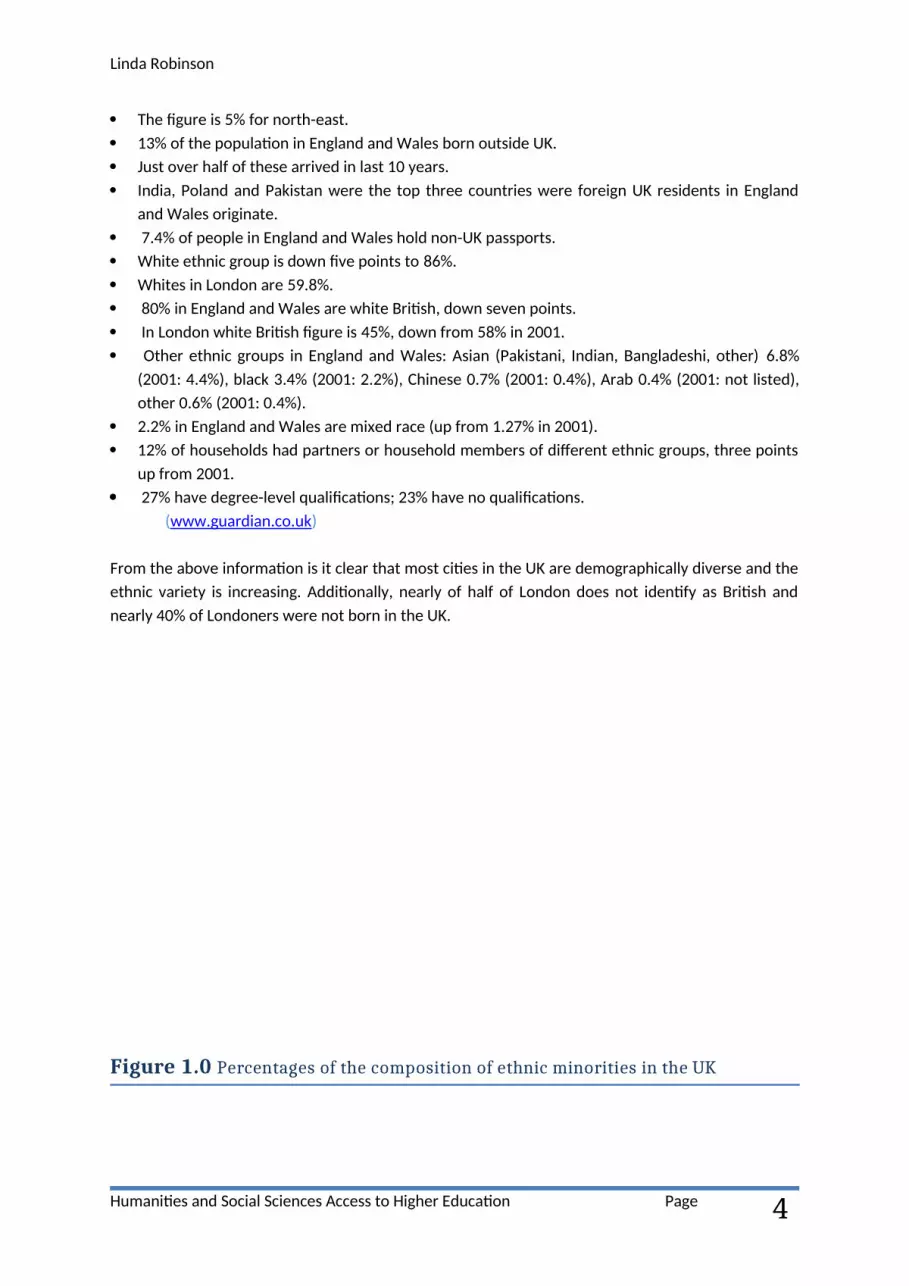
(www.britishgerontology.org)
Figure 1.0 tells us that: 7.9% of the UK is not White 22.7% of those are Indian 16.1% of those are Pakistani 12.2% are Black Caribbean 6.1% of those are Bangladeshi 5.3% are Chinese
From the above information is it clear that the UK is demographically diverse and the ethnic variety is increasing. Additionally, nearly of half of London does not identify as British and nearly 40% of Londoners were not born in the UK.
Figure 1.1 Change in ethnicity 2001-2011
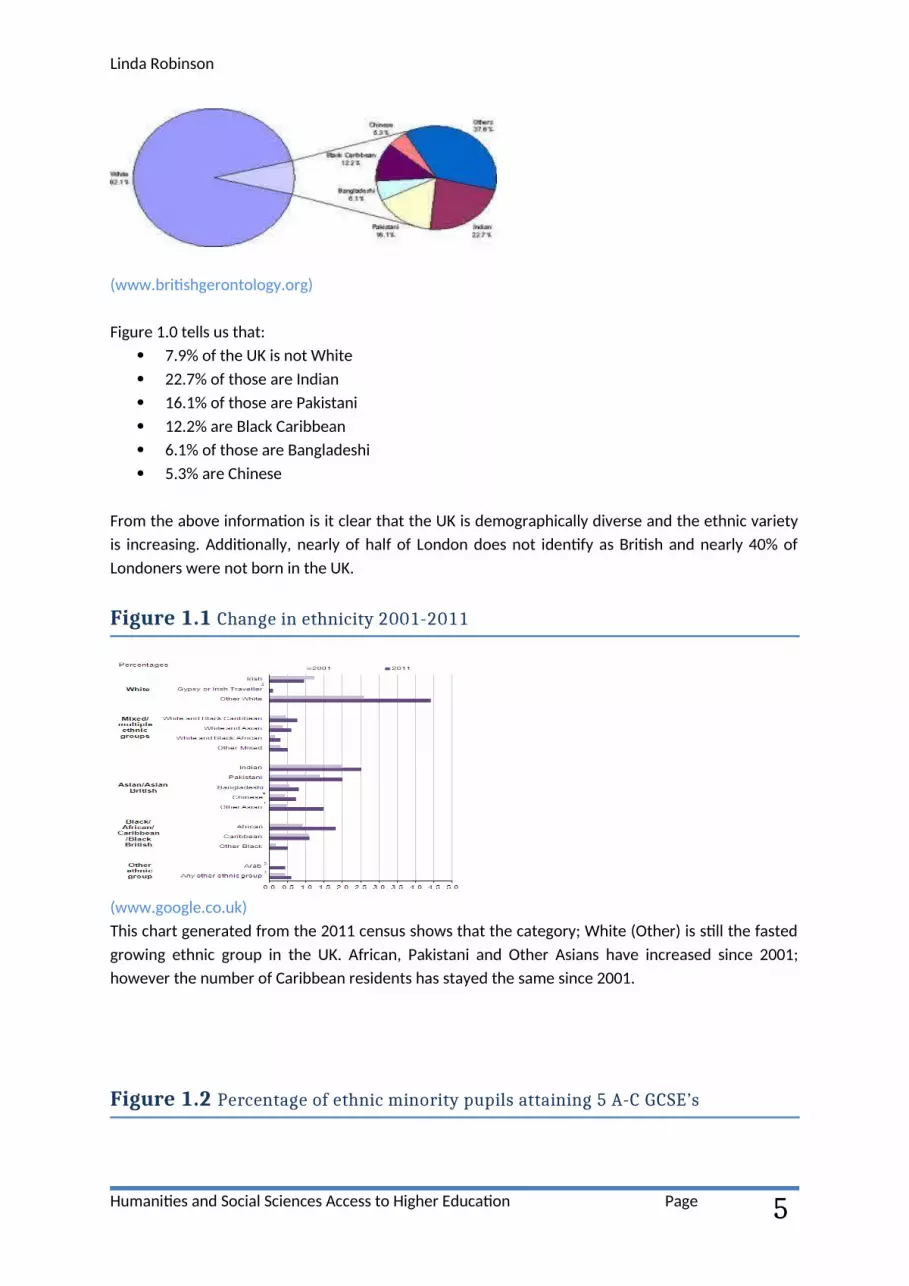
(www.google.co.uk)This chart generated from the 2011 census shows that the category; White (Other) is still the fasted growing ethnic group in the UK. African, Pakistani and Other Asians have increased since 2001; however the number of Caribbean residents has stayed the same since 2001.
Figure 1.2 Percentage of ethnic minority pupils attaining 5 A-C GCSE’s
Humanities and Social Sciences Access to Higher Education Page
6
Linda Robinson
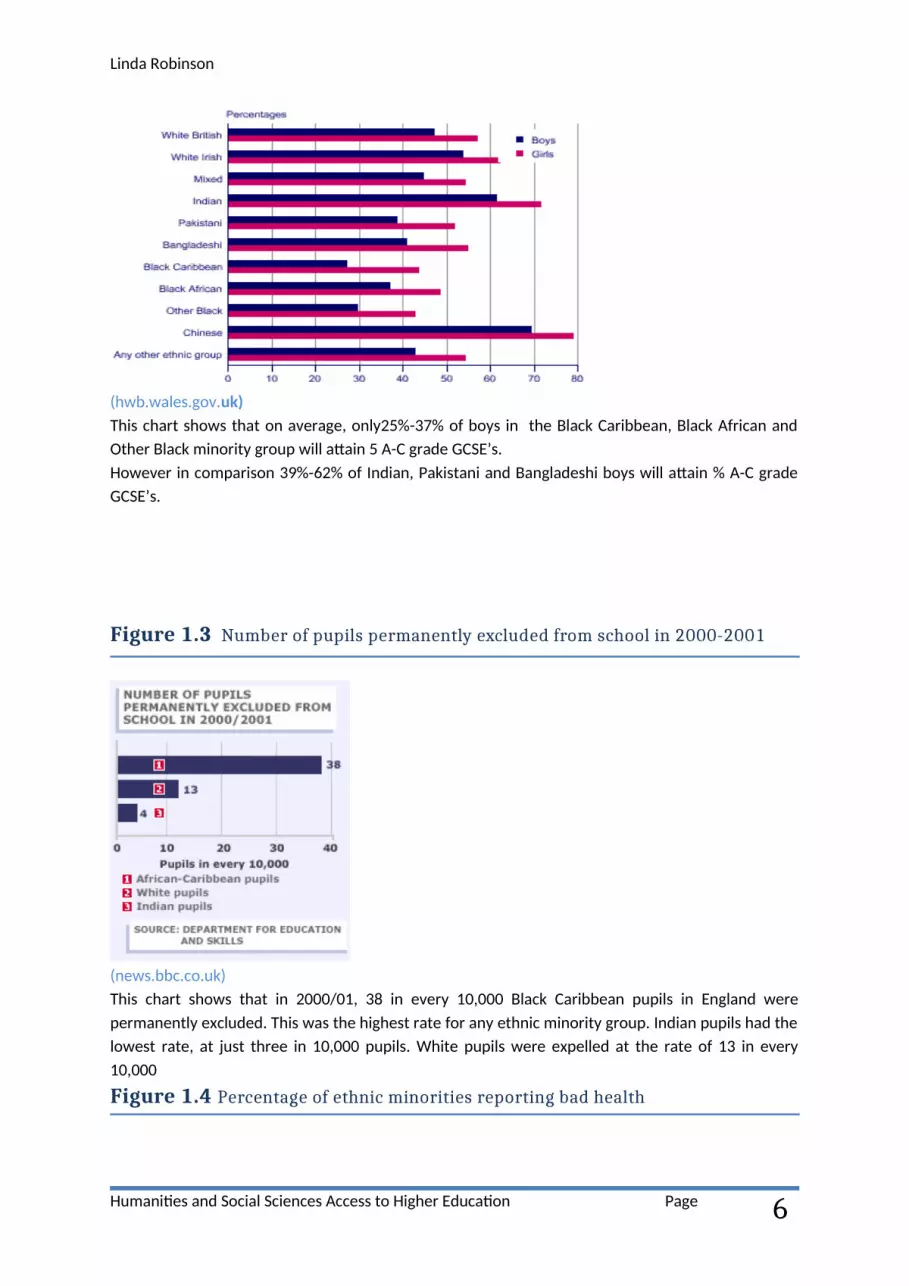
(hwb.wales.gov.uk)This chart shows that on average, only25%-37% of boys in the Black Caribbean, Black African and Other Black minority group will attain 5 A-C grade GCSE’s. However in comparison 39%-62% of Indian, Pakistani and Bangladeshi boys will attain % A-C grade GCSE’s.
Figure 1.3 Number of pupils permanently excluded from school in 2000-2001
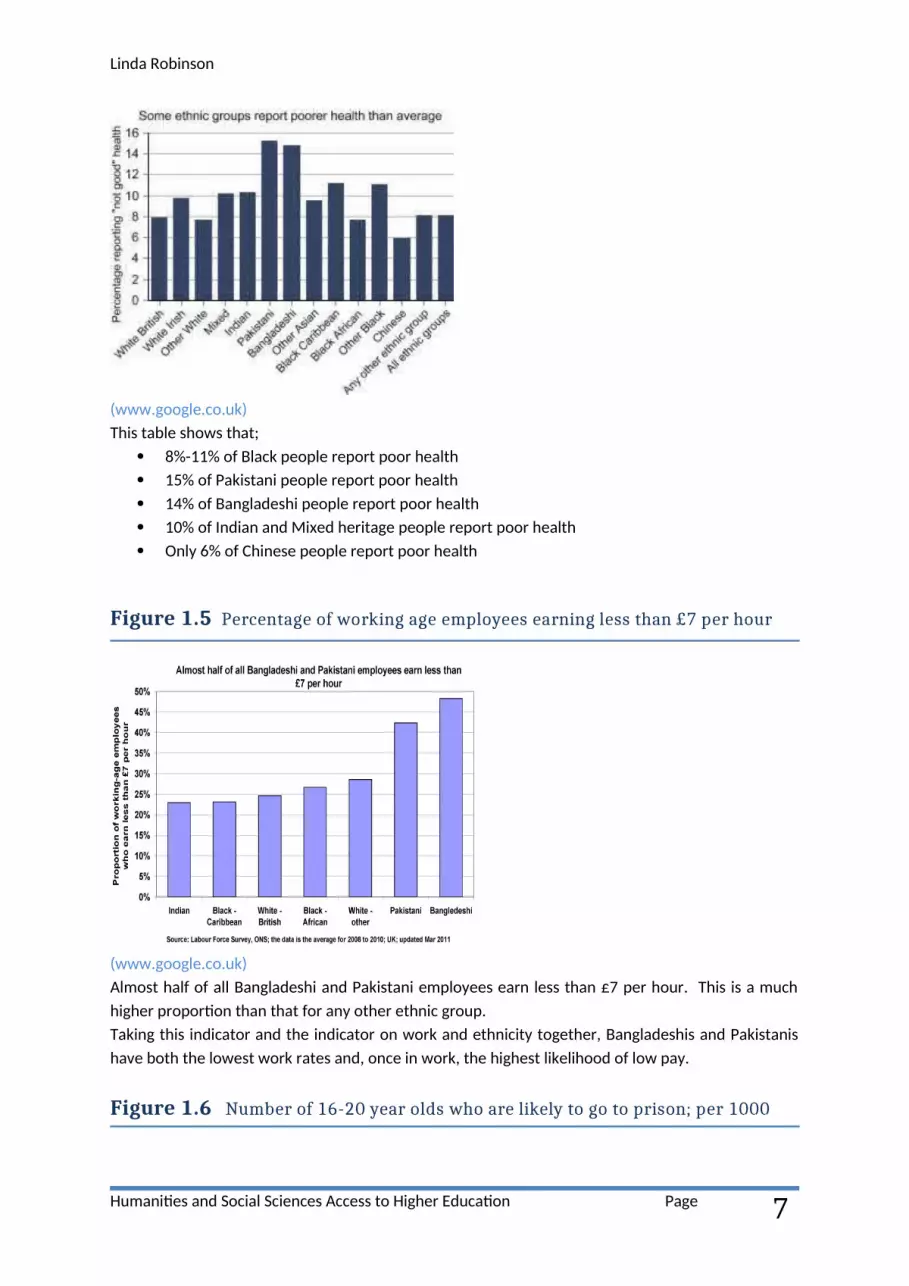
(news.bbc.co.uk)This chart shows that in 2000/01, 38 in every 10,000 Black Caribbean pupils in England were permanently excluded. This was the highest rate for any ethnic minority group. Indian pupils had the lowest rate, at just three in 10,000 pupils. White pupils were expelled at the rate of 13 in every 10,000
Figure 1.4 Percentage of ethnic minorities reporting bad health
Humanities and Social Sciences Access to Higher Education Page
7
Linda Robinson
(www.google.co.uk)This table shows that;
8%-11% of Black people report poor health 15% of Pakistani people report poor health 14% of Bangladeshi people report poor health 10% of Indian and Mixed heritage people report poor health Only 6% of Chinese people report poor health
Figure 1.5 Percentage of working age employees earning less than £7 per hour
(www.google.co.uk)Almost half of all Bangladeshi and Pakistani employees earn less than £7 per hour. This is a much higher proportion than that for any other ethnic group.Taking this indicator and the indicator on work and ethnicity together, Bangladeshis and Pakistanis have both the lowest work rates and, once in work, the highest likelihood of low pay.
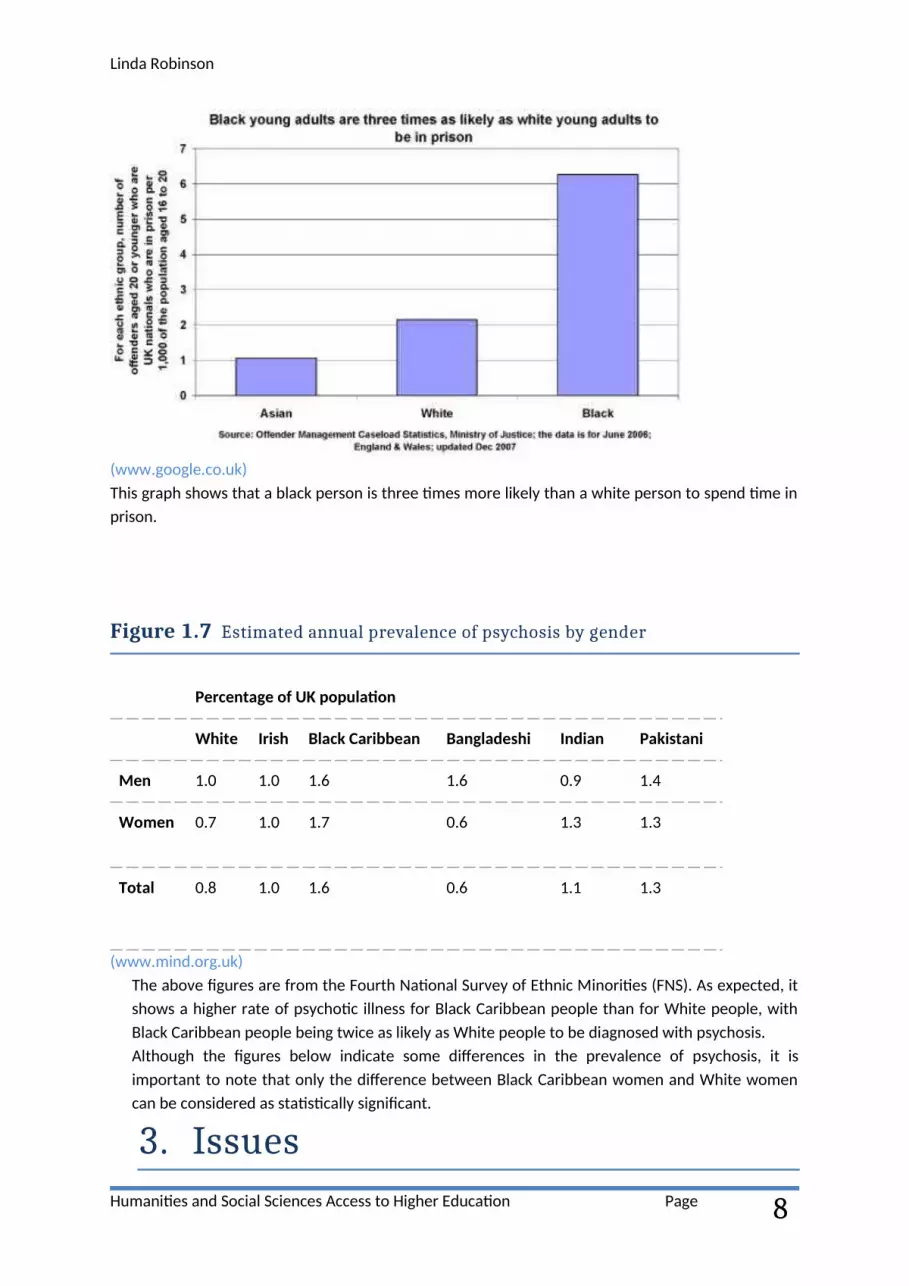
Figure 1.6 Number of 16-20 year olds who are likely to go to prison; per 1000
Humanities and Social Sciences Access to Higher Education Page
8
Linda Robinson
(www.google.co.uk)This graph shows that a black person is three times more likely than a white person to spend time in prison.
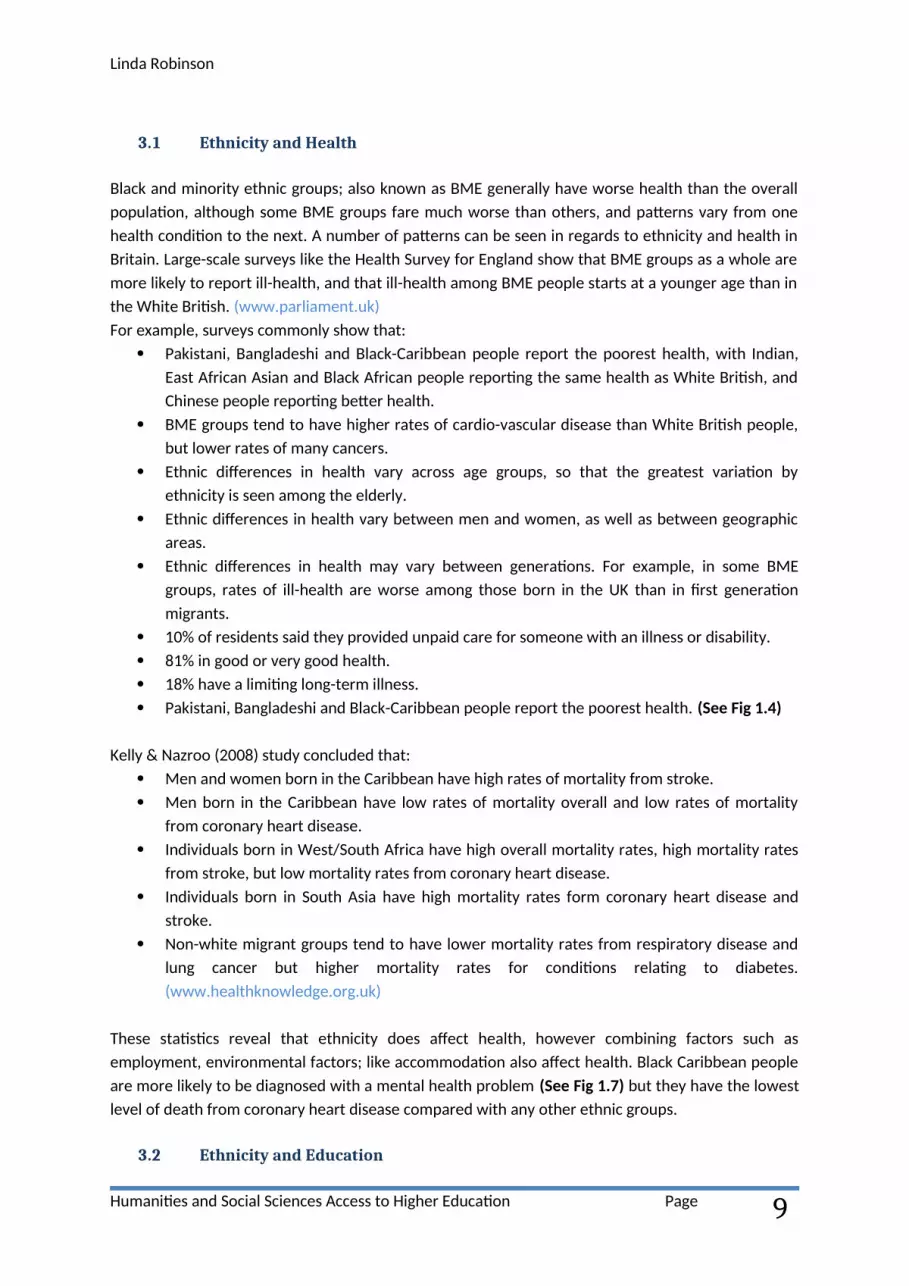
Figure 1.7 Estimated annual prevalence of psychosis by gender
Percentage of UK population
White Irish Black Caribbean Bangladeshi Indian Pakistani
Men 1.0 1.0 1.6 1.6 0.9 1.4
Women 0.7 1.0 1.7 0.6 1.3 1.3
Total 0.8 1.0 1.6 0.6 1.1 1.3
(www.mind.org.uk)The above figures are from the Fourth National Survey of Ethnic Minorities (FNS). As expected, it shows a higher rate of psychotic illness for Black Caribbean people than for White people, with Black Caribbean people being twice as likely as White people to be diagnosed with psychosis.Although the figures below indicate some differences in the prevalence of psychosis, it is important to note that only the difference between Black Caribbean women and White women can be considered as statistically significant.
3. IssuesHumanities and Social Sciences Access to Higher Education Page
9
Linda Robinson
3.1 Ethnicity and Health
Black and minority ethnic groups; also known as BME generally have worse health than the overall population, although some BME groups fare much worse than others, and patterns vary from one health condition to the next. A number of patterns can be seen in regards to ethnicity and health in Britain. Large-scale surveys like the Health Survey for England show that BME groups as a whole are more likely to report ill-health, and that ill-health among BME people starts at a younger age than in the White British. (www.parliament.uk)For example, surveys commonly show that:
Pakistani, Bangladeshi and Black-Caribbean people report the poorest health, with Indian, East African Asian and Black African people reporting the same health as White British, and Chinese people reporting better health.
BME groups tend to have higher rates of cardio-vascular disease than White British people, but lower rates of many cancers.
Ethnic differences in health vary across age groups, so that the greatest variation by ethnicity is seen among the elderly.
Ethnic differences in health vary between men and women, as well as between geographic areas.
Ethnic differences in health may vary between generations. For example, in some BME groups, rates of ill-health are worse among those born in the UK than in first generation migrants.
10% of residents said they provided unpaid care for someone with an illness or disability. 81% in good or very good health. 18% have a limiting long-term illness. Pakistani, Bangladeshi and Black-Caribbean people report the poorest health. (See Fig 1.4)
Kelly & Nazroo (2008) study concluded that: Men and women born in the Caribbean have high rates of mortality from stroke. Men born in the Caribbean have low rates of mortality overall and low rates of mortality
from coronary heart disease. Individuals born in West/South Africa have high overall mortality rates, high mortality rates
from stroke, but low mortality rates from coronary heart disease. Individuals born in South Asia have high mortality rates form coronary heart disease and
stroke. Non-white migrant groups tend to have lower mortality rates from respiratory disease and
lung cancer but higher mortality rates for conditions relating to diabetes. (www.healthknowledge.org.uk)
These statistics reveal that ethnicity does affect health, however combining factors such as employment, environmental factors; like accommodation also affect health. Black Caribbean people are more likely to be diagnosed with a mental health problem (See Fig 1.7) but they have the lowest level of death from coronary heart disease compared with any other ethnic groups.
3.2 Ethnicity and Education
Humanities and Social Sciences Access to Higher Education Page
10
Linda Robinson
The proportion of pupils achieving 5 or more A*-C grades at GCSE or equivalent including English and Mathematics GCSEs continues to vary between different ethnic groups. Education reports have revealed that the highest attaining ethnic group is Chinese whilst pupils from any Black background are the lowest achieving pupils at GCSE level. (See Fig 1.2)
Chinese pupils are the highest attaining ethnic group, with 75.1% achieving 5 or more A* to C grades at GCSE or equivalent including English and mathematics GCSEs.
55.2% of pupils whose first language is English achieved 5 or more A* to C grades at GCSE or equivalent including English and mathematics GCSEs, compared to 52.0% of pupils for whom English is not a first language.
African Caribbean and mixed race girls do significantly better than working class White pupils.
Pakistani and Bangladeshi children, especially males, do relatively poorly at school compared with White pupils, although statistical evidence suggests that they are more likely than working class children to go on into further education and higher education.
Nationally. African Caribbean children are 3.4% more likely to be excluded from school than white children.
Asian pupils are less likely to be excluded from school than White pupils.
The Swann report (1985) and the Macpherson report (1999), which recommended that the National Curriculum in schools should be adapted to reflect society by valuing cultural diversity and highlighted that institutional racism existed within the Metropolitan Police Force and that this was the cause of the poor treatment in relation to Stephen Lawrence’s murder inquiry. It also identified that poor relations between the police and ethnic groups should be improved through improved racism awareness training for officers.However the Education Reform Act (1988) ended the concept of ‘education for all’, because of a number of factors which included the newly introduced National Curriculum.Multicultural educational initiatives had no place within schools that now had to adopt a curriculum based on the concept that everyone was the same. (atschool.eduweb.co.uk)
4. Explanations
4.1. Ethnicity and Health4.1.1 Cultural Deprivation
Humanities and Social Sciences Access to Higher Education Page
11
Linda Robinson
Cultural explanations suggest that the culture of ethnic minorities is responsible for their poor mortality rates and morbidity rates. It is suggested that ethnic minorities choose to pursue a particular way of life which hinders their health.
Diet Diet is to blame for the high rates of heart disease amongst Asians as their diet tends to be high in fat content and includes a lot of high carbohydrate foods which encourage obesity. Also the lack of Vitamin D in their diet may account for the high level of rickets found amongst Asian children.
Poor EnglishMany older Asian women speak poor English which may create difficulty in taking up preventative NHS treatments such as advice, guidance and screening for cancers.
SmokingThe levels of smoking within the Asian and Black groups remain extremely high in comparison to the Whites as some Asians chew tobacco constantly and some Blacks enjoy smoking cannabis which increases the risks of respiratory diseases.
ExerciseEvidence suggests that Asian people are less likely to engage in physical exercise and sport compared to other ethnic groups; which increases the likelihood of diabetes and obesity.
Pre and post natal careAsian women are less likely to visit an ante and postnatal clinics which may explain the higher levels of infant mortality.
Asian women would prefer to see a female nurse or doctor, but due to a shortage of staff, the availability of female GP’s could affect the health of some ethnic minorities.
4.1.2 Material DeprivationMaterial explanations suggest that economic and social circumstances have more influence on health inequality than culture as ethnic minorities have little or no control over how the economy and social circumstances can affect and shape their culture.
PovertyPoverty is most likely to be experienced by ethnic minorities; 40% of ethnic minorities live in poverty in comparison to the White community, poverty also leads to housing inequalities as 70% of ethnic minorities live in Council properties which are badly maintained which may lead too illness and time off school which could hinder the parents and children’s future.
EmploymentEthnic minority poverty is caused by the fact that ethnic minorities are more likely to be found in low paid and low skilled jobs which sometimes includes dangerous work over long periods of tie which increase the risk of accidents and stress related illnesses. (See Fig 1.5)
RacismAnother major factor that increases the possibility of illness and early death is the experience of racism which includes discrimination, racially motivated attacks and harassment. All the above experiences of abuse may increase stress, anxiety and fear which all can result in ill health and sometimes death; Stephen Lawrence.
Humanities and Social Sciences Access to Higher Education Page
12
Linda Robinson
4.1.3 Social Constructionist ViewThe idea of the social construction of the illness experience is based on the concept of reality as a social construction. In other words, there is no objective reality; there are only our own perceptions of it. In terms of constructing the illness experience, culture and individual personality both play a significant role. For some people, a long-term illness can have the effect of making their world smaller, more defined by the illness than anything else. Conrad and Barker (2007) suggested that for others, illness can be a chance for discovery, for re-imaging a new self. Culture plays a huge role in how an individual experiences illness.For example Rastafarians are more likely to be diagnosed as mentally ill as doctors can misinterpret their beliefs and traditions, furthermore the lack of cooperation with the ‘White’ authorities due to their religious views that ‘White Society’ was responsible for enslaving their African ancestors. Nazroo (2001), argues that ‘…the price they pay for non-cooperation is being remanded to psychiatric units for reports, he argues that is not a scientific diagnosis; rather it is a form of white social control.Additionally there is evidence that on-going lack of non- cooperation leads to greater controls over Afro-Caribbean’s inside the system through drugs and ECT. (See Fig 1.7)
4.1.4 Psycho-social ExplanationSome studies have suggested that a ‘health gradient’ exists; in that at every level of social hierarchy, there are health differences. Wilkinson (2009) suggested that those who are low in this socio-economic hierarchy, like some ethnic minorities have less social control over their working and living conditions, consequently they have greater feelings of stress and greater feelings of low self-esteem.The difference in experience between the different groups undermines social cohesion which in turn hinders integration of different cultures between the ethnic minorities and ethnic majority. Due to the hierarchy and lack of social cohesion may trigger off psycho-social behaviour such as smoking, overeating; poor eating, drinking, which produces greater levels of depression, high blood pressure and susceptibility to diseases and infections. (See Fig 1.4) 4.1.5 The Inverse Care Law
Despite the NHS being one of the most famous and needed institutions in the UK, research suggests that areas in need of specialist help are have less NHS funding and specialist hospitals as ethnic minorities tend to reside in the inner cities where there is a high concentration of ethnic minorities. The NHS has been accused of being ‘institutionally racist’ as it mainly focuses on the needs of the majority which are members of the ‘White’ populous.Furthermore it has been suggested that ethnic minorities may be put off from seeking medical help because some are not guaranteed to see a female doctor, also the religious and dietary needs may not be taken into consideration because of ignorance or lack of knowledge, additionally many media and medical campaigns; such as antismoking, domestic violence cancer are rarely aimed at ethnic minorities.
4.2 Ethnicity and Education4.2.1 Cultural Deprivation
Humanities and Social Sciences Access to Higher Education Page
13
Linda Robinson
Explanations influenced by cultural deprivation suggest that educational success and failure is determined by culture and the aspects of that certain ethnic minority. For instance it is argued that there is a string emphasis on self-improvement in Indian and Chinese culture. Some say that the male African-Caribbean underachievement and exclusion is caused by the lack of a male role model. Although this explanation makes some valid points about the need for cultural enrichment in children’s lives it fails to take into account the fact that individuals may have issues and issue of single parentage; or lack of interest from parents can be found in any ethnic group and therefore this is an ethnocentric argument, built on stereotypes and schemas.
4.2.2 Material DeprivationAccording to the Poverty Sit website’, around 2/5 of people from an ethnic minority lives in low-income households, twice the rate for White people. (See Fig 1.5)Within this, there are big variations by ethnic group. More specifically, the proportion of people who live in low-income households is; 20% for White people, 30% for Indians and Black Caribbean’s, 50% for Black Africans, 60% for Pakistanis and 70% for Bangladeshis. The way that poverty can be measured is by the eligibility of free school meals. The fact that these ethnic groups are more likely to be poor is the reason for the lack of educational attainment rather than their actual ethnicity.Whatever their ethnic group, a child without an adequate place to study or the funds for school supplies may not have the same opportunities as children from a more affluent background, also many of these children may have to take on the role of carer or have to work to help their family; which may hinder them during the school day.However a number of studies suggest that girls perform better at all levels than African-Caribbean boys, the fact that girls maybe less affected by being raised by a single parent as they have the Mother a s a role model, whereas the boys are lacking a male role model if the Father is absent.
4.2.3 In-school FactorsIn school factors also play a part in the educational attainment of ethnic minorities, Interactionists have examined and observed classroom interaction between a predominantly white teaching profession and pupils from ethnic backgrounds. They suggest that teachers already have negative expectations and attach negative labels to members of an ethnic minority group.
Wright’s 1986 study of secondary schools focussed on the interaction between teachers and Afro-Caribbean students, which was often characterised by confrontation and conflict. The outcome was that Afro-Caribbean students were placed in academic bands and exam sets that did not reflect their academic ability. This may result in bright children being left behind and not using their full potential to succeed at school because of teacher’s inability to communicate and interact with some Black students. In a later study in 1992, Wright found that staff in multiracial schools researched was committed to the idea of educational opportunity. But, some assumptions they held led to some black children being 'racialised'. That is, these children were unintentionally discriminated against because teachers held beliefs about 'racial' attributes. For instance, Asian girls were seen as quiet
Humanities and Social Sciences Access to Higher Education Page
14
Linda Robinson
and submissive and this rendered them 'invisible' in class, meanwhile Afro-Caribbean’s were seen as behaviourally problematic and of low academic potential which resulted in conflict with teachers.Gillborn’s (1990) study found like Wright (1992) that teachers unintentionally penalised Afro-Caribbean students because of their preconceptions. The students were treated differently because they were perceived as different. The result was more conflict with teachers; which may eventually result in detention or expulsion. (See Fig 1.3) (www.s-cool.co.uk)Additionally because teachers have low expectations of these pupils from ethnic minorities, some children internalise the low expectations that teachers have of them, which may result in exclusion as some pupils become disaffected by the treatment they receive. This disaffection they suffer may explain the need to be part of a racially exclusive subculture in order to feel like they belong. Some racially exclusive subcultures are sometimes based on a distinct style of dress, musical taste, slang and an overt opposition to authority and resistance towards schools and teachers. Sewell (2010) suggested that a negative experience of education especially when combined with poor job prospects and perceived police harassment has produced a street gang culture organised around opposition to education, respect is based on a distorted view of masculinity like initiations paired with a casual view towards violence. (See Fig 1.2, 1.5, 1.6)
4.2.4 Institutional RacismDiscrimination in schools in not always obvious and intentional, The Swann Report (1986) argued that ‘…the curriculum in schools is ethnocentric, meaning that knowledge, teaching methods and the way children are assessed are in favour of ‘White, Christian, English vision of things..’ Also the hidden curriculum that is taught to children is saturated in institutional racism, for example, the history, science and literature taught is mostly based on the British idea of society and history for example the Black history that is taught at school is mostly about Christopher Columbus and a little bit of slave trade history; the lack of black role models in history lesson highlights the ethnocentricity of the hidden curriculum.Despite the qualitative and quantitative evidence produced by Gilborn and Mizra (2000), Tikly (2006) and The Swann Report, it is unlikely that institutional racism is solely to blame for the educational underachievement of ethnic minority groups as it is hard to explain why such issues like institutional racism seem to have little effect on the excellent attainment levels of Indian or Chinese pupils. (See Fig 1.2)
4.2.5 Marxist Explanation
Due to the awareness that many young African Caribbean boys have of the racial discrimination, prejudice and inequality in schools, they intentionally reject school as they think there is no point and follow a life of crime in order to succeed as they feel it is the only option. (See Fig 1.6)
An observer sociological study of African Caribbean boys at St Paul’s, ‘Endless Pressure’, by black Jamaican academic Ken Pryce published in 1979, categorizes the West Indian inhabitants of St Paul’s into five groups: hustlers, teeny- boppers, proletarian respectable, the saved and the in-
Humanities and Social Sciences Access to Higher Education Page
15
Linda Robinson
betweeners, thought the essential distinction he makes is between “those who work and those who hustle”. (www.ukessays.com)He found a variety of subcultures in the West Indian community, split between two main types of response to life in Britain; the expressive-disreputable orientation involved rejection of a white society that was perceived as hostile and racist, and the stable, law-abiding orientation involved acceptance or at least grudging toleration of white society.Pryce’s study shows how ethnic groups can develop different subcultures resulting from different responses to racism and exploitation. The more politically aware young West Indians are more likely to continue a tradition of anti-colonial struggle which started in the Caribbean. (snations-soc.tripod.com)From this perspective, Pryce suggests that black boys are not passive victims of institutional racism or teacher labelling but it is because they choose to resist these processes and substitute their own setoff values and goals based on street experience like, drug dealing, sound systems, blues parties and the selling of illegal goods. (See Fig 1.1, 1.5, 1.6)
5. Bibliographyhttp://www.guardian.co.uk/uk/blog/2012/dec/11/census-data-released-live-coverageAccessed 20.05.13
https://www.google.co.uk/url?sa=i&rct=j&q=&esrc=s&source=images&cd=&cad=rja&docid=D3K5lE4mv4JGQM&tbnid=kNWswDTK5ADt3M:&ved=0CAQQjB0&url=http%3A%2F%2Fwww.ons.gov.uk%2Fons%2Frel%2Fcensus%2F2011-census%2Fkey-statistics-for-local-authorities-in-england-and-wales%2Frpt-ethnicity.html&ei=T4-
Humanities and Social Sciences Access to Higher Education Page
16
Linda Robinson
eUYqUGOGX0AXx9IGwDQ&bvm=bv.47008514,d.d2k&psig=AFQjCNF5yz-95I7JzXugTSOvqfdt3_STyQ&ust=1369432138109528Accessed 20.05.13
http://www.britishgerontology.org/DB/gr-editions-2/generations-review/health-inequalities-amongst-older-people-from-ethn.htmlAccessed 20.05.13
http://www.ukessays.com/essays/music/impact-of-the-jamaican-diaspora-music-essay.phpAccessed 21.05.13
http://www.parliament.uk/documents/post/postpn276.pdfAccessed 21.05.13
https://www.google.co.uk/url?sa=i&rct=j&q=&esrc=s&source=images&cd=&docid=YjmB-yGHU1eQEM&tbnid=A9agJ4ZGg4mnPM:&ved=0CAQQjB0&url=http%3A%2F%2Ffilipspagnoli.wordpress.com%2Fstats-on-human-rights%2Fstatistics-on-freedom%2Fstatistics-on-prisoner-population-rates%2F&ei=M2OjUfroFuii0QXy6IHADg&bvm=bv.47008514,d.d2k&psig=AFQjCNGpaf4EI7b-OpMD38muH39A1-6C3Q&ust=1369748621474282Accessed 22.05.13
http://www.healthknowledge.org.uk/public-health-textbook/medical-sociology-policy-economics/4c-equality-equity-policy/inequalities-distributionAccessed 22.05.13
http://snations-soc.tripod.com/sitebuildercontent/sitebuilderfiles/raceandethnicityunit3.3.htmAccessed 26.05.13
http://atschool.eduweb.co.uk/barrycomp/bhs/alevel_rev/pdf_files/ethnicity.pdfAccessed 26.05.13
https://www.google.co.uk/url?sa=i&rct=j&q=&esrc=s&source=images&cd=&cad=rja&docid=TNAsA-tjezrxiM&tbnid=S3zsWUFNnWR6DM:&ved=0CAQQjB0&url=http%3A%2F%2Fwebarchive.nationalarchives.gov.uk%2F20100406130654%2Fstatistics.gov.uk%2Fhub%2Fcross-cutting-topics%2Fequality-anddiversity%2Findex.html&ei=xVSjUdj6A8Sm0wWWxIDIDw&psig=AFQjCNHlluXdQK6bRysCrG6PHAS66aUTcQ&ust=1369744849554955Accessed 27.05.13
https://www.google.co.uk/url?sa=i&rct=j&q=&esrc=s&source=images&cd=&cad=rja&docid=lMn6VxbYbwgWTM&tbnid=HowGw1O
Humanities and Social Sciences Access to Higher Education Page
17
Linda Robinson
p3lSUsM:&ved=0CAQQjB0&url=http%3A%2F%2Fwww.poverty.org.uk%2F55%2Findex.shtml&ei=rlejUaiBEYaY0AX03oGYCg&psig=AFQjCNHlluXdQK6bRysCrG6PHAS66aUTcQ&ust=1369744849554955Accessed 27.05.13
http://www.s-cool.co.uk/a-level/sociology/inequalities/revise-it/ethnicityAccessed 27.05.13
Humanities and Social Sciences Access to Higher Education Page